Article

Assessment of Groundwater Quality and Pollution in the Songnen Plain of Jilin Province, Northeast China

1
Changchun Institute of Technology, College of Jilin Emergency Management, Changchun 130012, China
2
Changchun Institute of Technology, College of Surveying and Mapping Engineering, Changchun 130021, China
3
Institute of Natural Disaster Research, School of Environment, Northeast Normal University, Changchun 130024, China
*
Author to whom correspondence should be addressed.
Water 2021, 13(17), 2414; https://doi.org/10.3390/w13172414
Submission received: 11 August 2021 / Revised: 27 August 2021 / Accepted: 30 August 2021 / Published: 2 September 2021

Abstract

:
Clean groundwater resources are vital to human health. To evaluate groundwater quality in the Songnen Plain (Jilin), a field investigation sampling test, multivariate statistical analysis, and spatial analysis were conducted based on a geographic information system. The main substances exceeding the standard were screened out, and the main controlling factors affecting groundwater quality were discussed. The research result showed that nine components exceeded groundwater standards by approximately 10%: Al, total hardness (TH), total dissolved solids (TDS), Mn, As, NO3, Fe, F, and BaP. The over-standard of TDS and TH in groundwater are mainly distributed in the geological environment conditions and unreasonable exploitation and utilization of groundwater in this area. The results of the multi-index evaluation showed that the most important factors affecting groundwater quality were general chemical indices, followed by inorganic toxicology and heavy metals. Controlling the overexploitation of water resources, controlling agricultural activities and sewage discharge, and implementing water conservation systems are the main pathways to improve water quality in the study area. The research results can provide a reference for groundwater pollution control and water resource protection in the Songnen Plain (Jilin).

1. Introduction

Water is a crucial environmental component that plays an important role in human life. Groundwater is a critical drinking water resource in China [1]. In many regions worldwide, underground wells are the major source of drinking water, and sometimes, the groundwater is not purified before use [2,3,4]. In recent decades, the rapid acceleration of economic development and the increase in population have adversely affected the quantity and quality of groundwater at a global scale [5,6,7]. The composition of groundwater is determined by its interactions in the hydrological cycle. Such interactions may result in the chemical activity in groundwater from undesired constituents, thereby affecting water quality [8,9,10,11,12,13]. Groundwater pollution not only increases the cost of water treatment, but also further exacerbates the problem of water shortage. The attention to groundwater has expanded from the quantity of groundwater to the quality of groundwater, because water quality affects water safety and human health [14,15,16]. However, due to environmental changes and human activities, groundwater quality has been deteriorating at an alarming rate for a long time, posing significant health risks to groundwater users. Many scholars have conducted research on methods to prevent groundwater from being polluted, such as permeable pavement systems, green systems, low impact developments, etc. Among them, the pavement permeable system is one of the hot areas of current research, but this technology has not been widely used in China. The problem of groundwater pollution is still severe, so it is necessary to investigate groundwater quality, which can provide useful information for the sustainable management of water resources in social and economic development [17,18,19,20,21].
The main environmental problems caused by the exploitation of groundwater resources include the potential harm of pollution factors to human health and crop growth [22]. Water quality standards are graded based on designated uses, including public water supply, fish and wildlife habitat, recreation, agriculture, and industry. For example, water quality standards for drinking water are higher than those for agriculture and industry [23,24,25,26,27]. When a waterbody does not meet the relevant water quality criteria, it is known to be impaired and poses a threat to human health and ecological integrity [28,29,30].
The Songnen Plain is a densely populated and water-deficient inland area of China, and it is one of the most significantly altered biological hotspots on Earth [31,32]. Groundwater provides approximately 40% of the water supply for agriculture, industry, and municipal use in this area [33]; the Songnen Plain (Jilin Province) is an important base for grain commodities as well as light and heavy industrial development zones, which require a good quality of water for drinking, irrigation, and industrial uses. According to previous studies, groundwater resources have declined over the past 20 years due to intensive human activities and natural processes in this area [34,35]. Excessive and continuous groundwater exploitation and mismanagement have led to groundwater depressions and extensive secondary salinization in this region. The unregulated use of pesticides and fertilizers has also accelerated the migration of harmful elements and the spread of pollutants in this region [36,37,38]. Agriculture plays an important role in the emergence of diffuse nitrate pollution. On the one hand, direct effects of nitrogen (N) over-fertilization involve a decrease in water quality, defined as the excess of the mineral N balance at harvest, because of the low water temperature, low microbial content, weak activity, and no direct sunlight of groundwater environment, while when agricultural pesticides are applied into the soil underground layer, its degradation rate is slower than surface water. Once the groundwater is contaminated by pesticide, it is difficult to control and recover or even cannot be restored, which will affect the quality of groundwater. These factors increase the growth of crops, threatening the health of local people and inhabitants [39].
In this study, we analyzed a wide range of groundwater samples from the entire region. The aims of this study were as follows. This research will help local policymakers protect groundwater quality and reduce pollution risks.
  • To analyze the present situation of groundwater pollution index and the distribution of pollution levels in the groundwater.
  • To explore the characteristics of the physico-chemical elements of groundwater and assess its suitability for drinking and irrigation purposes.
  • To assess the state of pollution by using various pollution assessment methods.
The results of the present study will offer useful tools for groundwater quality assessment. In addition, they are expected to help local decision-makers protect the quality of the groundwater, to support the water environmental protection and water resource management of the study area.

2. Materials and Methods
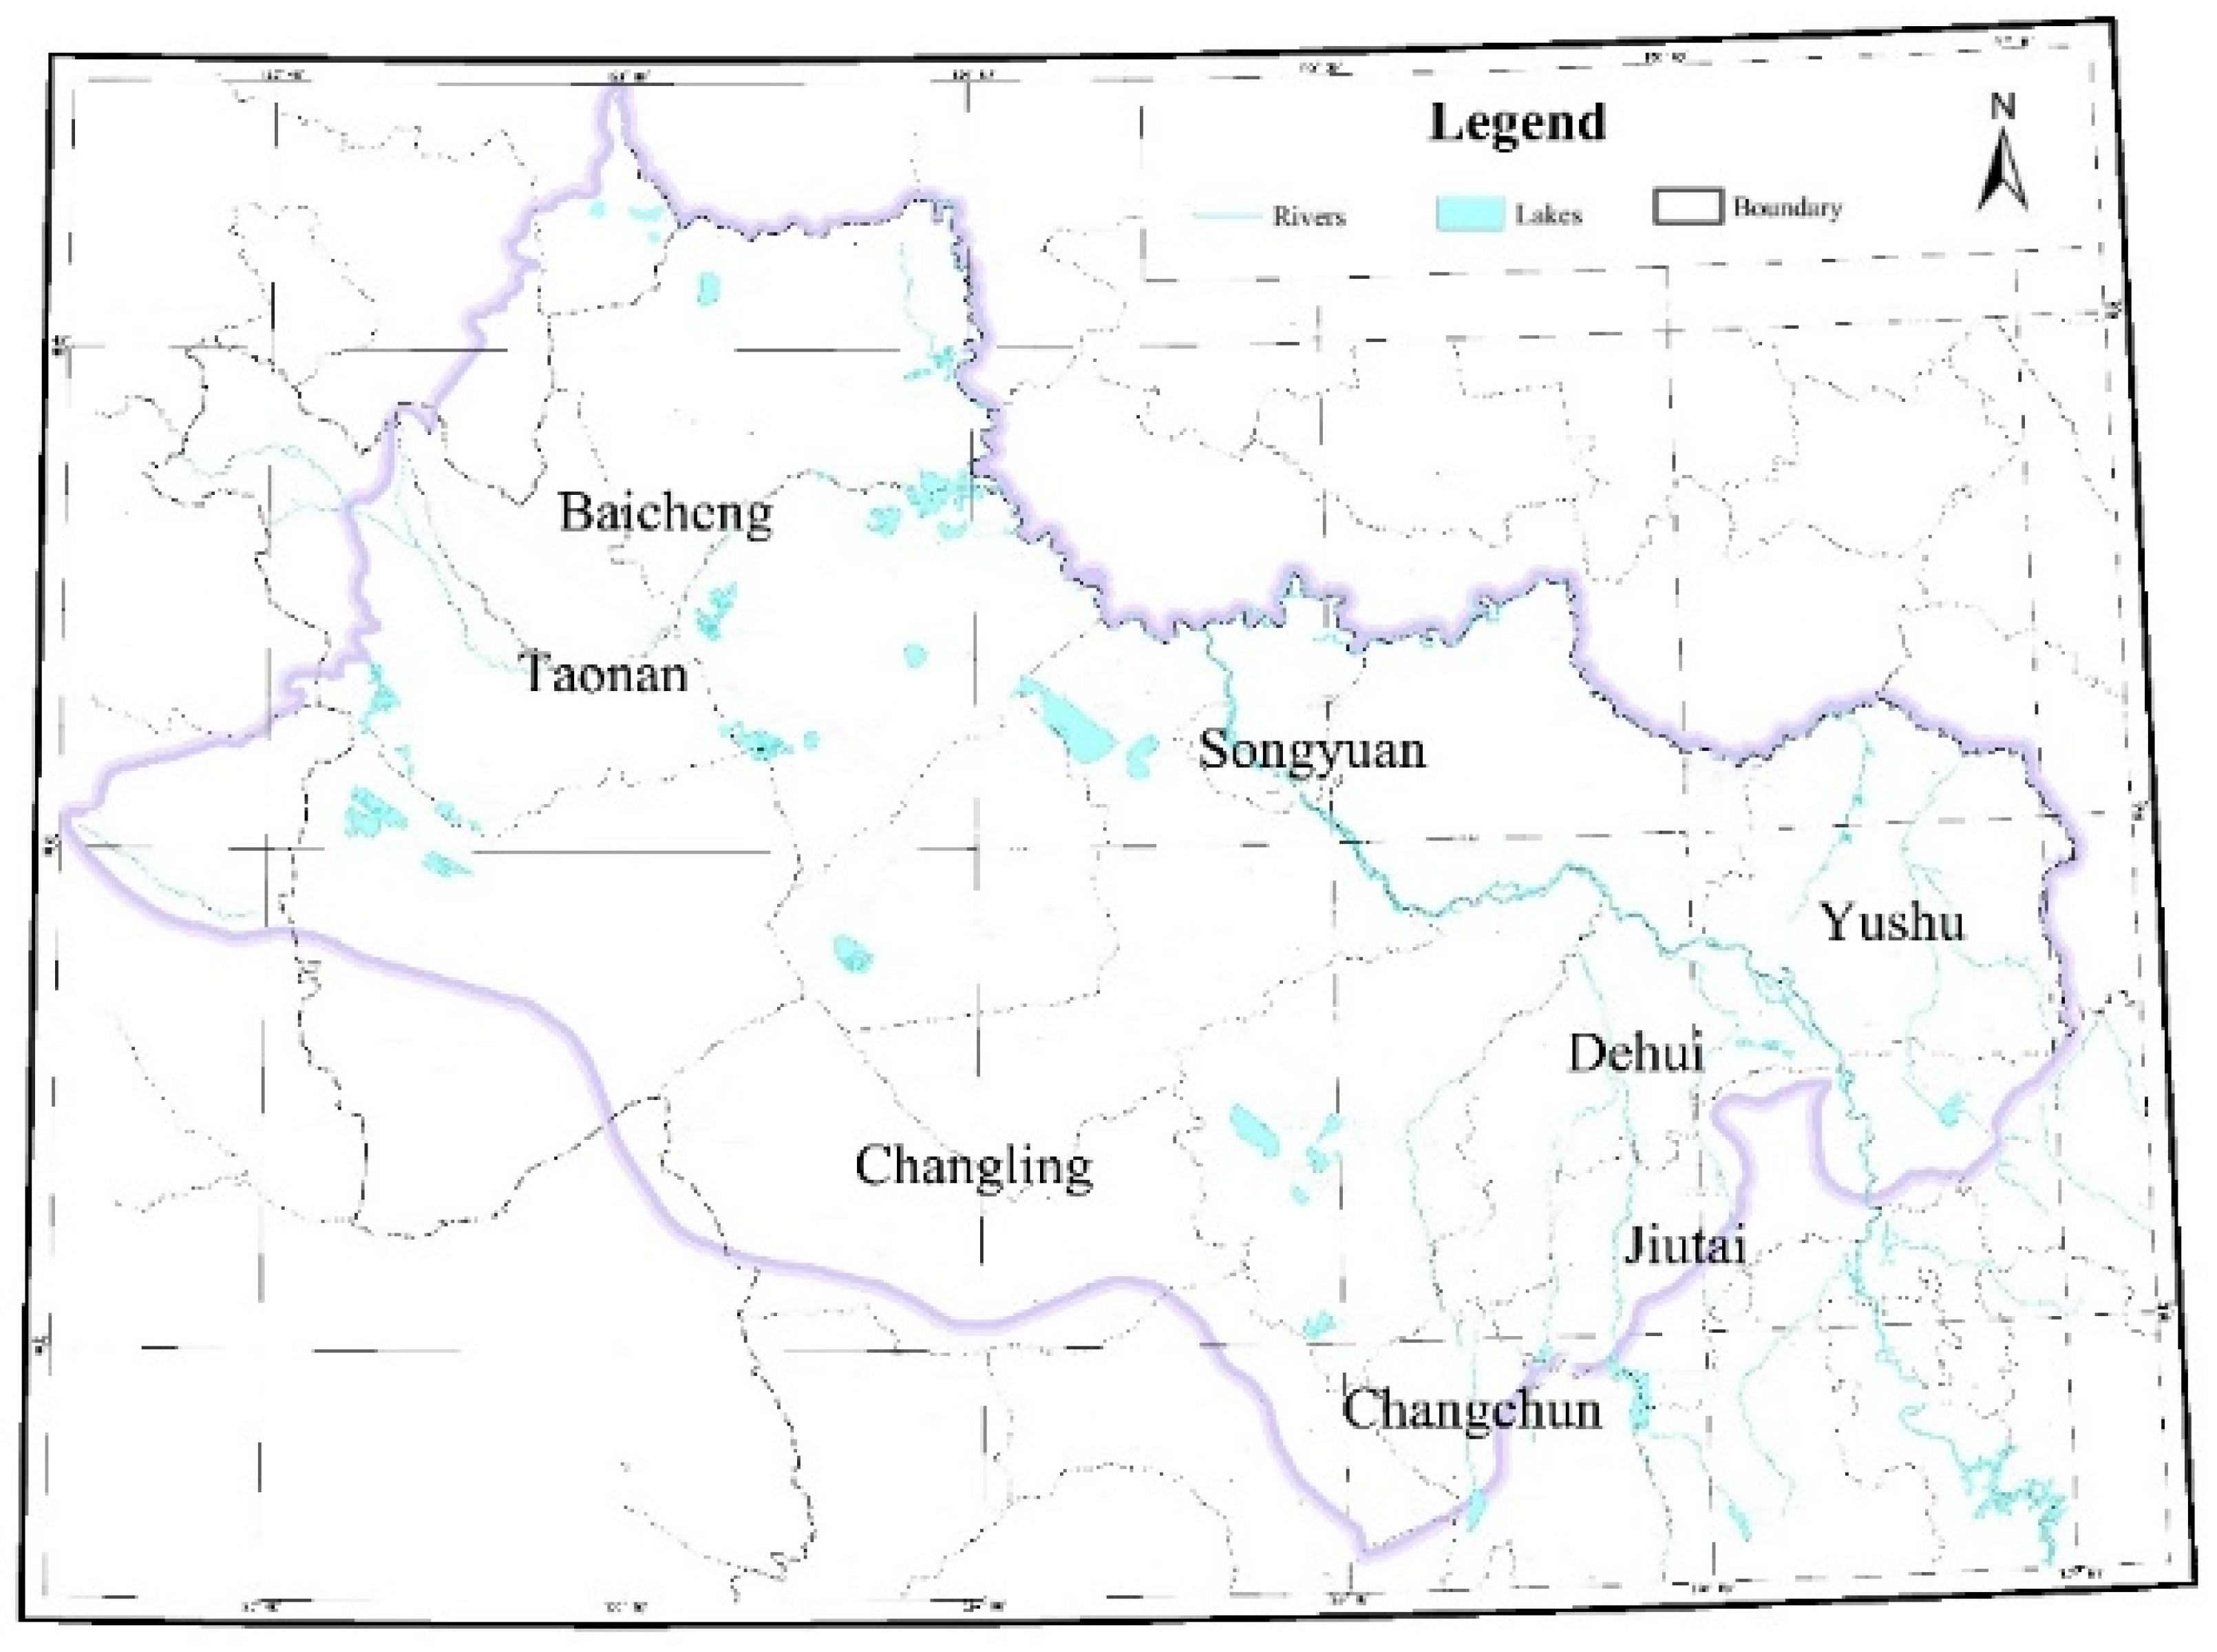
2.1. Study Area

The Songnen Plain (Jilin) is located in the middle western part of Jilin Province, with geographical coordinates of 121°2056″–127°0900″ E and 43°3355″–46°2848″ N. The study area covers an area of approximately 63,374.73 km2 (Figure 1). The location map was drawn using ArcGIS 10.2 (Environmental Systems Research Institute, Inc., Redlands, CA, USA). Topographically, it is high in the south, east, and west and lower in the middle and north, with an overall elevation of 120–300 m. This area has a temperate continental monsoon climate with semi-humid and semi-arid characteristics. The weather is less rainy and dry in the spring and hot, wet, and rainy in the summer. It is cool and has early frost in the autumn; however, it is cold, being long, and freezing in the winter, and there is a large difference in temperature during the year. The average annual temperature is 4.9–5.5 °C [40]. The mean annual precipitation ranges from 206.3 to 799.6 mm, with precipitation from June to September accounting for 60–80% of the annual precipitation. Groundwater is generally stored in the pores of loose rocks in quaternary alluvial aquifers. Groundwater recharge mainly depends on meteoric precipitation and surface water. In the past few decades, agricultural, domestic, and industrial effluent discharges have also become a source of groundwater recharge [41,42,43,44].

2.2. Groundwater Sampling and Analysis

To accurately and comprehensively reflect groundwater pollution, groundwater samples (n = 465) were collected according to different groundwater flow systems, geomorphological units, and human activity types. Groundwater samples were collected using pre-cleaned sampling bottles of 1 L capacity from hand pumps and tube wells. Prior to the sampling, tube wells and hand pumps were purged by about 10 minutes of pumping, and sampling bottles were rinsed using the same water thrice. The coordinate information of each sampling point was recorded by a handheld GPS locator (UniStrong MG8, Beijing, China). The collection, transportation, and storage of groundwater samples were completed according to the standard methods described in the technical specifications for environmental monitoring of groundwater (HJ/T164-2004) [45]. Samples were then transported to the laboratory and stored at 4 °C until analysis. All water samples were processed within one week. Before the chemical analysis of groundwater samples, all the used glassware was cleaned using dilute nitric acid along with distilled water.
General parameters, such as water temperature, pH, and total dissolved solids (TDS) were measured using a previously calibrated water quality analyzer (HQ40D, HACH). The total hardness (TH) was determined based on CaCO3 content. The other groundwater quality parameters for analysis included COD, NO3, NH4+, SO42−, NO2, Cl, F, Na2+, Fe, Mn, Pb, Zn, Cr6+, Cd, As, Hg, Se, Al, Cu, cyanide, trichloro-methane, tetrachloromethane, 1, 1, 1-trichloroethane, trichloroethylene, tetrachloro-ethylene, dichloromethane, 1, 2- dichloroethane, bromoform, chloroethylene, 1, 1-dichloroethylene, 1, 2-dichloroethylene, chlorobenzene, trichlorobenzene, benzene, methylbenzene, ethylbenzene, xylene, styrene, hexachlorocyclohexane (HCH), γ-BHC, dichlorodiphenyltrichloroethane (DDT), hexachlorobenzene, and benzo (a) pyrene (BaP). These chemical parameters of groundwater quality were analyzed at the Key Laboratory of Groundwater Resources and Environment, Ministry of Education, Jilin University within 24 h. COD was measured using permanganate titration. NH4+ was measured by the Neelers reagent method at a 420 nm wavelength using a UV-Vis spectrophotometer. NO3, SO42−, NO2, Cl, and F were analyzed with an ion chromatography. Na2+, Fe, Mn, Pb, Zn, Cr6+, Cd, As, Hg, Se, Al, and Cu were analyzed with the atomic absorption spectrometry, inductively coupled plasma mass spectrometry and atomic fluorescence spectrometry. The indexes of organic pollution were measured by the GC, GC-MS-MS, and HPLC, respectively. The analysis method of each indicator is mentioned in the Quality Standard for Groundwater (GB/T 14848-2017), and for each sampling point to refer to the standard limits of the five types of water in the Quality Standard for Groundwater (GB/T 14848-2017) [46]. Sample blanks, duplicates and standards were routinely analyzed to ensure the quality control of analytical data. All mathematical and statistical computations were performed using the IBM SPSS version 19 (International Business Machines Corporation, Armonk, NY, USA).

2.3. Groundwater Quality Assessment

2.3.1. Groundwater Pollution Index

Groundwater quality was divided into five categories according to the quality standard for ground water (GB/T 14848-2017) (Table 1). The five degrees of water shortage risk in the study area include good (I), fine (II), ordinary (III), poor (IV), and bad (V). The degree of groundwater quality in the study area was determined according to the limit range of the index value. The single index for the groundwater quality calculation method is as follows:
S i j = C i j C s i
where S i j is the standard exponent of the parameter i at point j, C i j is the average value of parameter i at point j, C s i is the groundwater quality standard for contaminant i.

2.3.2. Multi-Index Classification of Groundwater

The inorganic indexes were divided into four categories, and the organic indexes were divided into two categories for water quality evaluation, yielding the following: the general chemical index, inorganic toxicology index, "three nitrogen" index, toxic heavy metal index, volatile organic index, and semi-volatile organic index (Table 2).

2.3.3. Fuzzy Comprehensive Evaluation

The fuzzy comprehensive evaluation method is a common method for the comprehensive evaluation of water quality. It is based on fuzzy mathematics and uses the principle of fuzzy relation synthesis to deal with the phenomenon of “fuzzy” information, and some uncertain factors are quantified for comprehensive evaluation [47,48]. The implementation of the method consists of the following steps.
Firstly, the established factor subsets and evaluation language should be set:
Let the number of sample sets of water quality evaluation be denoted by n, consider the pollution indicators that affect water quality, and establish a set of evaluation factors:
A = { a 1 ,   a 2 , a n }
where a is the sample set of water quality evaluation.
Then, according to the quality standard for groundwater (GB/T 14848-2017), an evaluation set is established:
V = { I ,   II ,   III ,   IV ,   V }
Secondly, a fuzzy relationship matrix should be established:
The membership function is the foundation of a comprehensive fuzzy evaluation. The “reduced half trapezoidal stepwise method” is usually used to calculate the membership function. According to the Quality Standard for Ground Water (GB/T 14848-2017), groundwater is divided into five classes. The formula for the grade of water quality membership is as follows:
Degree I:
r i 1 = { 0                                                                 x i > S i 2 S i 2 x i S i 2 S i 1                         S i 1 < x i S i 2 1                                                                 x i S i 1
Degrees II–IV:
r i j = { 1 S i j x i S i j S i ( j 1 )                                 S i ( j 1 ) x i S i j     0                                                           x i S i ( j 1 ) , x i > S i ( j + 1 ) S i ( j + 1 ) x i S i ( j + 1 ) S i j                                                 S i j < x i < S i ( j + 1 )
Degree V:
r i j = { 0                                                                                   x i S i 4 1 S i 5 x i S i 5 S i 4                           S i 4 < x i < S i 5 1                                                                                     x i S i 5
where x i is the measured concentration of the i -th evaluation index, S i j is the j -level standard value of the i -th evaluation index, and r i j is the membership degree of the i -level evaluation index to the j -level water quality.
The fuzzy relation evaluation matrix U can be determined from the membership function established as follows:
U = [ u 11 u 12 u 13 u 21 u 22 u 23 u 14 u 15 u 24 u 25 u n 1 u n 2 u n 3 u n 4 u n 5 ]
Thirdly, the weight coefficient matrix should be determined:
Different factors have different influences on water quality; therefore, it is necessary to calculate the weight of each factor to make the evaluation model more scientific. The steps to determine the entropy weight coefficient are as follows.
The measured data were standardized. The data consist of n evaluation indexes and m evaluation objects that form a W matrix:
X = [ x 11 x 12 x 1 m   x n 1 x n 1 x n m ]
Use the formula:
y i j = m a x { x i j } x i j m a x { x i j } m i n { x i j }
Standardize and get the judgment matrix Y:
Y = [ y 11 y 12 y 1 m   y n 1 y n 1 y n m ]
The formula of entropy weight is:
w e i = 1 H i n i = 1 n H i
In the formula:
H = j = 1 m f i j ln f i j ln m ,   f i j = ( 1 + y i j ) / j = 1 m ( 1 + y i j )
Fourthly, comprehensive evaluation results should be calculated:
The purpose of fuzzy comprehensive evaluation is to evaluate the impact of all indicators on the water body, obtain comprehensive and accurate evaluation results, and determine the water quality grade. W and R fuzzy matrices are used for composite operation, namely:
B = W × R
Results B of the composite operation is the membership degree of each water sample concerning the water quality at different levels of quality, among which the grade of the highest membership degree is the water quality grade of the water sample.
Maps of multi-indicator and comprehensive quality evaluation were created using ordinary kriging. The spatial analysis and maps occurred using ArcGIS 10.2 (Environmental Systems Research Institute, Inc., Redlands, CA, USA).

3. Results

The evaluation results of the physicochemical elements are listed in Table 3. The data variance reflects the basic features of contaminants in the study area. Groundwater samples of the single parameter in the study area belonged to classes I–III, but part of the indicators belong to classes IV and V, accounting for a higher proportion of more than 10%, including Al, TH, TDS, Mn, As, NO3, Fe, F, and BaP, indicating that these concentrations are not suitable for drinking water. 1, 1, 1-Trichloroethane, tetrachloroethylene, bromoform, chloroethylene, 1, 1-Dichloroethylene, 1, 2-Dichloroethylene, chlorobenzene, trichlorobenzene, ethylbenzene, and styrene were not detected in the study area.
Groundwater quality was evaluated using the general chemical, inorganic toxicology, "three nitrogen", toxic heavy metal, volatile organic, and semi-volatile organic indexes, and classified according to inorganic routine chemical indexes. The results were shown in Figure 2 and Table 4.
Evaluate the general chemical index of groundwater in the study area, the results show that class II water covers an area of 2589.77 km2, accounting for 4.09% of the total area, class III water covers an area of 8096.81 km2, accounting for 12.78% of the total area, class IV water covers an area of 39,547.62 km2, accounting for 62.41% of the total area, and class V water covers an area of 13,138.04 km2, accounting for 20.73% of the total area. After the general chemical index evaluation of groundwater, the results were good, and the groundwater was predominantly categorized into classes II and III, which appear to be suitable for drinking.

4. Discussion

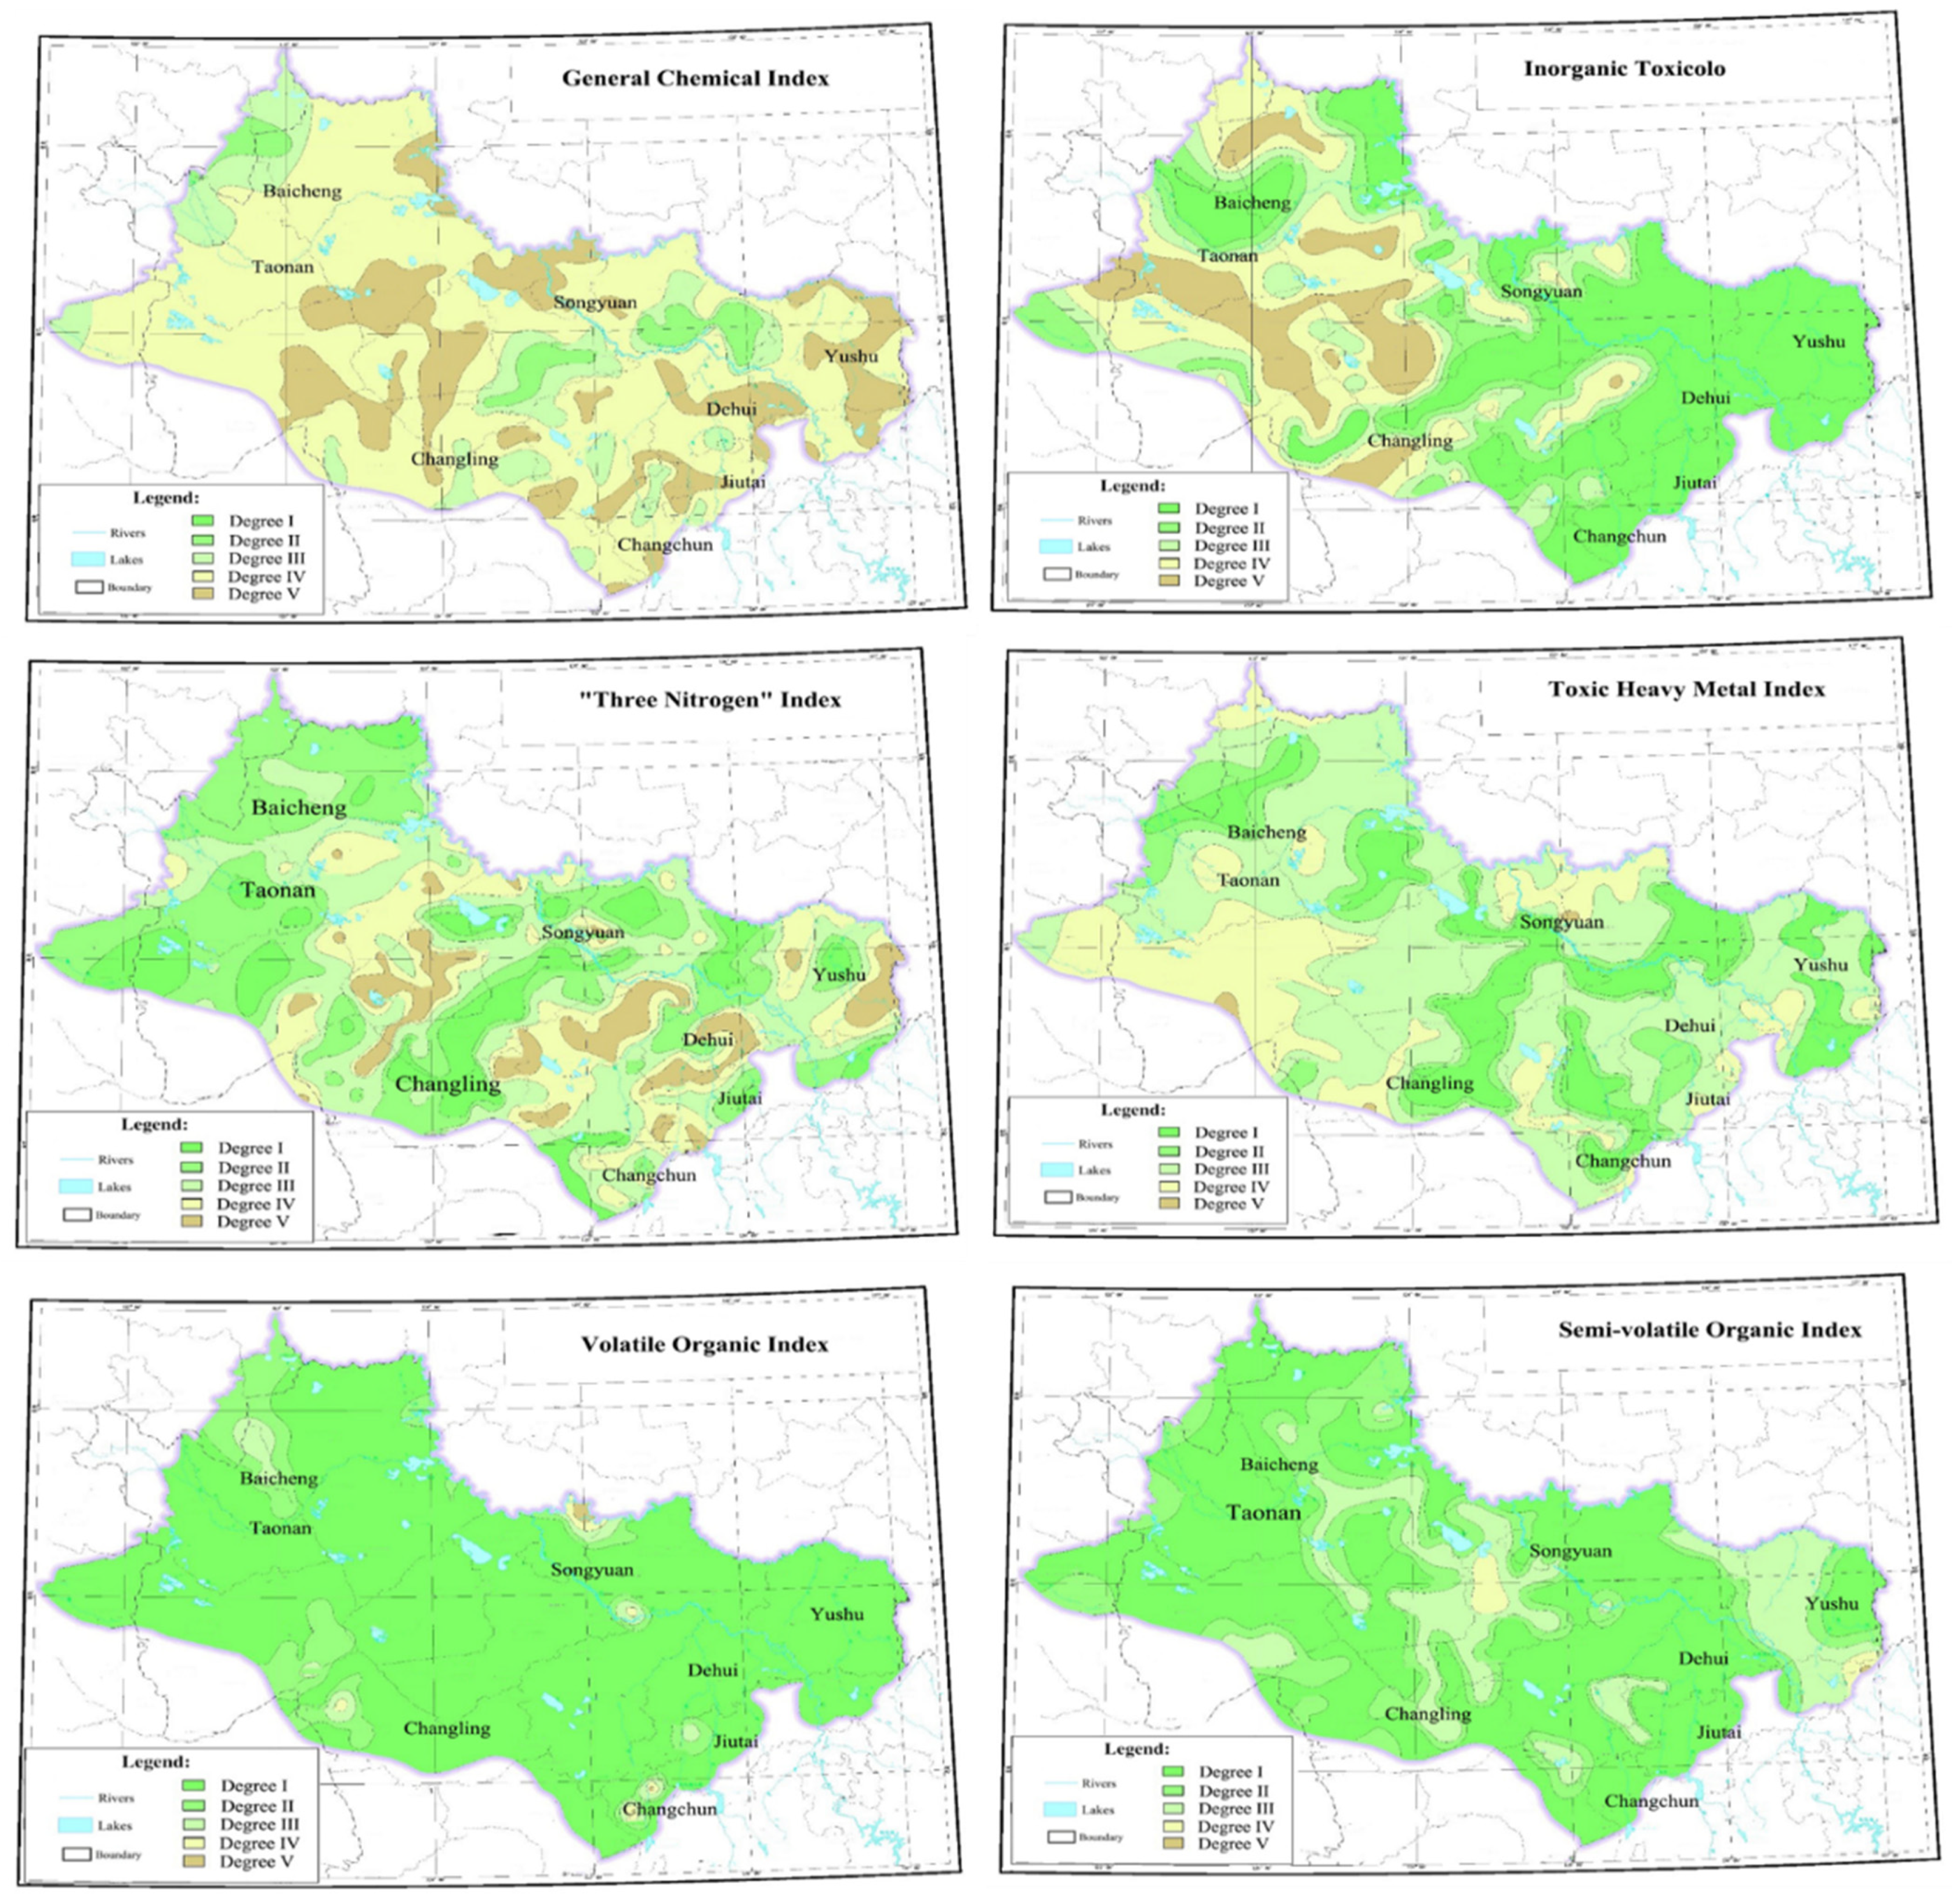
4.1. Single Index Quality Assessment

Points at which high Al was identified are mainly distributed in the high plain area in the east of the Songnen Plain (Jilin), which is related to the native environment. The TDS and TH measurements of groundwater in this area exceeded the standards, primarily due to the geological environmental conditions in this area and the unreasonable development and utilization of groundwater. As a result, the groundwater level continues to decline, and the interaction between water and rock leads to an increase in TDS and TH [49]. At the same time, the possibility of pollution cannot be excluded. The high Fe content in this area is mainly caused by the primary sedimentary environment [50,51]. The underground rocks in this area contain a large number of iron compounds that enter the groundwater during the deposition process. In addition, some wells are cast iron wells, and the materials used have been in contact with the groundwater for a long time. This causes the content of Fe in the groundwater to exceed the standard. The high content of Mn in the groundwater in this area is mainly caused by the primary sedimentary environment. The underground rocks in this area contain many manganese compounds. During the deposition process, these compounds enter the groundwater, and the Mn content in groundwater exceeds the standard. The excessive As content in groundwater in the study area is mainly distributed in the low plain area, which is caused by the high As content in the native sedimentary environment of the low plain and the water–rock interaction caused by groundwater mining, which leads to the enrichment of As in groundwater (Figure 3 and Figure 4).

4.2. Multi-Indicator Evaluation

To evaluate the inorganic toxicology index of groundwater in the study area, the results show that class I water covers an area of 25,157.73 km2, accounting for 39.70% of the total area; class II water covers an area of 8669.12 km2, accounting for 13.70% of the total area; class III water covers an area of 9009.44 km2, accounting for 14.21% of the total area; class IV water covers an area of 13,100.64 km2, accounting for 20.66% of the total area, and class V water covers an area of 7437.81 km2, accounting for 11.73% of the total area. Good results were obtained from the inorganic toxicology index evaluation of groundwater. The groundwater was primarily categorized into classes I, II, and III, which appear to be suitable for drinking.
Evaluating the toxicity of heavy metals in groundwater index in the study area, the results show that class I water covers an area of 11,170.02 km2, accounting for 17.63% of the total area, class II water covers an area of 8063.06 km2, accounting for 12.72% of the total area, class III water covers an area of 30,478.00 km2, accounting for 48.09% of the total area, class IV water covers an area of 13,472.79 km2, accounting for 21.26% of the total area, and class V water covers an area of 190.86 km2, accounting for 0.30% of the total area. The toxicology index evaluation results of heavy metals reveals suitable water quality, belonging primarily to classes I, II, and III, which appear to be suitable for drinking.

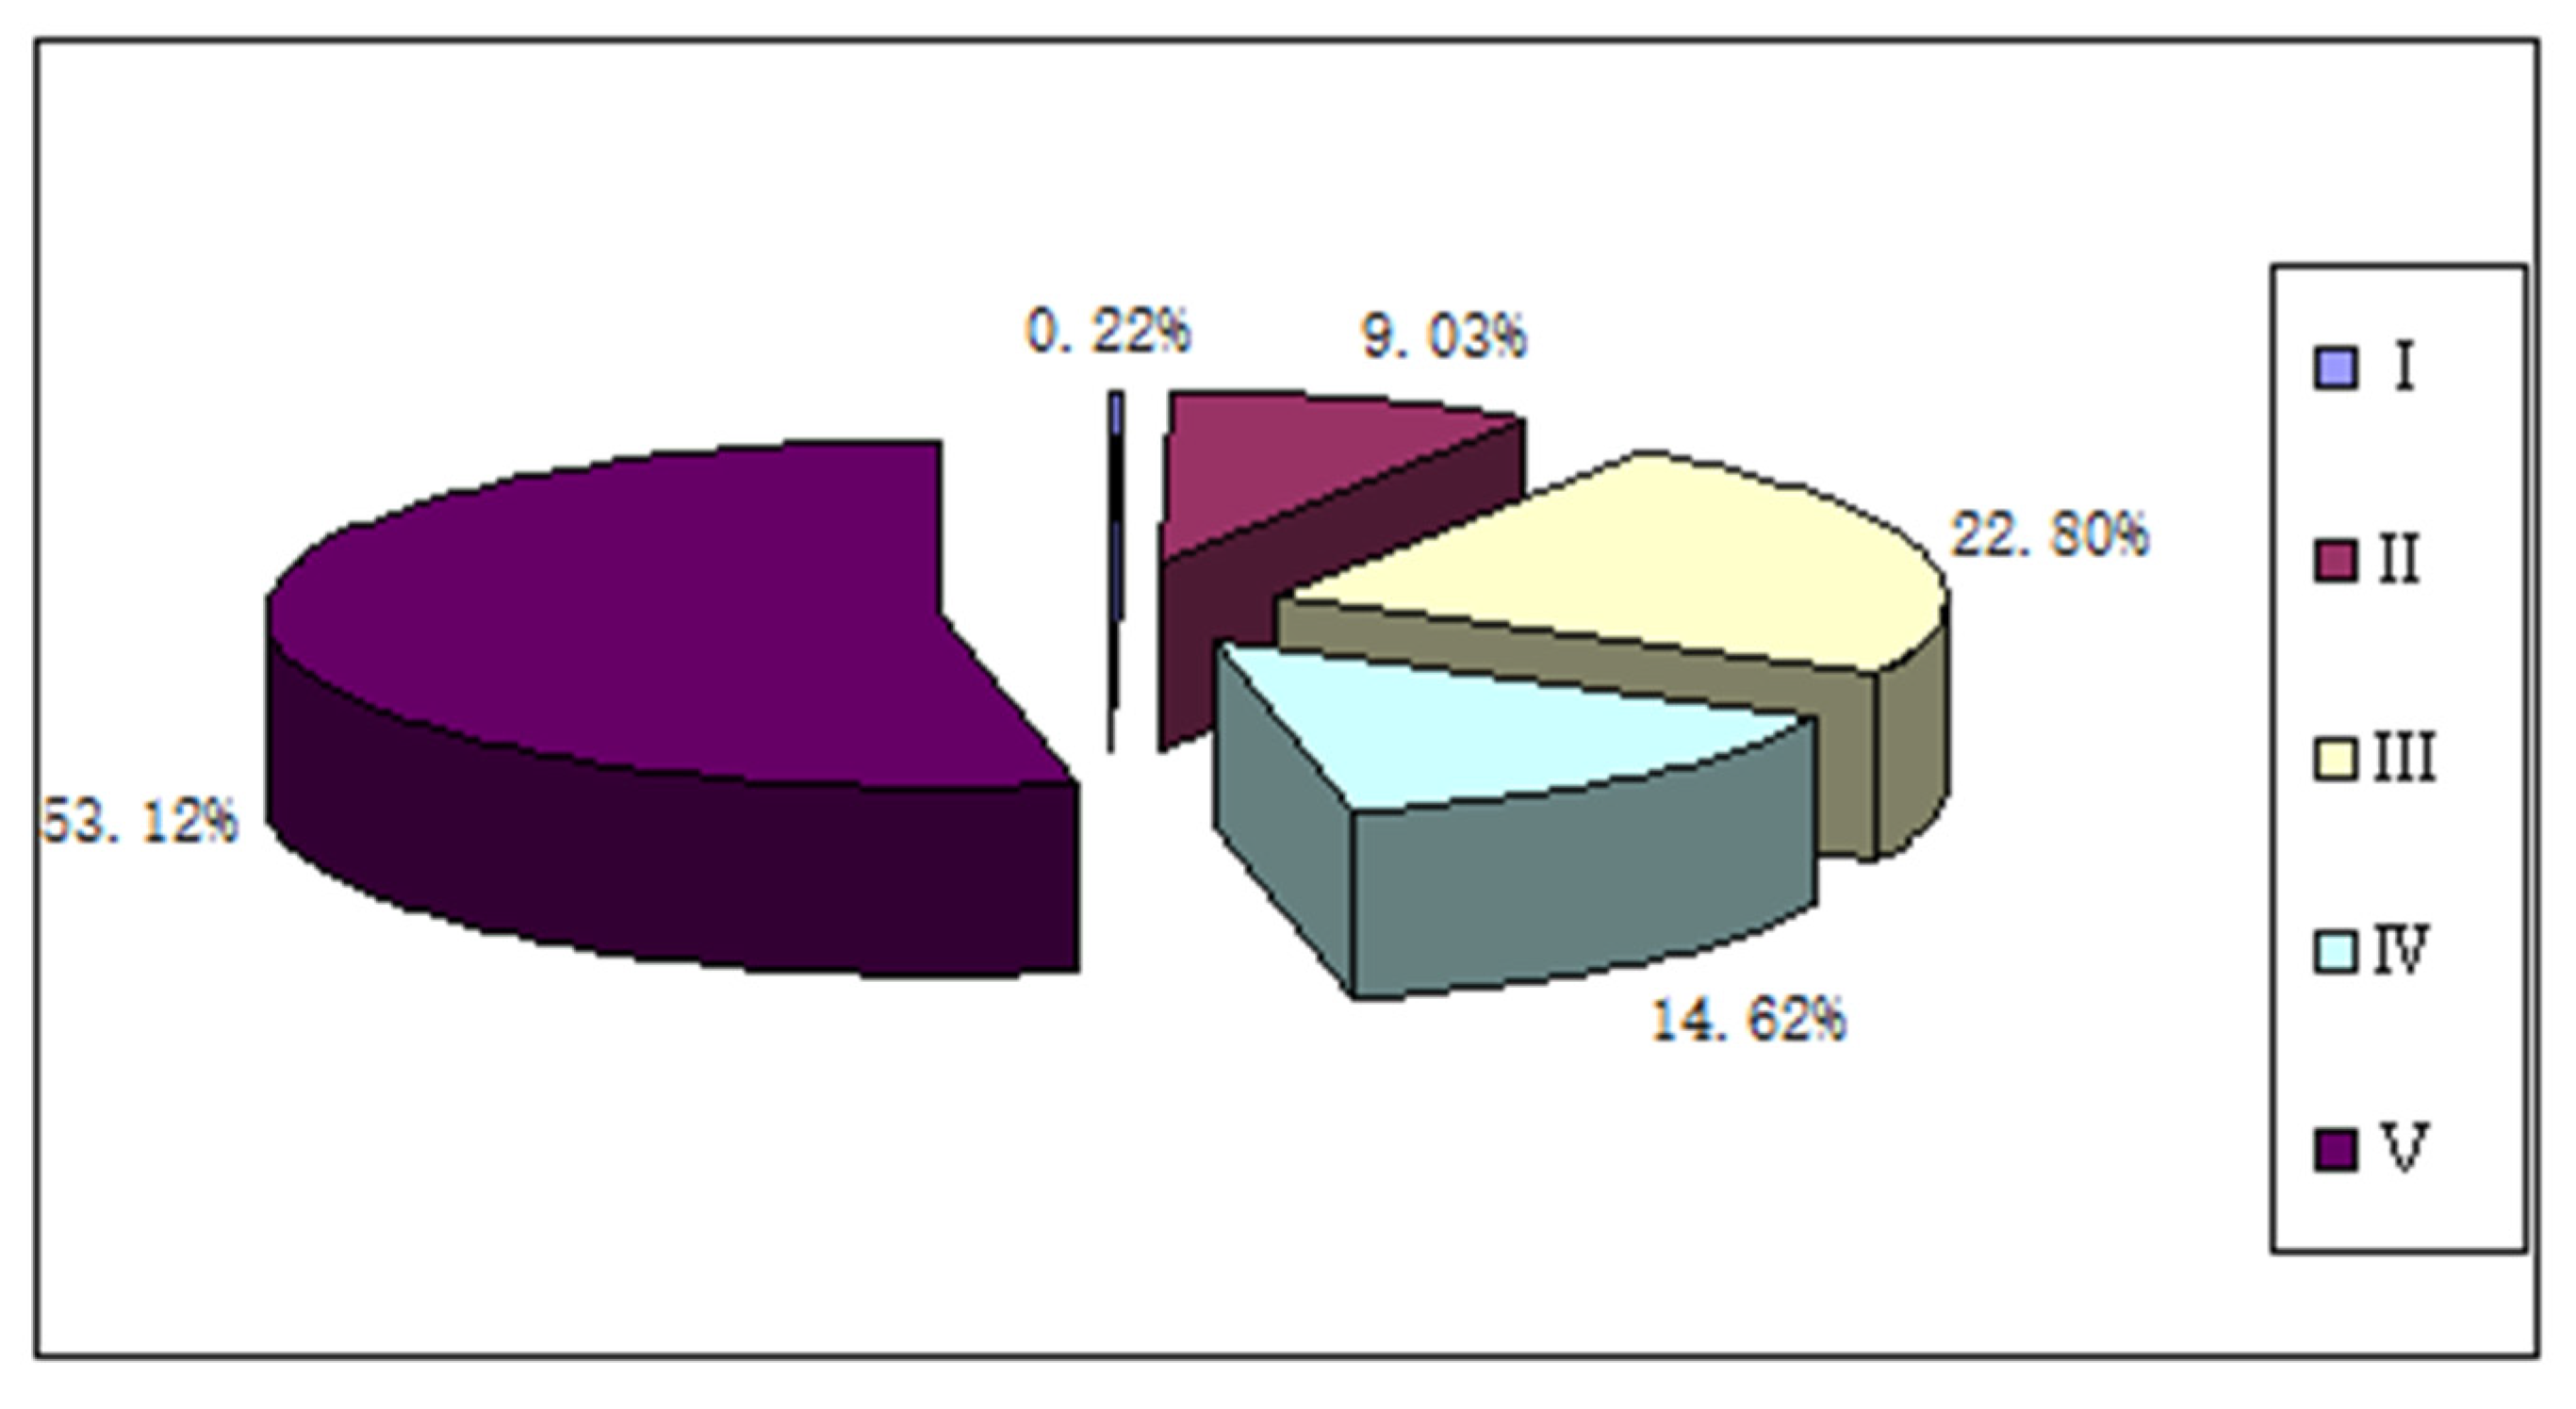
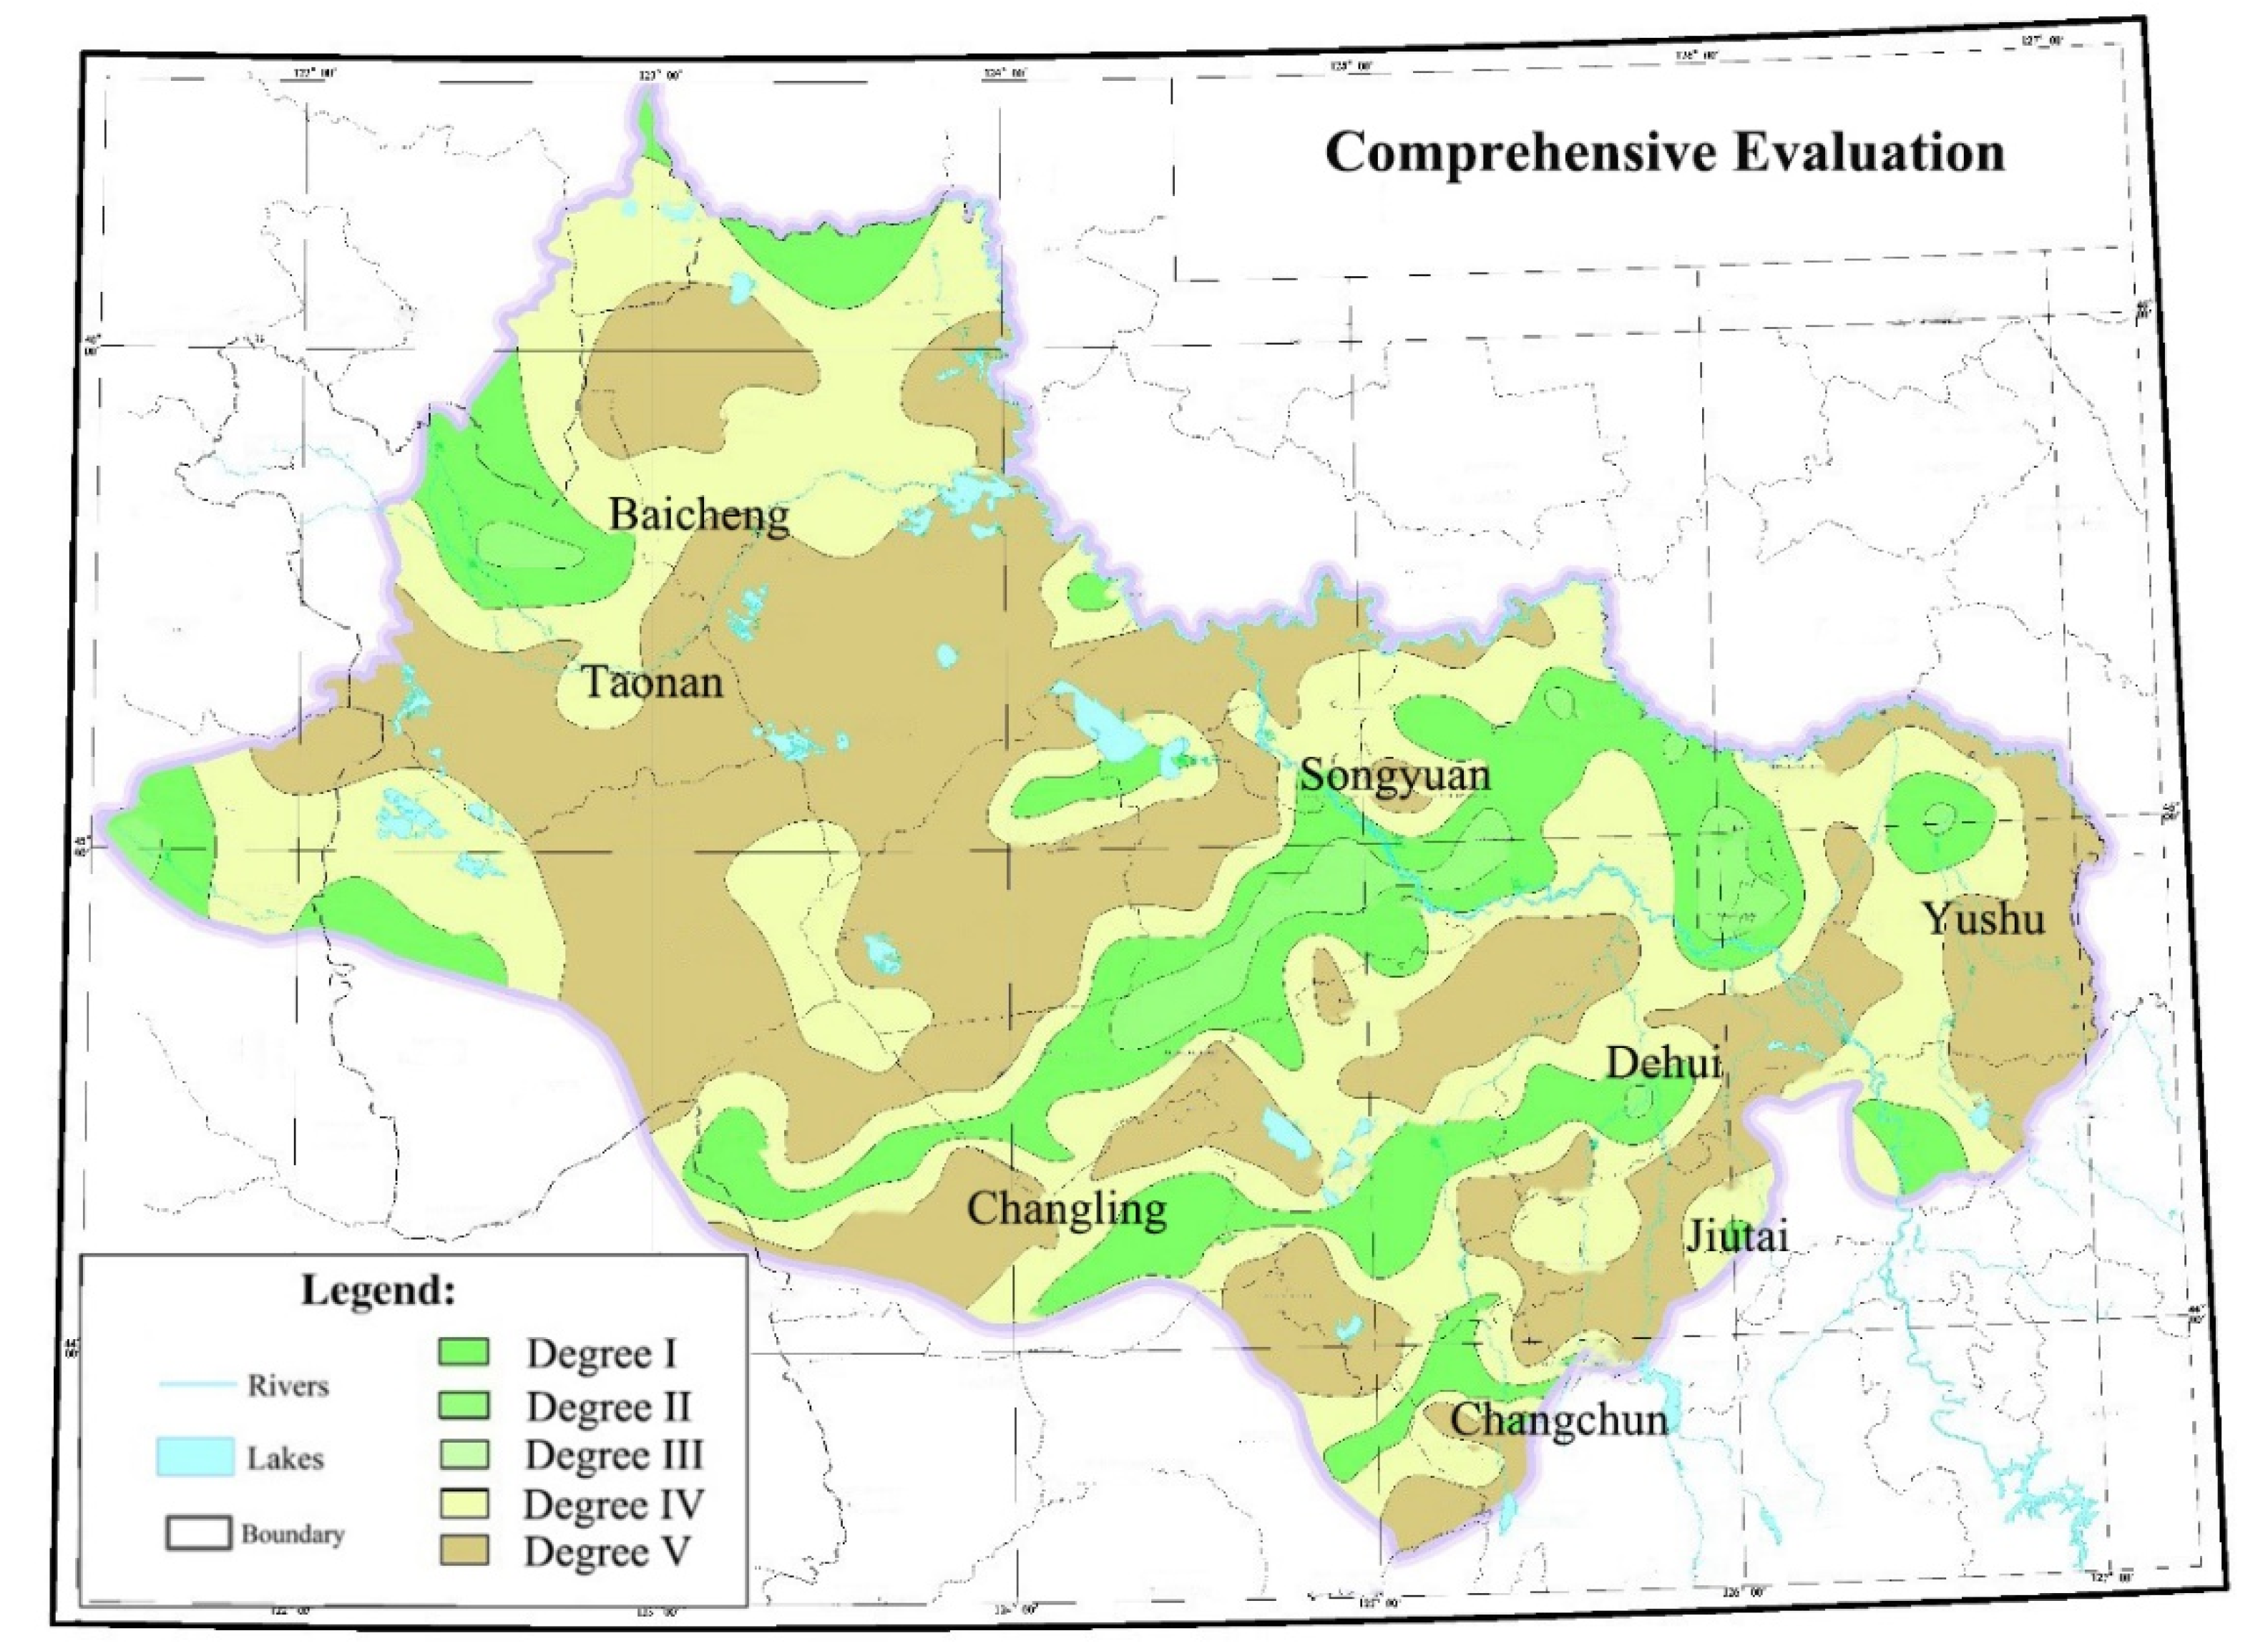
4.3. Comprehensive Quality Assessment

The comprehensive evaluation of groundwater quality in the study area revealed class II water covers an area of 1805.48 km2, accounting for 2.85% of the total area; class III water covers an area of 10,881.61 km2, accounting for 17.17% of the total area; class IV water covers an area of 23,010.53 km2, accounting for 36.31% of the total area, and class V water covers an area of 27,677.10 km2, accounting for 43.67% of the total area. Water of classes II and III in this area are mainly distributed in the midland and northwest of the Songnen Plain.

4.4. Influence Index of Groundwater Quality

Based on the situation of exceeding the standard of each index, the multi-index classification and comprehensive evaluation demonstrated that the groundwater quality in the study area is affected by groundwater recharge, drainage, and human activities. Human activities exert a significant influence on the groundwater quality. Several indicators were found to exceed standards owing to human activities, and the distribution of all indicators affecting the groundwater quality exhibit obvious regional characteristics according to human influence. The groundwater quality in this area is primarily class IV water and class V water, as determined by considering key indicators, including Al, TH, TDS, volatile phenol, NO3, As, F, Fe, Mn, Na+, NH4+, and BaP.
The groundwater in the study area exceeded the "three nitrogen” standard, which is mainly due to human activities, such as the widespread application of chemical fertilizer, human excrement disposal, domestic sewage discharge, and industrial sewage discharge. As an important grain base in China, the excessive nitrogen content in the groundwater of the Songnen Plain (Jilin) is related to the large amount of pesticide and chemical fertilizer. In areas where human activities are more intensive, nitrogen pollution is increasingly severe. If the contaminated groundwater is used for long-term irrigation, it will lead to a decline in soil quality. On the one hand, it may decrease crop yields; on the other hand, it will reduce the quality of crops, and the content of some harmful and toxic substances exceeds the standard. To prevent and control groundwater pollution, we should strengthen the protection of groundwater resources and exploitation restrictions. Besides, it is imperative to determine the ecological environment and geological fragile areas, and establish a dynamic management database.
Fe and Mn are likely abundant in groundwater due to sewage entering the groundwater system. The corrosion of iron pipes is also one reason for observed increases in Fe in groundwater. The high TH in groundwater in the study area is mainly due to the poor permeability of the regional aquifer, the decrease in water level caused by groundwater exploitation, the enrichment of elements in groundwater, and the ion exchange with Ca and Mg ions in the stratum. The distribution characteristics of organic components exhibit the following characteristics: first, they are distributed in urban areas as well as the surrounding and industrial areas; second, they are distributed in agricultural production areas and rural population gathering areas, and third, they are distributed in the oilfield areas. Benzene, toluene, xylene, and carbon tetrachloride are industrial production, pesticide synthesis of organic solvents in the process of production of the material, and its derivatives are widely used in chemical industry, oil drilling, vehicle exhaust emissions, and the influence factors of benzene and benzene series object detection. In the evaluation area, there were also many cases of HCH and DDT detected or exceeded the standard content, which were mainly distributed in the agricultural area, mainly caused by agricultural production [51]. Polycyclic aromatic hydrocarbons such as BaP are mainly released from the incomplete combustion of fossil fuels, firewood, straw burning, and farmland burning, followed by incomplete combustion of diesel engines, gasoline engines, and other petroleum products.

5. Conclusions

The main results of this article were as follows:
  • The main elements exceeding the standard in groundwater are Al, TH, TDS, Mn, As, NO3, Fe, F, volatile phenol, and BaP.
  • The proportions of classes IV and V in the other indices were less than 10%. The most important factors affecting groundwater quality were general chemical indexes, followed by inorganic toxicology and heavy metals; the three evaluated forms of nitrogen, volatile organic compounds, and semi-volatile organic compounds had little influence on groundwater quality.
  • The three nitrogen results are mainly related to human activities: the more intense the human activity, the more significantly the "three nitrogen" standard is exceeded. TH and TDS are related to the original environment and groundwater overmining.
  • The detection and removal of organic components also exhibit a strong relationship with human activity.
  • The results of the comprehensive quality assessment show that the groundwater quality in this area is generally poor, which is influenced by both the original environment and human activities.
Water sources are closely related to human health, and poor quality and polluted water sources should be avoided. The protection of groundwater sources should be carried out according to the following recommendations:
  • improve well construction processes to avoid cross-bedding pollution;
  • carefully select materials used to build wells to avoid contamination;
  • protect the environment of the wellhead from pollution;
  • avoid pollution caused by overexploitation;
  • regulate agricultural activities and sewage discharge;
  • implement a strict water source protection system and prohibit groundwater pollution in protection areas.
The advantage of this study is that the characteristics of physical and chemical elements of groundwater have been understood, and the groundwater pollution status and distribution of groundwater pollution degree in the study area have been proved. However, if it is not clear how to control, the problem of groundwater pollution will not be solved. There are many ways to prevent groundwater from being polluted. Among them, the permeable pavement system is one of the good methods, and this method will also be the field of future research. The next research will explore ways to control groundwater pollution.

Author Contributions

Conceptualization, writing—original draft preparation, project administration, Y.C.; methodology, resources, funding acquisition, project administration, Y.Z.; validation, data curation, formal analysis, J.H.; investigation, supervision, J.Z.; writing—review and editing, Q.L.; visualization, H.L.; formal analysis, software. C.W. All authors have read and agreed to the published version of the manuscript.

Funding

This research was funded by Major Special Science and Technology Project of Pollution Control and Ecological Restoration in Liaohe River Basin of Jilin Province (grant number 20200503002SF); Emergency Risk Assessment and Emergency Resource Investigation of Jilin Province (grant number 320200059); Spatial Variation and Comprehensive Risk Assessment of Polycyclic Aromatic Hydrocarbons (PAHs) Pollution in Farmland Systems Along Highways (grant number 320200029).

Institutional Review Board Statement

Not applicable.

Informed Consent Statement

Not applicable.

Data Availability Statement

Not applicable.

Acknowledgments

We thank the Key Laboratory of Groundwater Resources and Environment, Ministry of Education, Jilin University for their experimental data.

Conflicts of Interest

The authors declare no conflict of interest.

Abbreviations

GIS—geographic information system; TDS—total dissolved solids; COD—chemical oxygen demand; TH—total hardness; HCH—hexachlorocyclohexane; BHC—benzene hexachloride; DDT—Dichlorodiphenyltrichloro-ethane; BaP—benzo (a) pyrene.

References

  1. Wu, J.; Bian, J.; Wan, H.; Ma, Y.; Sun, X. Health risk assessment of groundwater nitrogen pollution in Songnen Plain. Ecotoxicol. Environ. Saf. 2021, 207, 111245. [Google Scholar] [CrossRef]
  2. Alikhanov, B.; Juliev, M.; Alikhanova, S.; Mondal, I. Assessment of influencing factor method for delineation of groundwater potential zones with geospatial techniques. Case study of Bostanlik district, Uzbekistan. Groundw. Sustain. Dev. 2021, 12, 100548. [Google Scholar] [CrossRef]
  3. Mukherjee, A.; Sarkar, S.; Chakraborty, M.; Duttagupta, S.; Bhattacharya, A.; Saha, D.; Bhattacharya, P.; Mitra, A.; Gupta, S. Occurrence, predictors and hazards of elevated groundwater arsenic across India through field observations and regional-scale AI-based modeling. Sci. Total Environ. 2021, 759, 143511. [Google Scholar] [CrossRef]
  4. May, R.; Mazlan, N.S.B. Numerical simulation of the effect of heavy groundwater abstraction on groundwater–surface water interaction in Langat Basin, Selangor, Malaysia. Environ. Earth Sci. 2014, 71, 1239–1248. [Google Scholar] [CrossRef]
  5. Ahmed, I.; Tariq, N.; Al Muhery, A. Hydrochemical characterization of groundwater to align with sustainable development goals in the Emirate of Dubai, UAE. Environ. Earth Sci. 2019, 78, 44. [Google Scholar] [CrossRef]
  6. Eslami, F.; Yaghmaeian, K.; Mohammadi, A.; Salari, M.; Faraji, M. An integrated evaluation of groundwater quality using drinking water quality indices and hydrochemical characteristics: A case study in Jiroft, Iran. Environ. Earth Sci. 2019, 78, 314. [Google Scholar] [CrossRef]
  7. Yuan, Y.; Liu, Y.; Luo, K.; Shahid, M.Z. Hydrochemical characteristics and a health risk assessment of the use of river water and groundwater as drinking sources in a rural area in Jiangjin District, China. Environ. Earth Sci. 2020, 79, 160. [Google Scholar] [CrossRef]
  8. Xu, B.; Liu, S.; Zhou, J.L.; Zheng, C.; Weifeng, J.; Chen, B.; Zhang, T.; Qiu, W. PFAS and their substitutes in groundwater: Occurrence, transformation and remediation. J. Hazard. Mater. 2021, 412, 125159. [Google Scholar] [CrossRef] [PubMed]
  9. Li, P.; Wu, J.; Qian, H.; Zhang, Y.; Yang, N.; Jing, L.; Yu, P.; Li, P.; Qian, H. Hydrogeochemical Characterization of Groundwater in and Around a Wastewater Irrigated Forest in the Southeastern Edge of the Tengger Desert, Northwest China. Expo. Health 2016, 8, 331–348. [Google Scholar] [CrossRef]
  10. Liu, J.; Peng, Y.; Li, C.; Gao, Z.; Chen, S. A characterization of groundwater fluoride, influencing factors and risk to human health in the southwest plain of Shandong Province, North China. Ecotoxicol. Environ. Saf. 2021, 207, 111512. [Google Scholar] [CrossRef] [PubMed]
  11. Loh, Y.S.A.; Akurugu, B.A.; Manu, E.; Aliou, A. Assessment of groundwater quality and the main controls on its hydrochemistry in some Voltaian and basement aquifers, northern Ghana. Groundw. Sustain. Dev. 2020, 10, 100296. [Google Scholar] [CrossRef]
  12. Verma, A.; Yadav, B.K.; Singh, N.B. Hydrochemical exploration and assessment of groundwater quality in part of the Ganga-Gomti Fluvial Plain in northern India. Groundw. Sustain. Dev. 2021, 13, 100560. [Google Scholar] [CrossRef]
  13. Zakaria, N.; Anornu, G.; Adomako, D.; Owusu-Nimo, F.; Gibrilla, A. Evolution of groundwater hydrogeochemistry and assessment of groundwater quality in the Anayari catchment. Groundw. Sustain. Dev. 2021, 12, 100489. [Google Scholar] [CrossRef]
  14. Hua, K.; Xiao, J.; Li, S.; Li, Z. Analysis of hydrochemical characteristics and their controlling factors in the Fen River of China. Sustain. Cities Soc. 2020, 52, 101827. [Google Scholar] [CrossRef]
  15. Liu, J.; Gao, Z.; Wang, Z.; Xu, X.; Su, Q.; Wang, S.; Qu, W.; Xing, T. Hydrogeochemical processes and suitability assessment of groundwater in the Jiaodong Peninsula, China. Environ. Monit. Assess 2020, 192, 384. [Google Scholar] [CrossRef]
  16. Yousefi, M.; Ghoochani, M.; Hossein Mahvi, A. Health risk assessment to fluoride in drinking water of rural residents living in the Poldasht city, Northwest of Iran. Ecotoxicol. Environ. Saf. 2018, 148, 426–430. [Google Scholar] [CrossRef] [PubMed]
  17. Sambito, M.; Severino, A.; Freni, G.; Neduzha, L. A Systematic Review of the Hydrological, Environmental and Durability Performance of Permeable Pavement Systems. Sustainability 2021, 13, 4509. [Google Scholar] [CrossRef]
  18. Vu, T.; Ni, C.; Li, W.; Truong, M.; Marko Hsu, S. Predictions of groundwater vulnerability and sustainability by an integrated index-overlay method and physical-based numerical model. J. Hydrol. 2021, 596, 126082. [Google Scholar] [CrossRef]
  19. Dippong, T.; Mihali, C.; Hoaghia, M.; Cical, E.; Cosma, A. Chemical modeling of groundwater quality in the aquifer of Seini town—Someș Plain, Northwestern Romania. Ecotoxicol. Environ. Saf. 2019, 168, 88–101. [Google Scholar] [CrossRef] [PubMed]
  20. Ji, Y.; Wu, J.; Wang, Y.; Elumalai, V.; Subramani, T. Seasonal Variation of Drinking Water Quality and Human Health Risk Assessment in Hancheng City of Guanzhong Plain, China. Expo. Health 2020, 12, 469–485. [Google Scholar] [CrossRef]
  21. Nawale, V.P.; Malpe, D.B.; Marghade, D.; Yenkie, R. Non-carcinogenic health risk assessment with source identification of nitrate and fluoride polluted groundwater of Wardha sub-basin, central India. Ecotoxicol. Environ. Saf. 2021, 208, 111548. [Google Scholar] [CrossRef] [PubMed]
  22. Zuo, R.; Liu, X.; Zhang, Q.; Wang, J.; Yang, J.; Teng, Y.; Chen, X.; Zhai, Y. Sulfonamide antibiotics in groundwater and their migration in the vadose zone: A case in a drinking water resource. Ecol. Eng. 2021, 162, 106175. [Google Scholar] [CrossRef]
  23. Kwon, E.; Park, J.; Park, W.; Kang, B.; Woo, N.C. Nitrate contamination of coastal groundwater: Sources and transport mechanisms along a volcanic aquifer. Sci. Total Environ. 2021, 768, 145204. [Google Scholar] [CrossRef]
  24. Meng, L.; Zuo, R.; Wang, J.; Li, Q.; Du, C.; Liu, X.; Chen, M. Response of the redox species and indigenous microbial community to seasonal groundwater fluctuation from a typical riverbank filtration site in Northeast China. Ecol. Eng. 2021, 159, 106099. [Google Scholar] [CrossRef]
  25. Ouhamdouch, S.; Bahir, M.; Ouazar, D.; Carreira, P.M.; Zouari, K. Evaluation of climate change impact on groundwater from semi-arid environment (Essaouira Basin, Morocco) using integrated approaches. Environ. Earth Sci. 2019, 78, 1–14. [Google Scholar] [CrossRef]
  26. Liu, J.; Peng, Y.; Li, C.; Gao, Z.; Chen, S. Characterization of the hydrochemistry of water resources of the Weibei Plain, Northern China, as well as an assessment of the risk of high groundwater nitrate levels to human health. Environ. Pollut. 2021, 268, 115947. [Google Scholar] [CrossRef]
  27. Umamageswari, T.S.R.; Sarala Thambavani, D.; Liviu, M. Hydrogeochemical processes in the groundwater environment of Batlagundu block, Dindigul district, Tamil Nadu: Conventional graphical and multivariate statistical approach. Appl. Water Sci. 2019, 9, 14. [Google Scholar] [CrossRef] [Green Version]
  28. Giri, S. Water quality prospective in Twenty First Century: Status of water quality in major river basins, contemporary strategies and impediments: A review. Environ. Pollut. 2021, 271, 116332. [Google Scholar] [CrossRef]
  29. Marghade, D. Detailed geochemical assessment & indexing of shallow groundwater resources in metropolitan city of Nagpur (western Maharashtra, India) with potential health risk assessment of nitrate enriched groundwater for sustainable development. Geochemistry 2020, 80, 125627. [Google Scholar]
  30. Chen, R.; Teng, Y.; Chen, H.; Hu, B.; Yue, W. Groundwater pollution and risk assessment based on source apportionment in a typical cold agricultural region in Northeastern China. Sci. Total Environ. 2019, 696, 133972. [Google Scholar] [CrossRef]
  31. Yan, J.; Chen, J.; Zhang, W. Study on the groundwater quality and its influencing factor in Songyuan City, Northeast China, using integrated hydrogeochemical method. Sci. Total Environ. 2021, 773, 144958. [Google Scholar] [CrossRef]
  32. Bao, K.; Zaccone, C.; Tao, Y.; Wang, J.; Shen, J.; Zhang, Y. Source apportionment of priority PAHs in 11 lake sediment cores from Songnen Plain, Northeast China. Water Res. 2020, 168, 115158. [Google Scholar] [CrossRef] [PubMed]
  33. Mackenzie, L.; Bao, K.; Mao, L.; Klamt, A.; Pratte, S.; Shen, J. Anthropogenic and climate-driven environmental change in the Songnen Plain of northeastern China over the past 200 years. Palaeogeogr. Palaeoclimatol. Palaeoecol. 2018, 511, 208–217. [Google Scholar] [CrossRef]
  34. Qiu, X.; Zhang, L.; Wenliang, L.; Yang, Y.; Tao, P. Studies on changes and cause of the minimum air temperature in Songnen Plain of China during 1961–2010. Acta Ecol. Sin. 2016, 36, 311–320. [Google Scholar] [CrossRef]
  35. Du, Y.; Song, K.; Liu, G.; Wen, Z.; Fang, C.; Shang, Y.; Zhao, F.; Wang, Q.; Du, J.; Zhang, B. Quantifying total suspended matter (TSM) in waters using Landsat images during 1984–2018 across the Songnen Plain, Northeast China. J. Environ. Manag. 2020, 262, 110334. [Google Scholar] [CrossRef] [PubMed]
  36. Guo, H.; Zhang, D.; Wen, D.; Wu, Y.; Ni, P.; Jiang, Y.; Guo, Q.; Li, F.; Zheng, H.; Zhou, Y. Arsenic mobilization in aquifers of the southwest Songnen basin, China: Evidences from chemical and isotopic characteristics. Sci. Total Environ. 2014, 490, 590–602. [Google Scholar] [CrossRef]
  37. Zhang, B.; Song, X.; Zhang, Y.; Han, D.; Tang, C.; Yang, L.; Wang, Z. The relationship between and evolution of surface water and groundwater in Songnen Plain, Northeast China. Environ. Earth Sci. 2015, 73, 8333–8343. [Google Scholar] [CrossRef]
  38. Zhai, Y.; Zhao, X.; Teng, Y.; Li, X.; Zhang, J.; Wu, J.; Zuo, R. Groundwater nitrate pollution and human health risk assessment by using HHRA model in an agricultural area, NE China. Ecotoxicol. Environ. Saf. 2017, 137, 130–142. [Google Scholar] [CrossRef]
  39. Bian, J.; Nie, S.; Wang, R.; Wan, H.; Liu, C. Hydrochemical characteristics and quality assessment of groundwater for irrigation use in central and eastern Songnen Plain, Northeast China. Environ. Monit. Assess. 2018, 190, 382. [Google Scholar] [CrossRef]
  40. Yin, X.; Ma, C.; He, H.; Wang, Z.; Li, X.; Fu, G.; Liu, J.; Zheng, Y. Distribution and diversity patterns of soil fauna in different salinization habitats of Songnen Grasslands, China. Appl. Soil Ecol. 2018, 123, 375–383. [Google Scholar] [CrossRef]
  41. Liu, J.; Peng, Y.; Li, C.; Gao, Z.; Chen, S. An investigation into the hydrochemistry, quality and risk to human health of groundwater in the central region of Shandong Province, North China. J. Clean. Prod. 2021, 282, 125416. [Google Scholar] [CrossRef]
  42. Apaydin, A. Malibogazi groundwater dam: An alternative model for semi-arid regions of Turkey to store and save groundwater. Environ. Earth Sci. 2009, 59, 339–345. [Google Scholar] [CrossRef]
  43. Li, X.; Li, J.; Xi, B.; Yuan, Z.; Zhu, X.; Zhang, X. Effects of groundwater level variations on the nitrate content of groundwater: A case study in Luoyang area, China. Environ. Earth Sci. 2015, 74, 3969–3983. [Google Scholar] [CrossRef]
  44. Wu, M.; Feng, Q.; Wen, X.; Yin, Z.; Yang, L.; Sheng, D. Deterministic Analysis and Uncertainty Analysis of Ensemble Forecasting Model Based on Variational Mode Decomposition for Estimation of Monthly Groundwater Level. Water 2021, 13, 139. [Google Scholar] [CrossRef]
  45. State Environmental Protection Administration. Technical Specification for Environmental Monitoring of Groundwater, HJ/T 164-2004; China Quality and Standards Publishing & Media Co., Ltd.: Beijing, China, 2004. [Google Scholar]
  46. Standardization Administration of China. Standard for Groundwater Quality, GB/T 14848-2017; China Quality and Standards Publishing & Media Co., Ltd.: Beijing, China, 2017. [Google Scholar]
  47. Jiang, Y.; Gui, H.; Yu, H.; Wang, M.; Fang, H.; Wang, C.; Chen, C.; Zhang, Y.; Huang, Y. Hydrochemical Characteristics and Water Quality Evaluation of Rivers in Different Regions of Cities: A Case Study of Suzhou City in Northern Anhui Province, China. Water 2020, 12, 950. [Google Scholar] [CrossRef] [Green Version]
  48. Dahiya, S.; Singh, B.; Gaur, S.; Garg, V.K.; Kushwaha, H.S. Analysis of groundwater quality using fuzzy synthetic evaluation. J. Hazard. Mater. 2007, 147, 938–946. [Google Scholar] [CrossRef]
  49. Ha, K.; Lee, E.; An, H.; Kim, S.; Park, C.; Kim, G.; Ko, K. Evaluation of Seasonal Groundwater Quality Changes Associated with Groundwater Pumping and Level Fluctuations in an Agricultural Area, Korea. Water 2021, 13, 51. [Google Scholar] [CrossRef]
  50. Mastrocicco, M.; Colombani, N. The Issue of Groundwater Salinization in Coastal Areas of the Mediterranean Region: A Review. Water 2021, 13, 90. [Google Scholar] [CrossRef]
  51. Contreras, J.I.; Roldán-Cañas, J.; Moreno-Pérez, M.F.; Gavilán, P.; Lozano, D.; Baeza, R. Distribution Uniformity in Intensive Horticultural Systems of Almería and Influence of the Production System and Water Quality. Water 2021, 13, 233. [Google Scholar] [CrossRef]
Figure 1. Study area map.
Water 13 02414 g001
Figure 2. Map of multi-indicator evaluation.
Water 13 02414 g002
Figure 3. Map of comprehensive quality assessment.
Water 13 02414 g003
Figure 4. Pie chart of the proportion of water to area for each class.
Water 13 02414 g004
Table 1. Groundwater quality standards.
DegreeDescription
IGroundwater has low chemical content and is suitable for various uses in principle
IIGroundwater has slightly low chemical content and is suitable for various uses in principle
IIIIt is suitable for drinking, agricultural, and main industrial water
IVIt is suitable for agriculture and some industrial water and can be used as drinking water after proper treatment
VNot suitable for drinking water, other water can be selected according to the purpose of use
Table 2. Multi-index classification of groundwater.
Indicator CategoriesIndex Name
General Chemical IndexpH, Fe, Mn, Cu, Zn, Al, Cl, SO42−, TH, TDS, COD, Na+
Inorganic Toxicology IndexFluoride, Se, Cyanide
“Three Nitrogen” IndexNH4+, NO3, NO2
Toxic Heavy Metal IndexAs, Hg, Cr6+, Cd, Pb
Volatile Organic IndexTrichloromethane, Tetrachloromethane, 1, 1, 1-Trichloroethane, Trichloroethylene, Tetrachloroethylene, Dichloromethane, 1, 2- Dichloroethane, Bromoform, Chloroethylene, 1, 1-Dichloroethylene, 1, 2-Dichloroethylene, Chlorobenzene, Benzene, Methylbenzene, Ethylbenzene, Xylene, Styrene
Semi-Volatile Organic IndexHCH, γ-BHC, DDT, Hexachlorobenzene, BaP
Table 3. Illustrated statistics of physico-chemical elements in groundwater samples.
ParametersMinMaxClass I (%)Class II (%)Class III (%)Class IV (%)Class V (%)
PH6.9 mg/L9.19 mg/L92.04 7.53 0.43
Al2.56 mg/L34.84 21.94 24.95 14.62 3.66
Fe48.93 mg/L25.38 20.86 8.17 35.7 9.89
Mn9.84 mg/L42.37 6.67 46.24 4.73
Cu12.03 mg/L93.98 5.38 0.22 0.22 0.22
Zn90.93 mg/L87.96 11.18 0.43 0.43
Cl0.89 mg/L744.45 mg/L52.9 28.17 12.26 3.87 2.8
SO42−846.07 mg/L69.46 21.72 5.81 1.51 1.51
TH7.77 mg/L1650.48 mg/L6.88 43.23 25.16 15.05 9.68
TDS23 mg/L3767 mg/L4.09 25.38 43.01 24.52 3.01
COD0.24 mg/L9.23 mg/L47.74 33.98 10.32 7.96
As0.96 mg/L34.41 47.31 15.7 2.58
Cd0.03 mg/L91.61 7.31 0.43 0.22 0.43
Cr6+0.006 mg/L99.35 0.65
Pb1.545 mg/L92.04 4.3 3.01 0.65
Hg0.014 mg/L90.11 8.17 1.51 0.22
Se0.0263 mg/L99.57 0.43
Cyanide0.011 mg/L99.57 0.22 0.22
F0.17 mg/L10.43 mg/L0.43 30.75 31.40 16.77 20.65
NO31000 mg/L41.29 15.48 18.06 6.67 18.49
Trichloromethane30.88 μg/L99.35 0.22 0.43
Tetrachloromethane46.67 μg/L99.57 0.22 0.22
NH4+6 mg/L83.23 1.08 7.1 5.59 3.01
Na+1.26 mg/L855 mg/L89.03 6.24 4.73
NO210 mg/L79.14 15.05 5.38 0.43
Trichloroethylene69.89 μg/L99.57 0.22 0.22
Dichloromethane1.03 μg/L99.78 0.22
1, 2- Dichloroethane705.50 μg/L98.71 0.43 0.22 0.65
Benzene4.1 μg/L99.35 0.65
Methylbenzene6.69 μg/L95.48 4.52
Xylene0.76 μg/L99.78 0.22
HCH163.86 μg/L97.42 1.08 0.22 0.43 0.86
γ-BHC13.99 μg/L99.57 0.22 0.22
DDT0.03476 μg/L99.57 0.43
Hexachlorobenzene0.0047 μg/L100
BaP01.189 μg/L73.76 9.89 15.27 1.08
Max. = Maximum; Min. = Minimum; – = Not detected.
Table 4. Classification of multi-index evaluation.
Indicator Categories
Semi-Volatile Organic IndexArea39,739.0212,485.8510,407.4727.415.04
Ratio62.719.7116.421.150.02
Volatile Organic IndexArea56,253.035365.711383.76271.8297.91
Ratio88.778.472.180.430.15
Toxic Heavy Metal IndexArea11,170.028063.0630,47813,472.79190.86
Ratio17.6312.7248.0921.260.3
“Three Nitrogen” IndexArea7732.1220,058.617,914.0512,235.885434.09
Ratio12.231.6528.2719.318.57
Inorganic Toxicology IndexArea25,157.738669.129009.4413,100.647437.81
Ratio39.713.714.2120.6611.73
General Chemical IndexArea02589.778096.8139,550.1213,138.03
Ratio04.0912.7862.4120.73
Area (km2); ratio (%).
Publisher’s Note: MDPI stays neutral with regard to jurisdictional claims in published maps and institutional affiliations.

