Article

High-Resolution Spatiotemporal Trend Analysis of Precipitation Using Satellite-Based Products over the United Arab Emirates

by
Khalid A. Hussein
1,2,*,
Tareefa S. Alsumaiti
1,
Dawit T. Ghebreyesus
3,
Hatim O. Sharif
3 and
Waleed Abdalati
2
1
Geography and Urban Sustainability Department, College of Humanities and Social Sciences, United Arab Emirates University, Al Ain P.O. Box 15551, United Arab Emirates
2
Cooperative Institute for Research in Environmental Sciences (CIRES), University of Colorado, Boulder, CO 80309, USA
3
Department of Civil and Environmental Engineering, College of Engineering, University of Texas at San Antonio, San Antonio, TX 78249, USA
*
Author to whom correspondence should be addressed.
Water 2021, 13(17), 2376; https://doi.org/10.3390/w13172376
Submission received: 15 June 2021 / Revised: 15 August 2021 / Accepted: 24 August 2021 / Published: 29 August 2021
(This article belongs to the Special Issue Hydrometeorological Observation and Modeling)

Abstract

:
Current water demands are adequately satisfied in the United Arab Emirates (UAE) with the available water resources. However, the changing climate and growing water demand pose a great challenge for water resources managers in the country. Hence, there is a great need for management strategies and policies to use the most accurate information regarding water availability. Understanding the frequency and the short- and long-term trends of the precipitation by employing high-resolution data in both the spatial and temporal domains can provide invaluable information. This study examines the long-term precipitation trends over the UAE using 17 years of data from three of the most highly cited satellite-based precipitation products and rain gauge data observed at 18 stations. The UAE received, on average, 42, 51, and 120 wet hours in a year in the 21st century as recorded by CMORPH, PERSIANN, and IMERG, respectively. The results show that the areal average annual precipitation of the UAE is significantly lower in the early 21st century than that of the late 20th century, even though it shows an increasing trend by all the products. The Mann–Kendall trend test showed positive trends in six rain gauge stations and negative trends in two stations out of 18 stations, all of which are located in the wetter eastern part of the UAE. Results indicate that satellite products have great potential for improving the spatial aspects of rainfall frequency analysis and can complement rain gauge data to develop rainfall intensity–duration–frequency curves in a very dry region, where the installation of dense rain gauge networks is not feasible.

1. Introduction

The United Arab Emirates (UAE) is located in a region characterized by high temperatures and very low precipitation [1]. Thus, the freshwater resource of the country, which is mainly available as groundwater, is very limited, but the water demand continues to soar due to the improvement in the living standard, population increase, and economic growth. The water shortage is exacerbated by excessive withdrawal for municipal and agricultural use. Rainfall is very scarce with an annual average of 110 mm and sporadic spatial distribution [2,3]. The extremely scant surface water resources are too unreliable to be considered in water resources planning and management, because of the high rate of evaporation and prolonged drought conditions [3]. To meet the increasing water demand of these sectors, the UAE deploys several conventional and non-conventional sources of water within its water supply management system. However, strikingly low availability of natural water resources has encouraged the UAE to meet its requirements through desalination plants, which account for 22% of the water produced in the UAE [4]. Although current water demands are adequately satisfied with the available water resources, the UAE is set to face challenges in the future owing to the depletion of natural water sources, population growth, increasing urbanization, and the impacts of global warming [5].
The stress on water resources of the UAE is increasing as the gap between demand and resource amount diverges. Hence, there is a great need to update and optimize the water resource management strategies that are currently in place with the most recent and reliable data. Understanding the short- and long-term trends of the precipitation by employing high-resolution data in both spatial and temporal domains can provide invaluable information for regulating and managing agricultural and municipal water use. The goal of updating water resource management strategies is to protect the groundwater aquifers from being over-pumped to an irreversible state and to mitigate aquifer salinity. In-land aquifers located in Al Ain and Al Dhaid cities are depleting rapidly and coastal aquifers are experiencing seawater intrusion attributed to the oil industry and agricultural activities [6]. Sherif [3] states that seawater intrusion is the most critical issue to the freshwater aquifers and is highly related directly to pumping, especially for coastal aquifers. The decline of water resources in the UAE is captured by the Gravity Recovery And Climate Experiment (GRACE), twin satellites used to detect a change in groundwater quantity by examining the change in gravity [7,8]. Other advantages of data-informed water resource management include improvement of the water quality, enhancement of the overall health of aquifer systems, and water conservation [6]. Moreover, Ahmed [9] reported that agricultural activities caused a negative impact on water resources in the UAE, and the sector of agriculture needs significant improvement. Implementation of methods that minimize water consumption such as using advanced irrigation technologies, construction of groundwater-recharge dams, and growing salt-tolerant crops will need accurate hydrometeorological data.
Furthermore, studies have shown that there is a strong link between different ecosystem variables and precipitation trends. Stefanidis [10] showed that the soil erosion decreased significantly as the precipitation decreased by 15% and temperature increased by 5% over two decades over mountainous catchment in central Greece. Zhang [11] employed satellite-based evapotranspiration (ET) estimates and precipitation to assess the regional water balance over the pan-Arctic basin and Alaska. They reported that the ET exhibited positive trends over most of the region; however, areas (32%) occupied by boreal forests showed negative ET trends.
In general, there are fewer hydrometeorological studies conducted over arid and semi-arid regions than over other regions of the world due to the scarce amount of rainfall and the very limited distribution of rain gauges. A number of studies examined the rainfall trends in the UAE using rain gauge data (e.g., Ouarda [12], Merabtene [13], and Donat [14]). Ouarda [12] found that the rainfall time series data of four rain gauges in the UAE showed a significant downward shift in 1999 with increasing trends before and after the shift. This observation was also supported by Merabtene [13] who found a significant breakpoint in the time-series of another rain gauge in Sharjah in 1998. These studies also found that the amount of average annual rainfall in the early 21st century was much lower than the average annual rainfall of the final decades of the 20th century in all the stations. This reduction was attributed to the significant drop in winter rainfall. These studies highlighted a need for reevaluating the current status of the water resources and the urge for developing an integrated framework for water resources planning. From a regional perspective, the spatial distribution of the trend of extreme precipitation events indicates that the eastern Middle East and North Africa (MENA) region is projected to have a drier climate whereas the western region is expected to experience wetter conditions [14]. Most of the studies conducted over the MENA region indicated that precipitation was decreasing in most of the rain gauges during the 20th century. Sixty-seven percent of the 145 rain gauges studied by Modarres [15] showed a decreasing trend in annual precipitation even though only 19% showed a significant negative trend. Törnros [16] found that only 14% of the 37 stations displayed a statistically significant negative trend in the southeastern Mediterranean region, and Kwarteng’s [17] analysis of data from 31 stations revealed a decrease in rainfall over Oman but no significant negative trend. Another study conducted in the mountainous range of Central Pindus (Greece) indicated that the annual precipitation showed a negative trend on average in nine rain gauges over the last half-century [18]. Analysis of the spatial and temporal distribution of 559 stations spanning from 1917 to 2006 in southern Italy revealed a significant reduction of precipitation in the winter months while showing a relatively smaller rate of increase in summer months [19]. These and other studies indicate that the water resources in the region are declining.
In the last two decades, remotely sensed precipitation products have played a vital role as reliable input for weather forecasts and hydrologic models. The products helped to improve the outcome and accuracy of the models because of their spatial and temporal coverage and resolution. Moreover, the quality of remotely sensed products has been improving over time [1,7]. Their temporal and spatial resolutions have become finer and have emerged as competitors to the conventional methods i.e., rain gauges. Currently, there are two main techniques of remotely sensed precipitation estimation, namely weather radar measurements and satellite estimates [20]. Satellite-based products have an advantage over radar data as they are not susceptible to obstruction caused by topography or other physical barriers, and due to their global coverage, uniform spatial distribution can be achieved (not range-dependent). Hydrologic application of these products includes flood forecasting and mitigation, designing hydraulic structures, emergency response systems (during extreme events), and many other applications [21]. Sorooshian [22] emphasized the importance of precipitation remote-sensing products and predicted that the resolutions of 4 km and 30 min with reasonable accuracy could be attained in the near future. All of the validation studies conducted on satellite-based precipitation lauded their potential. However, they all agreed that the accuracy of the precipitation products was not consistent for different regions and climatic conditions.
The Integrated Multi-Satellite Retrievals for the Global Precipitation Mission (GPM) algorithm (IMERG), one of the most highly cited satellite-based precipitation products, was identified by many researchers as one of the most accurate data products. Li [23] concluded that the IMERG product performed best after examining five satellite-based precipitation products over mainland China using a gridded, ground-based precipitation product compiled from 2400 rain gauges as a ground reference. A similar study over the same region (China) by Tang [24] found that the latest IMERG product was outperforming all other eight products assessed in the study. The climate prediction center Morphing technique (CMORPH), another highly cited precipitation product, was found to be the second-best product. Alsumaiti [25] concluded that IMERG had a slightly higher correlation with ground records of 71 stations in the UAE than the CMORPH. In a few other studies, the conclusion was the opposite, citing that CMORPH was outperforming IMERG, especially the latest version of CMORPH. Li [20] reported that the correlation between a rain gauge network and CMORPH was the highest amongst the four satellite-based products (CMORPH, PERSIANN, IMERG, and TRMM Multi-satellite Precipitation Analysis (TMPA)) over the Yangtze River in China. Duan [26] also noted that CMORPH was the best product over the Adige Basin in Italy. Precipitation Estimation from Remotely Sensed Information using Artificial Neural Networks (PERSIANN), another widely used satellite-based precipitation product, tended to overestimate the rain events in arid and semi-arid regions in some studies [27,28]. IMERG products apparently show a significant improvement in detecting and capturing the storms over time as noted by Asong [29] in Southern Canada; Sungmin [30] in Southeastern Austria; Khodadoust Siuki [31] in Iran; and Wang [32] in South China. This advancement is attributed mainly to the improvement of the algorithms, the finer resolution, and the integration of ground measurements.
Arid and semi-arid regions lack comprehensive high-resolution spatial and temporal analysis of precipitation. The advancement in remote-sensing-based precipitation products and the accumulation of long enough records trigger the question of how useful the products are in time-series analysis. The main objectives of this research are to (1) investigate the long-term (2003–2019) trends of precipitation over the UAE; (2) assess the ability of satellite-based precipitation products to detect trends compared to ground observation; (3) explore the spatial distribution of precipitation frequency using satellite-based precipitation products; and (4) evaluate the seasonal variability of the precipitation quantity and frequency over the UAE. The products used in this research are the latest versions of the GPM-IMERG, CMORPH, and PERSIANN-Cloud Classification System (PERSIANN-CCS). Statistical analysis of single-time change-point detection is carried out using Pettitt’s change-point detection test. The existence of trends and their significance are also investigated using the Correlated Seasonal Mann–Kendall Trend Test. Lastly, Theil–Sen’s slope test is employed to estimate the magnitude of the trends in the precipitation data.

2. Study Area and Dataset
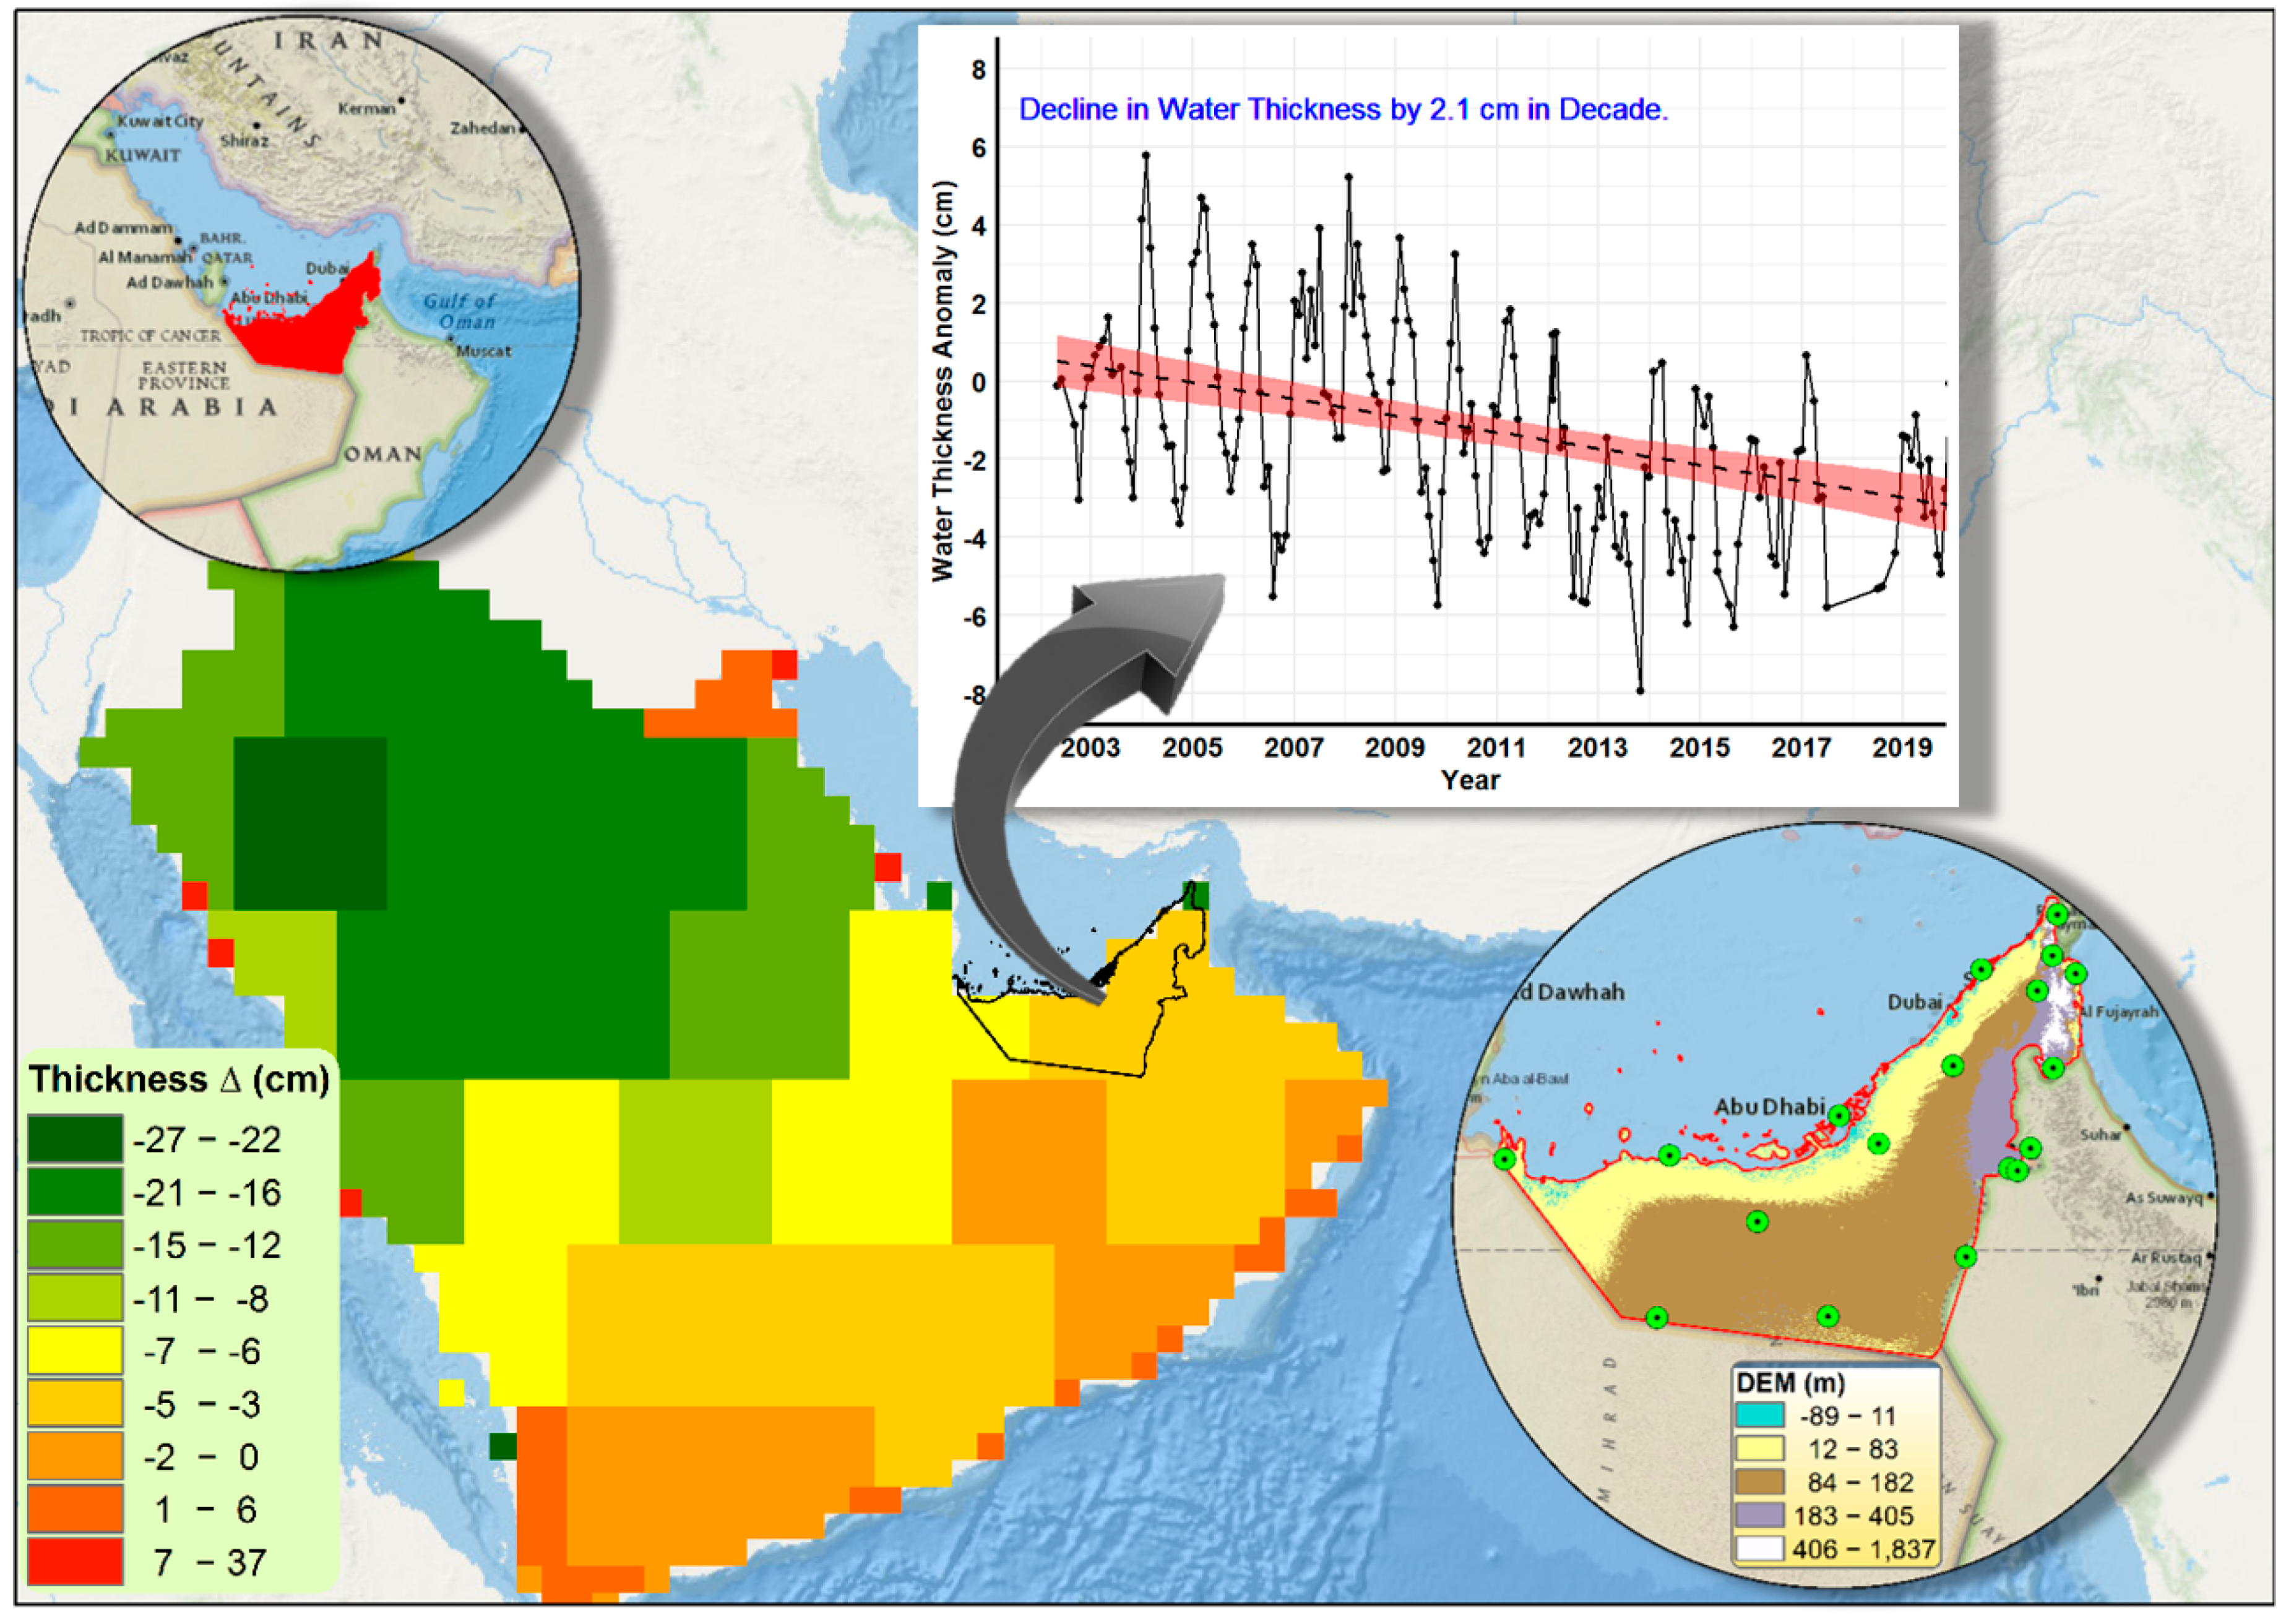
2.1. Study Area

The study area (Figure 1) is the entire UAE, an oil-rich country, located in the Southeastern part of the Arabian Gulf, which encloses the country from the north. The rest of the country is bounded by the Kingdom of Saudi Arabia to the South and the West, and Oman to the North and the East. The country covers an area of 83,600 km2 with a coastal stretch of 650 km along the Arabian Gulf and 90 km stretch along the Gulf of Oman [33]. The climate of the entire country is categorized as an arid desert with hot air (BWh) according to Köppen climate classification. The average monthly temperature reaches its maximum of about 40.3 °C in August, as reported by the National Centre of Meteorology (NCM). The mountainous areas experience relatively cooler temperatures with near-freezing temperatures during the winter. Humidity can reach as high as 95% during late summer due to humid southeasterly winds. The topography of the UAE consists of flat plains in the coastal and the Western portions and Al Hajar Mountain chains that run along a North-South direction extending to Oman with a peak altitude of 1800 m [34]. The rainy season in the UAE begins in November and ends in April. UAE’s precipitation has a sporadic spatial distribution ranging from 40 mm in the Southern desert region to 160 mm in the Northeastern mountains [35]. However, recent studies reported that the annual rainfall of the country experienced a downward shift in 1999, and the average rainfall has decreased when compared to annual rainfall before the shift [9,12,36]. The country’s aquifers are composed of interior heterogeneous sand aquifers, gravel aquifers in the Eastern and Western plains, and coastal and limestone aquifers [37]. The limited UAE agriculture industry is largely dependent on groundwater and the major arable land is located in the northeastern region. Data downloaded from the Gravity Recovery and Climate Experiment (GRACE) satellite mission data portal (https://grace.jpl.nasa.gov/data/get-data/monthly-mass-grids-land/ Accessed on 20 March 2021). show that the groundwater resource is depleting at an alarming rate across the Arabian Peninsula (Figure 1). The UAE alone experienced a decline rate of more than 2.1 cm on average in water equivalent thickness per decade over the last one-and-a-half decades. This depletion alone warrants revisiting the current water resources management practices and conducting research that can inform viable updates before irreversible damage is done to aquifers health.

2.2. Data

2.2.1. Rain Gauge Observations

The datasets used in this study include precipitation data that are collected by both conventional and non-conventional methods. The time frame of the study spans from January 2003 to December 2019. A network of 18 rain gauges obtained from the National Center of Meteorology agency of the UAE were employed. The gauges report rainfall measurements electronically with a threshold of 0.2 mm and with a temporal resolution of 15 min. The rain gauges automatically log the data to a central database where the quality of the dataset is verified by the NCM. The spatial distribution of the rain gauge stations over the country can be seen in Figure 1. The rain gauge product is usually disseminated as daily and monthly gauge accumulations. Monthly data were used in the trend analysis. The annual rainfall time series of the rain gauges show that rainfall follows a three- to four-year cycle (Figure 2A), and rainfall has been increasing in the later years of the study period. The monthly average distribution of the rainfall from the rain gauges reveals that the rainy season in the UAE starts around October and continues all the way to April spanning about six months (Figure 2B). The average annual rainfall from all 18 rain gauges was around 63 mm with a median of 47 mm. The maximum annual rainfall was observed by a station located in Khatam Al Shaklah (located on the Al Hajar Mountain chains) with an annual average rainfall of 128 mm. The lowest annual rainfall was reported in Alqlaa (located on the west coast) with average annual cumulative rainfall of only 23 mm over the last 17 years (2003–2019). Surprisingly, there were only three stations that reported an annual average rainfall of more than 100 mm out of 18 stations.

2.2.2. GPM’s IMERG

GPM produces multiple levels of IMERG. The Early run product is near real-time and has a latency of four hours whereas the Late level has a latency of twelve hours. The Final run version differs from the other two due to its use of gauge analysis correlation and a latency period of two months post-observation. The final version is thought to have the highest accuracy [38]. The IMERG Final run product has a 0.1° × 0.1° spatial resolution and a 30-min temporal resolution. The product can be downloaded from http://pmm.nasa.gov/data-access/downloads (Accessed on 18 April 2020). IMERG produces the data by calibrating, combining, and appending the microwave-calibrated infrared (IR) satellite estimates with the satellite-based microwave estimates [38]. The final run product has been upgraded to broaden the maximum rainfall threshold fourfold (initially at 50 mm/h, and now at 200 mm/h). This newer version also includes full inter-calibration of the GPM combined instrument dataset, the introduction of a new rain retrieval algorithm, and the incorporation of data from the Advanced Technology Microwave Sounder (ATMS). Starting with the sixth version, IMERG began integrating estimates from the Sondeur Atmosphérique du Profil d’Humidité Intertropicale par Radiométrie (SAPHIR) instrument. This study utilizes IMERGV06B. This product operates with total column water vapor rather than IR data and employs a contemporary time interpolation scheme, which uses modern-era retrospective reanalysis 2 and Goddard earth observing system model (GEOS) forward processing (FP) [39]. For more information on IMERG and other GPM products, refer to the following publications [38,39,40].

2.2.3. CMORPH

There are two CMORPH multi-satellite precipitation products—CMORPH-V0.x, and CMORPH-V1.0. CMORPH-V1.0 decreases the substantial inhomogeneity seen in the CMORPH-V0.x, introduced through the evolving algorithm, by implementing the same algorithm for the entire timeframe. The older version of the product span 2002 to 2018; however, the newest version includes data from 1998 to the present. In addition to the raw, satellite-only precipitation estimates, CMPORPH-V1.0 includes bias-corrected and gauge-satellite blended precipitation products. For this study, the CMORPH multi-satellite-based precipitation data were downloaded from the official FTP server of the Climate Prediction Center of the National Oceanic and Atmospheric Administration (ftp://ftp.cpc.ncep.noaa.gov/precip/ Accessed on 18 April 2020), and the bias-corrected version of CMORPH V1.0 data with an 8 × 8 km spatial resolution and 30-min temporal resolution were utilized.

2.2.4. PERSIANN

The PERSIANN system for satellite rainfall estimation is maintained by the Center for Hydrometeorology and Remote Sensing (CHRS) at the University of California, Irvine. The PERSIANN precipitation retrieval algorithm was based on geostationary infrared images (GOSE 8, GOSE 10, GMS, METEOSAT 6, and METEOSAT 7) and low-frequency instantaneous rain derived from a microwave imager [41]. This was later extended to include both infrared and visible imagery [42]. The product employs an adaptive neural network algorithm to integrate information from several satellites. The PERSIANN-CCS product was used for this study. The PERSIANN-CCS product uses a variable threshold for cloud categorization while the traditional model uses a constant threshold approach. The categorization of the clouds is done using cloud height, areal extent, and variability of texture estimated from satellite infrared images. The individual patches can then be classified based on texture, geometric properties, dynamic evolution, and cloud top height. These classifications help in assigning rainfall values to pixels within each cloud based on a specific curve describing the relationship between rainfall rate and brightness temperature. PERSIANN-CCS is available at different temporal resolutions starting from 1 h and 0.04° spatial resolution with total spatial coverage from 60° S to 60° N. The timespan of the product starts in 2003 and is labeled as near-real-time with a latency that ranges between 1–3 h. The data are available to the public and were retrieved from the CHRS FTP server at the following link (ftp://persiann.eng.uci.edu/CHRSdata/PERSIANN-CCS/hrly/ Accessed on 18 April 2020).

3. Methodology

3.1. Precipitation Duration Analysis

Precipitation frequency analysis helps in answering two important questions: How often does it rain in the UAE and how much? Such knowledge is crucial in water resource management and the agricultural sector because the amount and timing of irrigation and fertilization depend on rainfall timing [43]. This will shape policies that affect water resource management strategies on a long-term basis. The analysis is carried out on an annual basis, which means that the percentage of rainy hours over the year at a specific location is calculated from the hourly precipitation data. Analysis over a long period (17 years) will provide an approximate estimation of the number of hours it rains annually at a specific location. Moreover, the seasonal rainfall frequency was also estimated using similar procedures to capture the variability of the rainfall frequency across the seasons [44]. The analysis was carried out at the pixel scale to capture the spatial variability and areal averaging was used to capture the temporal variability of the annual hourly rainfall frequency.

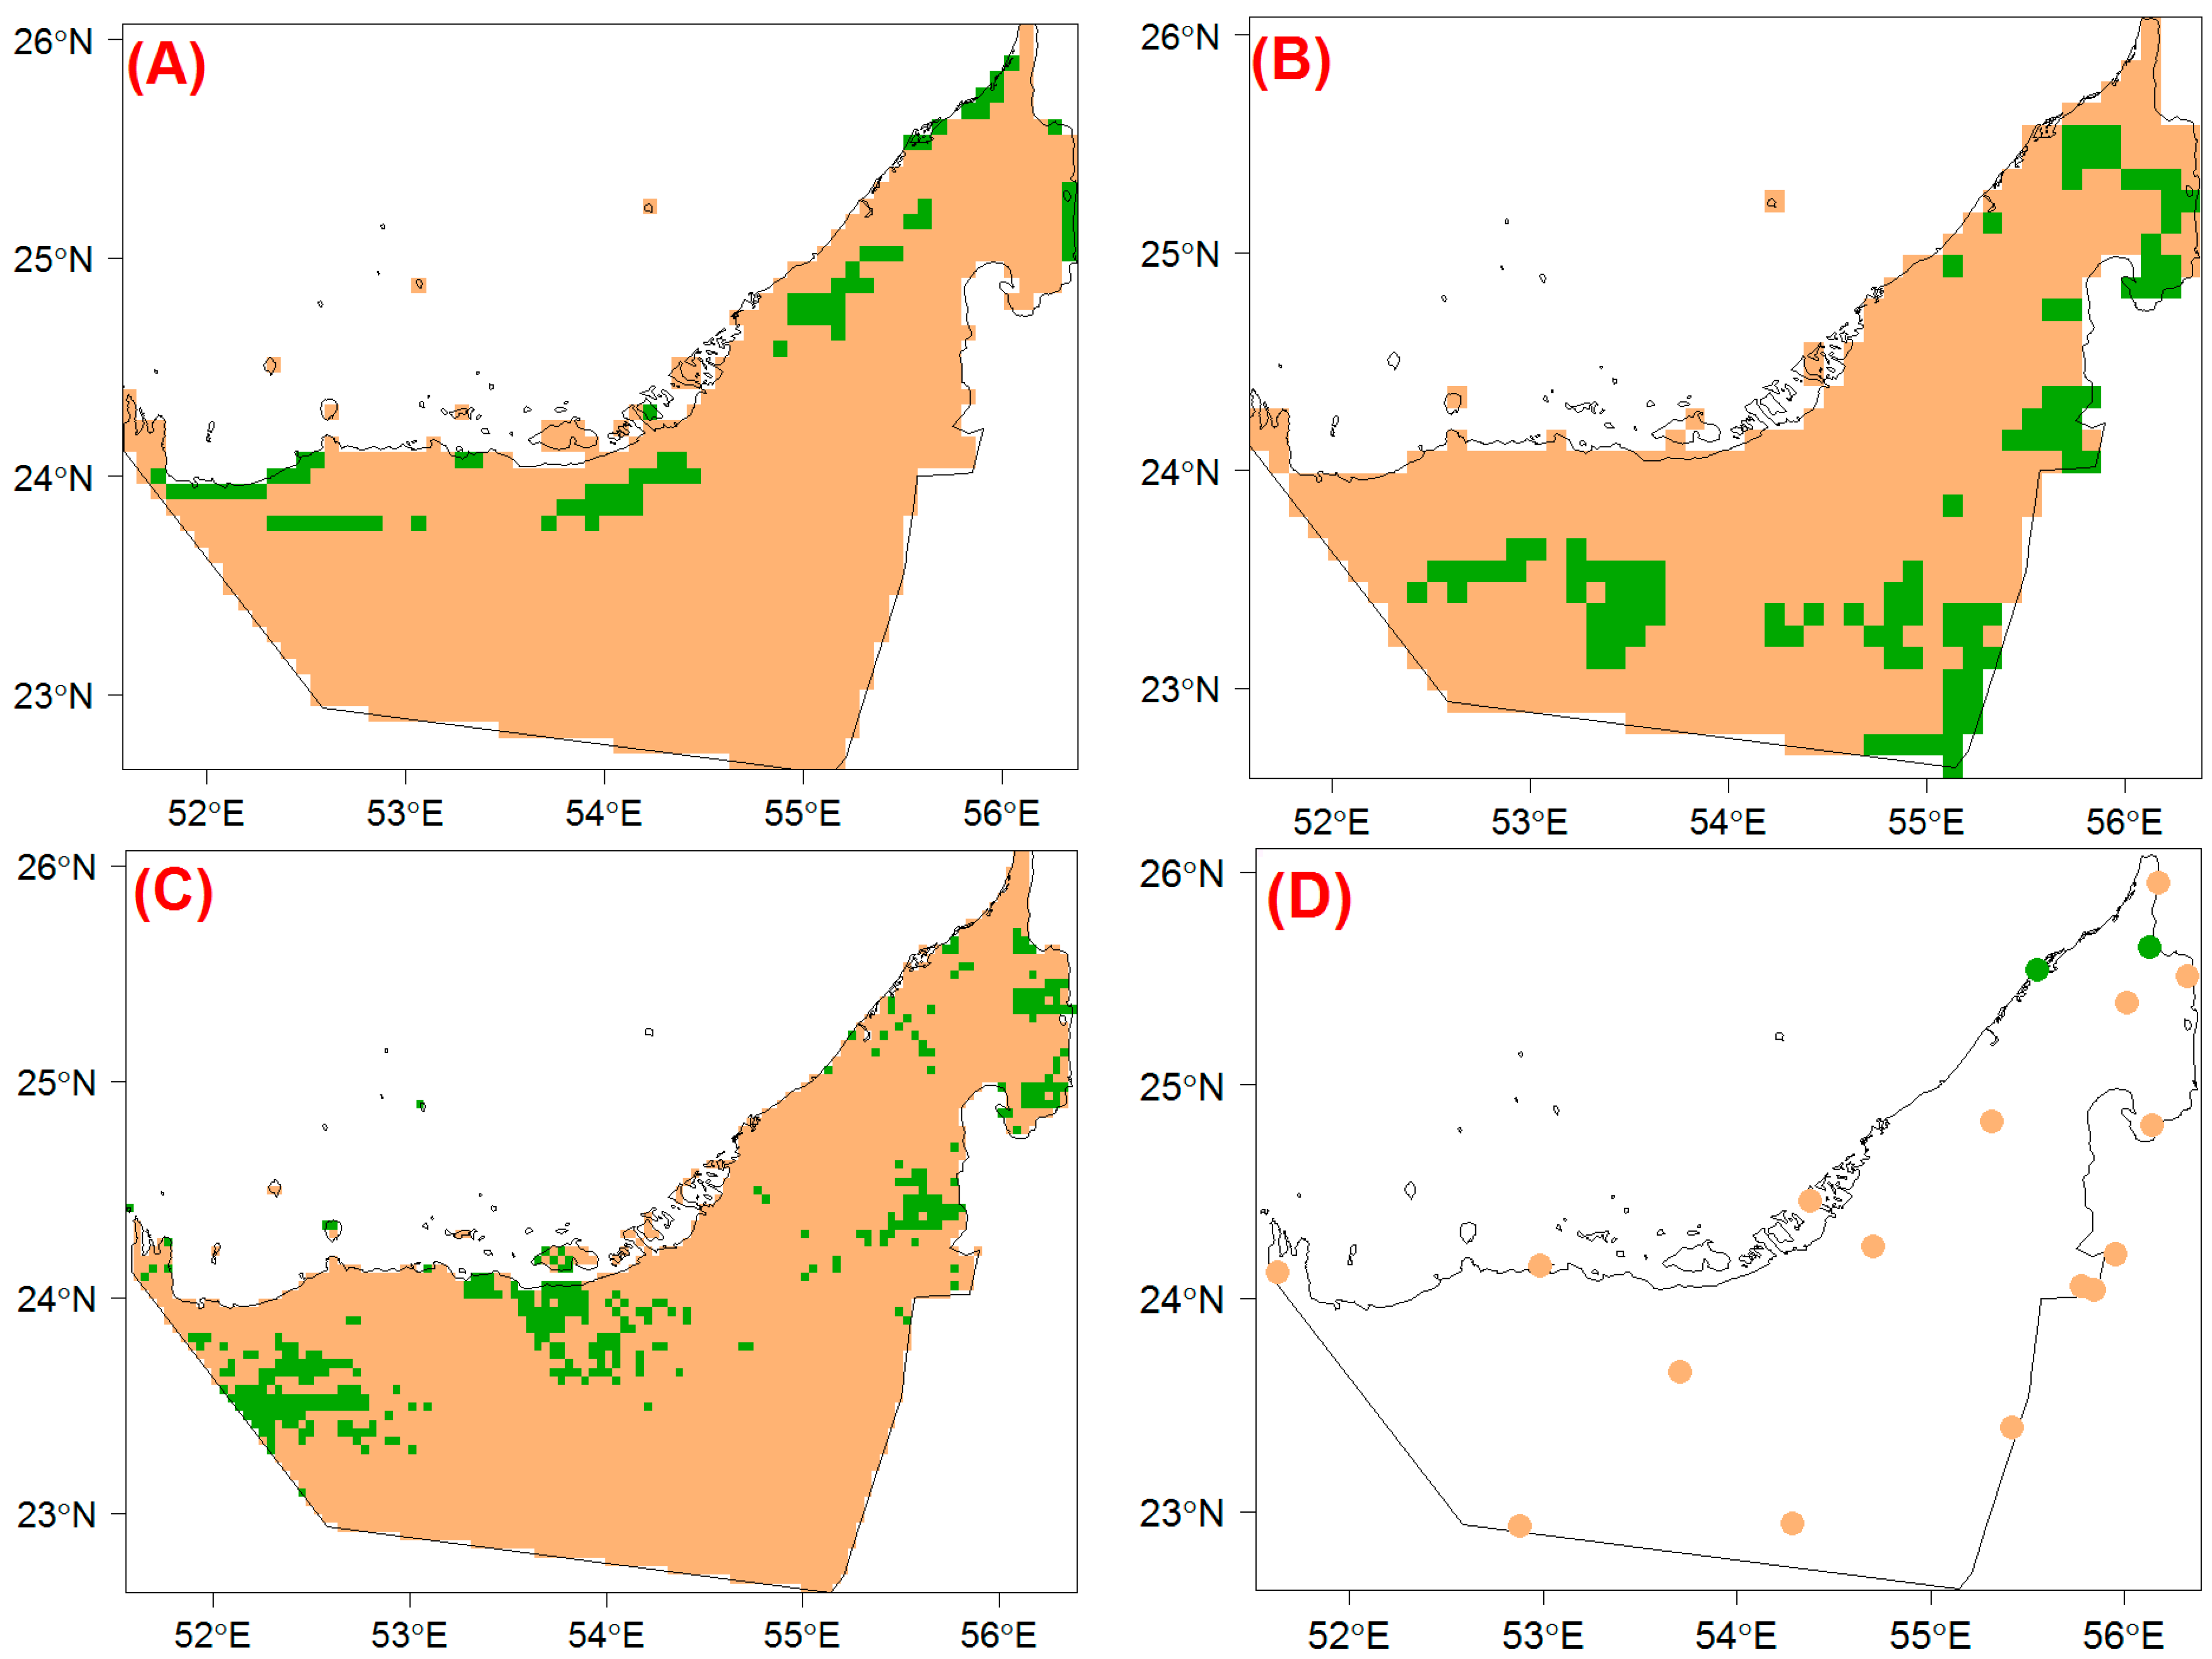
3.2. Pettitt’s Test for Change-Point Detection

Pettit’s test, developed by Pettitt [45] for change point detection, is one of the best tools used to capture a single time change-point in continuous climatic time-series data. One of its main advantages is that it is non-parametric and can be applied to any time series without studying its distribution. The null hypothesis for the test is that the series is homogenous (the data are from the same distribution), and the alternative hypothesis will be the homogeneity of the series breaks at some point in the series. The ranking function in the test is implemented as given by Verstraeten [46]. The ranks of r1, r2, r3,….,rn of the series x1,x2,x3,….,xn are used in the static equation below:
U t , T = i = 1 t j = t + 1 T s g n X i X j
The test statistic is the maximum of the absolute value of the series Uk, which is computed as follows:
K T = m a x U t , T
The change-point of the series is located at KT, if the statistic is significant. The approximate probability for a two-sided test is calculated according to the following equation:
p = 2 × e x p 6 K T 2 T 3 + T 2

3.3. Correlated Seasonal Mann–Kendall Trend Test

The Correlated Seasonal Mann–Kendall Trend test is an extension of the normal Mann–Kendall test, which is adjusted for the seasonal correlation of the months due to the presence of autocorrelation in the dataset. In this study, the adjustment used by Hirsch [47] and Libiseller [48] is employed. The Mann–Kendall scores are first computed for each month separately as follows:
S i = k = 1 n i 1 j = k + 1 n i sgn x ij x ik
where xij and xik are monthly series values for the periods of k and j, respectively, and i represent the month. The variance for each month is given by:
Var S i = n i n i 1 2 n i + 5 p = 1 g i t ip t ip 1 2 t ip + 5 18
where g i is the number of tied groups for the i t h month and ‘ t ip ’ is the number of observations in the p t h group for the i t h month. Then the Mann–Kendall score ( S ) and variance ( Var S ) for the entire series are computed as follows:
S = i = 1 m S i
Var S = i = 1 m Var S i
where S i is the Mann–Kendall score of the individual month and m is the number of months, which is 12 for this case (the number of months per year). Similarly, Var S is the variance of individual months and m is the number of months. Finally, the Seasonal Adjusted Mann–Kendall test statistics for the series ( Z MK ) is given by:
Z MK = S 1   VAR S         i f   S > 0                 0                           i f   S = 0 S + 1   VAR S         i f   S < 0

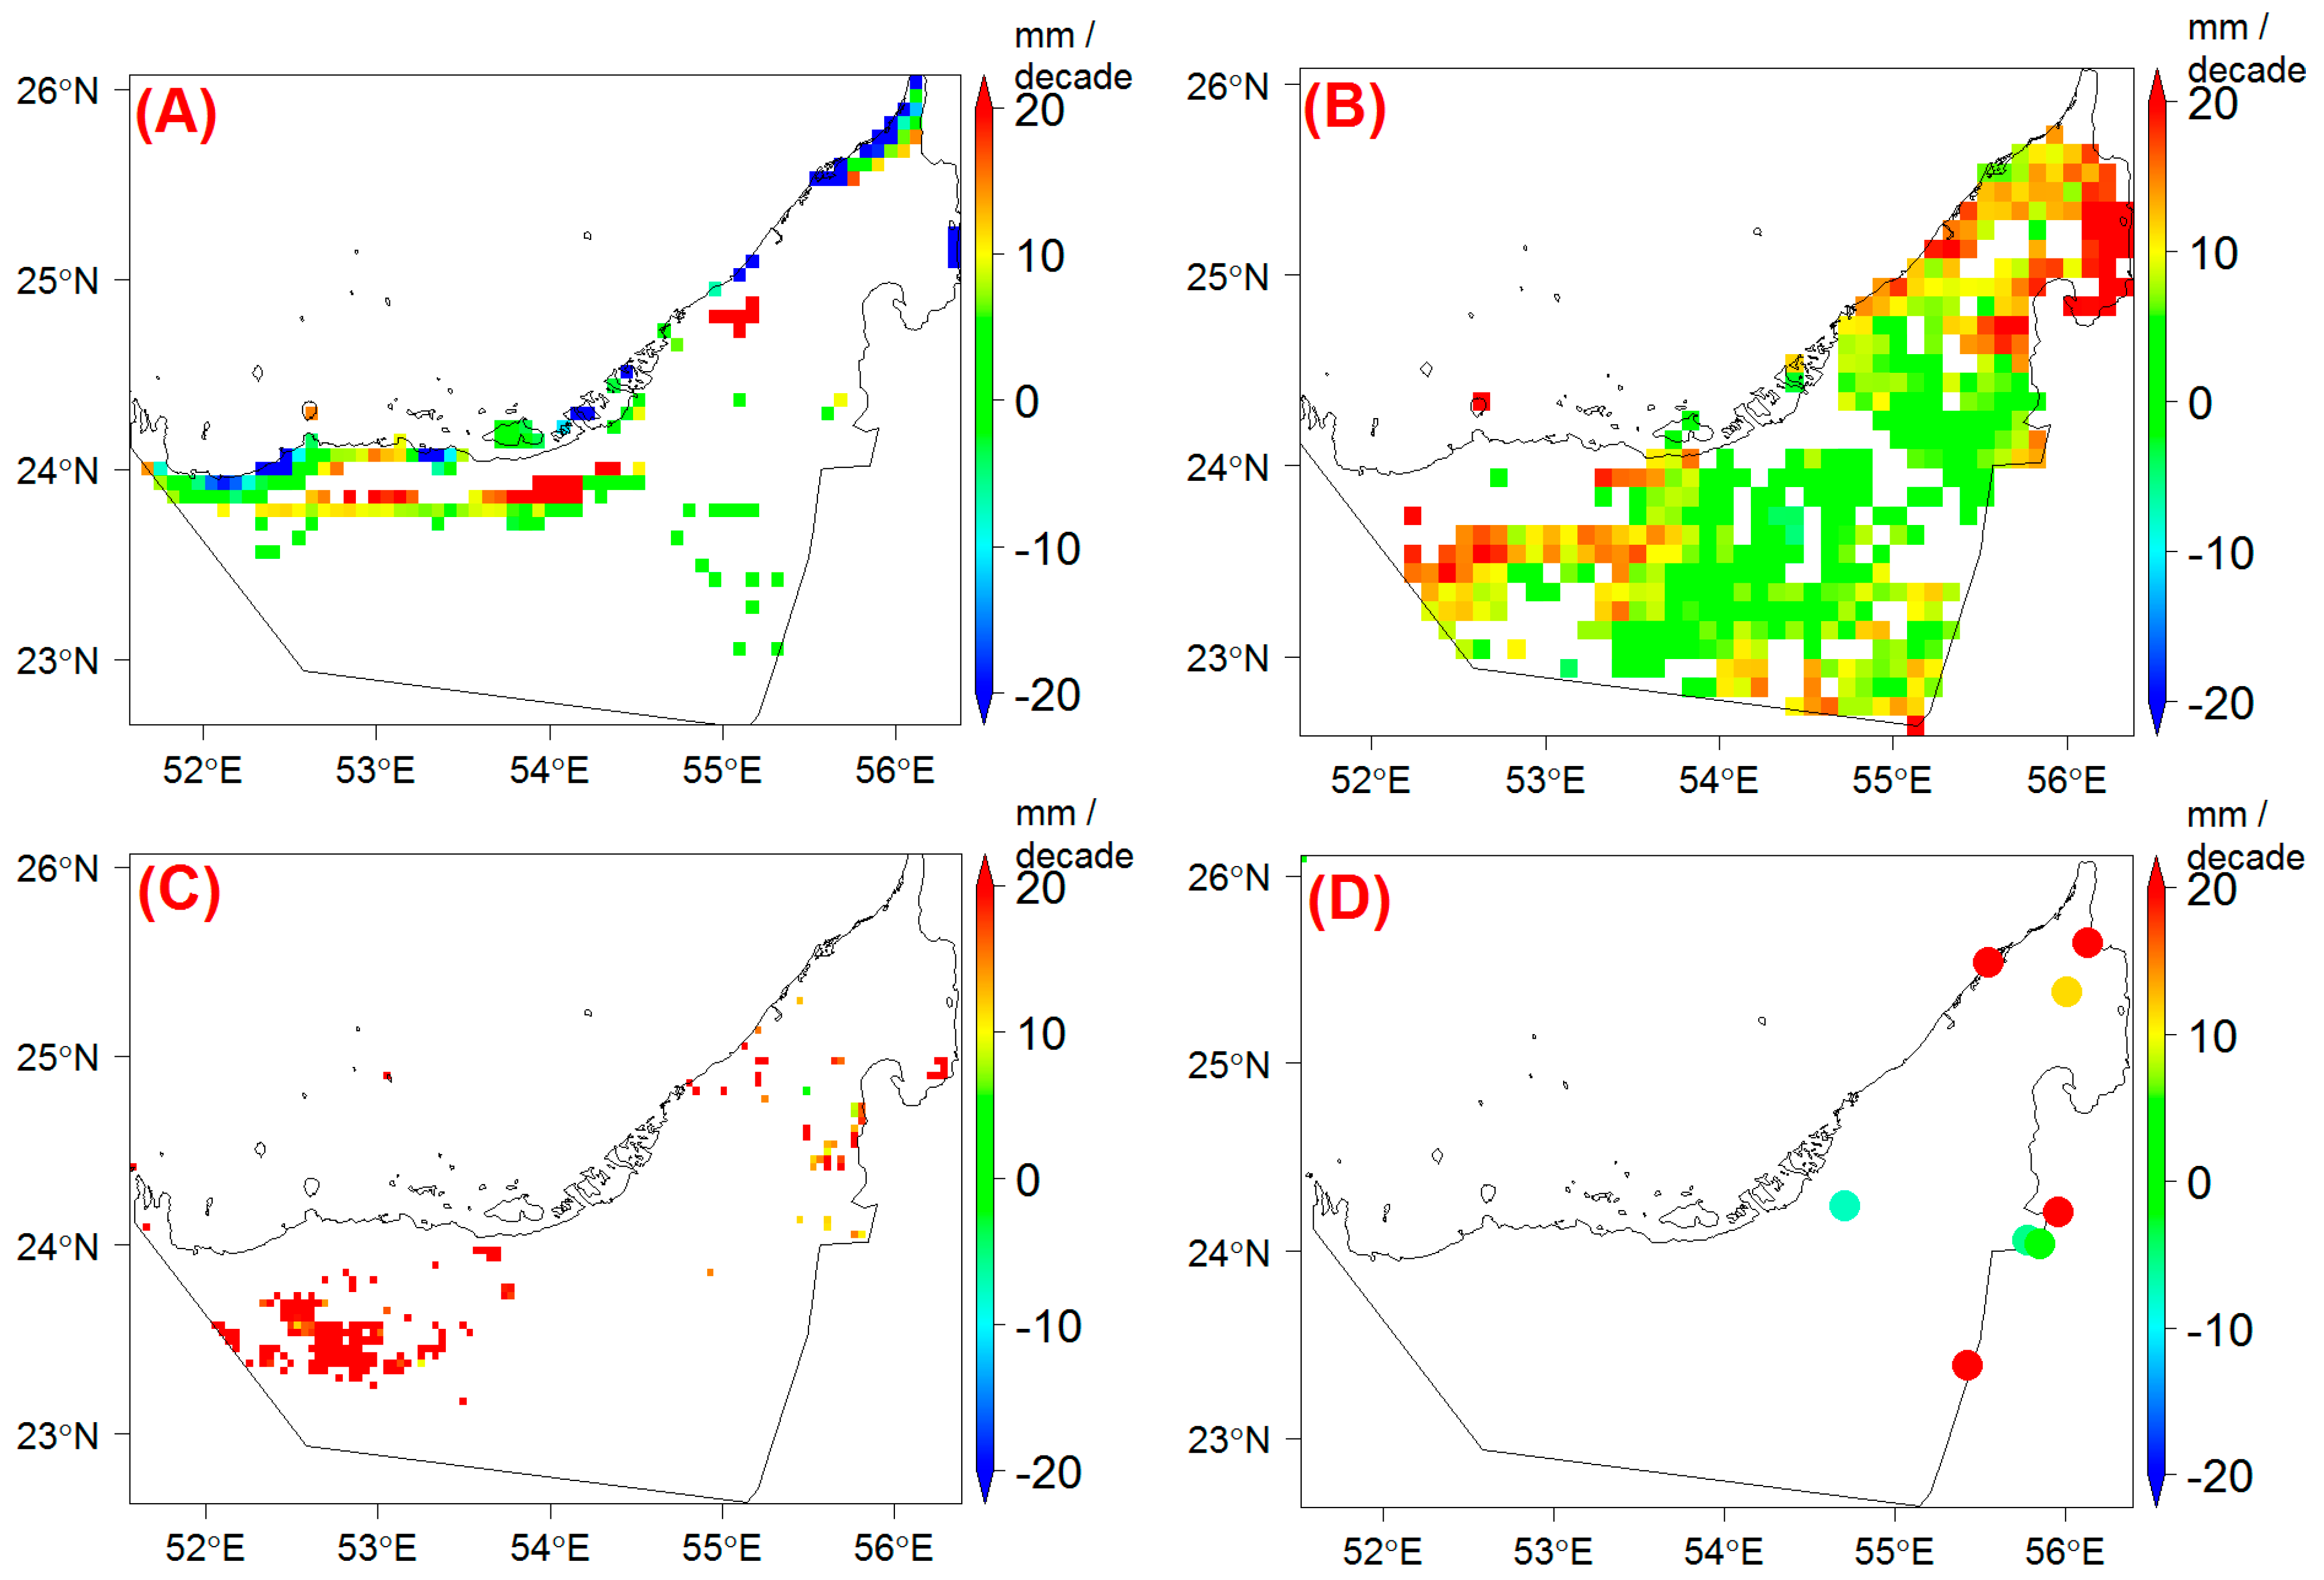
3.4. Theil–Sen’s Slope Estimator

Theil–Sen’s slope test is used to investigate the null hypothesis that the slope (i.e., the linear rate of change) is not significantly different from zero against the alternative hypothesis that states the slope is significantly different from zero. This slope estimator is relatively resistant to outliers because it uses the median slope. The magnitude of the slope was estimated using a method from Theil [49] and Sen [50]. This trend test was employed in detecting trends in precipitation, temperature, evapotranspiration, and groundwater [12,51,52,53].
The Theil–Sen method considers a series of x1, x2, x3, …, xn and the rate (slope) b k , can be calculated as:
b k = x j x i j i
For 1 i < j n , where b k is the slope, x is the variable, n is the number of the series. Then sen’s slope is estimated to be the median of the b k series.

4. Results and Discussions

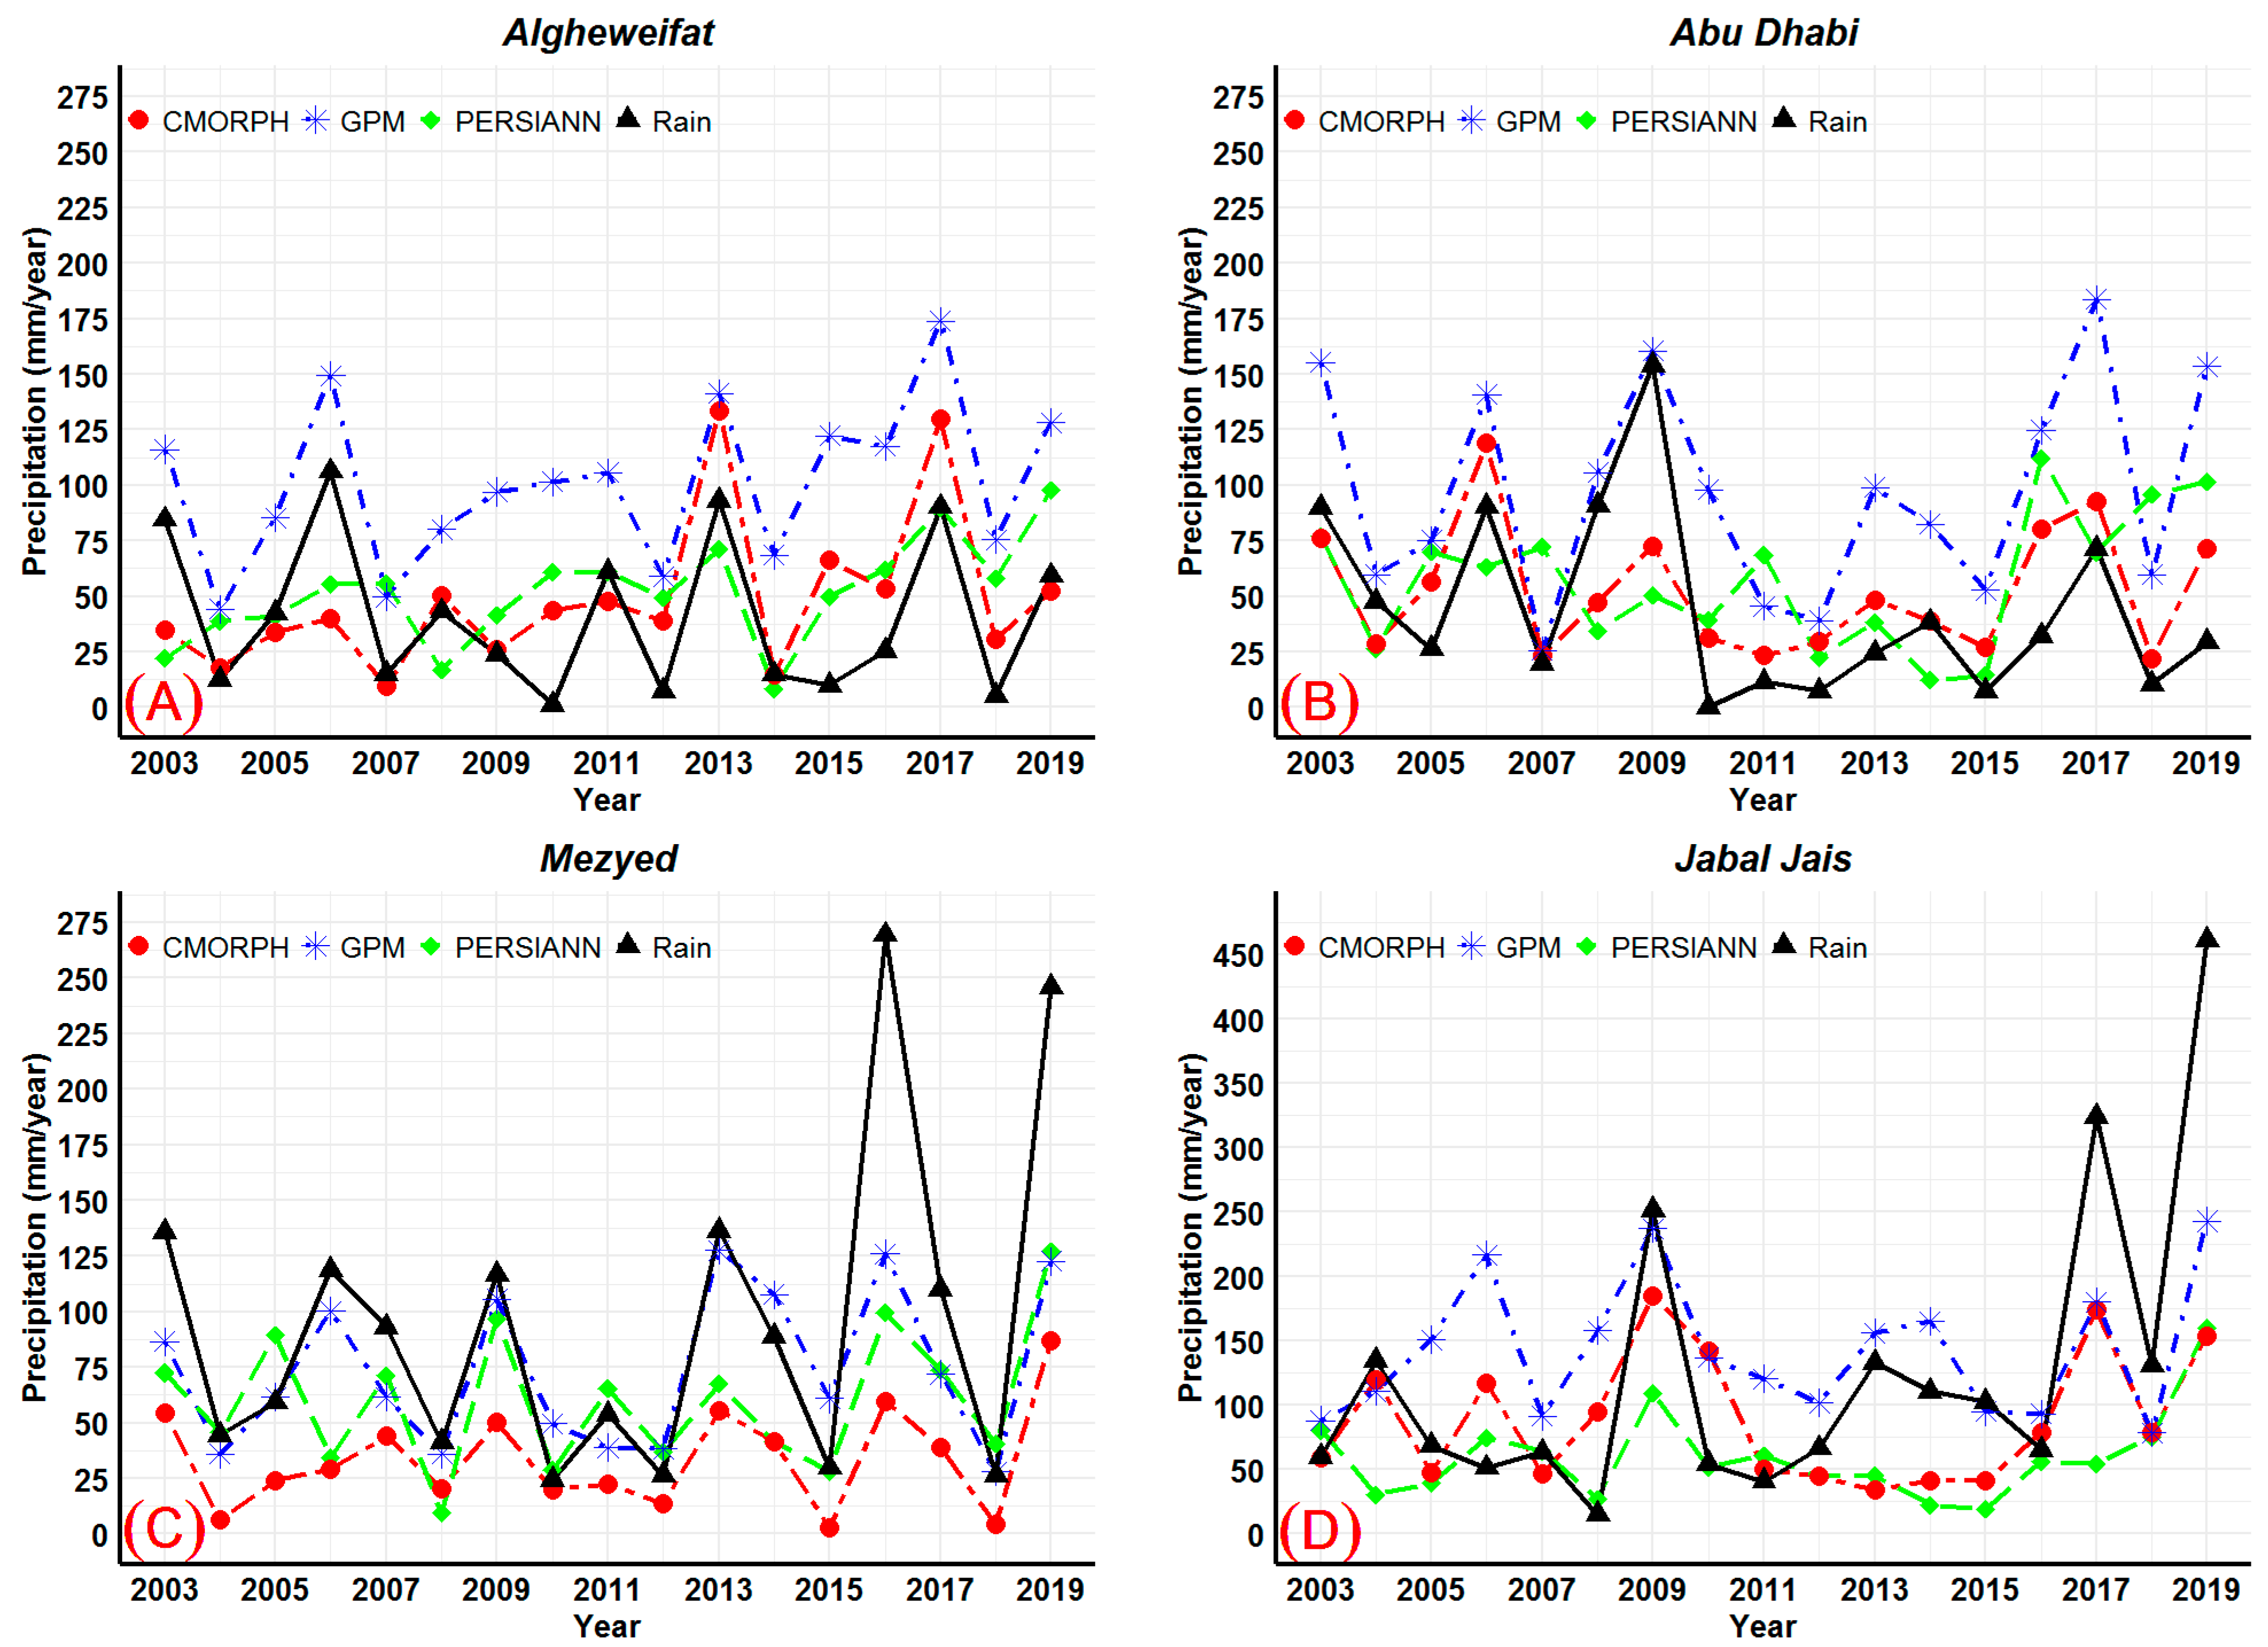
4.1. Annual Cumulative Precipitation

The annual areal average of rainfall over the UAE and its linear trend from all satellite products and rain gauges can be seen in Figure 3. The areal average from all products shows a positive linear trend with the highest rate of increase observed in the rain gauge observations (Figure 3D). However, this result might be biased because most of the rain gauges analyzed are located in the Eastern region of the country, which happens to be the wettest part of the study area. The CMORPH product reveals the lowest rate of increase with an increase of 6 mm in annual precipitation per decade (Figure 3A). The lowest countrywide annual average rainfall is estimated by CMORPH with only 37 mm over the 17 years of study whereas the highest annual average was registered by IMERG at 66 mm. This supports the conclusion made by Alsumaiti [25] suggesting that the CMORPH product underestimates precipitation over the UAE. All of these estimates of the annual precipitation from all the products were relatively lower compared to the annual rainfall averages reported in the literature. Even the combined average annual precipitation from all the satellite-based products i.e., 51 mm, is less than half of the previous estimates by Sherif [2] and Sherif [3], which is 110 mm. The reasons for these significant discrepancies could be (1) previous studies were conducted using rain gauges records and uneven distribution of the rain gauges results in an overestimation of rainfall (because many rain gauges are located in the relatively wetter and urbanized areas); (2) the precipitation of the UAE is declining especially when compared to the previous decades as reported by Ouarda [12] and Donat [14]. The increasing trend shown in all the products is in line with the conclusions from Ouarda [12] stating that the rain gauge time-series of the UAE’s rainfall showed an increasing trend even though it experienced a significant downward shift in 1999. The root mean square error (RMSE) of the areal average annual data of the products (compared to rain gauge observations) suggested that IMERG is the best product relatively with the lowest error of 18 mm/year followed by PERSIANN and CMORPH with an error of 26 mm/year and 35 mm/year, respectively. Similarly, a normalized root mean square error (nRMSE) revealed that the IMERG product has the smallest error (16 mm/year), and the CMORPH product has the largest error (30 mm/year). Percentage bias (pBIAS) also confirmed that the IMERG is the most accurate product with only 5% of overestimation. However, both PERSIANN and CMORPH underestimated rainfall by about 20% and 40%, respectively.
The spatial distribution of the average annual rainfall (Figure 4) echoes the aforementioned findings. Generally, the coastal areas were wetter than the in-land areas and the Eastern regions receive significantly higher rainfall than the rest of the country. For spatial comparison, a quarter (25%) of the country received annual precipitation of more than 80 mm as estimated by IMERG whereas only 5% and 0% are estimated to get more than 80 mm by CMORPH and PERSIANN, respectively. The highest spatial variability was also shown in the IMERG product with an inter-quartile range of 35 mm and the lowest variability was estimated by PERSIANN with an inter-quartile range of only 13 mm and a total range of 50 mm (max = 75 mm and min = 25 mm) across the country. The linear model fit of the 18 stations shows that CMORPH and IMERG had a better correlation with a slope of 0.85 and 1.13, respectively. Thus, CMORPH tends to underestimate precipitation. This finding is also in line with the findings of the study of the Alsumaiti [25] that was conducted using 71 stations over the UAE. The PERSIANN product had the weakest alignments with the rain gauges and significantly underestimated the rainfall with a linear model fit slope of 0.72.

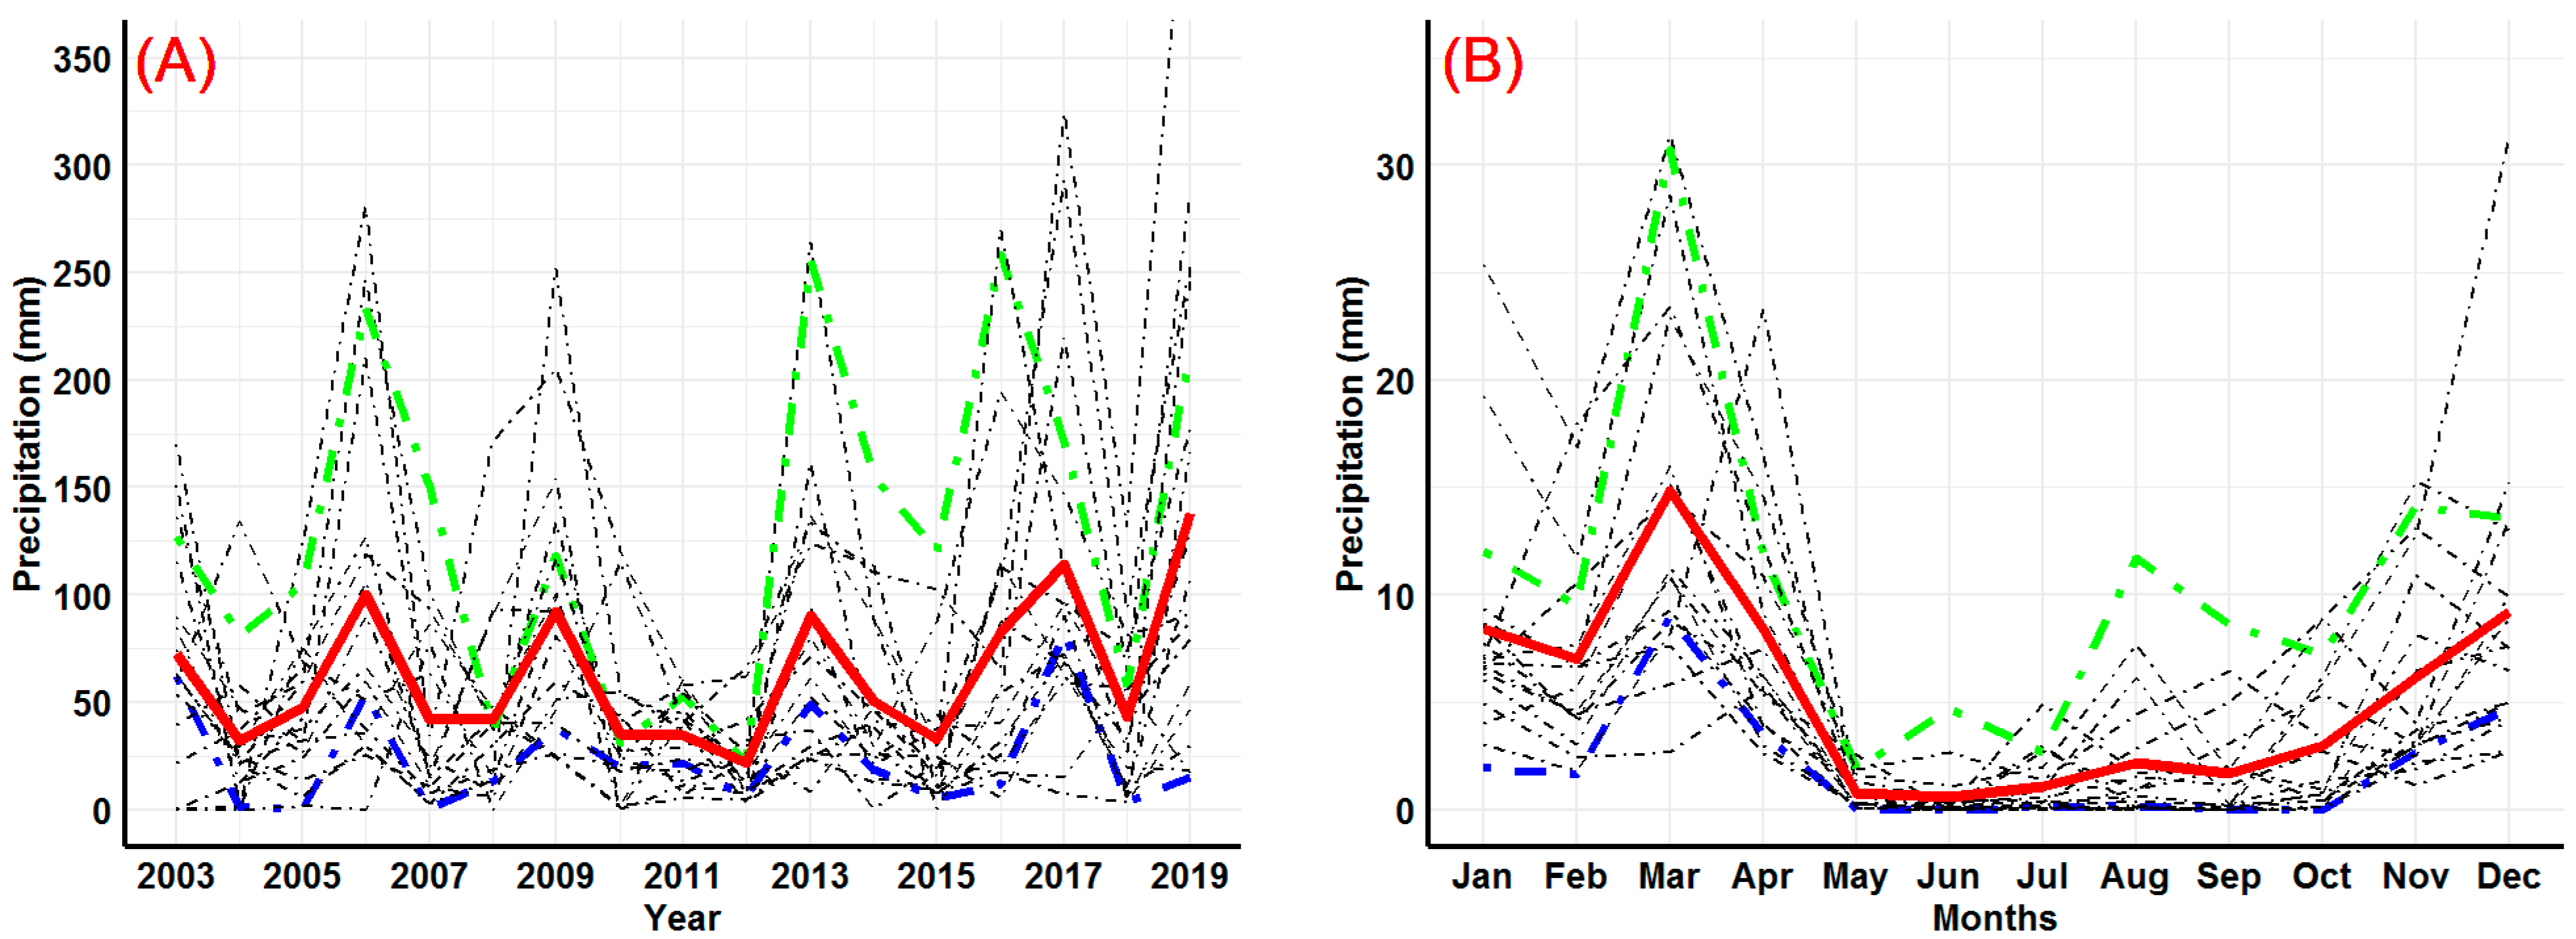
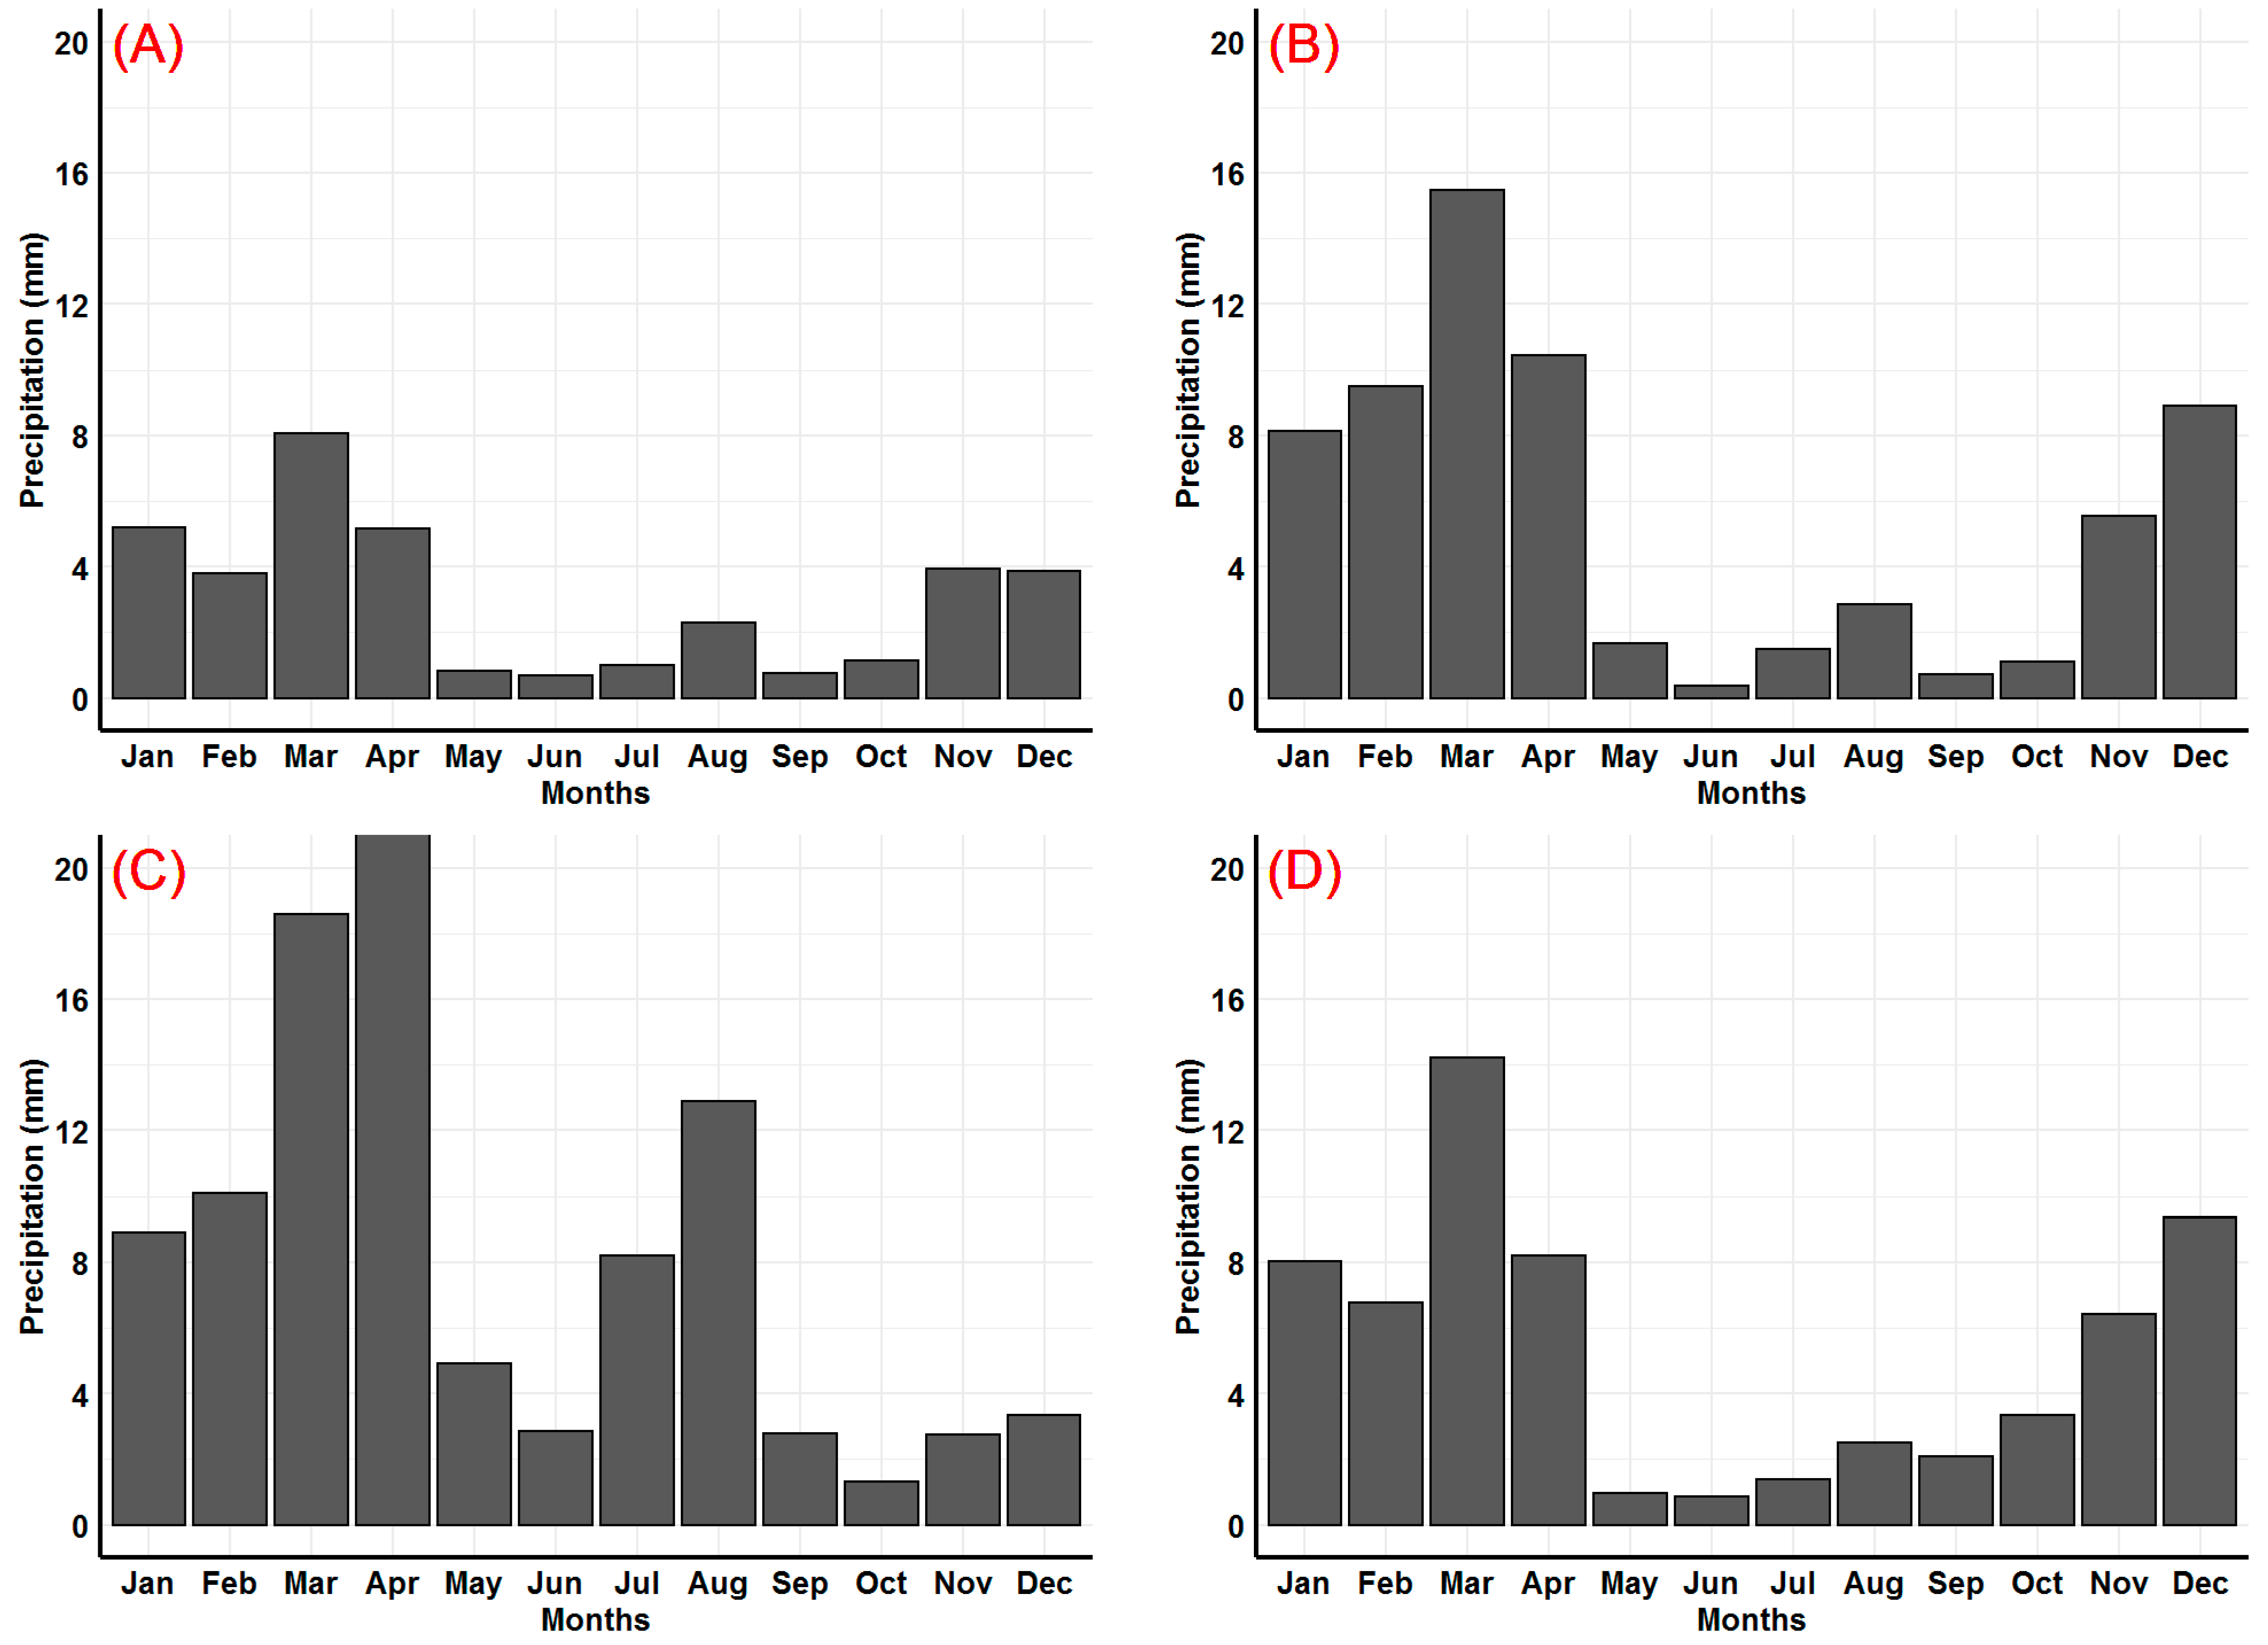
4.2. Monthly Rainfall Variability

The areal average monthly rainfall follows a similar pattern in all the products including the data from the rain gauges (Figure 5). The rain gauge observations show that the wettest month over the last 17 years was March. As shown in Figure 5A,B, a similar pattern of the rain gauges (Figure 5D) is revealed by CMORPH and IMERG. However, PERSIANN presented a completely different picture, showing April to be the wettest month with a significant overestimation of the average monthly rainfall. June is the driest month according to rain gauges, IMERG and CMORPH, but according to PERSIANN, October was the driest month. There is a significant amount of rainfall estimated by PERSIANN in August (12 mm) that is not seen in the rest of the products even though a small hump in August relative to the summer months was observed. The RMSE of the monthly average shows that GPM is the best product with an RMSE of 1.4 mm/month followed by CMORPH at 3.0 mm/month and PERSIANN at 6.5 mm/month. These results support the outcomes from previous studies reported by Alsumaiti [25] and Wehbe [33], which indicated that IMERG was better than CMORPH. Overall, slight overestimation and slight underestimation are observed for IMERG and CMORPH, respectively, with similar distribution compared to the rain gauges. However, PERSIANN shows a significant overestimation with a completely different monthly distribution. For example, the product estimates a significant amount of rainfall in June and August whereas, in reality, the country is very dry in these months according to rain gauge observations (Figure 5C).

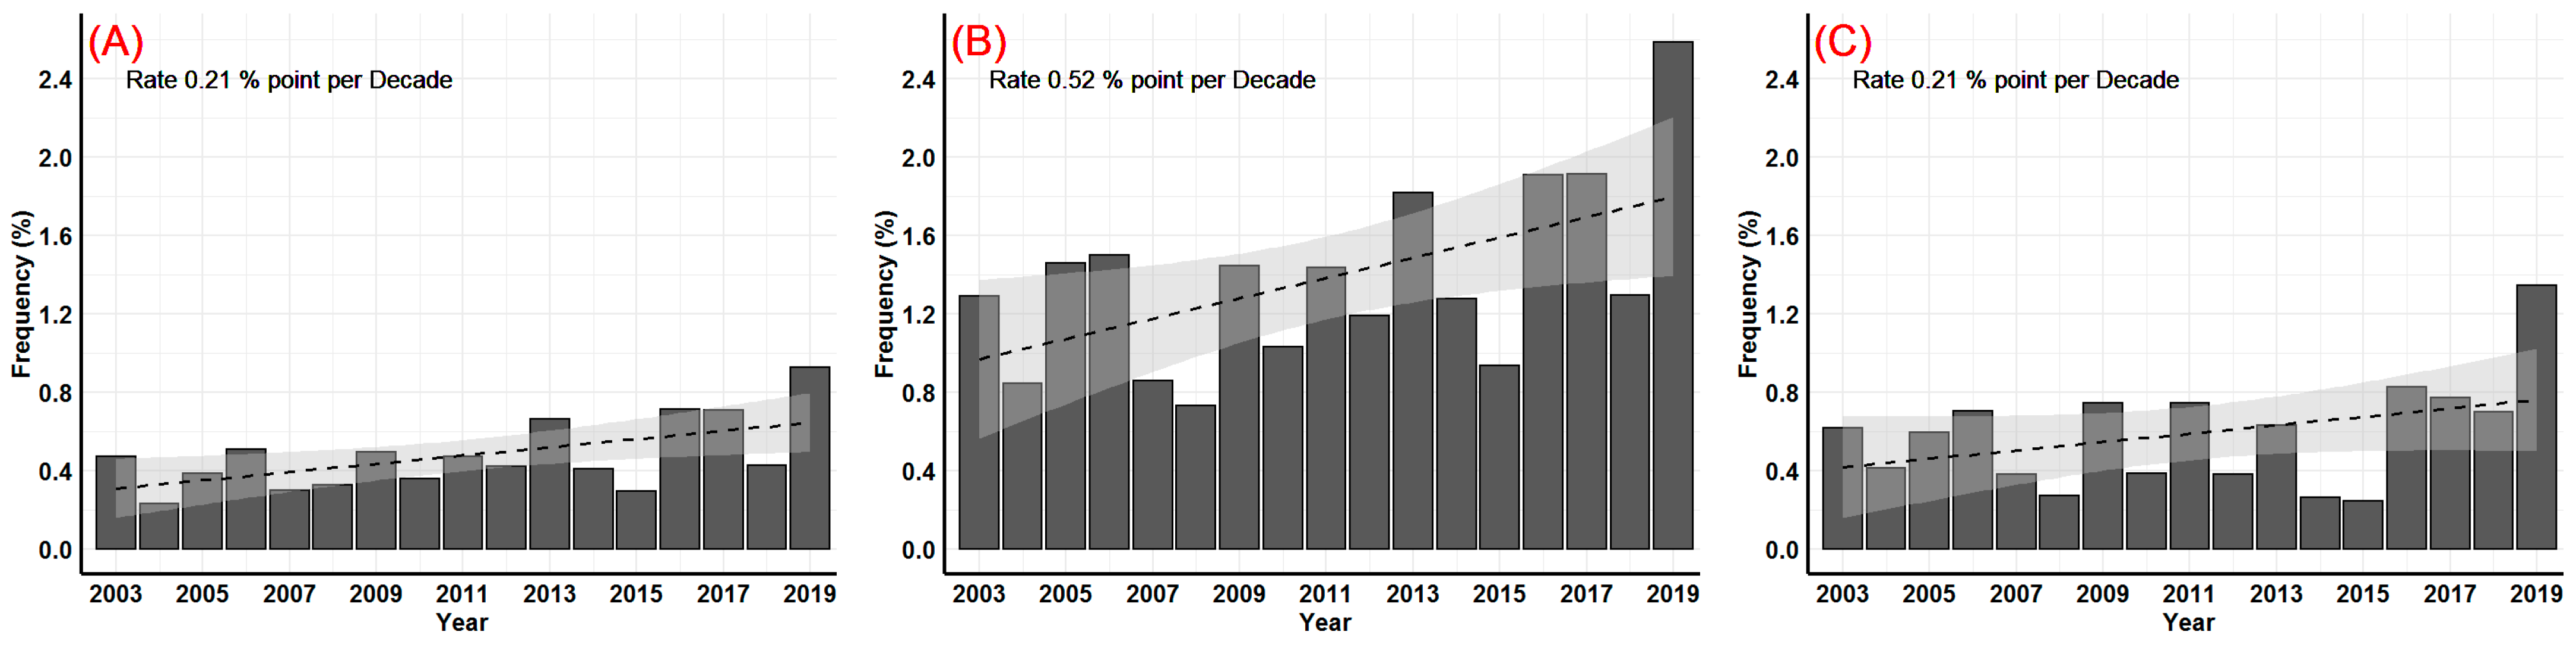
4.3. Precipitation Frequency

The products were used to conduct precipitation occurrence frequency analysis and assess their spatial variability. The areal average rainfall occurrence (wet hours) frequency shows a positive trend in all three satellite products similar to what is observed for the annual average accumulations (Figure 6). The rate of increase of the precipitation frequency for CMORPH and PERSIANN is around 0.21 percentage points per decade (Figure 6A,C). This means that the annual precipitation frequency will increase at a rate of 18 wet hours per decade. However, the rate of increase estimated by the IMERG product is more than double that rate. The average number of wet hours from CMORPH suggests that the UAE receives, on average, 42 wet hours in a year, whereas according to PERSIANN, the estimate rises to 51 wet hours per year. The highest wet hour estimation was reported by IMERG with an average of 120 wet hours annually. The precipitation frequency estimate by all products is quite small compared to the frequency experienced in other dry regions of the world such as West Texas [44]. This meager amount of rainfall with a very high evaporation rate suggests that the rate of recharge of the aquifers was insignificant over the last two decades as observed from GRACE data (Figure 1). The trend shows that the situation is improving at a very slow rate; however, well-thought-out and sustainable water resource management practices are still necessary.
The seasonal component of the frequency analysis indicated that winter and spring are the rainy seasons of the UAE. Additionally, according to all three satellite products, the coastal regions experience significantly higher rainfall frequency in both seasons (Figure 7). Moreover, the Northeastern region (e.g., Ras Al Khaima) receives a relatively higher rainfall frequency in the autumn (Figure 7(IIIA–C)). According to the GPM and PERSIANN, the Southeastern region (border with Oman) experiences a relatively higher number of wet hours in summer (Figure 7(IIB)). The statistical summary of the seasonal frequency over the country is presented in Table 1.
The average wet hours reported by IMERG in spring (47 h) is more than double the number reported by CMORPH (17 h) and PERSIANN (24 h). The largest seasonal spatial variability across the country is observed by IMERG with an inter-quartile range of 26 wet hours in the winter. Another interesting finding from the seasonal analysis is that PERSIANN showed very little spatial variability across the country in all four seasons. The maximum inter-quantile range by PERSIANN is observed in the winter with only 5.4 h. As expected, summer is the driest season with very small spatial variability while spring is the wettest season as revealed by all three satellite products when considering the mean and median (2nd quartile) values. The highest variability is also observed in the winter for all products based on the inter-quartile range.
IMERG shows significantly higher values of the rainfall duration, especially in winter and spring. IMERG suggested that 70% and 82% of the country receives more than 32 wet hours (1.5% frequency) in winter and spring, respectively. On the contrary, CMORPH estimated that only 8% and 3% of the country receives more than 32 wet hours (1.5% frequency) in winter and spring, respectively. This may indicate that the IMERG product is overestimating light precipitation and the PERSIANN product suffers from underestimation. This finding somewhat corroborates the conclusion that CMORPH’s latest version data (CMORPH X1.0) are significantly better in detecting the precipitation over the UAE with a relatively low False Alarm Rate (FAR) compared to GPM’s IMERG [25]. The improvement in the algorism may have played a significant role in detecting rainfall by CMORPH and reducing overestimation, which has been the main problem with satellite-based precipitation estimation as documented by Wehbe [33] and Furl [54]. The overestimation could be due to the detection of the high moisture in the region as precipitation by satellite-based precipitation products, especially IMERG. PERSIANN failed to capture the variability of the precipitation frequency across all the seasons. This could be due to the smoothing and merging of data from multiple sensors with coarse spatial resolutions even though the resolution of the final product (0.04°) is finer relative to the other products. Coarse-resolution (0.25°) data, if used for a relatively small area, have the tendency to even out the variability by using the average value for the entire cell.

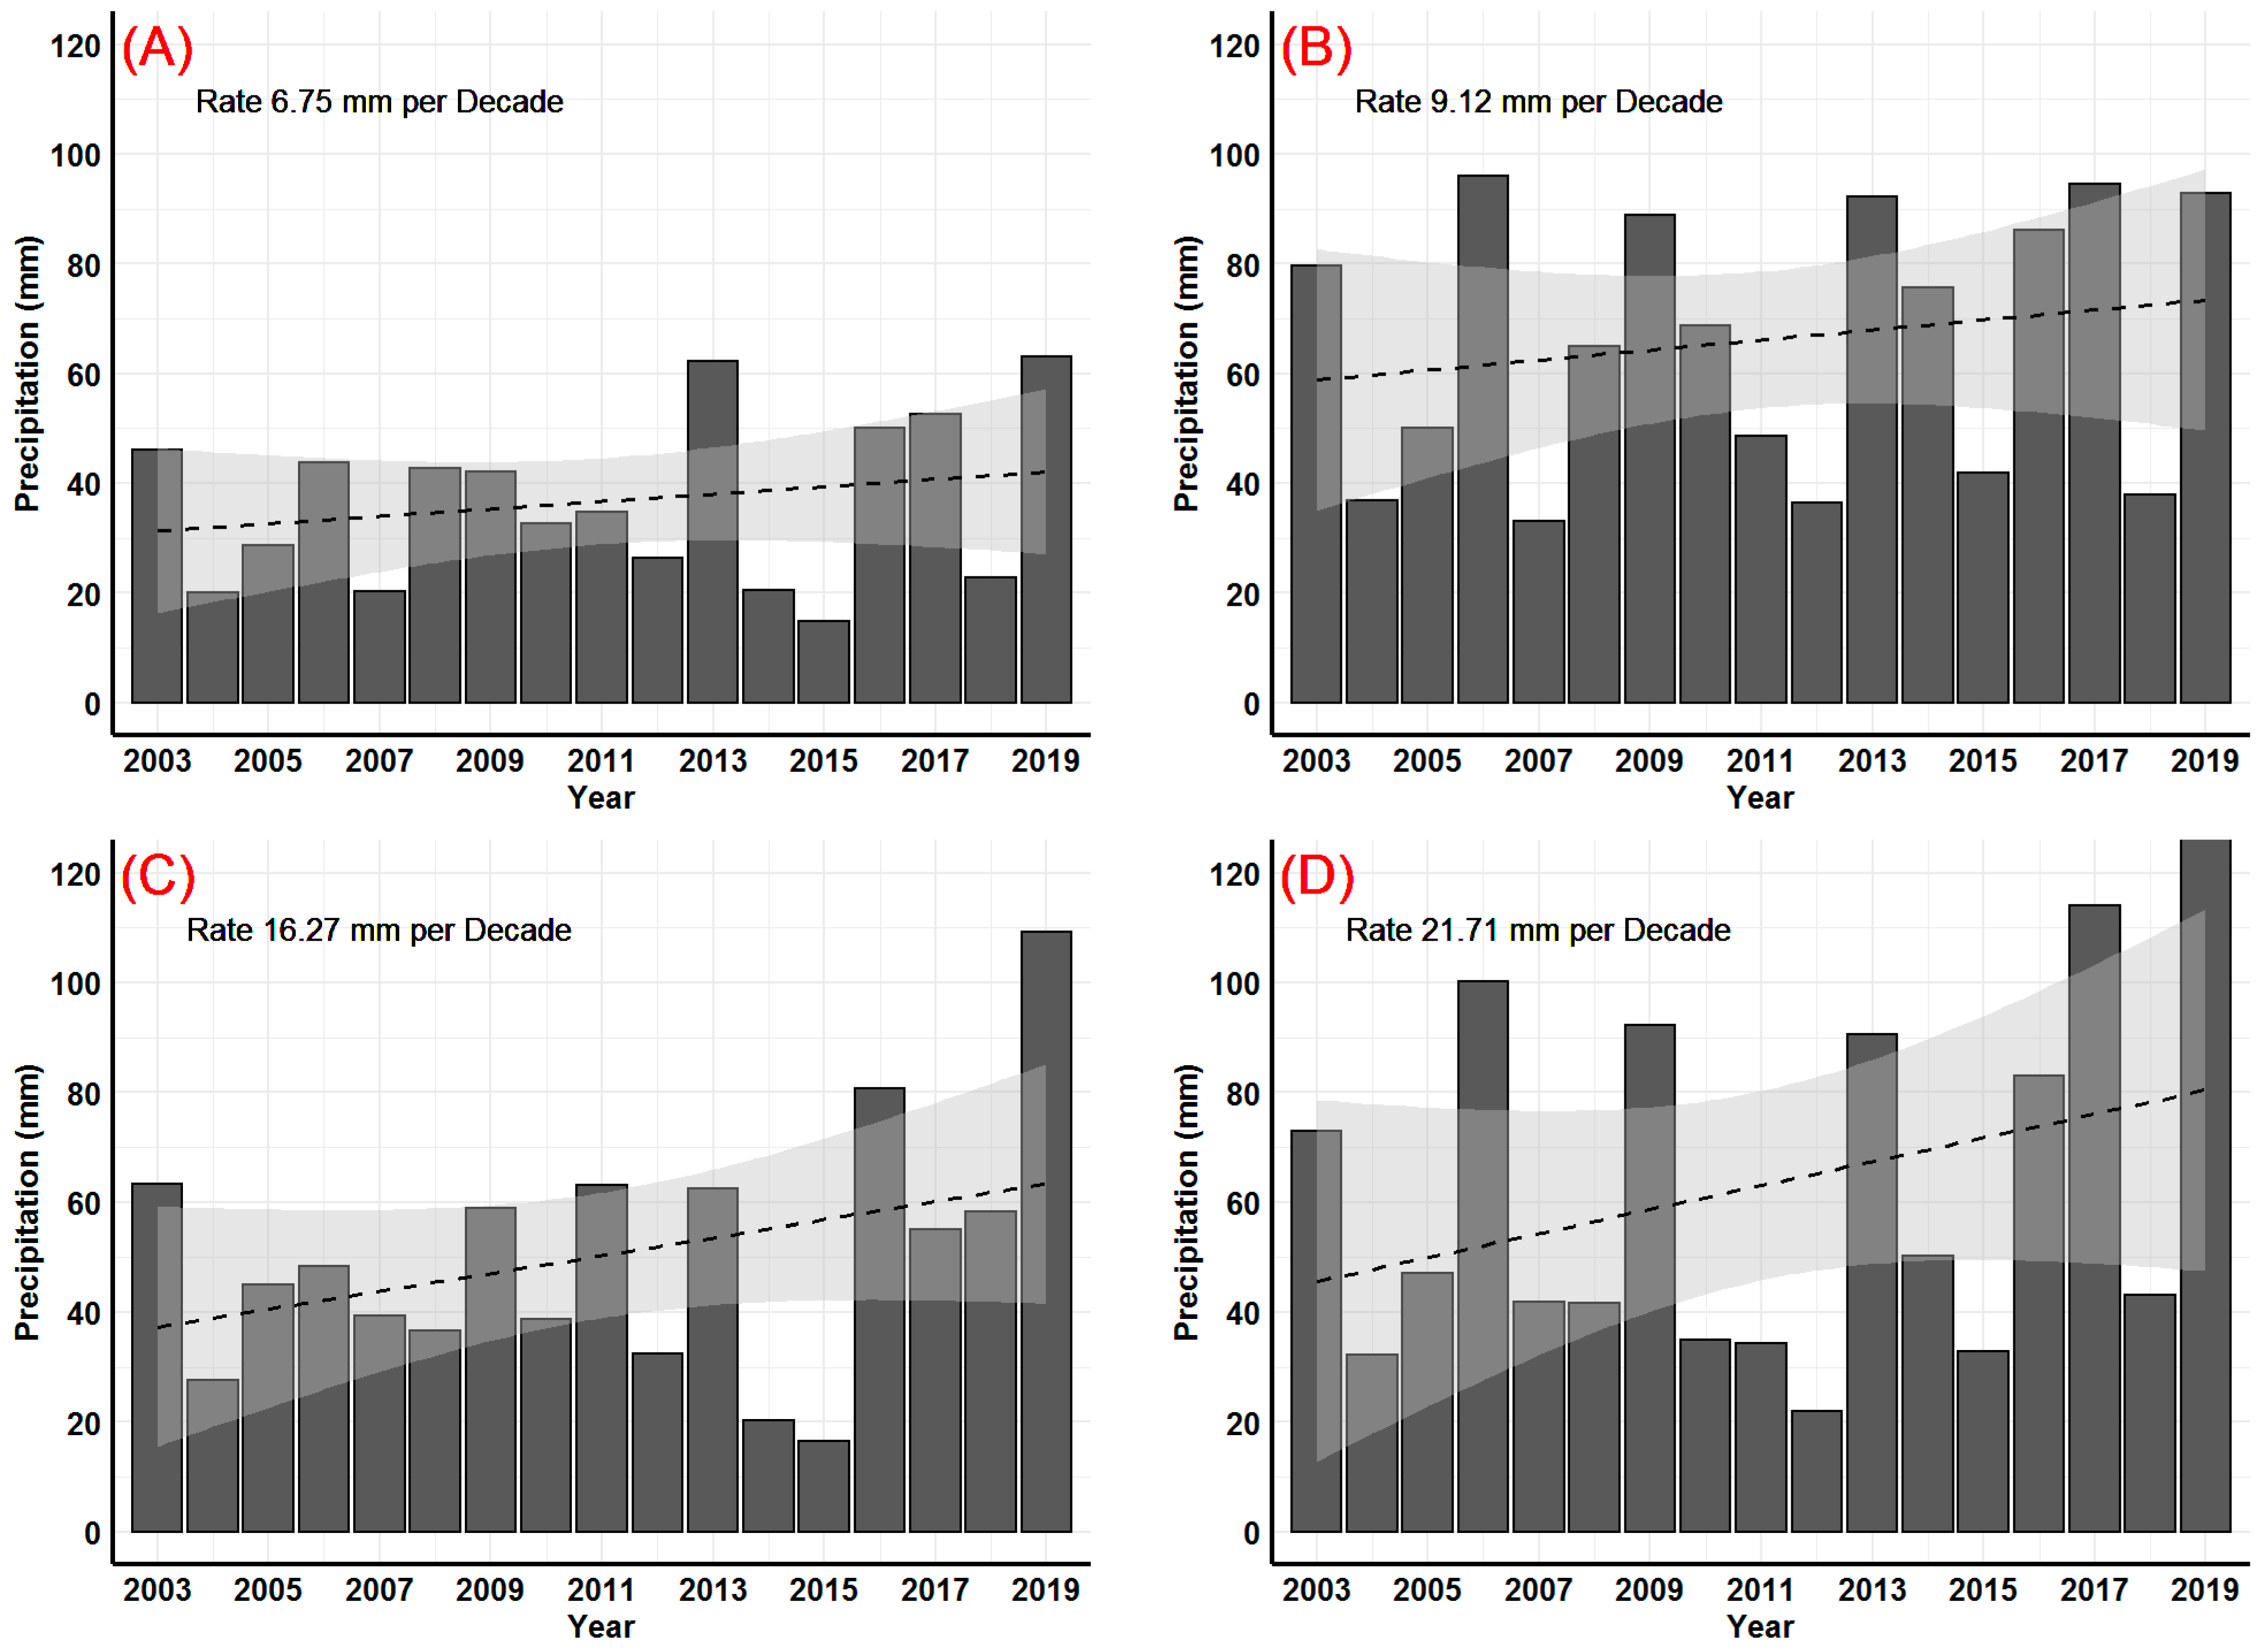
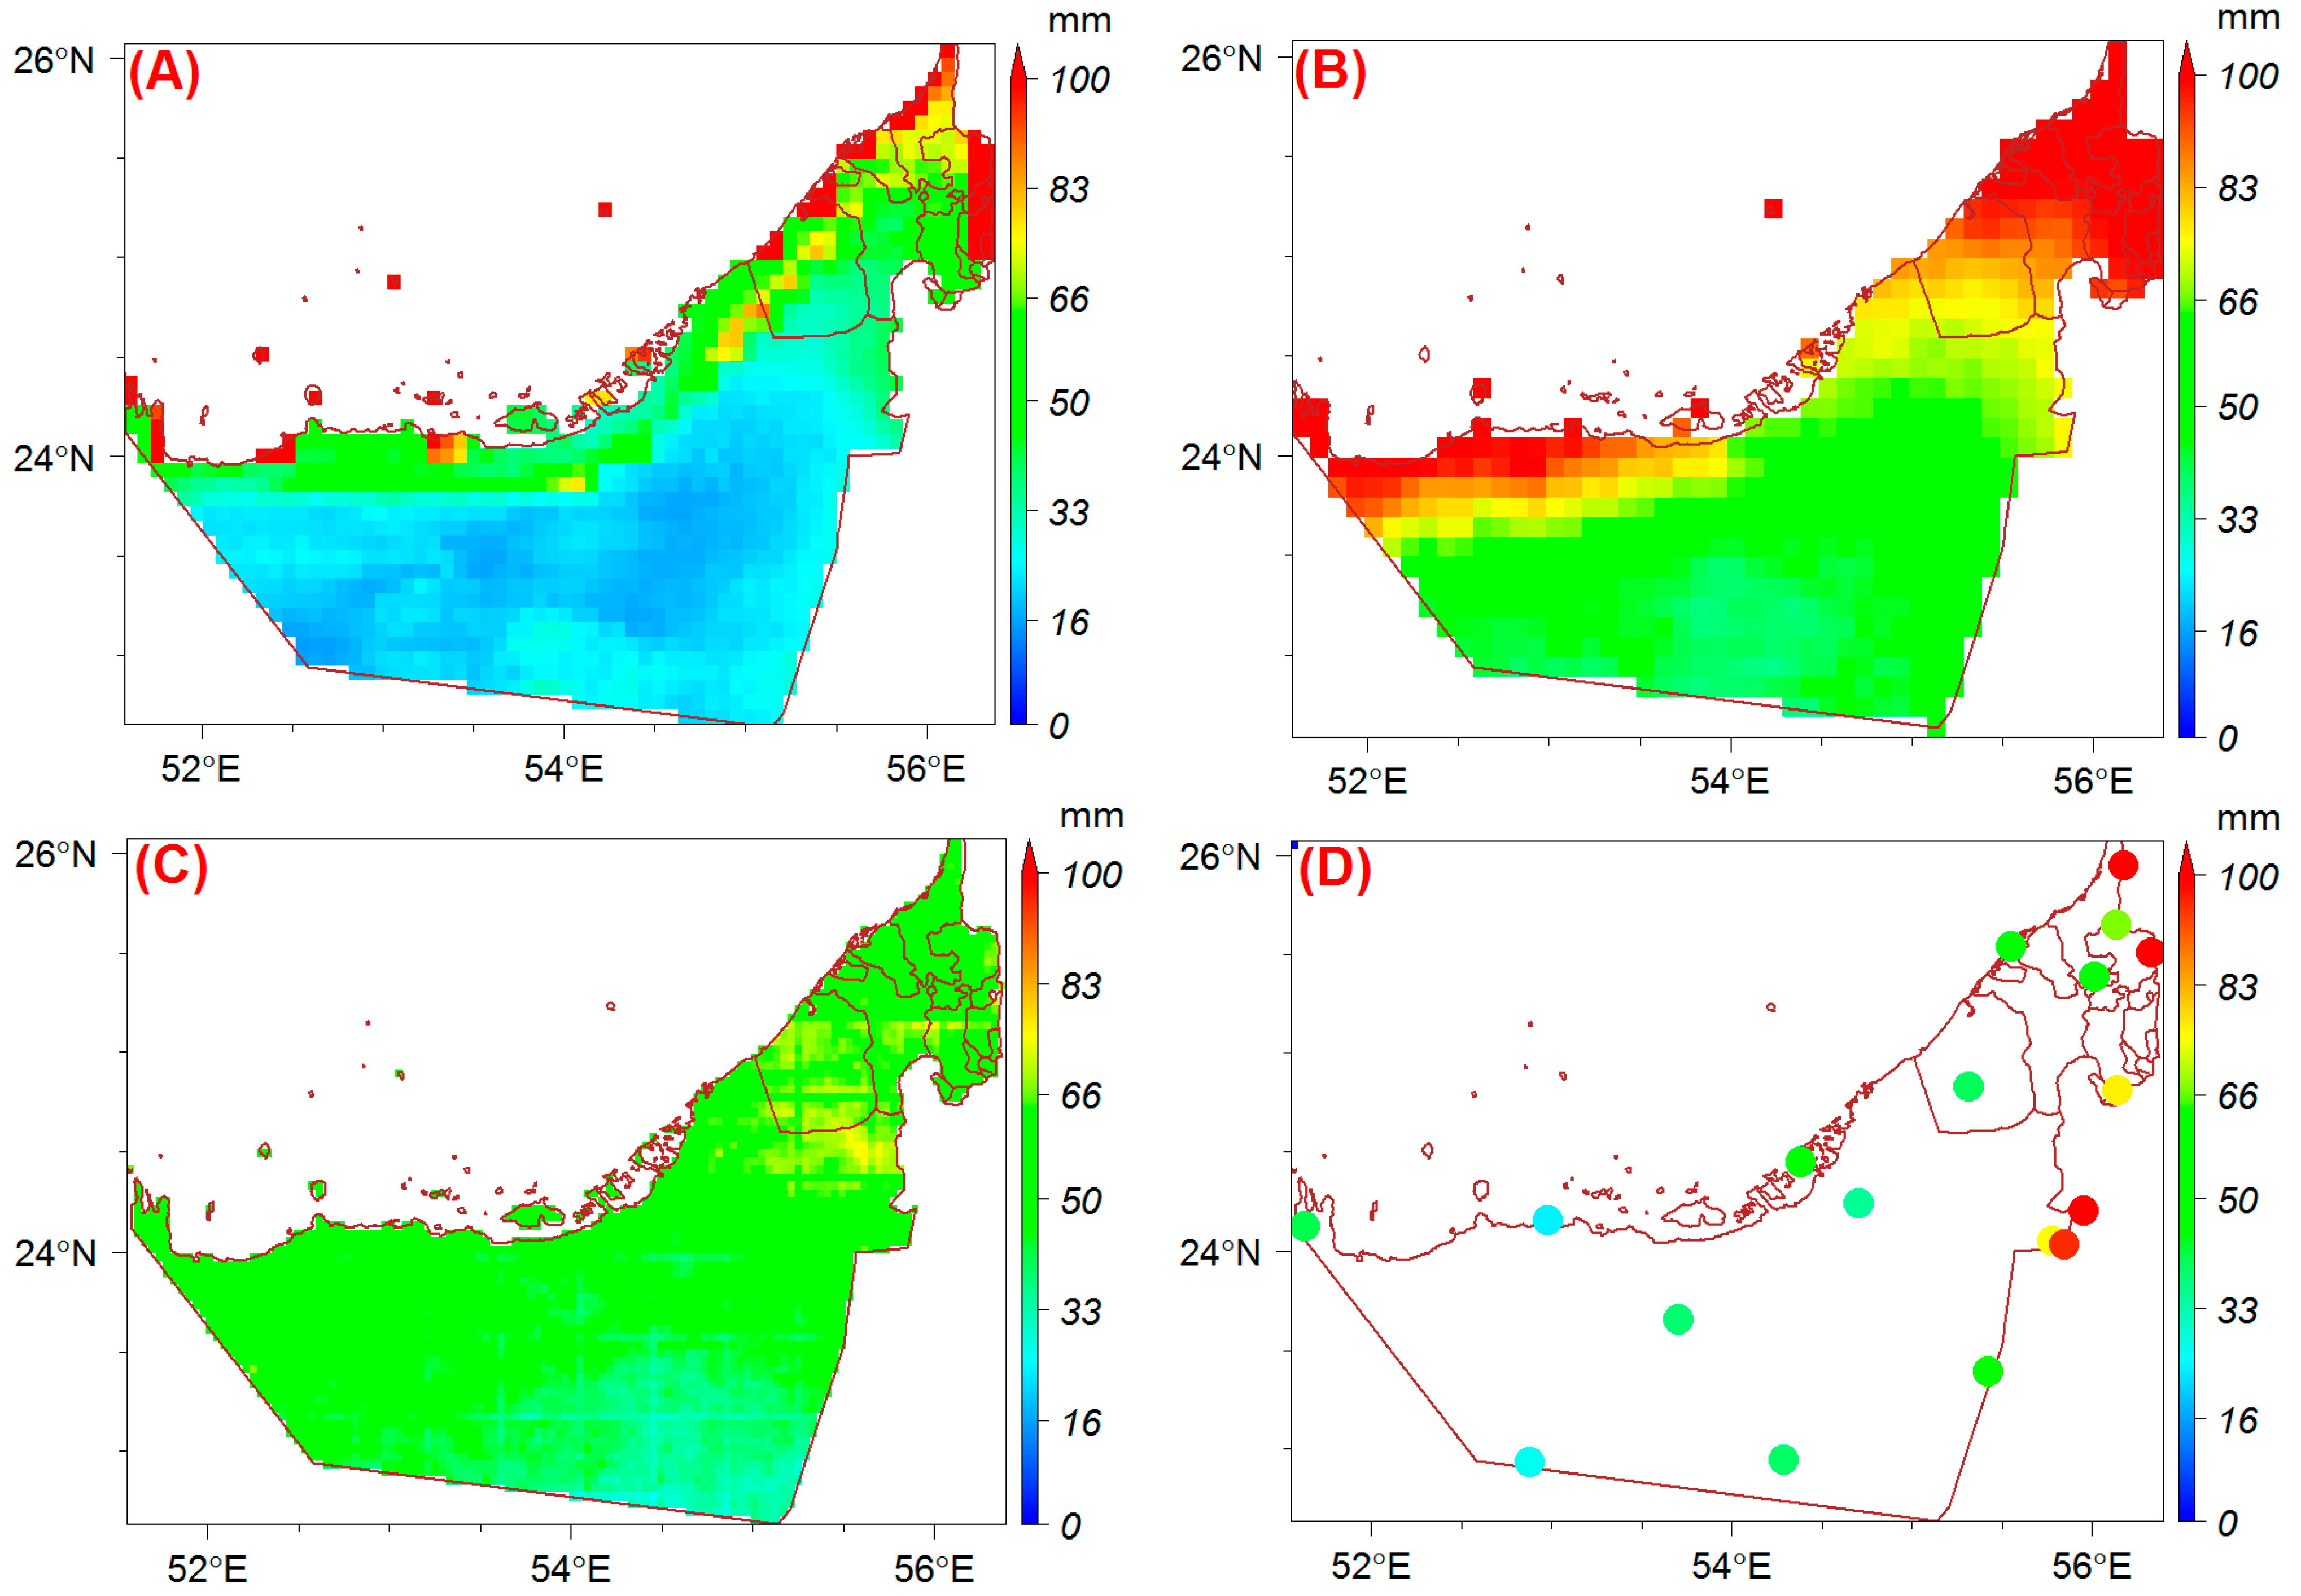
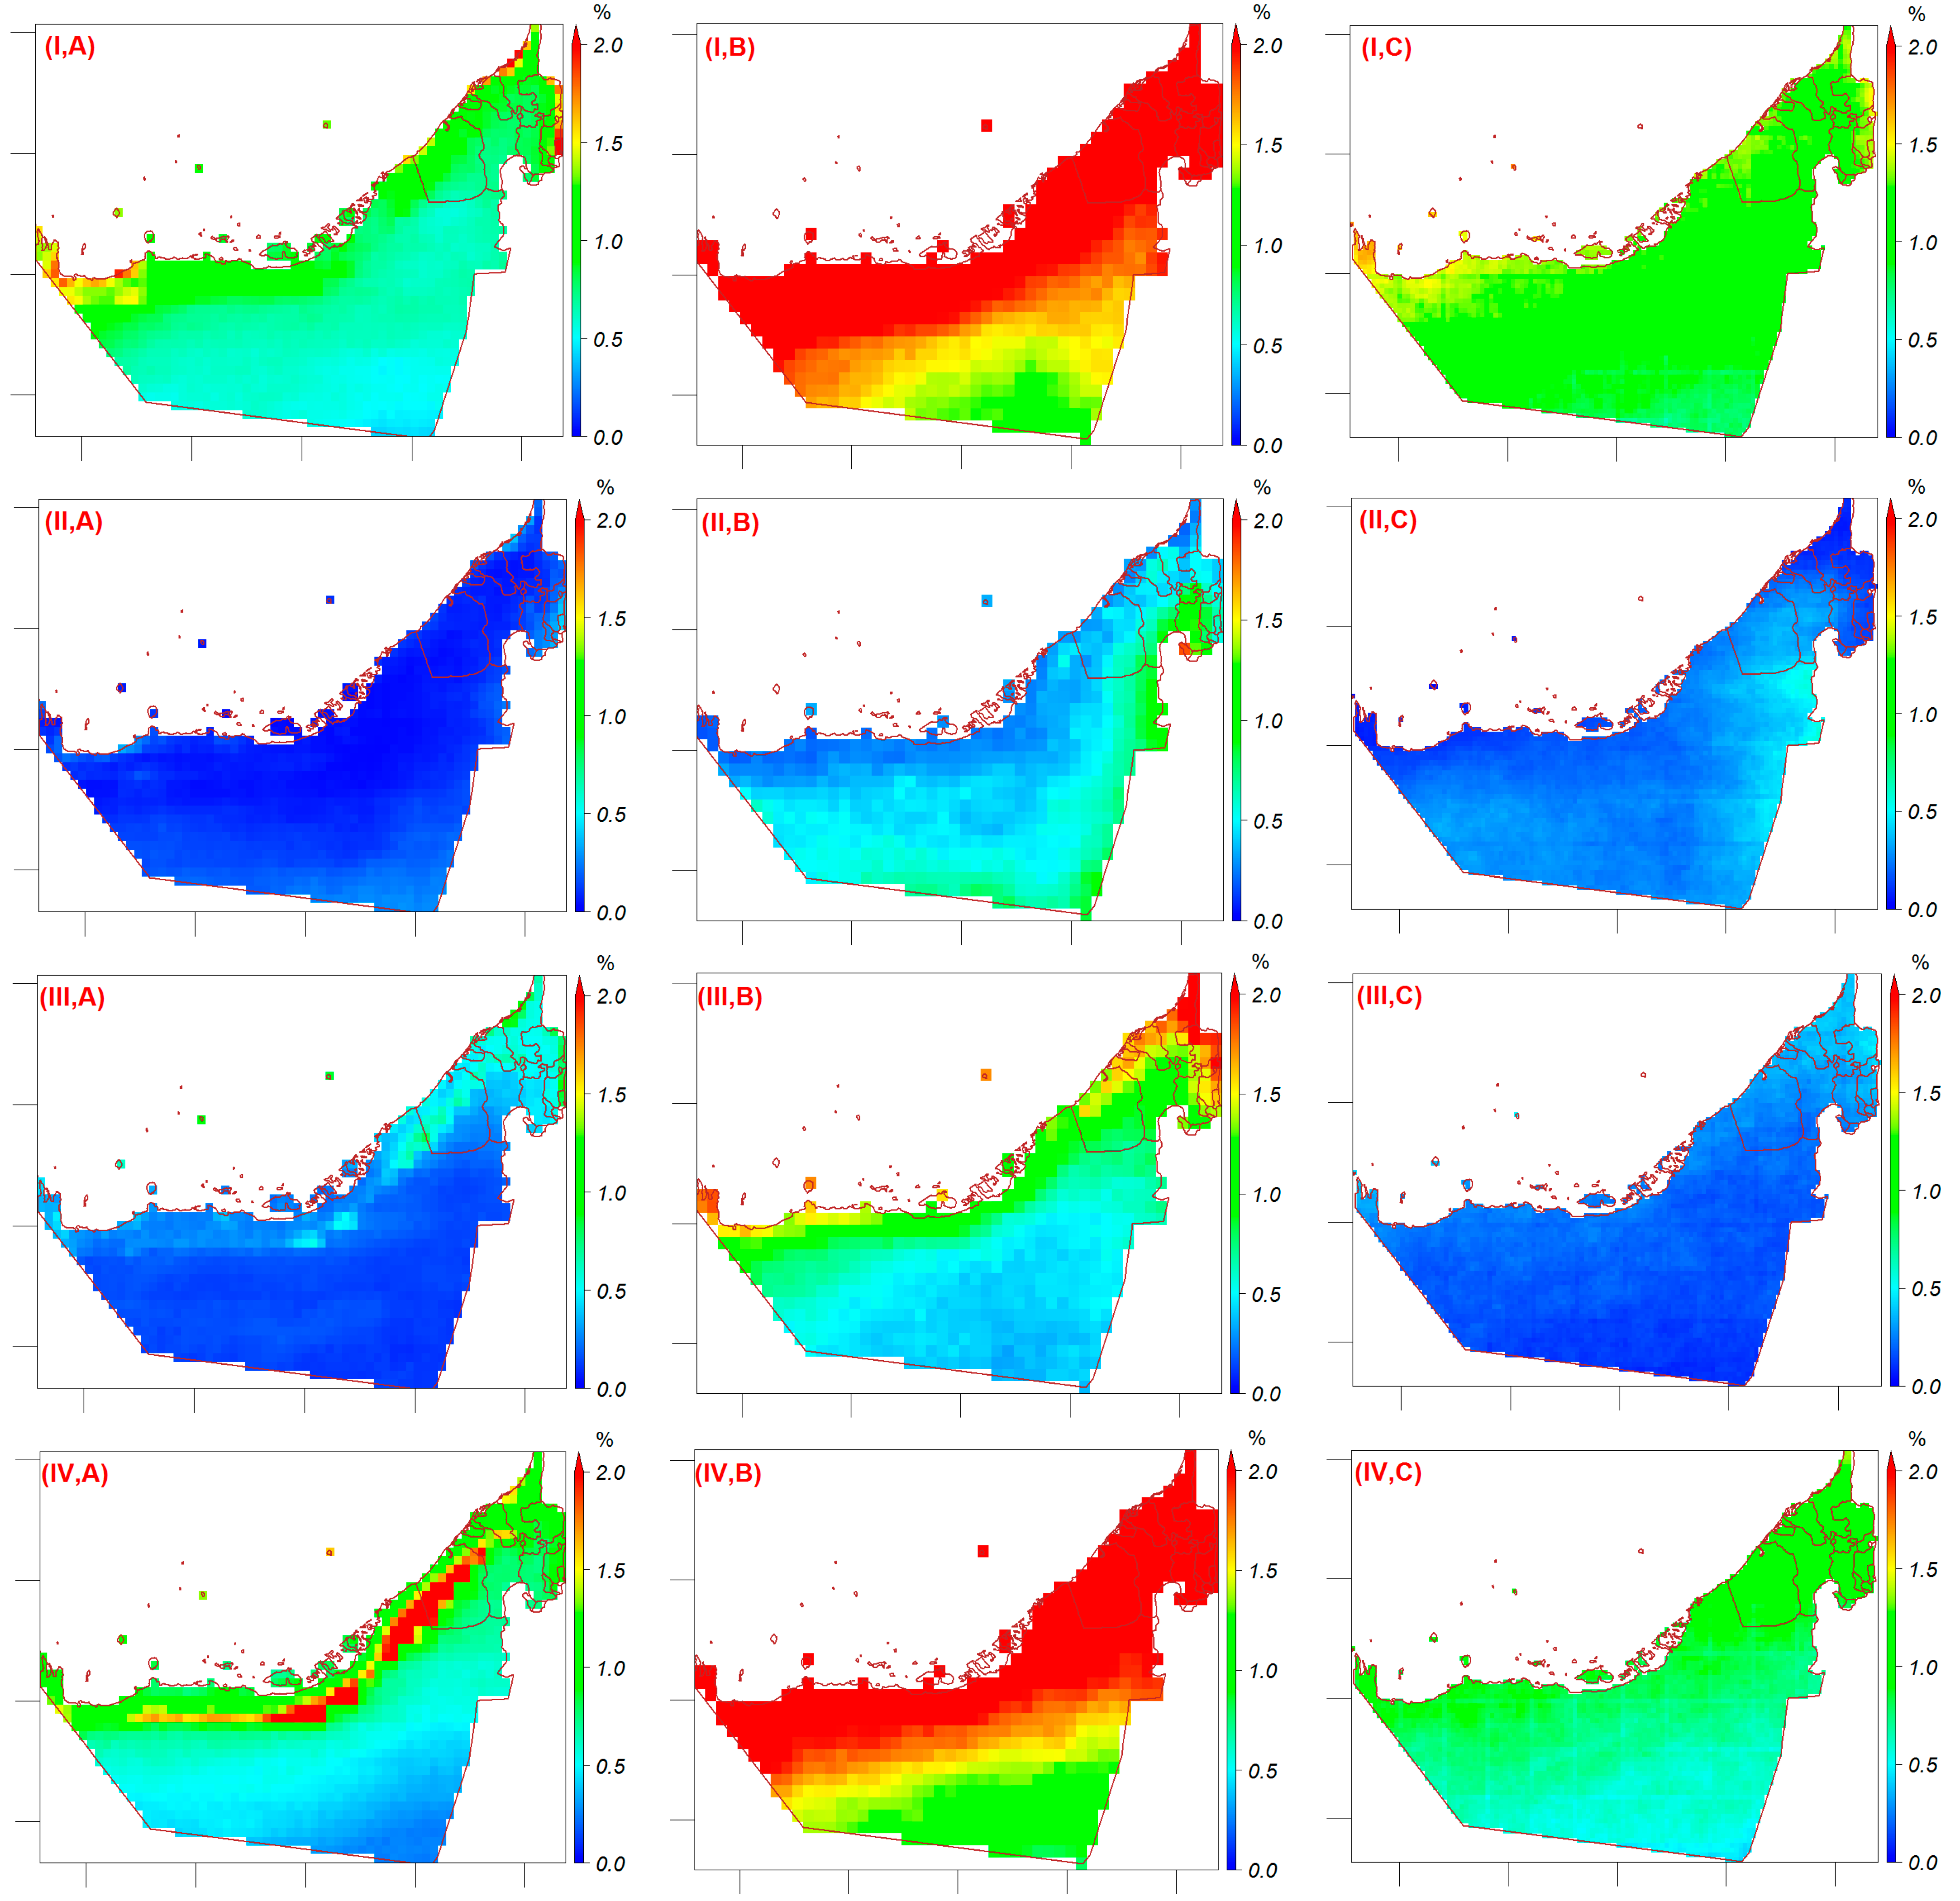
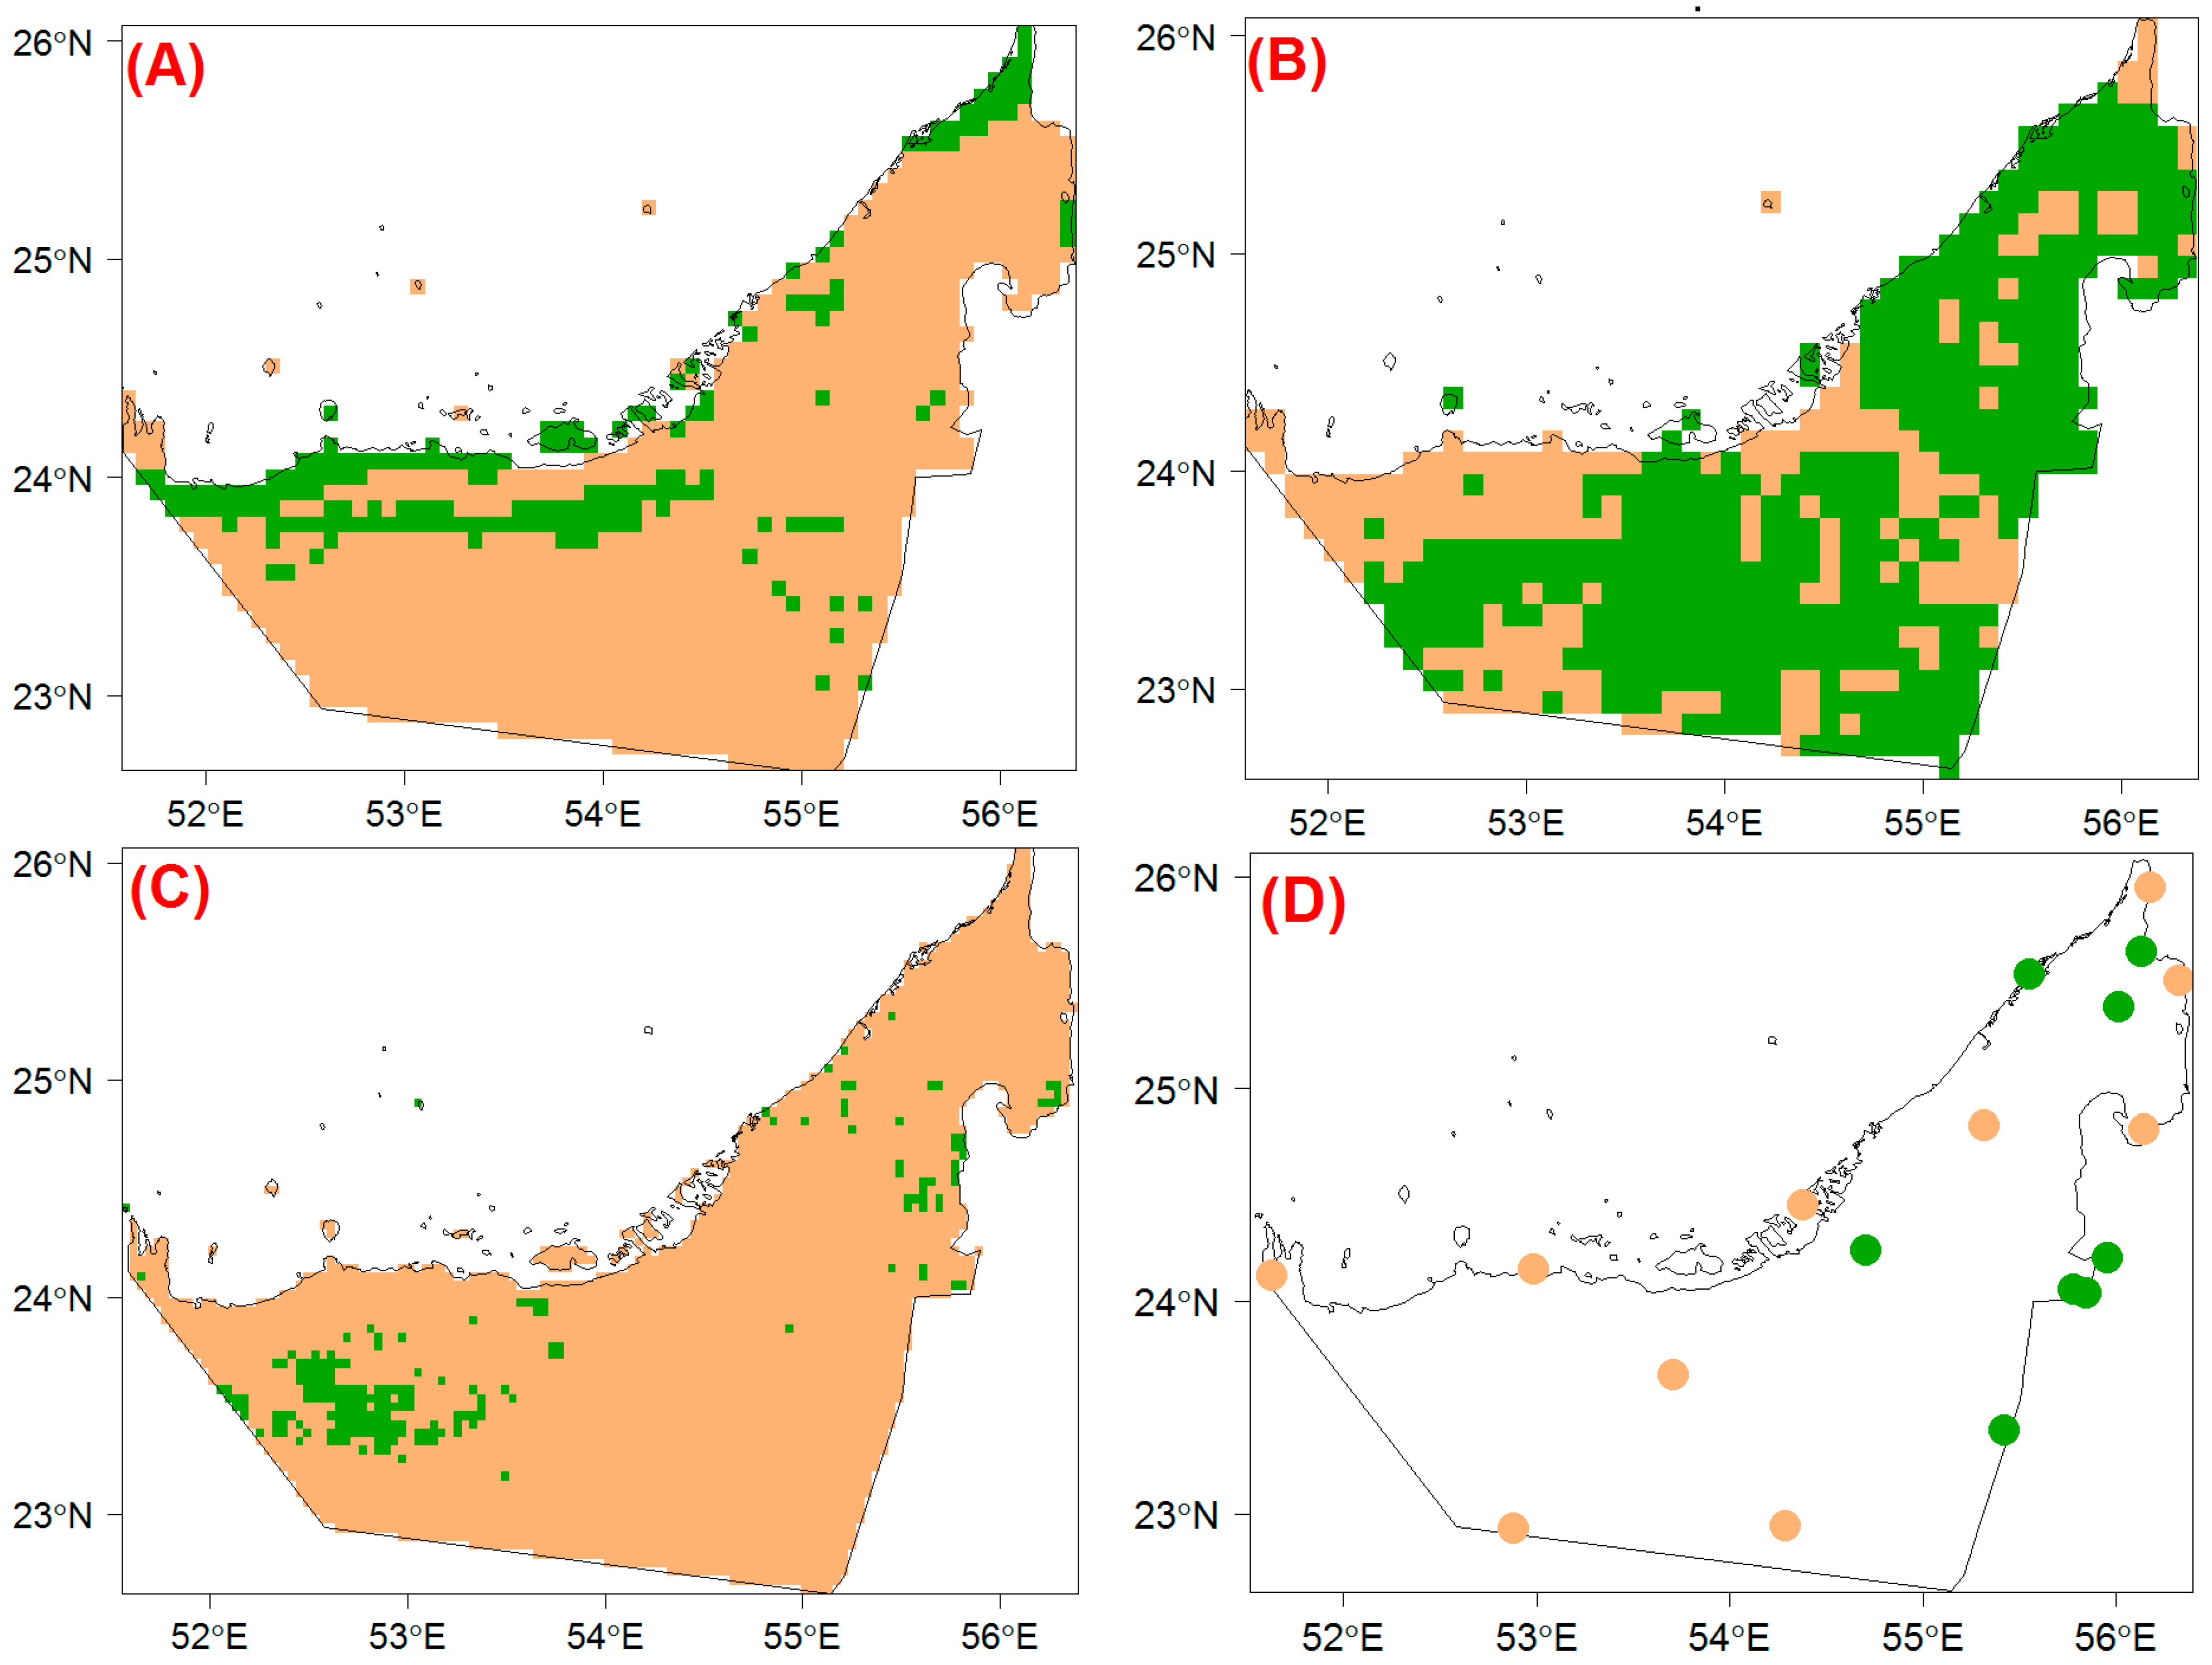
4.4. Precipitation Trend Analysis

A primary objective of this research as stated above is to assess the performance of the satellite-based precipitation products over a relatively long period (17 years). The annual precipitation data show that IMERG slightly overestimated the precipitation compared to the ground data in most of the stations. However, a linear model fit of the monthly data versus the products shows a slope of 0.64, 0.62, and 0.51 for IMERG, PERSIANN, and CMORPH, respectively, indicating that IMERG is the closest to the rain gauge with an R2 of 0.60. The weakest fit is found between PERSIANN and rain gauges with an R2 of 0.40. Table 2 shows the performance of monthly data of the satellite-based precipitation products relative to rain gauges. IMERG had the highest correlation coefficient and the lowest average error (RMSE and nRMSE). However, IMERG showed a positive bias (overestimation) of 26%, which is in line with the findings of Alsumaiti [25]. CMORPH is close behind IMERG in terms of the correlation coefficient, RMSE, and nRMSE with a negative (underestimation) bias of 16%. The PERSIANN product had a large bias and a low correlation coefficient. The annual time-series of four representative stations from different regions of the country are shown in Figure 8. The increasing trend of precipitation is only seen in the Eastern region where the Al Hajar mountain chain is located. Moving from the West (drier region) to the East (wetter regions), the trend of the annual precipitation increases.
Prior to the trend analysis, the monthly time-series is tested for possible change-point in the time-series via Pettitt’s test for every satellite pixel. The results of the test revealed that the majority (more than 85%) of the area did not experience a change-point in their rainfall time-series. IMERG product shows the largest number of pixels that exhibited a change-point in their time-series while the smallest number is detected by CMORPH (Table 3). The majority of pixels with a significant change-point in their time-series detected by CMORPH and PERSIANN are located within the coastal areas. Nevertheless, the change-point pixels according to IMERG are located mainly in the southern region of the country (Figure 9). When a similar analysis was conducted on the rain gauge data, only two out of the eighteen stations showed a significant change-point in their time-series, one in 2013 and the other in 2015.
The results of the trend analysis using the Correlated Seasonal Mann–Kendall test indicated that most of the country is experiencing a significant positive trend according to the IMERG data (Table 3). The rest of the products show a much smaller area with a significant positive trend (Figure 10). In agreement with the result of the IMERG, eight out of the eighteen stations show a significant trend. The spatial distribution of the rain gauges with significant positive trends also reveals that all of the stations with a significant positive trend are located in the Eastern half of the country (Figure 10D). This supports the earlier visual observation on the annual rainfall time-series that shows the trend increases from west to east (Figure 8).
In comparison with the result from the rain gauges, IMERG is the best product as it captures the outcome of 12 stations accurately with six of the stations showing a significant trend. The second-best product was PERSIANN agreeing with the trend of 11 stations but only one of them shows a significant trend. CMORPH is the least accurate product by predicting the significance of the trend of eight stations with only one station having a significant trend.
Theil–Sen’s slope estimation test was employed on the annual rainfall to estimate the slope of the trend for the pixels that show a significant trend using the Correlated Seasonal Mann–Kendall test. In all of the products, including the rain gauge data, the majority of the area that showed a significant trend has a positive trend. In the case of CMORPH, 65% of the total area has a significant positive trend (i.e., almost 8500 km2 out of 13,200 km2) (Figure 11A). The highest rate of increase is observed by PERSIANN with an average and median increase of 25.5 mm per decade (Figure 11C). The areas that show a significant trend according to IMERG have an average trend of around 8.6 mm and a median of 7.6 mm per decade (Figure 11B). The lowest average rate is observed by CMORPH. Out of the eight rain gauges that demonstrate a significant trend, two rain gauges indicate a negative (decreasing) trend (Jabal Hafeet and Alwathbah with a slope of −5.6 and −7.5 mm per decade, respectively). Comparing the spatial distribution of the slope with the slope obtained from the ground observations, IMERG appears to be the best product to match the spatial pattern with reasonable accuracy as shown in Figure 11. CMORPH and PERSIANN failed to capture the spatial pattern of the slope and the trend significance. Ouarda [12] stated that the eastern part of the UAE had a significant increasing trend supporting the results of the rain gauges and the IMERG product. However, the amount of the annual rainfall was affected significantly by the downward shift that occurred in 1999. Overall, IMERG emerges as the best product in estimating the significance of the trend and its magnitude than the other products. Thus, it can reliably be used to assess the long-term evolution of the precipitation and its impact on water resources, especially groundwater. When the length of the records is substantial, both IMERG and CMORPH have the potential to be used for intensity–duration–frequency (IDF) analysis over the study area.

5. Conclusions

This study examines the long-term precipitation trends over the UAE using three of the most highly cited satellite-based precipitation products. We analyzed 17 years (2003 to 2019) of data from the IMERG, CMORPH, and PERSIANN-CCS products and compared them with rain gauge data observed at 18 stations. The analysis included an assessment of the performance of satellite-based precipitation products in comparison to ground observations. The use of high-resolution satellite precipitation products revealed information on the spatial distribution of the precipitation trends and frequency at multiple temporal resolutions. The results show that the areal average annual precipitation of the UAE is significantly lower in the early 21st century than that of the late 20th century, even though it shows an increasing trend by all the products including rain gauges over the study period (2003–2019). The spatial distribution of the annual precipitation suggests that the coastal regions receive significantly higher precipitation relative to the inland as reported by all the products.
The rainfall frequency analysis based on hourly precipitation data shows that the UAE received an average of 120 wet hours annually according to the IMERG product. CMORPH and PERSIANN estimated much lower numbers of wet hours (42 and 51, respectively). The seasonal distribution of the rainfall frequency indicates that IMERG products overestimate the occurrence of rainfall in the spring and winter seasons. In general, the PERSIANN product was not able to capture the spatial variability of the rainfall frequency over the country for all seasons. In terms of capturing the precipitation frequency with its spatial and seasonal variability, the CMORPH product seems to match the rain gauge observations slightly better than the other satellite products.
Pettitt’s change-point test indicated that the majority of the country did not experience a significant change-point in their rainfall time-series throughout the study period (2003–2019). Only two rain gauge stations (out of 18) and less than 15% of the country, according to the satellite-based products, demonstrated a change point. The Correlated Seasonal Mann–Kendall trend test indicates positive trends in six rain gauge stations and negative trends in two stations (out of 18 stations), all of which are located in the wetter Eastern part of the UAE.
Overall, the IMERG product showed good agreement with the rain gauge data in describing the monthly trends. However, IMERG tends to overestimate light precipitation and, as a result, over-detects the occurrence of rainfall in the country (higher false positives), especially in the spring and winter seasons. On the other hand, CMORPH seems to reasonably capture the rainfall frequency but fails in the trend analysis. Lastly, PERSIANN failed to capture the spatial variability of the rainfall amount and frequency across the country.
In conclusion, satellite products have great potential for improving the spatial aspect of rainfall frequency analysis. Moreover, thanks to their very fine temporal resolution, they can complement rain gauge data to develop rainfall intensity–duration–frequency (IDF) curves in very dry regions, where an installation of dense rain gauge networks is not feasible. This can be done in the near future as more satellite data are collected and the records become long enough for in-depth statistical analysis. The results also show that satellite precipitations products can be very useful for several water resources planning and management applications in water-stressed countries. However, more research is needed to verify whether the apparent overestimation and over-detection of light rainfall by satellite products are real or related to the well-known rainfall under-catchment by rain gauges in dry and warm conditions. More future research is needed to understand the uncertainty of satellite precipitation products and their interaction with the uncertainty of rain gauge observations used in calibration and validation. Future research can also evaluate the potential application of semi-real time satellite products in hydrometeorological prediction as well as water resources planning and management.

Author Contributions

K.A.H. and T.S.A. guided this research and contributed significantly to preparing the manuscript for publication. K.A.H., T.S.A., H.O.S. and W.A. developed the research methodology. D.T.G. downloaded and processed the remote sensing products. D.T.G. developed the scripts used in the analysis. K.A.H., D.T.G. and H.O.S. performed the statistical analysis. K.A.H., T.S.A., H.O.S., W.A. and D.T.G. prepared the first draft. K.A.H., T.S.A., H.O.S. and W.A. performed the final overall proofreading of the manuscript. All authors have read and agreed to the published version of the manuscript.

Funding

This research was funded by the United Arab Emirate University Program for Advanced Research UPAR (Project No. G00002897).

Institutional Review Board Statement

Not applicable.

Informed Consent Statement

Not applicable.

Data Availability Statement

Not applicable.

Acknowledgments

The United Arab Emirates University-Research Affairs and The National Water Center at the United Arab Emirates University are gratefully acknowledged for their support. We would also like to acknowledge the National Center of Meteorology, which provided us with the in situ measurements. Gratitude is also extended to Rowan and Linda Hussein for following up with editing.

Conflicts of Interest

The authors declare no conflict of interest. The funders had no role in the design of the study; in the collection, analyses, or interpretation of data; in the writing of the manuscript, or in the decision to publish the results.

References

  1. Alabdouli, K.; Hussein, K.; Ghebreyesus, D.; Sharif, H.O. Coastal Runoff in the United Arab Emirates—The Hazard and Opportunity. Sustainability 2019, 11, 5406. [Google Scholar] [CrossRef] [Green Version]
  2. Sherif, M.; Akram, S.; Shetty, A. Rainfall Analysis for the Northern Wadis of United Arab Emirates: A Case Study. J. Hydrol. Eng. 2009, 14, 535–544. [Google Scholar] [CrossRef] [Green Version]
  3. Sherif, M.M.; Mohamed, M.M.; Shetty, A.; Almulla, M. Rainfall-Runoff Modeling of Three Wadis in the Northern Area of UAE. J. Hydrol. Eng. 2011, 16, 10–20. [Google Scholar] [CrossRef] [Green Version]
  4. Murad, A.A.; Al Nuaimi, H.; Al Hammadi, M. Comprehensive Assessment of Water Resources in the United Arab Emirates (UAE). Water Resour. Manag. 2007, 21, 1449–1463. [Google Scholar] [CrossRef]
  5. Shahin, S.M.; Salem, M.A. The Challenges of Water Scarcity and the Future of Food Security in the United Arab Emirates (UAE). Nat. Resour. Conserv. 2015, 3, 1–6. [Google Scholar] [CrossRef] [Green Version]
  6. Rizk, Z.S.; Alsharhan, A.S. Water resources in the United Arab Emirates. In Developments in Water Science; Elsevier: Amsterdam, The Netherlands, 2003; Volume 50, pp. 245–264. [Google Scholar]
  7. Ghebreyesus, D.T.; Temimi, M.; Fares, A.; Bayabil, H. Remote Sensing Applications for Monitoring Water Resources in the UAE Using Lake Zakher as a Water Storage Gauge. In Emerging Issues in Groundwater Resources; Springer International Publishing: Cham, Switzerland, 2016; pp. 145–157. [Google Scholar]
  8. Ghebreyesus, D.T.; Temimi, M.; Fares, A.; Bayabil, H.K. A Multi-Satellite Approach for Water Storage Monitoring in an Arid Watershed. Geosciences 2016, 6, 33. [Google Scholar] [CrossRef] [Green Version]
  9. Ahmed, A.M. An overview of conventional and non-conventional water resources in arid region: Assessment and constrains of the United Arab Emirates (UAE). J. Water Resour. Prot. 2010. [Google Scholar] [CrossRef] [Green Version]
  10. Stefanidis, S.; Chatzichristaki, C. Response of soil erosion in a mountainous catchment to temperature and precipitation trends. Carpathian J. Earth Environ. Sci. 2017, 12, 35–39. [Google Scholar]
  11. Zhang, K.; Kimball, J.S.; Mu, Q.; Jones, L.A.; Goetz, S.; Running, S.W. Satellite based analysis of northern ET trends and associated changes in the regional water balance from 1983 to 2005. J. Hydrol. 2009, 379, 92–110. [Google Scholar] [CrossRef]
  12. Ouarda, T.; Charron, C.; Kumar, K.N.; Marpu, P.R.; Ghedira, H.; Molini, A.; Khayal, I. Evolution of the rainfall regime in the United Arab Emirates. J. Hydrol. 2014, 514, 258–270. [Google Scholar] [CrossRef] [Green Version]
  13. Merabtene, T.; Siddique, M.; Shanableh, A. Assessment of Seasonal and Annual Rainfall Trends and Variability in Sharjah City, UAE. Adv. Meteorol. 2016, 2016, 1–13. [Google Scholar] [CrossRef] [Green Version]
  14. Donat, M.G.; Peterson, T.C.; Brunet, M.; King, A.D.; Almazroui, M.; Kolli, R.K.; Boucherf, D.; Al-Mulla, A.Y.; Nour, A.Y.; Aly, A.A.; et al. Changes in extreme temperature and precipitation in the Arab region: Long-term trends and variability related to ENSO and NAO. Int. J. Climatol. 2014, 34, 581–592. [Google Scholar] [CrossRef]
  15. Modarres, R.; Sarhadi, A. Rainfall trends analysis of Iran in the last half of the twentieth century. J. Geophys. Res. Atmos. 2009, 114, 1–10. [Google Scholar] [CrossRef]
  16. Törnros, T. Precipitation trends and suitable drought index in the arid/semi-arid southeastern Mediterranean region. In Global Change: Facing Risks and Threats to Water Resources (Proceedings of the 6th World FRIEND Conference, Fez, Morocco); IAHS: Wallingford, UK, 2010. [Google Scholar]
  17. Kwarteng, A.Y.; Dorvlo, A.S.; Kumar, G.T.V. Analysis of a 27-year rainfall data (1977-2003) in the Sultanate of Oman. Int. J. Clim. 2009, 29, 605–617. [Google Scholar] [CrossRef]
  18. Stefanidis, S.; Stathis, D. Spatial and Temporal Rainfall Variability over the Mountainous Central Pindus (Greece). Climate 2018, 6, 75. [Google Scholar] [CrossRef] [Green Version]
  19. Longobardi, A.; Buttafuoco, G.; Caloiero, T.; Coscarelli, R. Spatial and temporal distribution of precipitation in a Mediterranean area (southern Italy). Environ. Earth Sci. 2016, 75, 1–20. [Google Scholar] [CrossRef]
  20. Li, Z.; Yang, D.; Hong, Y. Multi-scale evaluation of high-resolution multi-sensor blended global precipitation products over the Yangtze River. J. Hydrol. 2013, 500, 157–169. [Google Scholar] [CrossRef]
  21. Li, M.; Shao, Q.; Renzullo, L. Estimation and spatial interpolation of rainfall intensity distribution from the effective rate of precipitation. Stoch. Environ. Res. Risk Assess. 2009, 24, 117–130. [Google Scholar] [CrossRef]
  22. Sorooshian, S.; AghaKouchak, A.; Arkin, P.A.; Eylander, J.; Foufoula-Georgiou, E.; Harmon, R.S.; Hendrickx, J.M.H.; Imam, B.; Kuligowski, R.; Skahill, B.; et al. Advanced Concepts on Remote Sensing of Precipitation at Multiple Scales. Bull. Am. Meteorol. Soc. 2011, 92, 1353–1357. [Google Scholar] [CrossRef]
  23. Li, C.; Tang, G.; Hong, Y. Cross-evaluation of ground-based, multi-satellite and reanalysis precipitation products: Applicability of the Triple Collocation method across Mainland China. J. Hydrol. 2018, 562, 71–83. [Google Scholar] [CrossRef]
  24. Tang, G.; Clark, M.P.; Papalexiou, S.M.; Ma, Z.; Hong, Y. Have satellite precipitation products improved over last two decades? A comprehensive comparison of GPM IMERG with nine satellite and reanalysis datasets. Remote Sens. Environ. 2020, 240, 111697. [Google Scholar] [CrossRef]
  25. Alsumaiti, T.S.; Hussein, K.; Ghebreyesus, D.T.; Sharif, H.O. Performance of the CMORPH and GPM IMERG Products over the United Arab Emirates. Remote Sens. 2020, 12, 1426. [Google Scholar] [CrossRef]
  26. Duan, Z.; Liu, J.; Tuo, Y.; Chiogna, G.; Disse, M. Evaluation of eight high spatial resolution gridded precipitation products in Adige Basin (Italy) at multiple temporal and spatial scales. Sci. Total Environ. 2016, 573, 1536–1553. [Google Scholar] [CrossRef] [PubMed] [Green Version]
  27. Yang, Y.; Luo, Y. Evaluating the performance of remote sensing precipitation products CMORPH, PERSIANN, and TMPA, in the arid region of northwest China. Theor. Appl. Clim. 2014, 118, 429–445. [Google Scholar] [CrossRef]
  28. Katiraie-Boroujerdy, P.-S.; Ashouri, H.; Hsu, K.-L.; Sorooshian, S. Trends of precipitation extreme indices over a subtropical semi-arid area using PERSIANN-CDR. Theor. Appl. Clim. 2017, 130, 249–260. [Google Scholar] [CrossRef] [Green Version]
  29. Asong, Z.E.; Razavi, S.; Wheater, H.S.; Wong, J.S. Evaluation of Integrated Multisatellite Retrievals for GPM (IMERG) over Southern Canada against Ground Precipitation Observations: A Preliminary Assessment. J. Hydrometeorol. 2017, 18, 1033–1050. [Google Scholar] [CrossRef]
  30. Sungmin, O.; Foelsche, U.; Kirchengast, G.; Fuchsberger, J.; Tan, J.; Petersen, W.A. Evaluation of GPM IMERG Early, Late, and Final rainfall estimates using WegenerNet gauge data in southeastern Austria. Hydrol. Earth Syst. Sci. 2017, 21, 6559–6572. [Google Scholar] [CrossRef] [Green Version]
  31. Siuki, S.K.; Saghafian, B.; Moazami, S. Comprehensive evaluation of 3-hourly TRMM and half-hourly GPM-IMERG satellite precipitation products. Int. J. Remote Sens. 2017, 38, 558–571. [Google Scholar] [CrossRef]
  32. Wang, Z.; Zhong, R.; Lai, C.; Chen, J. Evaluation of the GPM IMERG satellite-based precipitation products and the hydrological utility. Atmos. Res. 2017, 196, 151–163. [Google Scholar] [CrossRef]
  33. Wehbe, Y.; Ghebreyesus, D.; Temimi, M.; Milewski, A.; Al Mandous, A. Assessment of the consistency among global precipitation products over the United Arab Emirates. J. Hydrol. Reg. Stud. 2017, 12, 122–135. [Google Scholar] [CrossRef]
  34. Abrams, M. The Advanced Spaceborne Thermal Emission and Reflection Radiometer (ASTER): Data products for the high spatial resolution imager on NASA’s Terra platform. Int. J. Remote Sens. 2000, 21, 847–859. [Google Scholar] [CrossRef]
  35. Parkinson, J.A. Irrigation in the Near East Region in Figures; FAO: Rome, Italy, 1997. [Google Scholar]
  36. Sherif, M.; Almulla, M.; Shetty, A.; Chowdhury, R.K. Analysis of rainfall, PMP and drought in the United Arab Emirates. Int. J. Clim. 2013, 34, 1318–1328. [Google Scholar] [CrossRef]
  37. Paleologos, E.K.; Papapetridis, K.; Kendall, C.G.S.C. Stochastic contaminant transport monitoring in heterogeneous sand and gravel aquifers of the United Arab Emirates. Stoch. Environ. Res. Risk Assess. 2015, 29, 1427–1435. [Google Scholar] [CrossRef]
  38. Huffman, G.J.; Bolvin, D.T.; Braithwaite, D.; Hsu, K.; Joyce, R.; Xie, P.; Yoo, S.-H. NASA global precipitation measurement (GPM) integrated multi-satellite retrievals for GPM (IMERG). Algorithm Theor. Basis Doc. 2015, 4, 26. [Google Scholar]
  39. Tan, J.; Huffman, G.J.; Bolvin, D.T.; Nelkin, E.J. IMERG V06: Changes to the Morphing Algorithm. J. Atmos. Ocean. Technol. 2019, 36, 2471–2482. [Google Scholar] [CrossRef]
  40. Hou, A.Y.; Kakar, R.K.; Neeck, S.; Azarbarzin, A.A.; Kummerow, C.D.; Kojima, M.; Oki, R.; Nakamura, K.; Iguchi, T. The global precipitation measurement mission. Bull. Am. Meteorol. Soc. 2014, 95, 701–722. [Google Scholar] [CrossRef]
  41. Hsu, K.-L.; Gao, X.; Sorooshian, S.; Gupta, H. Precipitation Estimation from Remotely Sensed Information Using Artificial Neural Networks. J. Appl. Meteorol. 1997, 36, 1176–1190. [Google Scholar] [CrossRef]
  42. Hsu, K.-L.; Gupta, H.; Gao, X.; Sorooshian, S. Estimation of physical variables from multichannel remotely sensed imagery using a neural network: Application to rainfall estimation. Water Resour. Res. 1999, 35, 1605–1618. [Google Scholar] [CrossRef]
  43. Trenberth, K.E.; Zhang, Y. How Often Does It Really Rain? Bull. Am. Meteorol. Soc. 2018, 99, 289–298. [Google Scholar] [CrossRef]
  44. Ghebreyesus, D.; Sharif, H.O. Spatio-Temporal Analysis of Precipitation Frequency in Texas Using High-Resolution Radar Products. Water 2020, 12, 1378. [Google Scholar] [CrossRef]
  45. Pettitt, A.N. A Non-Parametric Approach to the Change-Point Problem. J. R. Stat. Soc. Ser. C (Appl. Stat.) 1979, 28, 126. [Google Scholar] [CrossRef]
  46. Verstraeten, G.; Poesen, J.; Demarée, G.; Salles, C. Long-term (105 years) variability in rain erosivity as derived from 10-min rainfall depth data for Ukkel (Brussels, Belgium): Implications for assessing soil erosion rates. J. Geophys. Res. Space Phys. 2006, 111, D22. [Google Scholar] [CrossRef]
  47. Hirsch, R.M.; Slack, J.R.; Smith, R.A. Techniques of trend analysis for monthly water quality data. Water Resour. Res. 1982, 18, 107–121. [Google Scholar] [CrossRef] [Green Version]
  48. Libiseller, C.; Grimvall, A. Performance of partial Mann-Kendall tests for trend detection in the presence of covariates. Environmetrics 2002, 13, 71–84. [Google Scholar] [CrossRef]
  49. Theil, H. A rank-invariant method of linear and polynomial regression analysis. In Henri Theil’s Contributions to Economics and Econometrics; Springer: Berlin/Heidelberg, Germany, 1992; pp. 345–381. [Google Scholar]
  50. Sen, P.K. Estimates of the regression coefficient based on Kendall’s tau. J. Am. Stat. Assoc. 1968, 63, 1379–1389. [Google Scholar] [CrossRef]
  51. Dinpashoh, Y.; Jhajharia, D.; Fakheri-Fard, A.; Singh, V.P.; Kahya, E. Trends in reference crop evapotranspiration over Iran. J. Hydrol. 2011, 399, 422–433. [Google Scholar] [CrossRef]
  52. Jhajharia, D.; Dinpashoh, Y.; Kahya, E.; Choudhary, R.R.; Singh, V.P. Trends in temperature over Godavari River basin in Southern Peninsular India. Int. J. Clim. 2014, 34, 1369–1384. [Google Scholar] [CrossRef]
  53. Vousoughi, F.D.; Dinpashoh, Y.; Aalami, M.T.; Jhajharia, D. Trend analysis of groundwater using non-parametric methods (case study: Ardabil plain). Stoch. Environ. Res. Risk Assess. 2012, 27, 547–559. [Google Scholar] [CrossRef]
  54. Furl, C.; Ghebreyesus, D.; Sharif, H.O. Assessment of the Performance of Satellite-Based Precipitation Products for Flood Events across Diverse Spatial Scales Using GSSHA Modeling System. Geosciences 2018, 8, 191. [Google Scholar] [CrossRef] [Green Version]
Figure 1. Maps showing the study area, the location of the stations, and the spatial distribution of change of groundwater in water thickness equivalence from 2003 to 2019 obtained by GRACE over the Arabian Peninsula (resolution of 0.5°). The time-series shows the average GRACE anomalies over the UAE over the study period.
Water 13 02376 g001
Figure 2. (A) Annual and (B) monthly average precipitation of all 18 rain gauge stations represented by dotted lines with the average of all stations is the bold red lines (blue and green dotted lines represent Alqlaa and Khatam Al Shaklah stations).
Water 13 02376 g002
Figure 3. Areal average total annual rainfall and its annual trend with a 95% confidence interval (gray) for (A) CMORPH, (B) IMERG, (C) PERSIANN, and (D) rain gauges.
Water 13 02376 g003
Figure 4. Spatial distribution of annual average rainfall for (A) CMORPH, (B) IMERG, (C) PERSIANN, and (D) rain gauges.
Water 13 02376 g004
Figure 5. Distribution of monthly average rainfall for (A) CMORPH, (B) IMERG, (C) PERSIANN, and (D) rain gauges.
Water 13 02376 g005
Figure 6. Frequency of annual hourly precipitation (percentage of wet hours) estimated by (A) CMORPH, (B) IMERG, and (C) PERSIANN.
Water 13 02376 g006
Figure 7. Spatial distribution of the seasonal rainfall frequency for (A) CMORPH, (B) IMERG, and (C) PERSIANN (Spring (I), Summer (II), Autumn (III), and Winter (IV)).
Water 13 02376 g007
Figure 8. Time-series of annual satellite rainfall data at the location of (A) Al Gheweifat, (B) Abu Dhabi, (C) Mezyed, and (D) Jabal Jais rain gauge stations.
Water 13 02376 g008
Figure 9. Locations with significant (green color) and not-significant (brown color) rainfall change-points using Pettitt’s test for (A) CMORPH, (B) IMERG, (C) PERSIANN, and (D) rain gauges.
Water 13 02376 g009
Figure 10. Locations with a significant (green color) and not-significant (brown color) trend according to the Correlated Seasonal Mann–Kendall test for (A) CMORPH, (B) IMERG, (C) PERSIANN, and (D) rain gauges.
Water 13 02376 g010
Figure 11. The spatial distribution of the increase for areas that showed a significant trend using Theil–Sen’s Slope test for (A) CMORPH, (B) IMERG, (C) PERSIANN, and (D) Rain Gauges (magnitude of the increase is in mm/decade).
Water 13 02376 g011
Table 1. Seasonal distribution of the precipitation frequency satellite-based precipitation products (1st quartile, 2nd quartile, 3rd quartile, and the mean).
SeasonCMORPH (Wet h/90 Days)IMERG (Wet h/90 Days)PERSIANN (Wet h/90 Days)
1st2nd3rdMean1st2nd3rdMean1st2nd3rdMean
Spring13.014.418.916.634.242.958.346.921.424.126.624.1
Summer1.32.03.12.47.710.012.210.54.75.76.75.8
Autumn3.03.56.15.29.612.621.816.83.34.05.04.3
Winter10.213.320.917.130.641.256.945.613.516.118.916.5
Table 2. Performance metrics of monthly data of the satellite-based precipitation products relative to rain gauges over the UAE.
ProductRMSE (mm)nRMSE (mm)pBIAS (%)CC
CMORPH13.0411.74 −15.650.62
IMERG12.4811.56 26.410.71
PERSIANN18.9218.24 68.190.41
Note: RMSE = root mean square error, nRMSE = normalized root mean square error, pBIAS = percentage bias, CC = correlation coefficient.
Table 3. The fraction of the area that experiences a significant change-point (Pettitt’s test), a significant trend (Correlated Seasonal Mann–Kendall test), and the years with the largest change point for the different precipitation products.
ProductArea with Significant Change-PointYear with Largest Change-PointArea with Significant TrendPart of UAE with Significant Positive Trend
CMORPH6.61%2010 (2%)15.30%10%
IMERG15.37%2012 (11%)66.56%63%
PERSIANN09.61%2015 (08%)5.10%5%
Rain Gauge2 stations2013 & 2015 (1 each)8 Stations6 stations
Publisher’s Note: MDPI stays neutral with regard to jurisdictional claims in published maps and institutional affiliations.

