Article

Degradation of Tryptophan by UV Irradiation: Influencing Parameters and Mechanisms

College of Civil Engineering and Architecture, Zhejiang University, Hangzhou 310058, China
*
Author to whom correspondence should be addressed.
Water 2021, 13(17), 2368; https://doi.org/10.3390/w13172368
Submission received: 22 July 2021 / Revised: 22 August 2021 / Accepted: 23 August 2021 / Published: 28 August 2021
(This article belongs to the Section Wastewater Treatment and Reuse)

Abstract

:
The chlorination of dissolved amino acids can generate disinfection by-products (DBPs). To prevent the formation of DBPs, we examined the UV-induced degradation of tryptophan (Trp). In order to further understand the impact of UV disinfection on Trp, the effects of initial concentrations of Trp, pH, temperature, concentrations of NO3, HCO3 and Cl on Trp removal were investigated, and a degradation mechanism was also proposed. The results demonstrated that degradation fitted a pseudo first-order reaction kinetic model. The degradation of Trp was mainly caused by direct UV degradation. The apparent rate constant kobs decreased with the increase in initial Trp concentration and increased with increases in pH and temperature. The thermal degradation activation energy was 19.65 kJ/mol. Anions in water also had a significant influence on the degradation of Trp. HCO3 and NO3 contributed to the kobs of Trp, but Cl inhibited the degradation rate. By electron paramagnetic resonance (EPR) spectroscopy, ·OH was proven to be formed during the degradation of Trp by UV. Based on the intermediate products of C11H15NO3, C10H15N and C9H13N detected by LC-MS-MS, the degradation pathway of Trp was speculated.

1. Introduction

Dissolved organic nitrogen in surface water bodies primarily consists of amino acids (AAs), which are present in concentrations ranging from 20 to 10,000 µg/L [1]. Cai, et al. [2] detected that the total AA content in East Taihu Lake was 32,158 ng/L during autumn and approximately 3000 ng/L for the rest of the year. Dotson and Westerhoff [3] reported that the total concentration of AAs, free and combined, was in the range of 50–1000 µg/L in rivers, streams and lakes. The AA concentration in natural water bodies is drastically affected by the presence of algae; AA concentrations increased with the occurrence of algal blooms [1,4].
The total AA concentration includes free AAs (0.20–0.25) and combined AAs in the form of proteins, peptides and humic-bound AAs. Although the overall free AA concentration is relatively low, a small fraction remains even after the growth of cyanobacteria or blue-green algae [5]. In addition, these low-molecular-weight AAs can only be removed by the chlorination process in traditional water treatment plants [3]. However, chlorination or chloroamination converts the free AAs to a variety of disinfection by-products (DBPs), including trihalomethanes, haloacetaldehydes, haloacetonitriles, haloacetamides and halonitromethanes [6,7,8]. For example, aspartic acid and Trp can be converted to dichloroacetonitrile [9], while L-tyrosine and aspartic acid form dichloroacetamide [8].
Several methods, such as improved coagulation, nanofiltration, reverse osmosis, ultraviolet (UV) irradiation and advanced oxidation processes, have been proposed to control the number of DBP precursors [10,11,12]. Of these, low-pressure UV irradiation is a promising alternative for disinfection in drinking water treatment plants because it is a cost-effective process with an easily implementable system [13]. Recently, UV disinfection has received considerable attention in the field of water treatment [14]. Thus, UV irradiation could potentially be applied to degrade AAs; however, the mechanism and different degradation products have not yet been elucidated.
In this study, the degradation of Trp by UV irradiation was examined in water. Trp, contains an indole ring [15,16] and is a typical naturally occurring AA present in water bodies. The chlorination of Trp produces significant amounts of THMs (trihalomethanes) and dichloroacetonitrile [17,18], which may adversely affect human health.
In this study, the effects of initial Trp concentration, pH, temperature, NO3, HCO3 and Cl concentrations on Trp removal were investigated. Moreover, the proposed degradation pathway was elucidated.

2. Materials and Methods

2.1. Chemicals

All chemicals were of analytical grade, except as noted. Trp (≥98%) and methanol were obtained from Aladdin (Shanghai, China). Atrazine and t-butanol were purchased from Sigma Aldrich. Sodium dihydrogen phosphate and disodium phosphate were purchased from Sinopharm Chemical Reagent Co. Ltd. (Shanghai, China), and were used as received. All solutions were prepared using ultrapure water (NW Ultrapure water system, HealForce, Shanghai, China), which was obtained from a Milli-Q system with a resistivity >18 MV·cm.

2.2. UV Reactor

UV irradiation experiments were conducted in a UV reactor equipped with a 6 W LP Hg UV lamp (254 nm, 4P-SE, Philips), as shown in Figure S1. A small stirring rotor was placed at the bottom of the reactor to ensure that all molecules in the solution were homogenously exposed to UV light. Atrazine and hydrogen peroxide were used as actinometers to determine the UV fluence rate (I0; 4 ×10⁻⁷ Einstein s−1 L−1) and effective path length (b; 4.1 cm) [19,20].

2.3. Experimental Procedure

All UV-induced Trp degradation experiments were performed at a constant pH, which was maintained using 10 mM phosphate buffers.
To investigate the effects of initial concentrations, temperatures and ionic concentrations on Trp degradation, a 700 mL testing solution was prepared, which consisted of Trp (0.6–10 mg/L), nitrate (0–500 mg/L) and bicarbonate ions (0–500 mg/L). The effects of pH and temperature were studied in the ranges of 6–7.5 and 7–27 °C, respectively. The mixture was stirred using a magnetic stirrer. A constant temperature was maintained by circulating cold water. Samples (1 mL) were collected at different retention times and t-butanol was added to quench the reaction. These samples were analyzed by liquid chromatography (LC). Samples (500 mL) collected after 0, 10, 20, 40, 60, 90 and 120 min were analyzed by liquid chromatography tandem mass spectrometry (LC-MS-MS).

2.4. Analytical Methods

Trp concentration was measured by high-performance liquid chromatography (HPLC; Agilent, Santa, SA). The HPLC system was equipped with an extended C18 column (4.6 × 250 mm, 5 mm, Waters Co., Milford, USA). Phosphoric acid in methanol (85% v/v) was used as the mobile phase with a flow rate of 1.0 mL/min. The excitation wavelength and emission wavelength of Trp were 260 nm and 340 nm, respectively. The HPLC graphs of Trp can be seen in Figure S2.
·OH was tested with a Bruker A300 EPR Spectrometer manufactured by Bruker, Germany. DMPO was used as an electron spin capture agent. In this experiment, because the phosphoric acid buffer solution could reduce the signal strength of DMPO-·OH, no phosphoric acid buffer solution was added to the reaction solution. The process was as follows: 10 mg/L Trp solution was exposed to UV, then 1 mL of Trp solution was quickly mixed with 1 mL of 16000 mg/L DMPO and transferred into a 200 μL capillary tube for an EPR test. Computer spectral simulations were carried out by means of Bruker WinEPR Acquisition software.
The intermediate products were characterized by LC-MS-MS. The compounds were separated on a ZORBAX-SB C18 (250 mm × 4.6 mm, 5.0 µm) column. The mobile phase was acetonitrile-isopropanol (1:1) elution, the flow rate was 1.0 mL/min, the detection wavelength was 210 nm, the column temperature was 30 °C and the injection quantity was 10 μL. Electrospray ion source positive ion mode was adopted and the scanning range was m/z 100–1500.

3. Results

3.1. Kinetic Model of UV Degradation of Trp

The pseudo first-order reaction kinetic equation is shown in Equation (1):
y = e k obs t
where t is the reaction time, y is the ratio of concentration of Trp at t to the initial concentration and kobs is the reaction rate constant.
The degradation curve of Trp is fitted by Equation (1) and the fitting curve is shown in Figure 1. The linear regression coefficient R2 of the curve was greater than 0.98 for Trp, which indicated that its reaction by UV fitted a new pseudo first-order reaction kinetic model.
UV degradation principles can be divided into direct degradation and indirect degradation. Direct degradation refers to the direct oxidation, bond breaking, isomerization and rearrangement of organic matter by UV [21]. Indirect degradation refers to the production of radicals such as · OH. In order to verify the existence of · OH, a radical quencher TBA (tert-butyl alcohol, 0.5 mM) was added during the UV treatment to compare the differences between direct and total degradation with and without TBA. Figure 1 shows that the UV degradation could generate · OH. From two kobs of curves, we inferred that degradation of Trp occurred mainly by direct UV degradation.
The first pathway to produce ·OH by UV irradiation is to excite and react Trp with water molecules to generate ·OH [22]. The second pathway is the intermediate reaction of Trp through hydration electrons, superoxide anion radicals and hydrogen peroxide, which finally produces hydroxyl radicals [23,24]. The reaction equation is shown in Equations (2) and (3).
Pathway 1:
Trp + hv Trp Trp + H 2 O Trp - H + OH
Pathway 2:
Trp*→Trp+ + eaq
eaq + O2→·O2
2·O2 + 2H+→H2O2 + O2
H2O2 + hv→2·OH

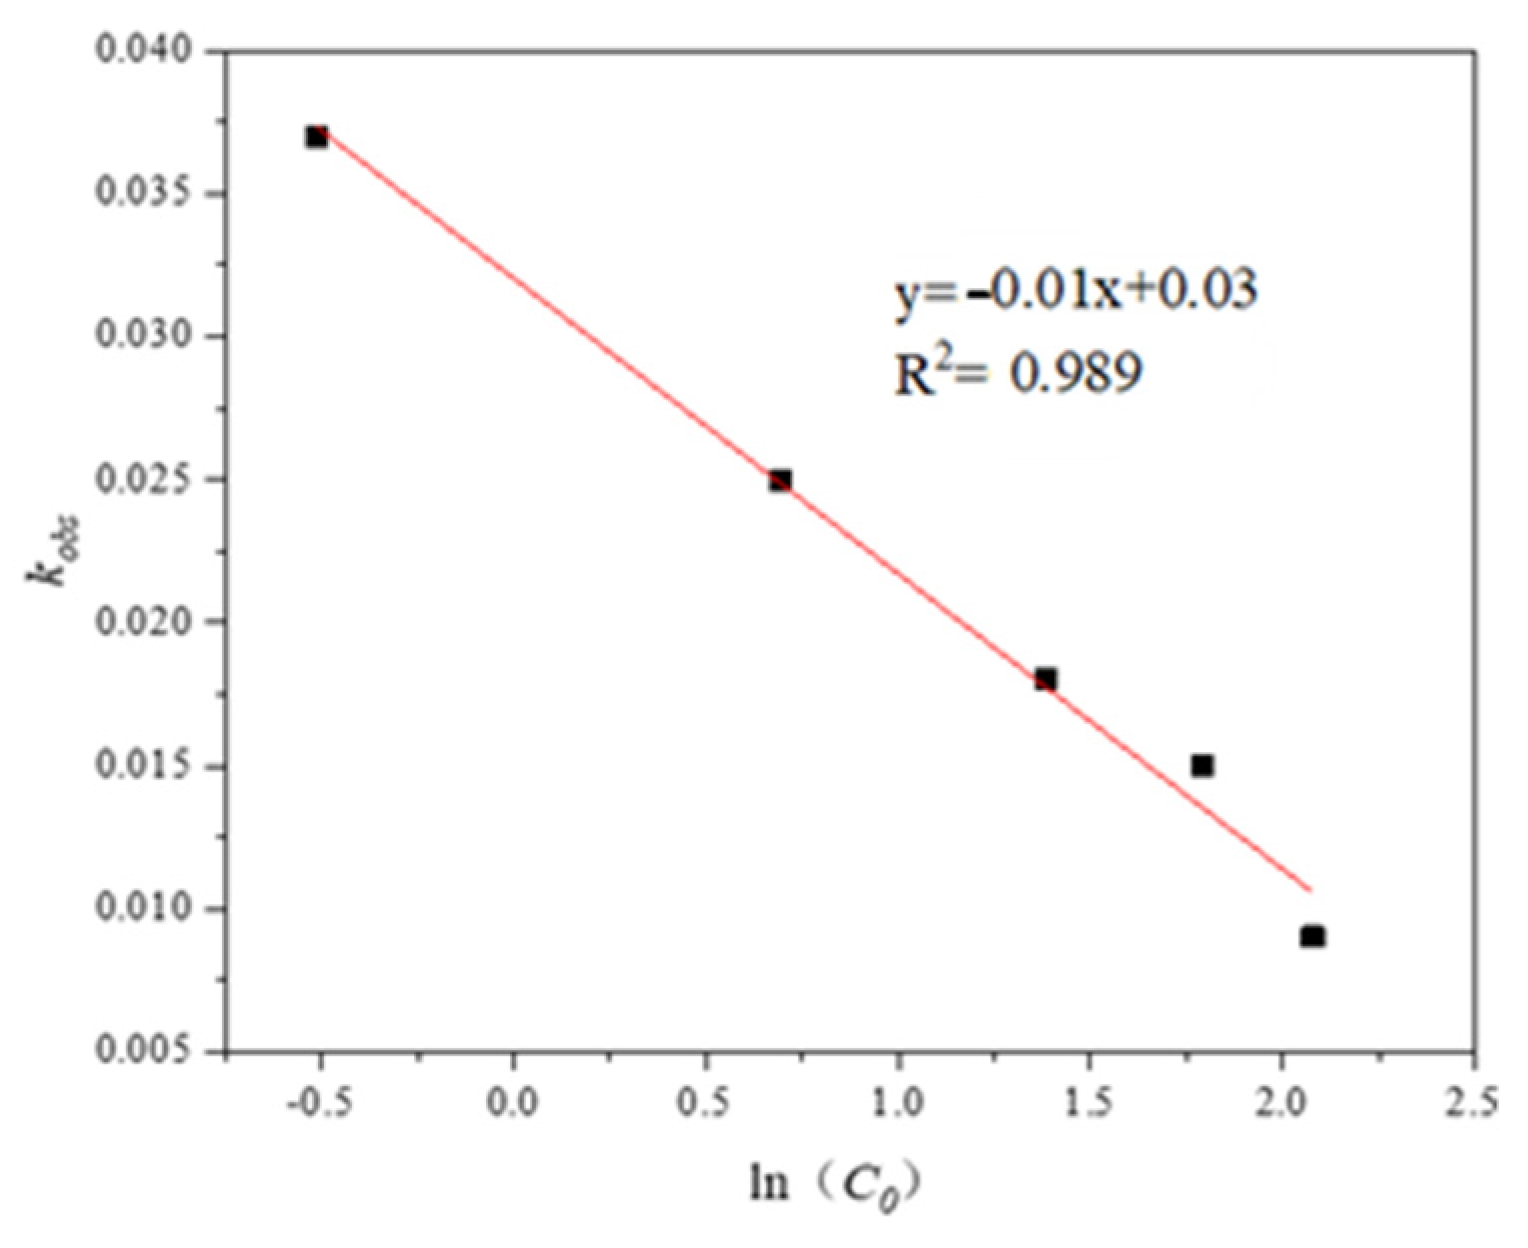
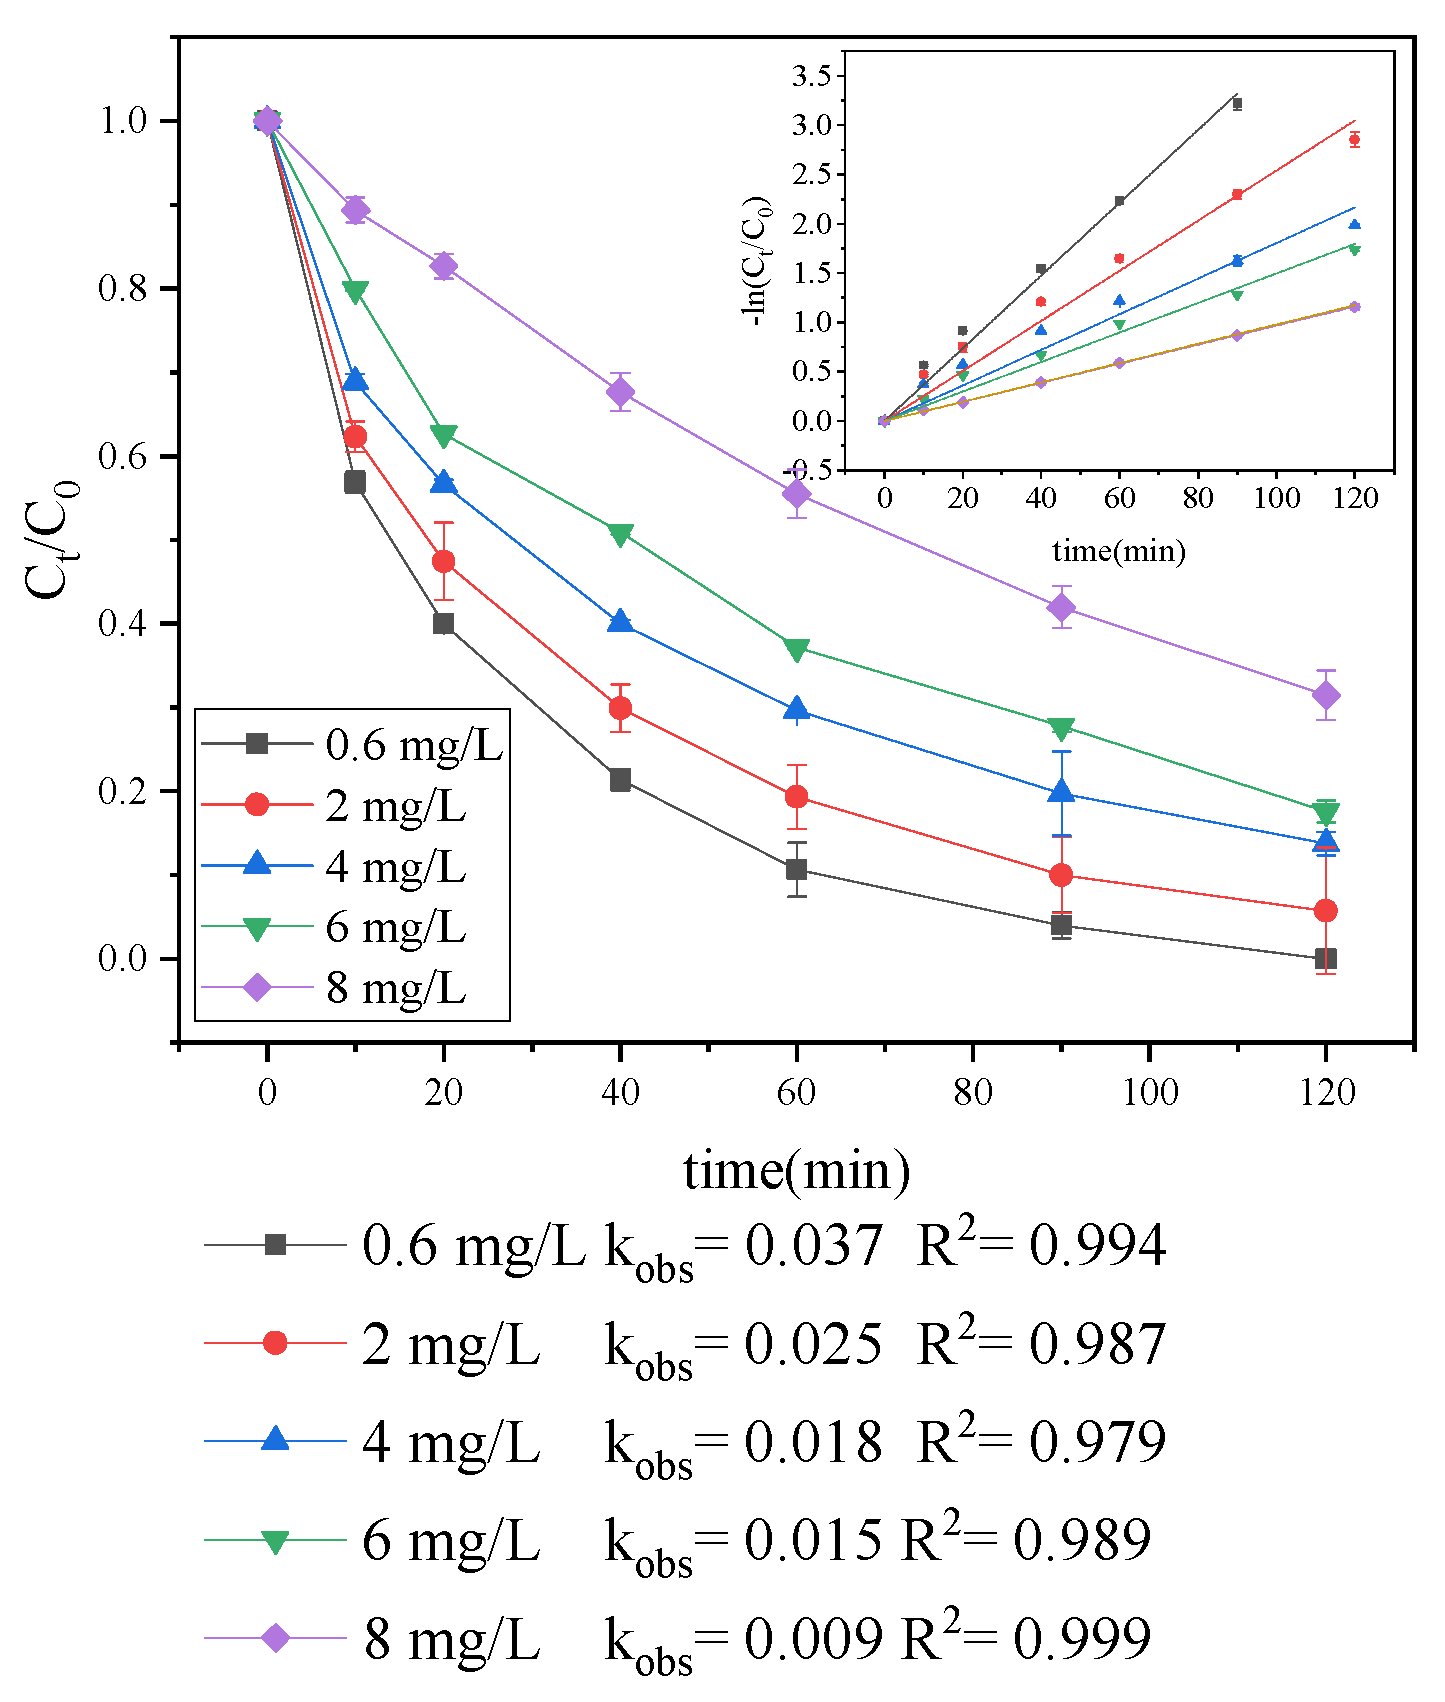
3.1.1. Effect of Initial Trp Concentration
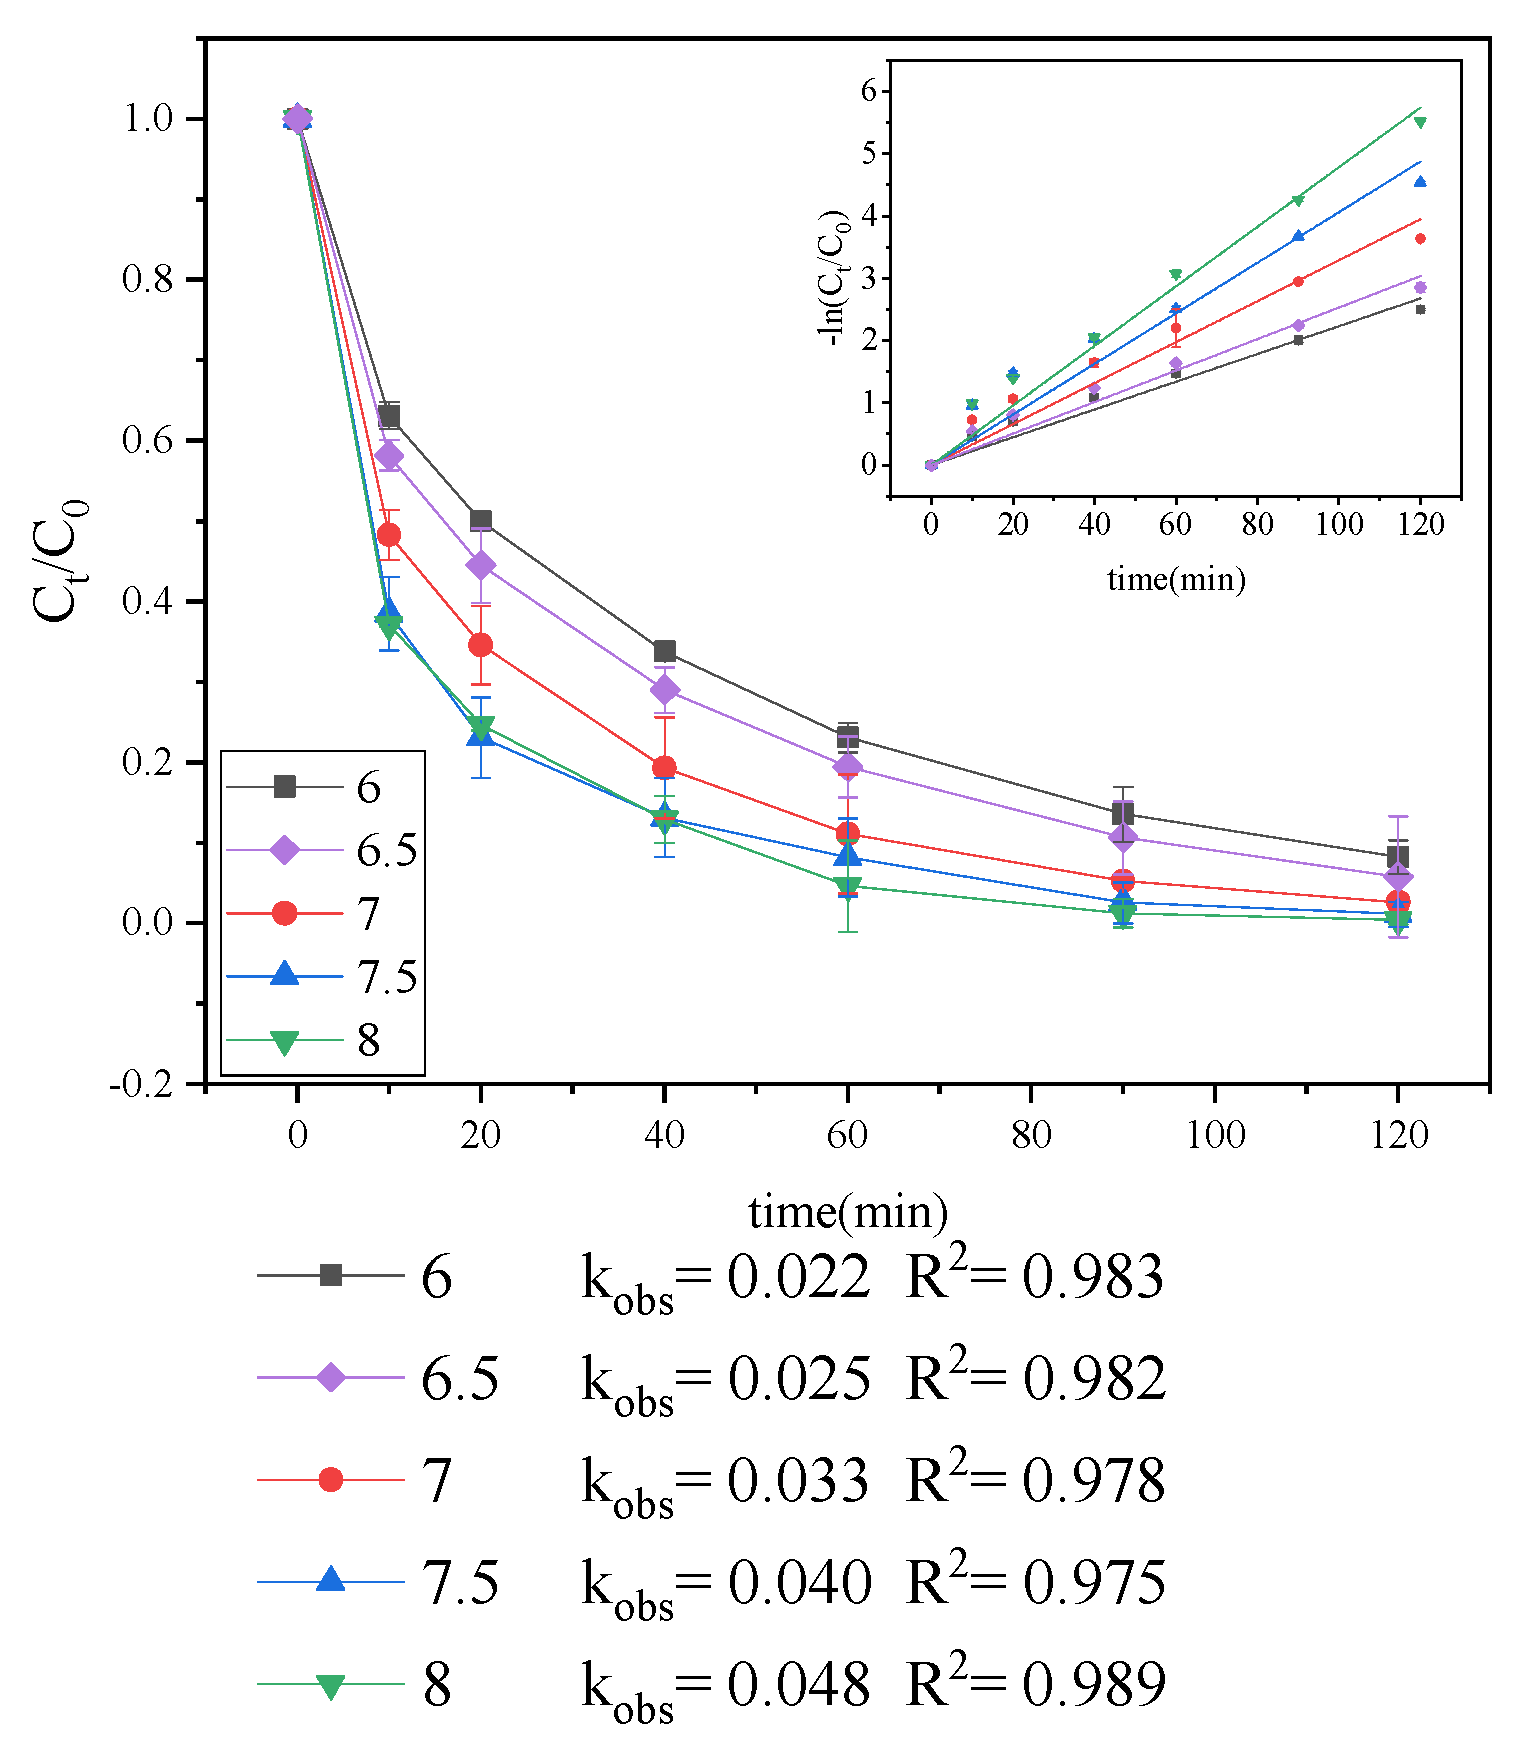
The degradation of Trp was examined at different initial concentrations (i.e., 0.6, 2, 4, 6, 8 mg/L). As displayed in Figure 2, increasing the initial Trp concentration decreased the Trp removal rate, and these findings are consistent with those of previous studies [25,26].
On the one hand, the light quantum generated by unit time UV irradiation effectively remains unchanged. The higher the Trp concentration, the less light quantum captured by a single Trp molecule, which leads to the chemical bond of Trp being less likely to be broken and slows down the direct degradation rate of Trp. On the other hand, the rate of ·OH generation remains constant if the UV intensity is maintained, while the rate of ·OH consumption increases with an increase in the initial Trp concentration [27,28]. Moreover, an increase in the initial Trp concentration increases the amount of organic matter per unit volume, which decreases the exposure of a molecule to UV irradiation. Thus, the concentration of ·OH also decreases, causing the reaction rate to decrease.
In order to analyze the relationship between initial Trp concentration and kobs, the experimental data were fit to Equation (4), as shown in Figure 3. It was shown that, with the increase in initial Trp concentration, the kobs became smaller and the rate of descent slowed down.
kobs = −0.01ln(C0) + 0.03

3.1.2. Effect of pH

It is known that pH can affect the mechanism and pathways of degradation [21].To clarify how pH affected the degradation of Trp during UV irradiation, the samples with different pH (i.e., 6.0, 6.5, 7, 7.5, 8) were prepared; the results are shown in Figure 4. The degradation rate increased with an increase in pH, and was the highest at pH 8, implying that increasing the solution pH promoted Trp removal.
According to a widely acknowledged previous study, increasing the solution pH reduces the ratio of ·OH, as shown in Equation (5). When the pH was increased from 4.7 to 8.4, the ·OH concentration decreased by 80% [29]. However, this experiment found that, with the increase in pH, the degradation rate of Trp increased, which indicates that the main mechanism of Trp degradation is not indirect degradation through the generation of ·OH, but direct UV degradation. Bergman [30] found that the hydrogen bonded to the first carbon in a nitrogen-containing heterocyclic ring is highly acidic, implying that the synergistic effect of alkaline conditions and ultraviolet light could promote the ring-opening of nitrogen-containing heterocycles, thus accelerating direct degradation.
OH + OH O + H 2 O

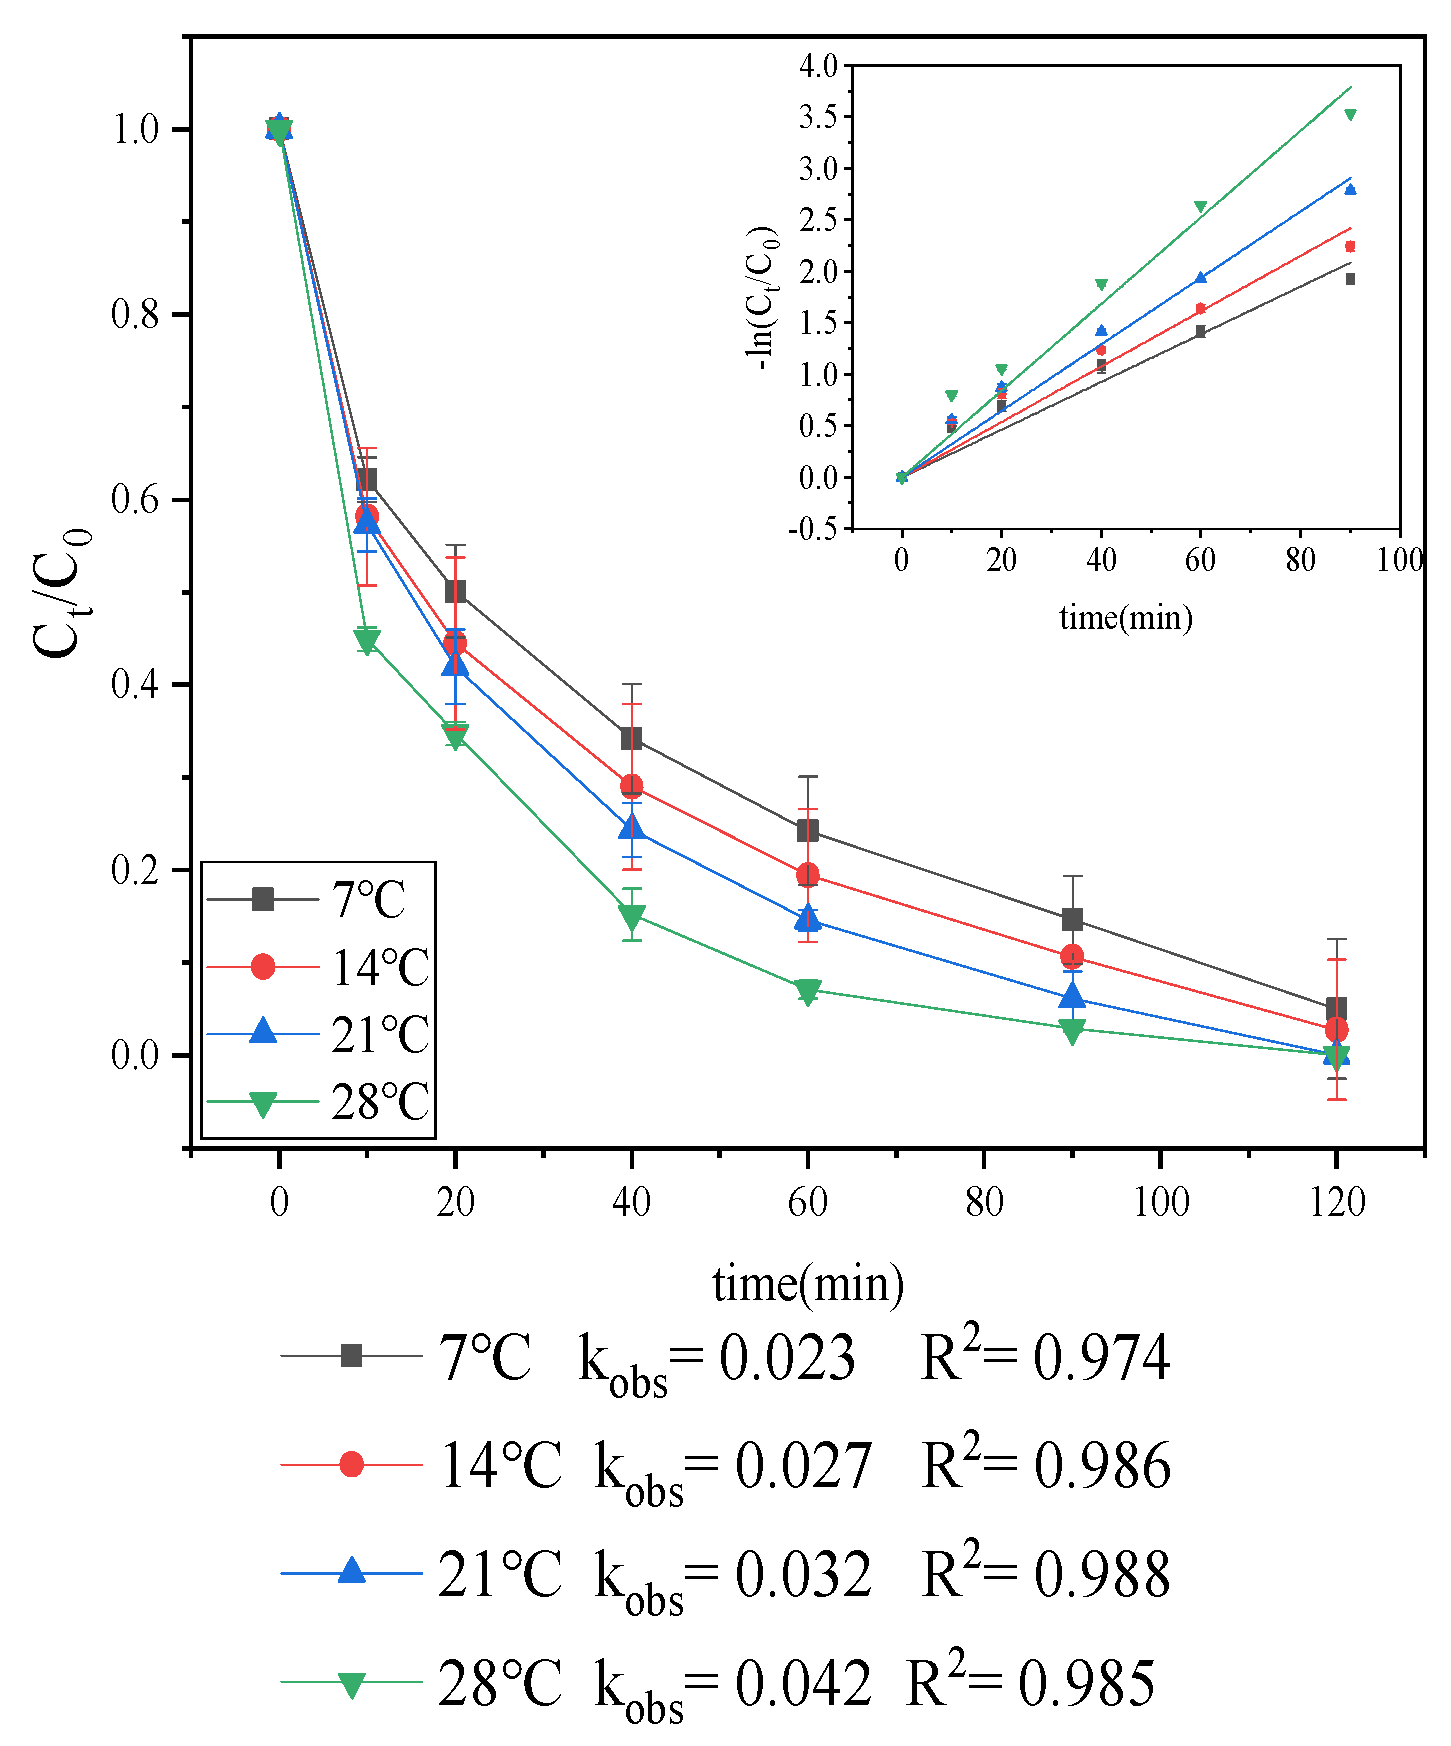
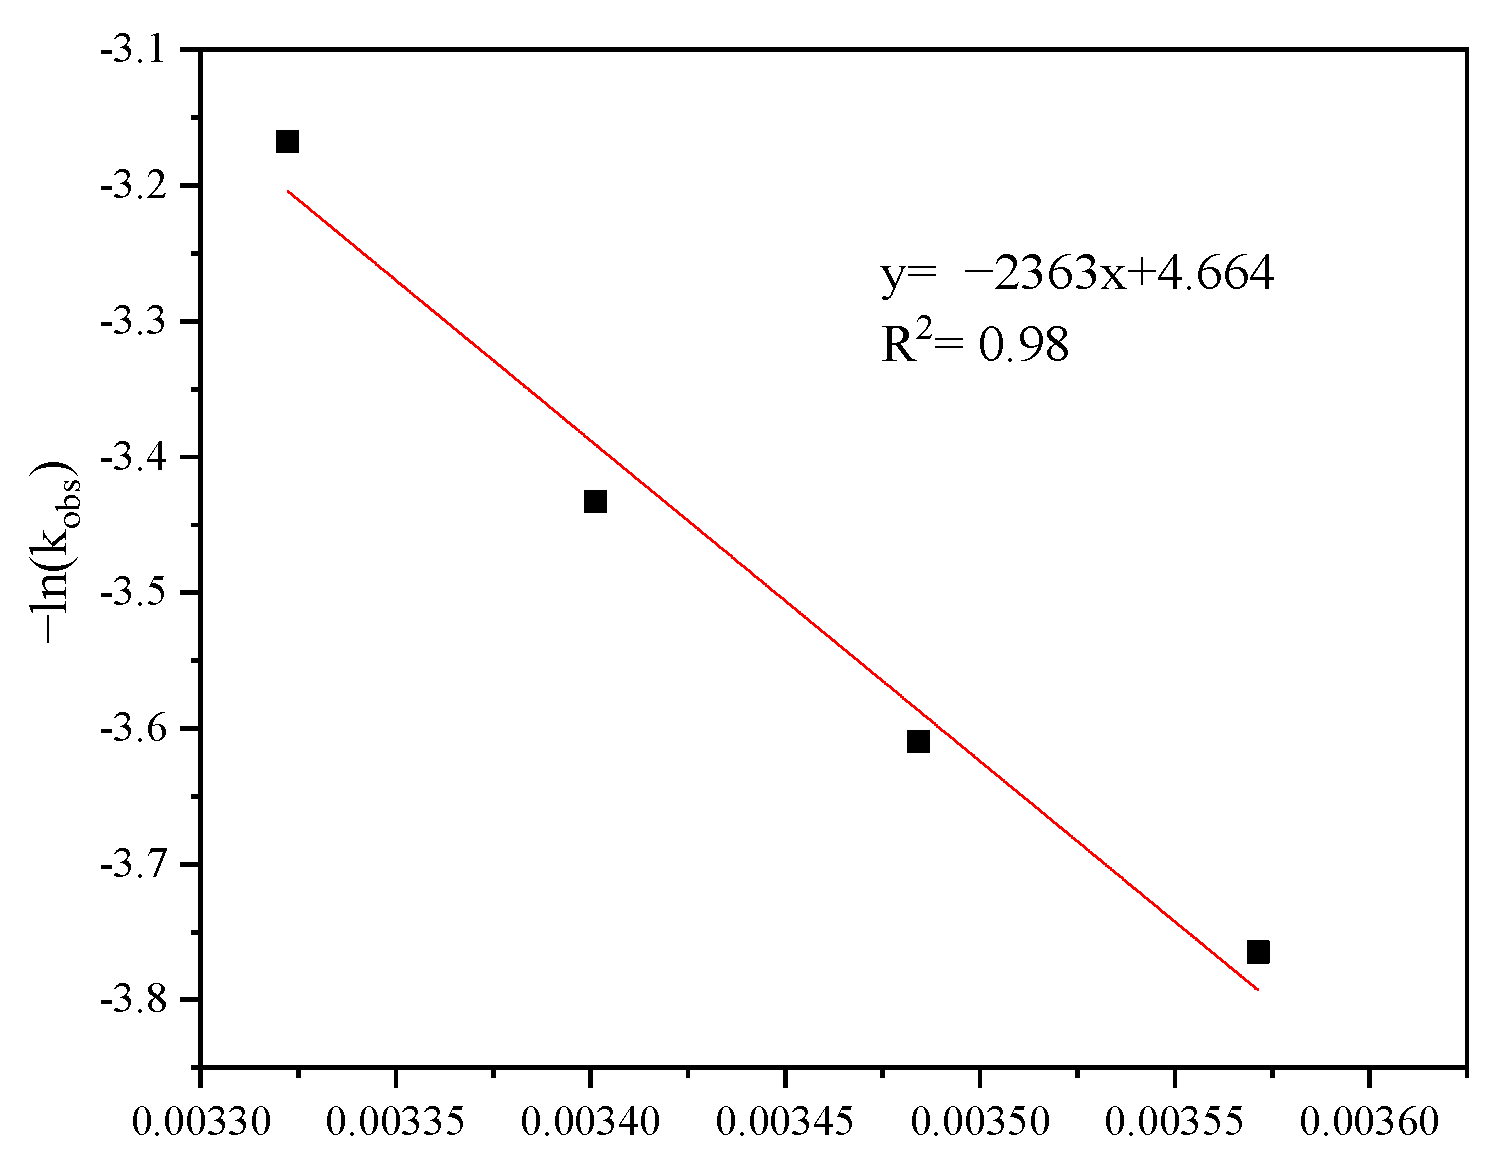
3.1.3. Effect of Temperature

The effect of temperature on the degradation of Trp is shown in Figure 5, which demonstrates that Trp degradation is facilitated at a higher temperature. Owing to the low activation energy, the rate constant for the reaction between ·OH and Trp is largely unaffected by reaction temperature [31,32], suggesting that reaction temperature directly contributes to Trp degradation.
To further investigate the influence of reaction temperature on Trp degradation, the calculated rate constant kobs, was fitted with the Arrhenius equation [31], as shown in Equation (6):
ln k obs = ln A Ea RT
where A is the pre-exponential factor, Ea is the apparent activation energy, R is the universal gas constant (8.314 J/mol/K) and T is the temperature in Kelvin.
As shown in Figure 6, Ea was calculated to be approximately 19.65 kJ/mol. Generally, most activation energy of the chemical reaction ranged from 50 to 250 kJ/mol, and the lower the activation energy, the easier it is for the reaction to take place. Therefore, temperature has a significant effect on the UV degradation of Trp and it is speculated that temperature promotes the direct degradation of Trp.

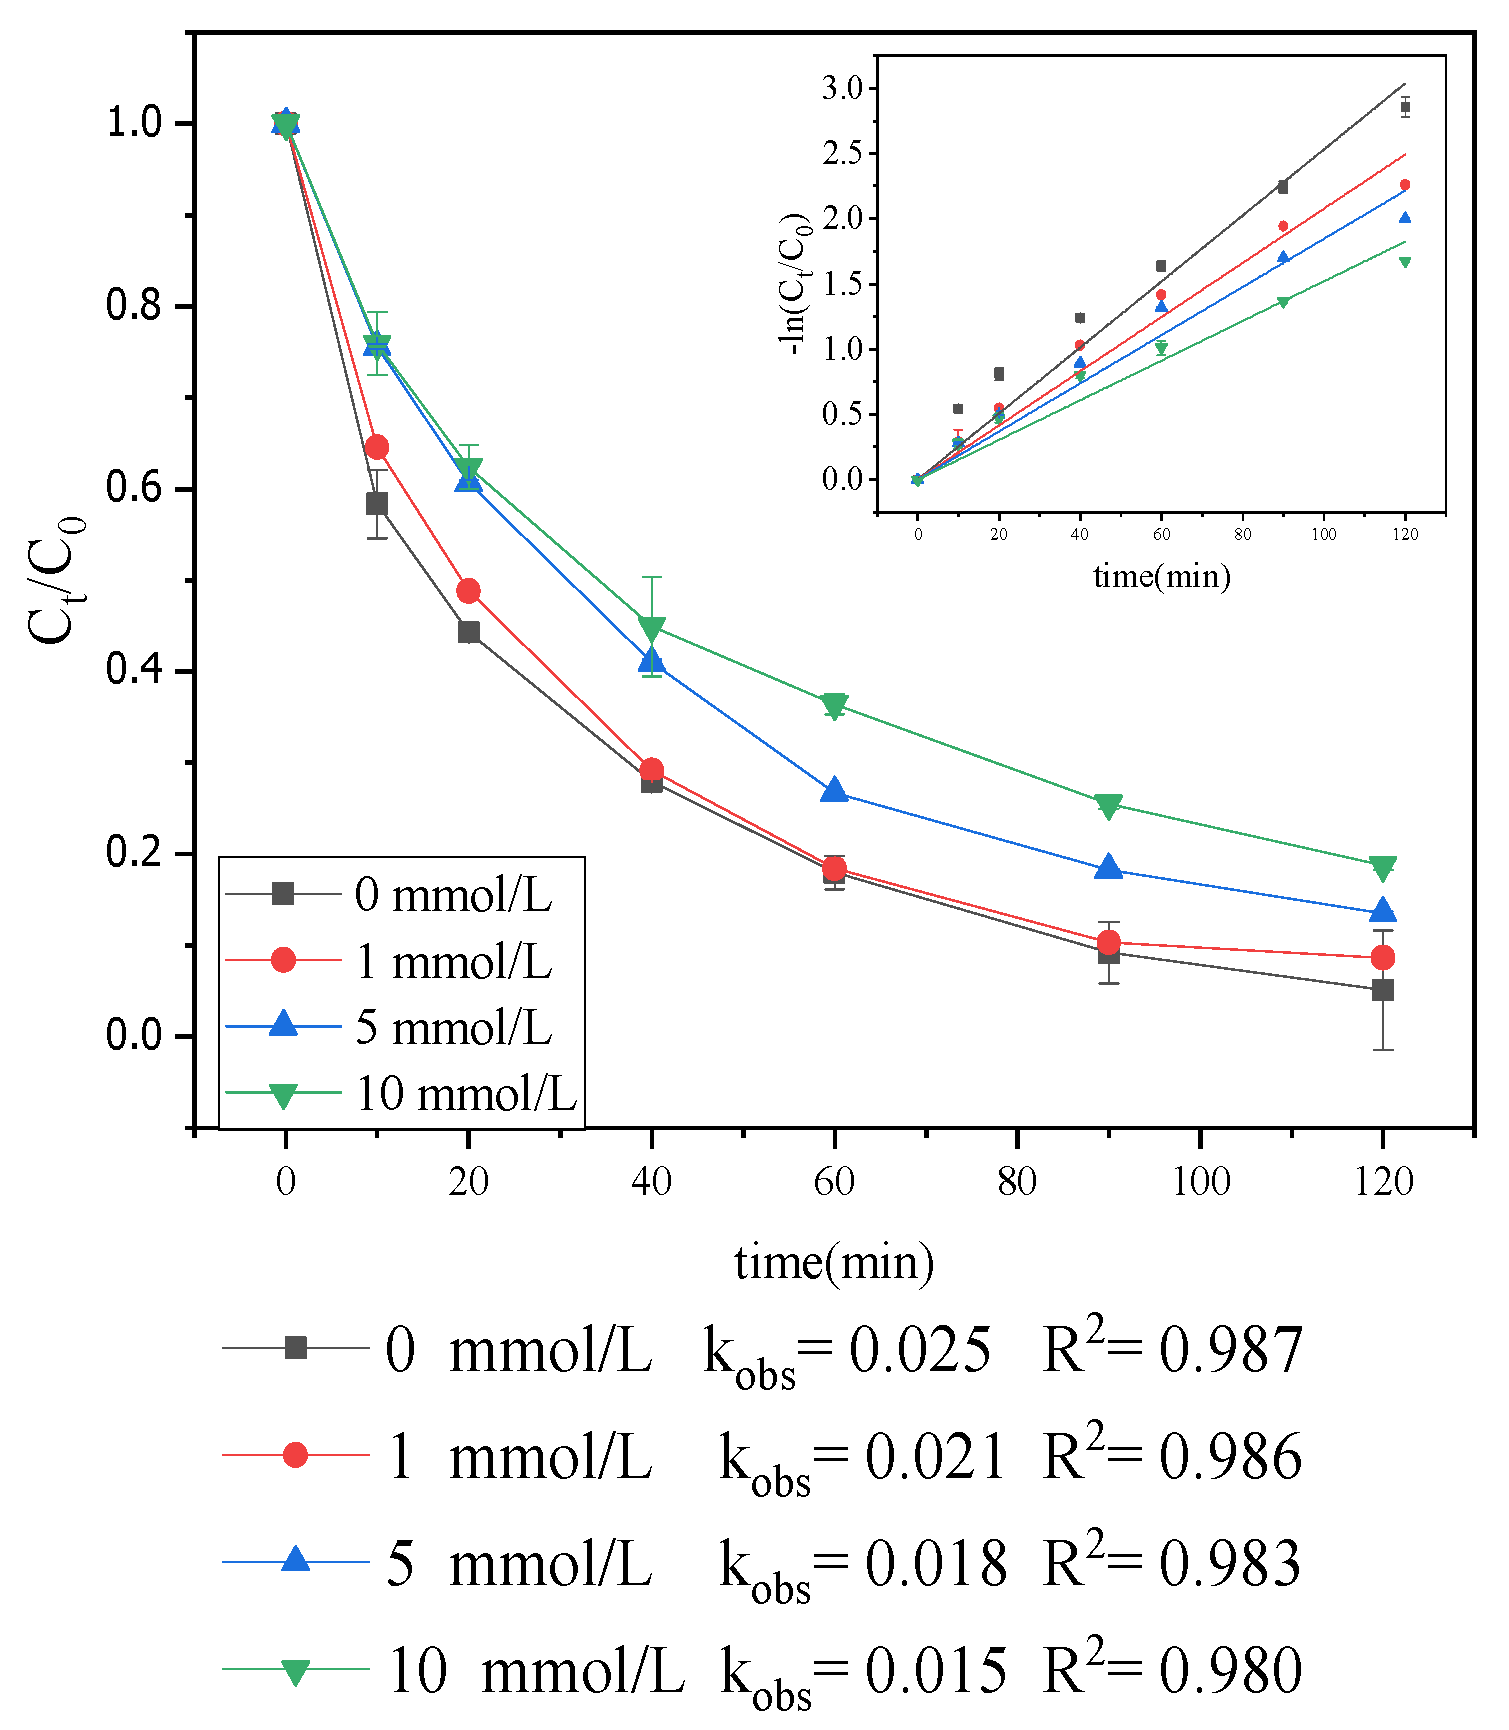
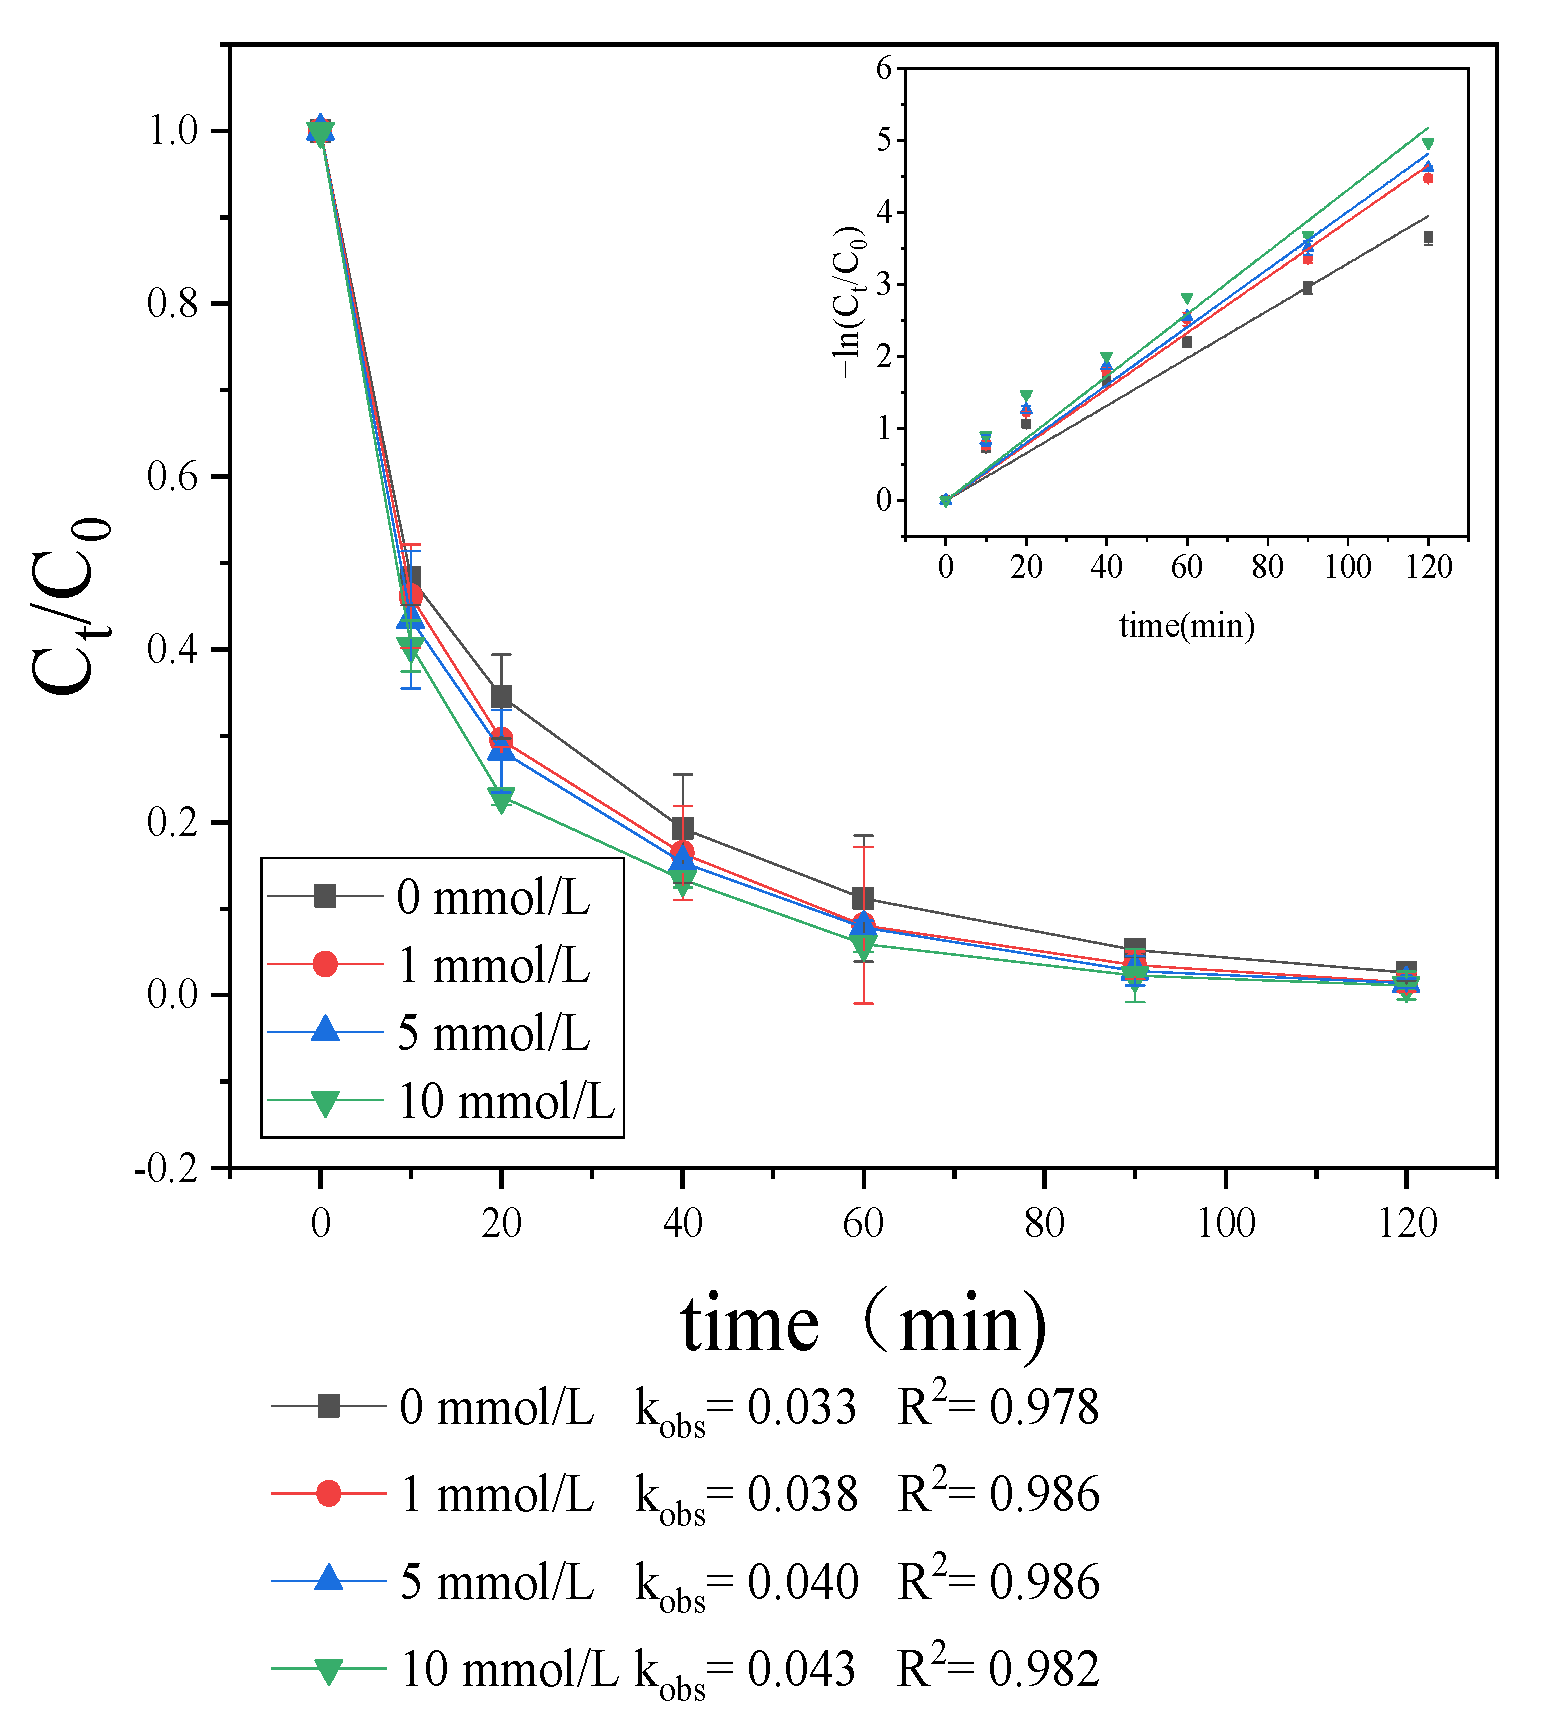
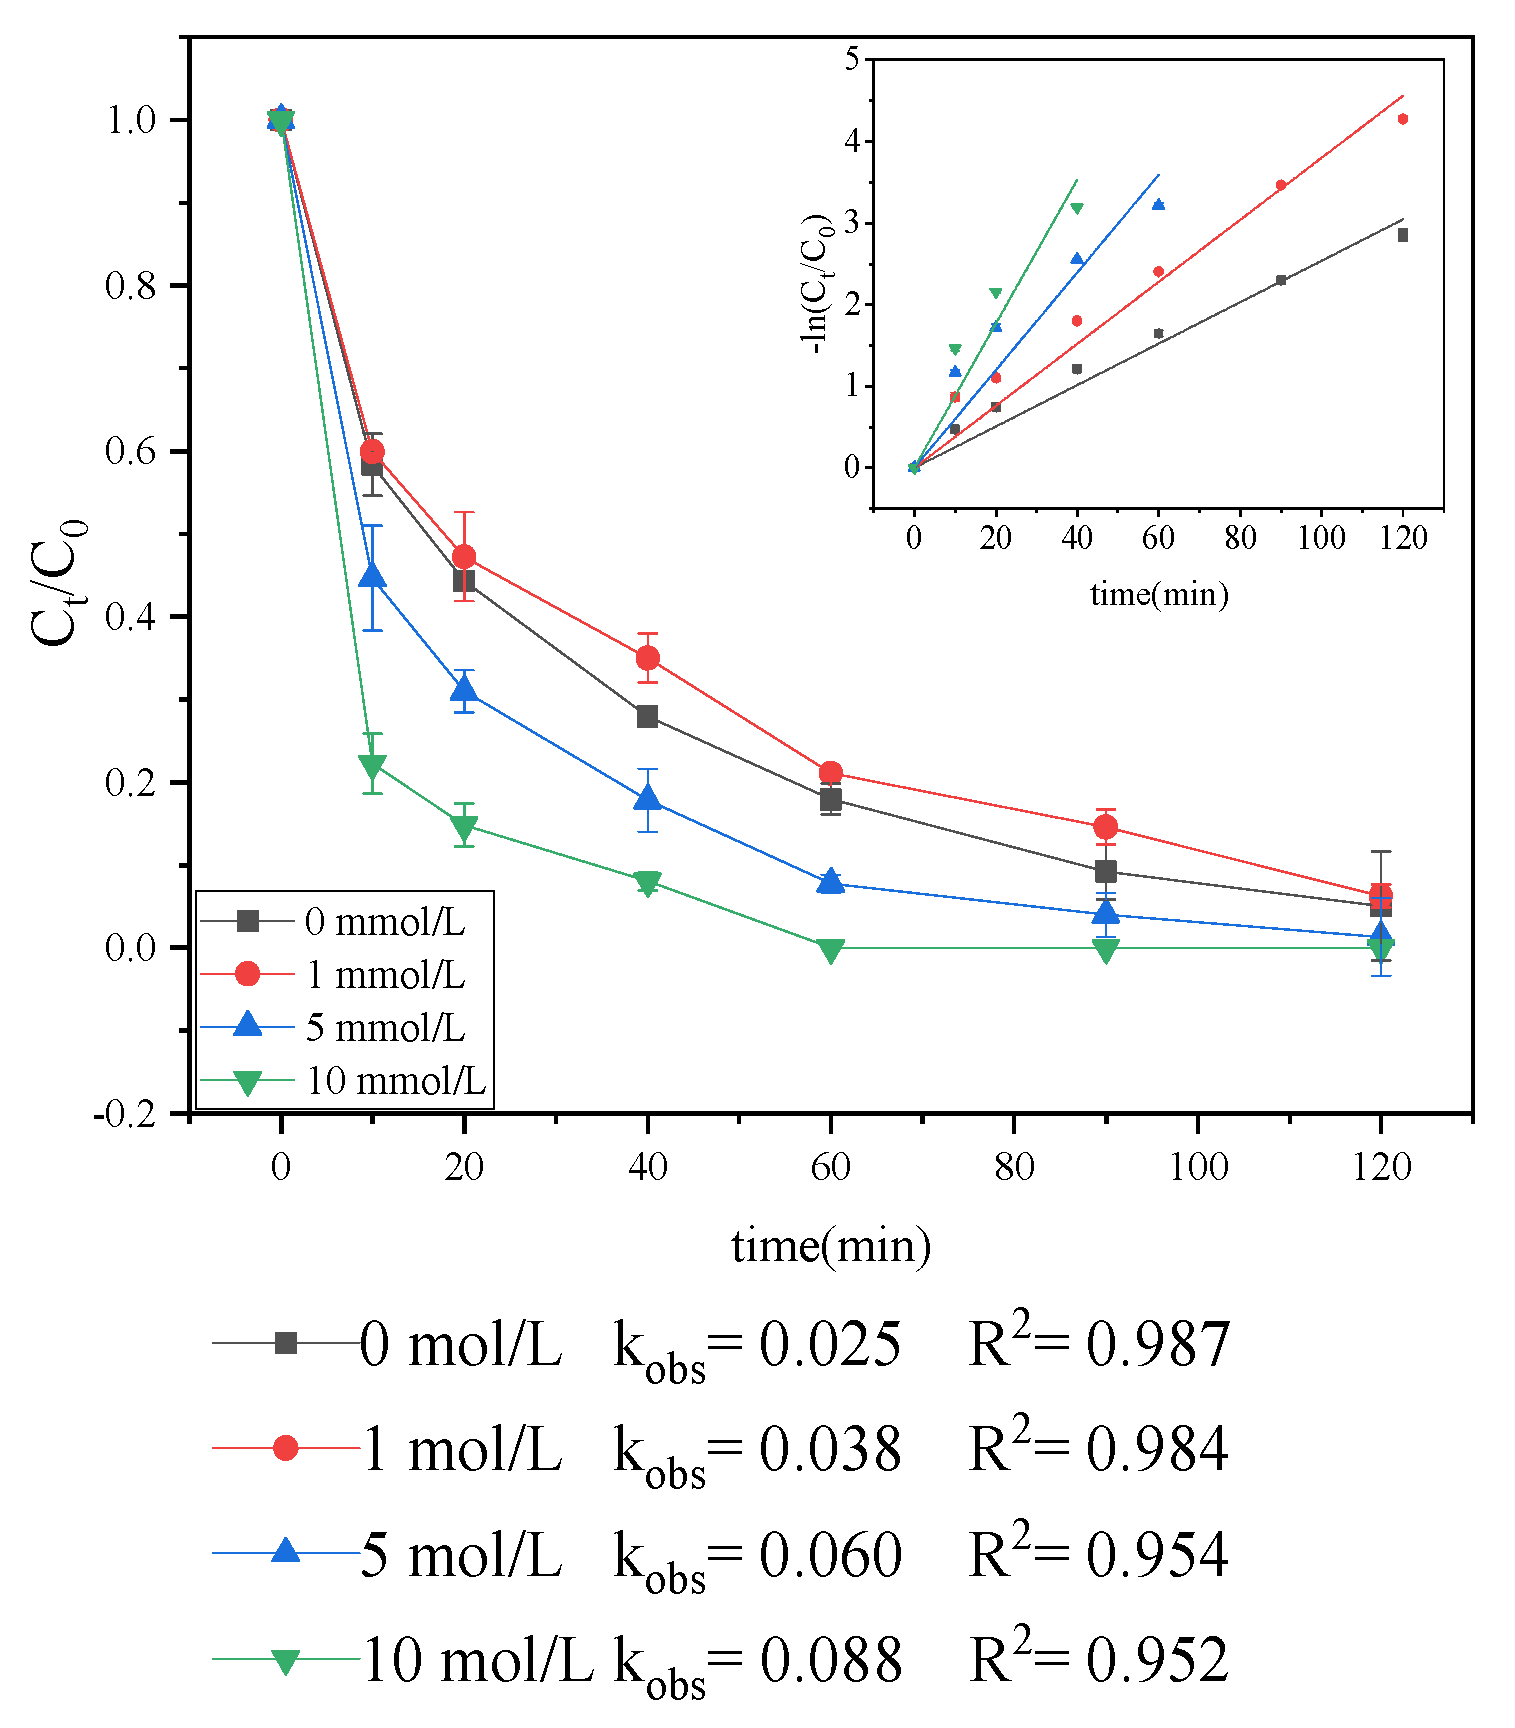
3.1.4. Effect of Water Matrix

HCO3 is a common anion (50–200 mg/L) in natural water [33] that can affect the removal rate of organic pollutants [34]. HCO3 can react with ·OH to form CO32− and H2O (Equation (7)). It should be noted that pH can significantly affect the form of bicarbonate ions, and when the pH is too low, hydrolyzed bicarbonate change to carbon dioxide. In order to better study the effect of bicarbonate on the UV degradation of Trp, pH was set at 7; the result is presented in Figure 7.
·OH + HCO3→CO32− + H2O
As shown in Figure 7, HCO3 can promote the degradation of Trp. Unlike ·OH, HCO3 has a high selectivity and preferentially reacts with compounds with electron-rich moieties, such as AAs, via an electron transfer or hydrogen abstraction reaction [35,36]. In addition to the functional groups of AAs themselves, Trp has electron-rich indole side chains, which are more likely to react with HCO3 to accelerate the degradation of Trp.
Similar to HCO3, NO3 is also widely present in natural water bodies at concentrations ranging from 0.01 mmol/L to 1 mmol/L. The photolysis of NO3 could generate ·OH (Equation (8)), which could degrade the organic matter present in natural water bodies [37]. Figure 8 demonstrates that NO3accelerates the photodegradation of Trp
NO3 + hv→NO3 + NO2 + O
NO3 + hv→·NO2 + 0.5O2
NO2 + hv→·ON + O
O + H2O→·OH + OH
Because the concentration of Cl in natural water is typically 1–100 mg/L, the effect of different concentrations of Cl on the UV degradation of Trp was also investigated. The experimental results are shown in Figure 9.
With the increase in Cl concentration from 1 mmol/L to 10 mmol/L, the kobs of Trp decreased from 0.021 to 0.015 min−1, as shown in Figure 9. Chlorine-containing free radical species are known as active chlorine species (RCS), including · Cl, HOCl and Cl2 with oxidation potentials of 2.47 V, 1.6–1.8 V and 2.0 V [38,39], respectively. These radicals have a lower potential than that of ·OH (E = 2.8 V) [40]. The method of generating RCS can be seen in Equation (9). A number of studies have shown that RCS has a weak ability to oxidize electron-rich organics [38,41,42]; thus, it is speculated that ·OH is converted into active chlorine species with a weaker oxidization ability by the increase in Cl concentration, which slows down the degradation rate of Trp.
2Cl + ·OH + H+ ↔ Cl2 + H2O
Cl + ·OH↔HOCl
Cl + Cl↔Cl2

3.2. Mechanism of Trp Degradation

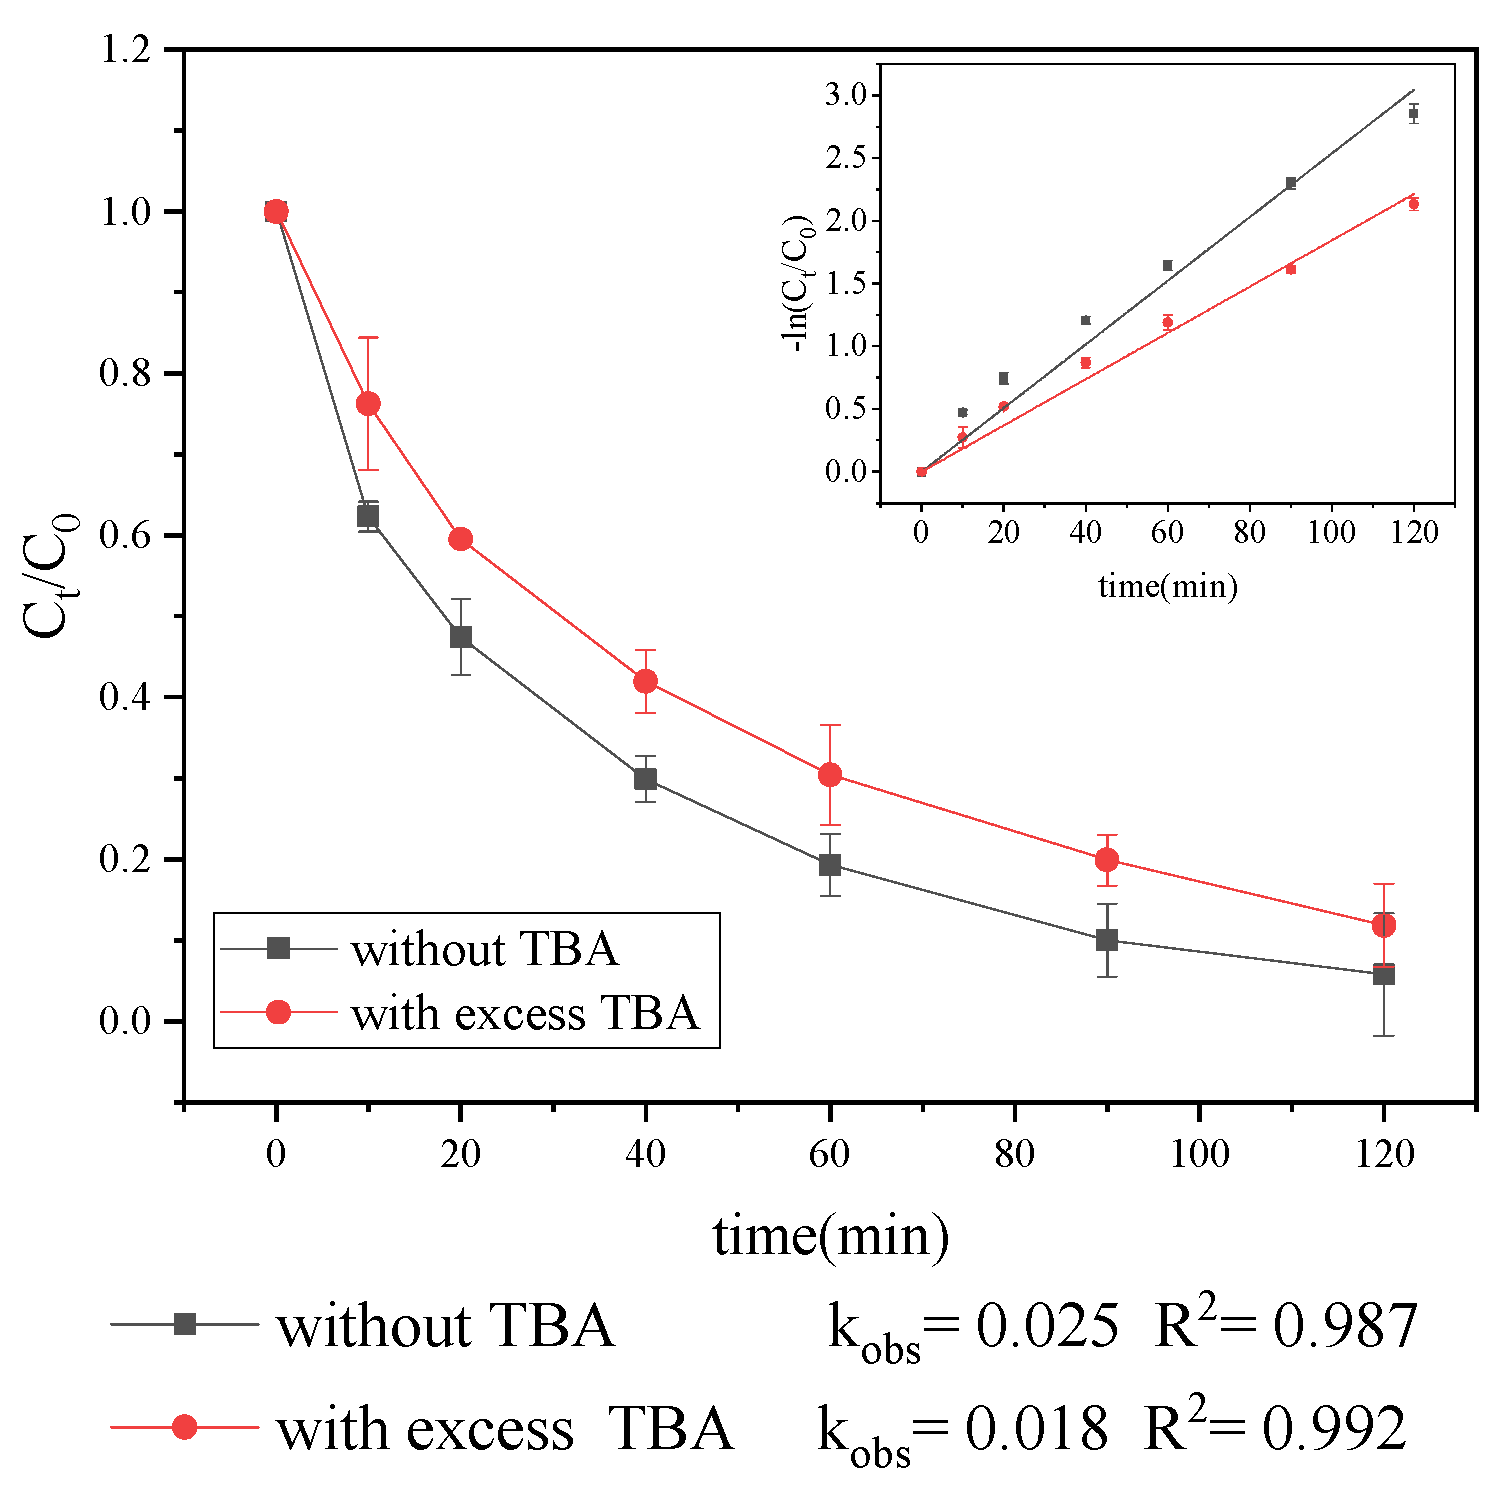
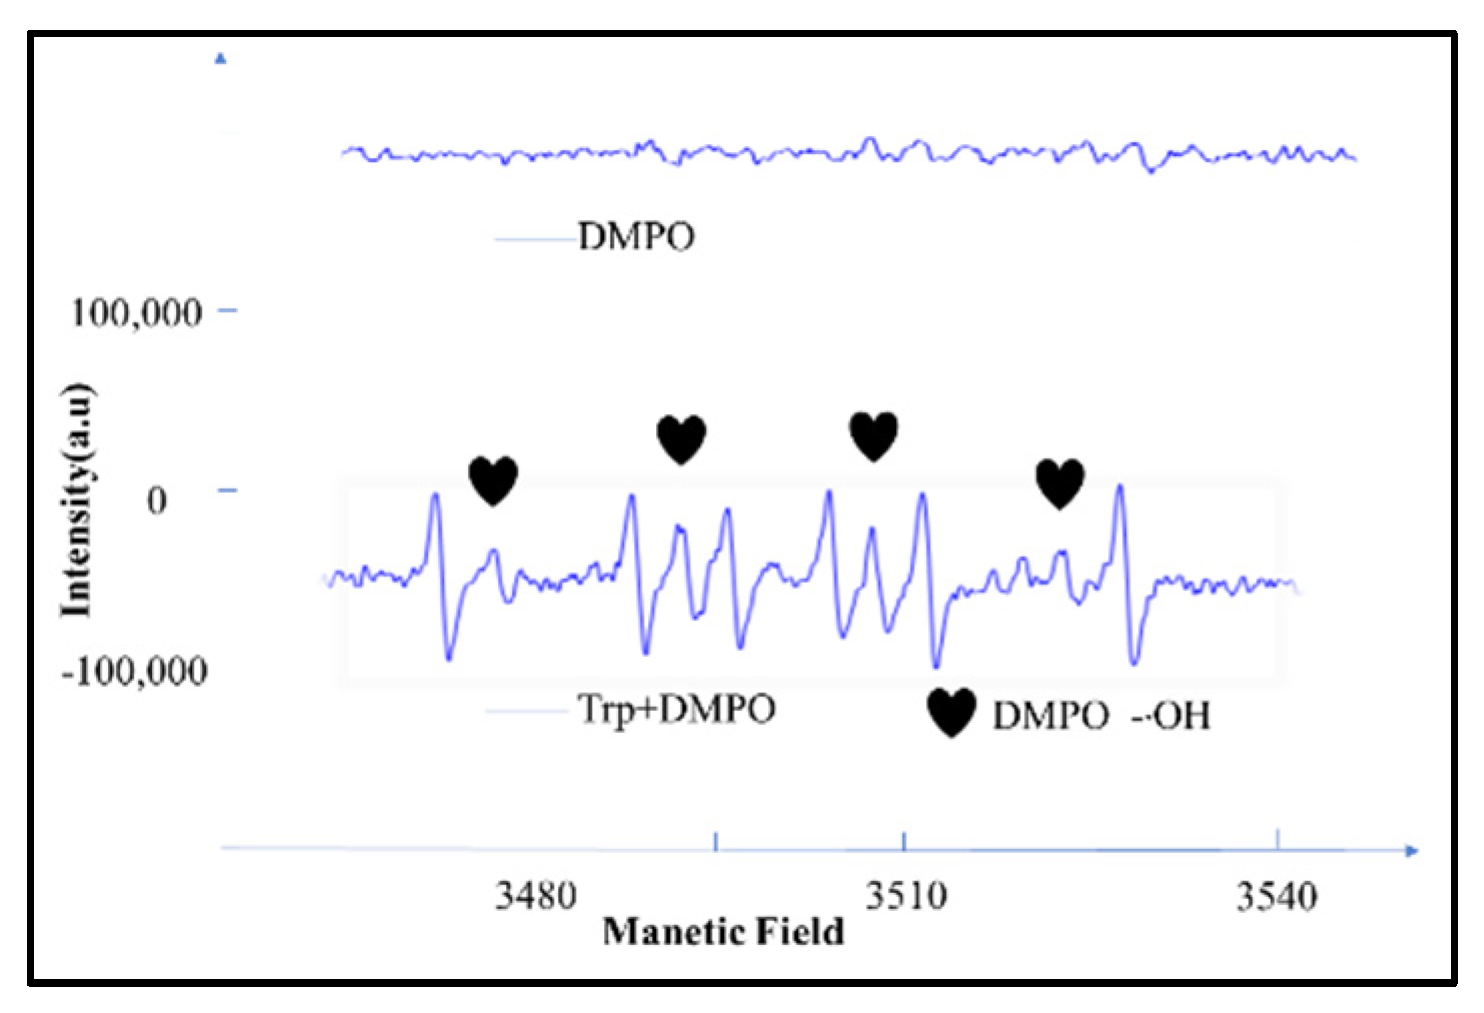
3.2.1. Generation of Radical Species

The presence of ·OH in the reaction mixture was further investigated by the addition of a spin trapping agent, 5,5-dimethyl-1-pyrroline-1-oxide (DMPO), followed by electron paramagnetic resonance (EPR) spectroscopy [43]. During this experiment, the phosphate buffer solution was not added in the reaction mixture because it could decrease the amount of DMPO and the signal intensity of the DMPO-OH adduct [44]. The results from the EPR analysis(Figure 10) further verified the formation of ·OH.

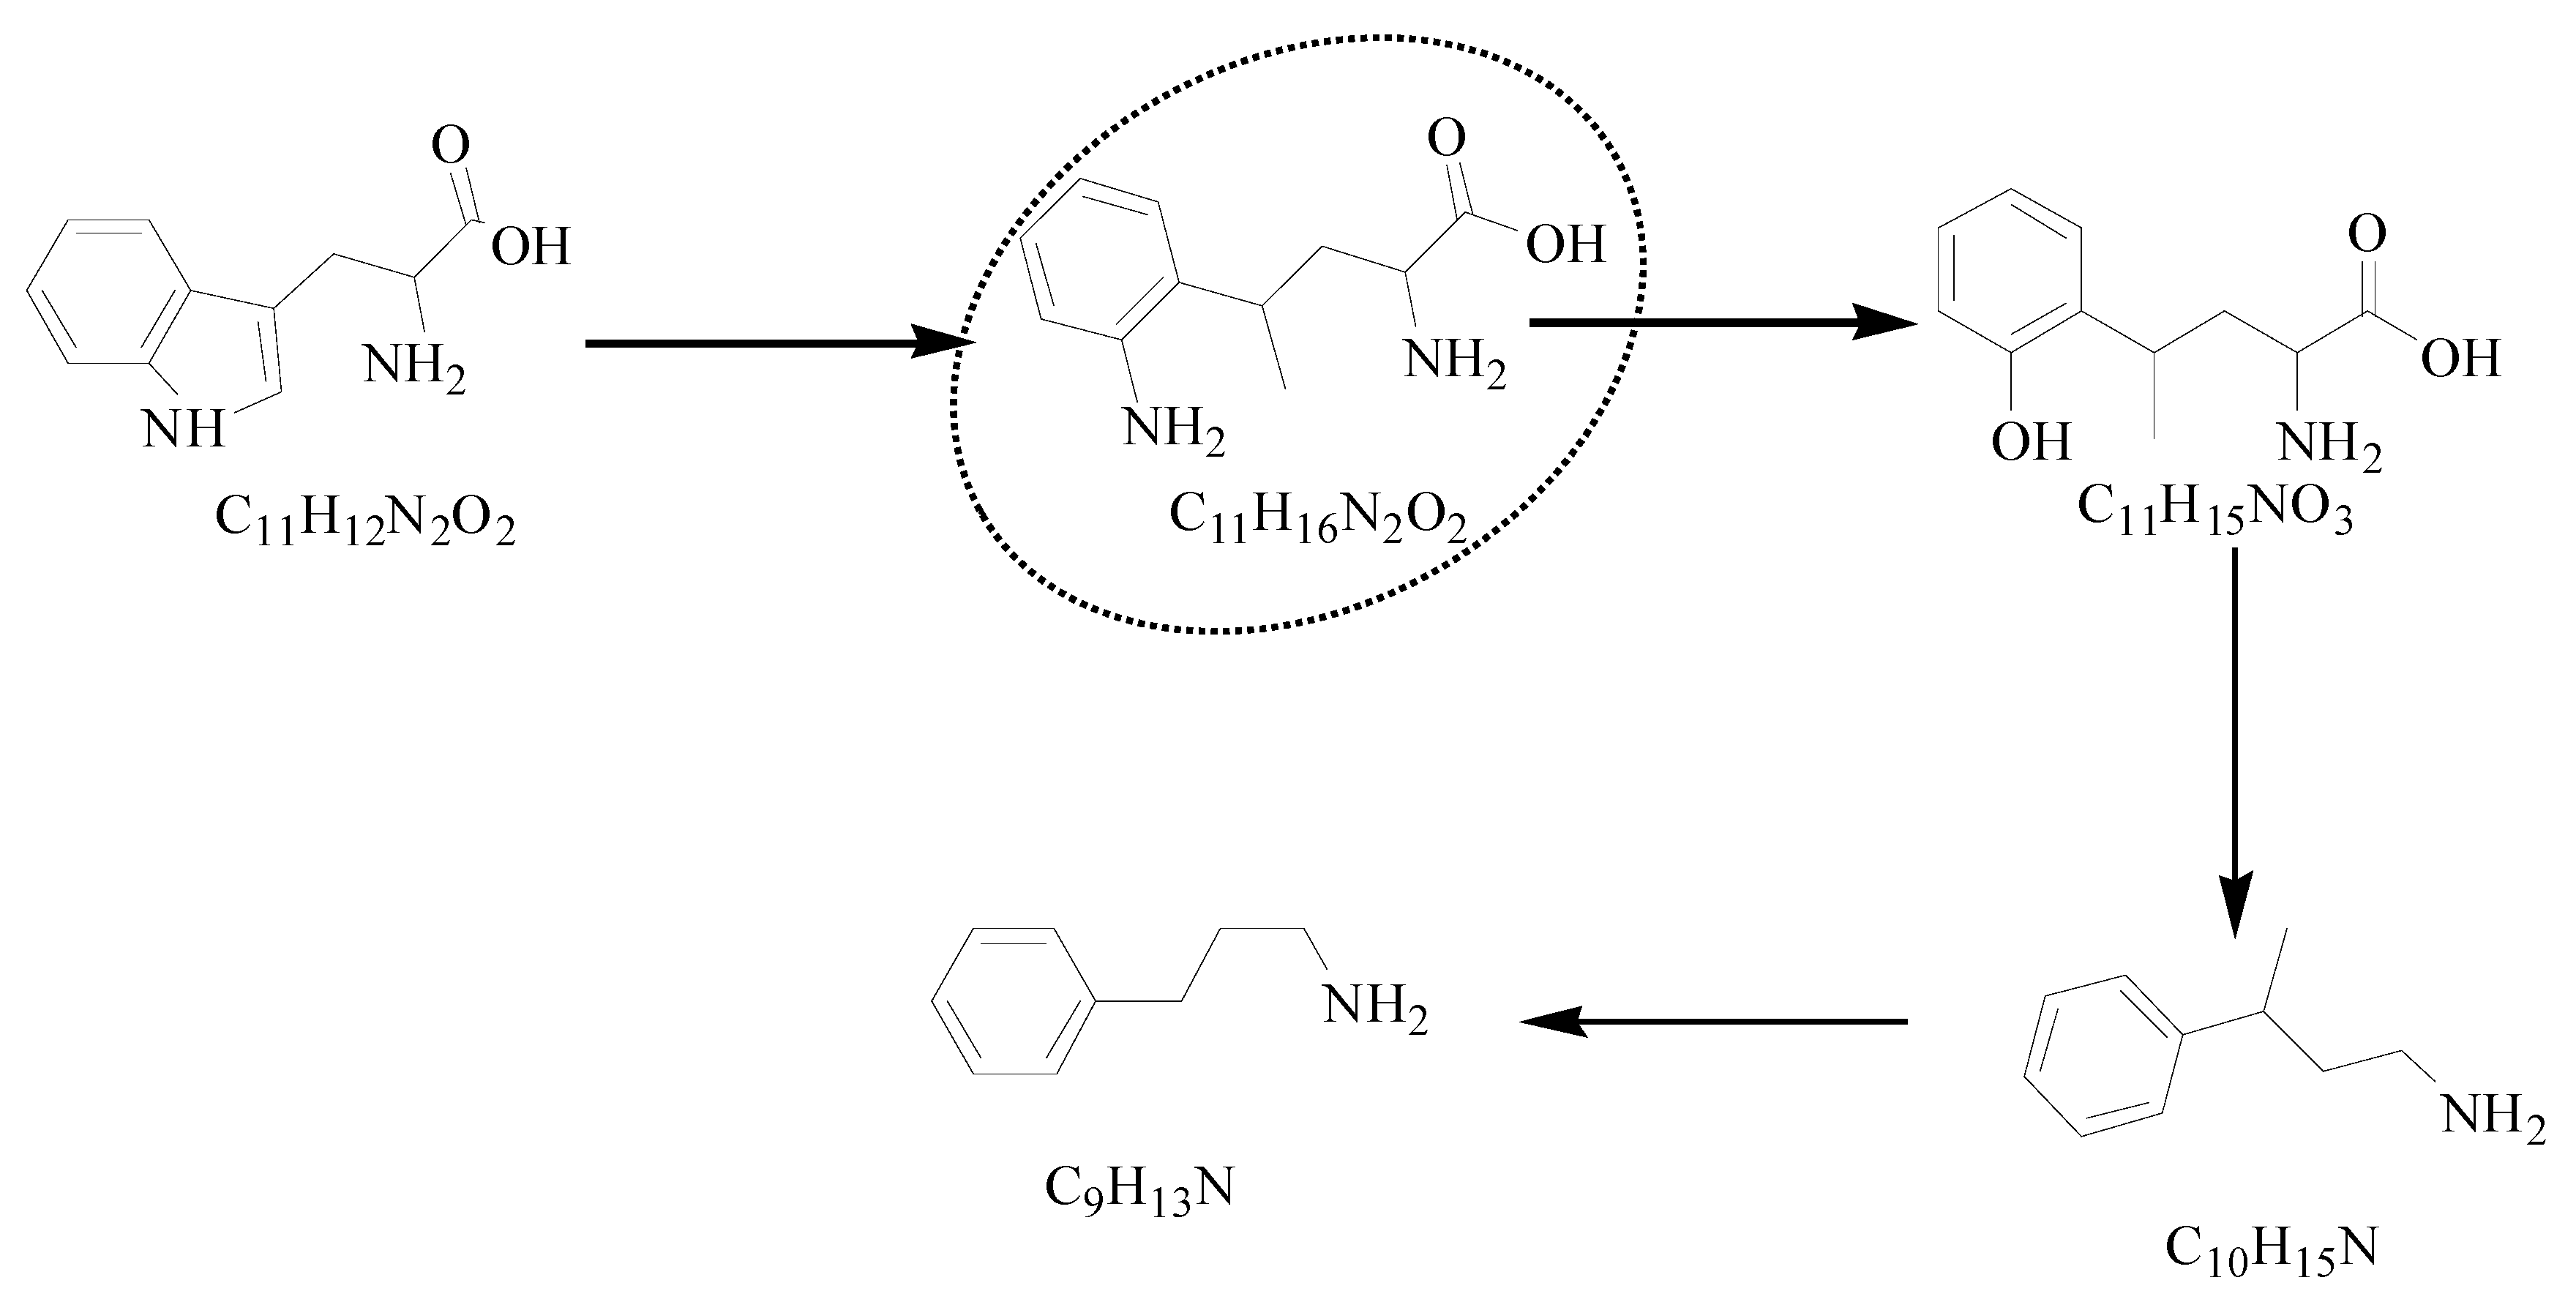
3.2.2. Degradation Products

Trp degradation was examined using LC-MS-MS. The secondary mass spectrometry of intermediates is presented in Figures S3–S5, and the atom potential map of Trp is shown in Figure S6. The N (0.38) on the indole group has a significant difference in atom potential between adjacent Cs (−0.07 and −0.04); thus, it is easier for the heterocyclic structure of Trp to initiate a ring-opening reaction. Moreover, carboxyl can be cleaved easily because of the large potential difference in its C-C bond. Based on these intermediates and atom potential map, the proposed degradation pathway of Trp by UV treatment is established and shown in Figure 11.
During the mechanism, Trp was initially converted to C11H16N2O2 via the cleavage of C-N bonds. The aromatic ring in C11H16N2O2 was attacked by ·OH to afford C11H15NO3, after which C11H15NO3 was further oxidized to form C10H15N through de-hydroxy and de-carboxylic reactions. Finally, C9H13N was formed in the cleavage loss of methyl.

4. Conclusions

The degradation curve of Trp fit a pseudo first-order reaction kinetic model, primarily by direct degradation. Degradation was promoted by an increase in pH, temperature, and HCO3 and NO3concentrations. In contrast, increasing the initial Trp and Cl concentrations decreased the degradation rate. The Ea value was estimated to be 19.65 kJ/mol. The EPR results further verified the presence of ·OH in the reaction mixture. The degradation pathway was proposed on the basis of three intermediate products.

Supplementary Materials

The following are available online at https://www.mdpi.com/article/10.3390/w13172368/s1, Figure S1: Experimental reactor, Figure S2: HPLC graphs of Trp, Figure S3: Secondary mass spectrometry of C11H15NO3, Figure S4: Secondary mass spectrometry of C10H15N, Figure S5: Secondary mass spectrometry of C9H13N, Figure S6: The atom potential map of Trp.

Author Contributions

Conceptualization, W.F. and Y.Y.; data curation, W.F. and K.Z.; methodology, Y.Y.; supervision, J.J. All authors have read and agreed to the published version of the manuscript.

Funding

This work was supported by the Major Science and Technology Program for Water Pollution and Treatment (2017ZX07201004).

Institutional Review Board Statement

Not applicable.

Informed Consent Statement

Not applicable.

Conflicts of Interest

The authors declare no conflict of interest.

References

  1. Trehy, M.L.; Yost, R.A.; Miles, C.J. Chlorination byproducts of amino acids in natural waters. Environ. Sci. Technol. 1986, 20, 1117–1122. [Google Scholar] [CrossRef]
  2. Cai, L.; Li, L.; Yu, S.; Guo, J.; Kuppers, S.; Dong, L. Formation of odorous by-products during chlorination of major amino acids in East Taihu Lake: Impacts of UV, UV/PS and UV/H2O2 pre-treatments. Water Res. 2019, 162, 427–436. [Google Scholar] [CrossRef]
  3. Dotson, A.; Westerhoff, P. Occurrence and removal of amino acids during drinking water treatment. J. Am. Water Work. Assoc. 2009, 101, 101–115. [Google Scholar] [CrossRef]
  4. Du, P.; Zhao, H.; Cao, H.; Huang, C.H.; Liu, W.; Li, Y. Transformation of halobenzoquinones with the presence of amino acids in water: Products, pathways and toxicity. Water Res. 2017, 122, 299–307. [Google Scholar] [CrossRef] [PubMed]
  5. How, Z.T.; Linge, K.L.; Busetti, F.; Joll, C.A. Formation of odorous and hazardous by-products from the chlorination of amino acids. Water Res. 2018, 146, 10–18. [Google Scholar] [CrossRef]
  6. Bond, T.; Templeton, M.R.; Graham, N. Precursors of nitrogenous disinfection by-products in drinking water—a critical review and analysis. J. Hazard. Mater. 2012, 235, 1–16. [Google Scholar] [CrossRef]
  7. Shah, A.D.; Mitch, W.A. Halonitroalkanes, halonitriles, haloamides, and N-nitrosamines: A critical review of nitrogenous disinfection byproduct formation pathways. Environ. Sci. Technol. 2012, 46, 119–131. [Google Scholar] [CrossRef] [PubMed]
  8. Chu, W.; Yao, D.; Deng, Y.; Sui, M.; Gao, N. Production of trihalomethanes, haloacetaldehydes and haloacetonitriles during chlorination of microcystin-Lr and impacts of pre-oxidation on their formation. J. Hazard. Mater. 2017, 327, 153–160. [Google Scholar] [CrossRef] [PubMed]
  9. Bond, T.; Henriet, O.; Goslan, E.H.; Parsons, S.A.; Jefferson, B. Disinfection byproduct formation and fractionation behavior of natural organic matter surrogates. Environ. Sci. Technol. 2009, 43, 5982–5989. [Google Scholar] [CrossRef]
  10. Zhang, J.; Liu, J.; He, C.S.; Qian, C.; Mu, Y. Formation of iodo-trihalomethanes (I-THMs) during disinfection with chlorine or chloramine: Impact of UV/H2O2 pre-oxidation. Sci. Total Environ. 2018, 640, 764–771. [Google Scholar] [CrossRef]
  11. Sarathy, S.R.; Mohseni, M. The impact of UV/H2O2 advanced oxidation on molecular size distribution of chromophoric natural organic matter. Environ. Sci. Technol. 2007, 41, 8315–8320. [Google Scholar] [CrossRef] [PubMed]
  12. Qi, W.; Zhang, H.; Hu, C.; Liu, H.; Qu, J. Effect of ozonation on the characteristics of effluent organic matter fractions and subsequent associations with disinfection by-products formation. Sci. Total Environ. 2018, 610, 1057–1064. [Google Scholar] [CrossRef]
  13. Choi, Y.; Choi, Y.J. The effects of UV disinfection on drinking water quality in distribution systems. Water Res. 2010, 44, 115–122. [Google Scholar] [CrossRef]
  14. Wang, A.Q.; Xu, B.; Zhang, T.-Y.; Chen, Y.-Y.; Gao, N.-Y. Effect of UV irradiation and UV/chlorine processes on trichloronitromethane formation during chlorination of ronidazole. CLEAN–Soil Air Water 2017, 45, 160–163. [Google Scholar] [CrossRef]
  15. Szajdak, L.; Osterberg, R. Amino acids present in humic acids from soils under different cultivations. Environ. Int. 1996, 22, 331–334. [Google Scholar] [CrossRef]
  16. Li, C.; Lin, Q.; Dong, F.; Li, Y.; Luo, F.; Zhang, K. Formation of iodinated trihalomethanes during chlorination of amino acid in waters. Chemosphere 2019, 217, 355–363. [Google Scholar] [CrossRef]
  17. Kaczynski, S.E.; Kieber, R.J. Hydrophobic C18 bound organic complexes of chromium and their potential impact on the geochemistry of Cr in natural-waters. Environ. Sci. Technol. 1994, 28, 799–804. [Google Scholar] [CrossRef] [PubMed]
  18. Wang, X.; Wang, J.; Zhang, Y.; Shi, Q.; Zhang, H.; Zhang, Y.; Yang, M. Characterization of unknown iodinated disinfection byproducts during chlorination/chloramination using ultrahigh resolution mass spectrometry. Sci. Total Environ. 2016, 554, 83–88. [Google Scholar] [CrossRef]
  19. Beltran, F.J.; Ovejero, G.; Garcia-Araya, J.F.; Rivas, J. Oxidation of polynuclear aromatic hydrocarbons in water. 2. UV radiation and ozonation in the presence of UV radiation. Ind. Eng. Chem. Res. 1995, 34, 1607–1615. [Google Scholar] [CrossRef]
  20. Canonica, S.; Meunier, L.; Von Gunten, U. Phototransformation of selected pharmaceuticals during UV treatment of drinking water. Water Res. 2008, 42, 121–128. [Google Scholar] [CrossRef] [PubMed]
  21. Ji, Y.; Yang, Y.; Zhou, L.; Wang, L.; Lu, J.; Ferronato, C.; Chovelon, J.M. Photodegradation of sulfasalazine and its human metabolites in water by UV and UV/peroxydisulfate processes. Water Res. 2018, 133, 299–309. [Google Scholar] [CrossRef] [PubMed]
  22. Alegria, A.E.; Ferrer, A.; Sepulveda, E. Photochemistry of water-soluble quinones. production of a water-derived spin adduct. Photochem. Photobiol. 1997, 66, 436–442. [Google Scholar] [CrossRef] [PubMed]
  23. Thomas-Smith, T.E.; Blough, N.V. Photoproduction of hydrated electron from constituents of natural waters. Environ. Sci. Technol. 2001, 35, 2721–2726. [Google Scholar] [CrossRef]
  24. Mckay, G.; Rosario-Ortiz, F.L. Temperature dependence of the photochemical formation of hydroxyl radical from dissolved organic matter. Environ. Sci. Technol. 2015, 49, 4147–4154. [Google Scholar] [CrossRef]
  25. Freuze, I.; Brosillon, S.; Arlot, J.; Laplanche, A.; Tozza, D.; Cavard, J. Impact of UV-irradiation on the formation of odorous chloroaldimines in drinking water. Chemosphere 2006, 63, 1660–1666. [Google Scholar] [CrossRef] [PubMed]
  26. Tian, F.X.; Xu, B.; Lin, Y.L.; Hu, C.Y.; Zhang, T.Y.; Gao, N.Y. Photodegradation kinetics of iopamidol by UV irradiation and enhanced formation of iodinated disinfection by-products in sequential oxidation processes. Water Res. 2014, 58, 198–208. [Google Scholar] [CrossRef] [PubMed]
  27. Li, M.; Li, W.; Bolton, J.R.; Blatchley, E.R., III; Qang, Z. Organic pollutant degradation in water by the vacuum-ultraviolet/ultraviolet/H2O2 process: Inhibition and enhancement roles of H2O2. Environ. Sci. Technol. 2019, 53, 912–918. [Google Scholar] [CrossRef]
  28. Xie, P.; Yue, S.; Ding, J.; Wan, Y.; Li, X.; Ma, J.; Wang, Z. Degradation of organic pollutants by Vacuum-Ultraviolet (VUV): Kinetic model and efficiency. Water Res. 2018, 133, 69–78. [Google Scholar] [CrossRef] [PubMed]
  29. Wu, Z.; Guo, K.; Fang, J.; Yang, X.; Xiao, H.; Hou, S.; Kong, X.; Shang, C.; Yang, X.; Meng, F.; et al. Factors affecting the roles of reactive species in the degradation of micropollutants by the UV/chlorine process. Water Res. 2017, 126, 351–360. [Google Scholar] [CrossRef]
  30. Bergman, J.; Venemalm, L. Efficient synthesis of 2-chloro-, 2-bromo-, and 2-iodoindole. J. Org. Chem. 1992, 57, 2495–2497. [Google Scholar] [CrossRef]
  31. Xie, P.; Zou, Y.; Jiang, S.; Wang, J.; Zhang, L.; Wang, Z.; Yue, S.; Feng, X. Degradation of imipramine by vacuum ultraviolet (VUV) System: Influencing parameters, mechanisms, and variation of acute toxicity. Chemosphere 2019, 233, 282–291. [Google Scholar] [CrossRef]
  32. Buxton, G.V.; Greenstock, C.L.; Helman, W.P.; Ross, A.B. Critical review of rate constants for reactions of hydrated electrons, hydrogen atoms and hydroxyl radicals (·Oh/·O−) in aqueous solution. J. Phys. Chem. Ref. Data 1988, 17, 513–886. [Google Scholar] [CrossRef] [Green Version]
  33. Ma, J.; Graham, N.J.D. Degradation of atrazine by manganese-catalysed ozonation—influence of radical scavengers. Water Res. 2000, 34, 3822–3828. [Google Scholar] [CrossRef]
  34. Tan, C.; Gao, N.; Zhou, S.; Xiao, Y.; Zhuang, Z. Kinetic study of acetaminophen degradation by UV-based advanced oxidation processes. Chem. Eng. J. 2014, 253, 229–236. [Google Scholar] [CrossRef]
  35. Lai, W.W.P.; Hsu, M.H.; Lin, A.Y.C. The role of bicarbonate anions in methotrexate degradation via UV/TiO2: Mechanisms, reactivity and increased toxicity. Water Res. 2017, 112, 157–166. [Google Scholar] [CrossRef] [PubMed]
  36. Adams, G.E.; Aldrich, J.E.; Bisby, R.H.; Cundall, R.B.; Redpath, J.L.; Willson, R.L. Selective free radical reactions with proteins and enzymes: Reactions of inorganic radical anions with amino acids. Radiat. Res. 1972, 49, 278–289. [Google Scholar] [CrossRef]
  37. Guo, Z.-B.; Lin, Y.-L.; Xu, B.; Hu, C.Y.; Huang, H.; Zhang, T.-Y.; Chu, W.-H.; Gao, N.-Y. Factors affecting THM, HAN and HNM formation during UV-chlor(am)ination of drinking water. Chem. Eng. J. 2016, 306, 1180–1188. [Google Scholar] [CrossRef]
  38. Gao, Y.Q.; Zhang, J.; Li, C.; Tian, F.X.; Gao, N.Y. Comparative evaluation of metoprolol degradation by UV/chlorine and UV/H2O2 processes. Chemosphere 2020, 243, 125325. [Google Scholar] [CrossRef]
  39. Armstrong, D.A.; Huie, R.E.; Koppenol, W.H.; Lymar, S.V.; Merenyi, G.; Neta, P.; Ruscic, B.; Stanbury, D.M.; Steenken, S.; Wardman, P. Standard electrode potentials involving radicals in aqueous solution: Inorganic radicals (IUPAC Technical Report). Pure Appl. Chem. 2015, 87, 1139–1150. [Google Scholar] [CrossRef]
  40. Guan, Y.H.; Ma, J.; Li, X.C.; Fang, J.Y.; Chen, L.W. Influence of pH on the formation of sulfate and hydroxyl radicals in the UV/peroxymonosulfate system. Environ. Sci. Technol. 2011, 45, 9308–9314. [Google Scholar] [CrossRef]
  41. Guo, K.; Wu, Z.; Yan, S.; Yao, B.; Song, W.; Hua, Z.; Zhang, X.; Kong, X.; Li, X.; Fang, J. Comparison of the UV/CHLORINE and UV/H2O2 processes in the degradation of PPCPs in simulated drinking water and wastewater: Kinetics, radical mechanism and energy requirements. Water Res. 2018, 147, 184–194. [Google Scholar] [CrossRef] [PubMed]
  42. Guo, Z.B.; Lin, Y.L.; Xu, B.; Huang, H.; Zhang, T.Y.; Tian, F.X.; Gao, N.Y. Degradation of chlortoluron during UV irradiation and UV/chlorine processes and formation of disinfection by-products in sequential chlorination. Chem. Eng. J. 2016, 283, 412–419. [Google Scholar] [CrossRef]
  43. Watts, R.J.; Teel, A.L. Hydroxyl radical and non-hydroxyl radical pathways for trichloroethylene and perchloroethylene degradation in catalyzed H2O2 propagation systems. Water Res. 2019, 159, 46–54. [Google Scholar] [CrossRef] [PubMed]
  44. Fadda, A.; Barberis, A.; Sanna, D. Influence of pH, buffers and role of quinolinic acid, a novel iron chelating agent, in the determination of hydroxyl radical scavenging activity of plant extracts by Electron Paramagnetic Resonance (EPR). Food Chem. 2018, 240, 174–182. [Google Scholar] [CrossRef]
Figure 1. Kinetic model of UV degradation of Trp.
Water 13 02368 g001
Figure 2. Effect of initial Trp concentration on Trp degradation.
Water 13 02368 g002
Figure 3. Linear relationship of C0 with kobs.
Water 13 02368 g003
Figure 4. Effect of pH on Trp degradation.
Water 13 02368 g004
Figure 5. Effect of temperature on Trp degradation.
Water 13 02368 g005
Figure 6. Evaluation of apparent activation energy.
Water 13 02368 g006
Figure 7. Effect of HCO3 concentration on Trp degradation.
Water 13 02368 g007
Figure 8. Effect of NO3 concentration on Trp degradation.
Water 13 02368 g008
Figure 9. Effect of different concentrations of Cl on Trp degradation.
Water 13 02368 g009
Figure 10. EPR spectra of DMPO and Trp/DMPO samples.
Water 13 02368 g010
Figure 11. Proposed degradation pathway of Trp by UV treatment.
Water 13 02368 g011
Publisher’s Note: MDPI stays neutral with regard to jurisdictional claims in published maps and institutional affiliations.

