
Seismic Performance Assessment of Water Distribution Systems Based on Multi-Indexed Nodal Importance


Abstract
:1. Introduction
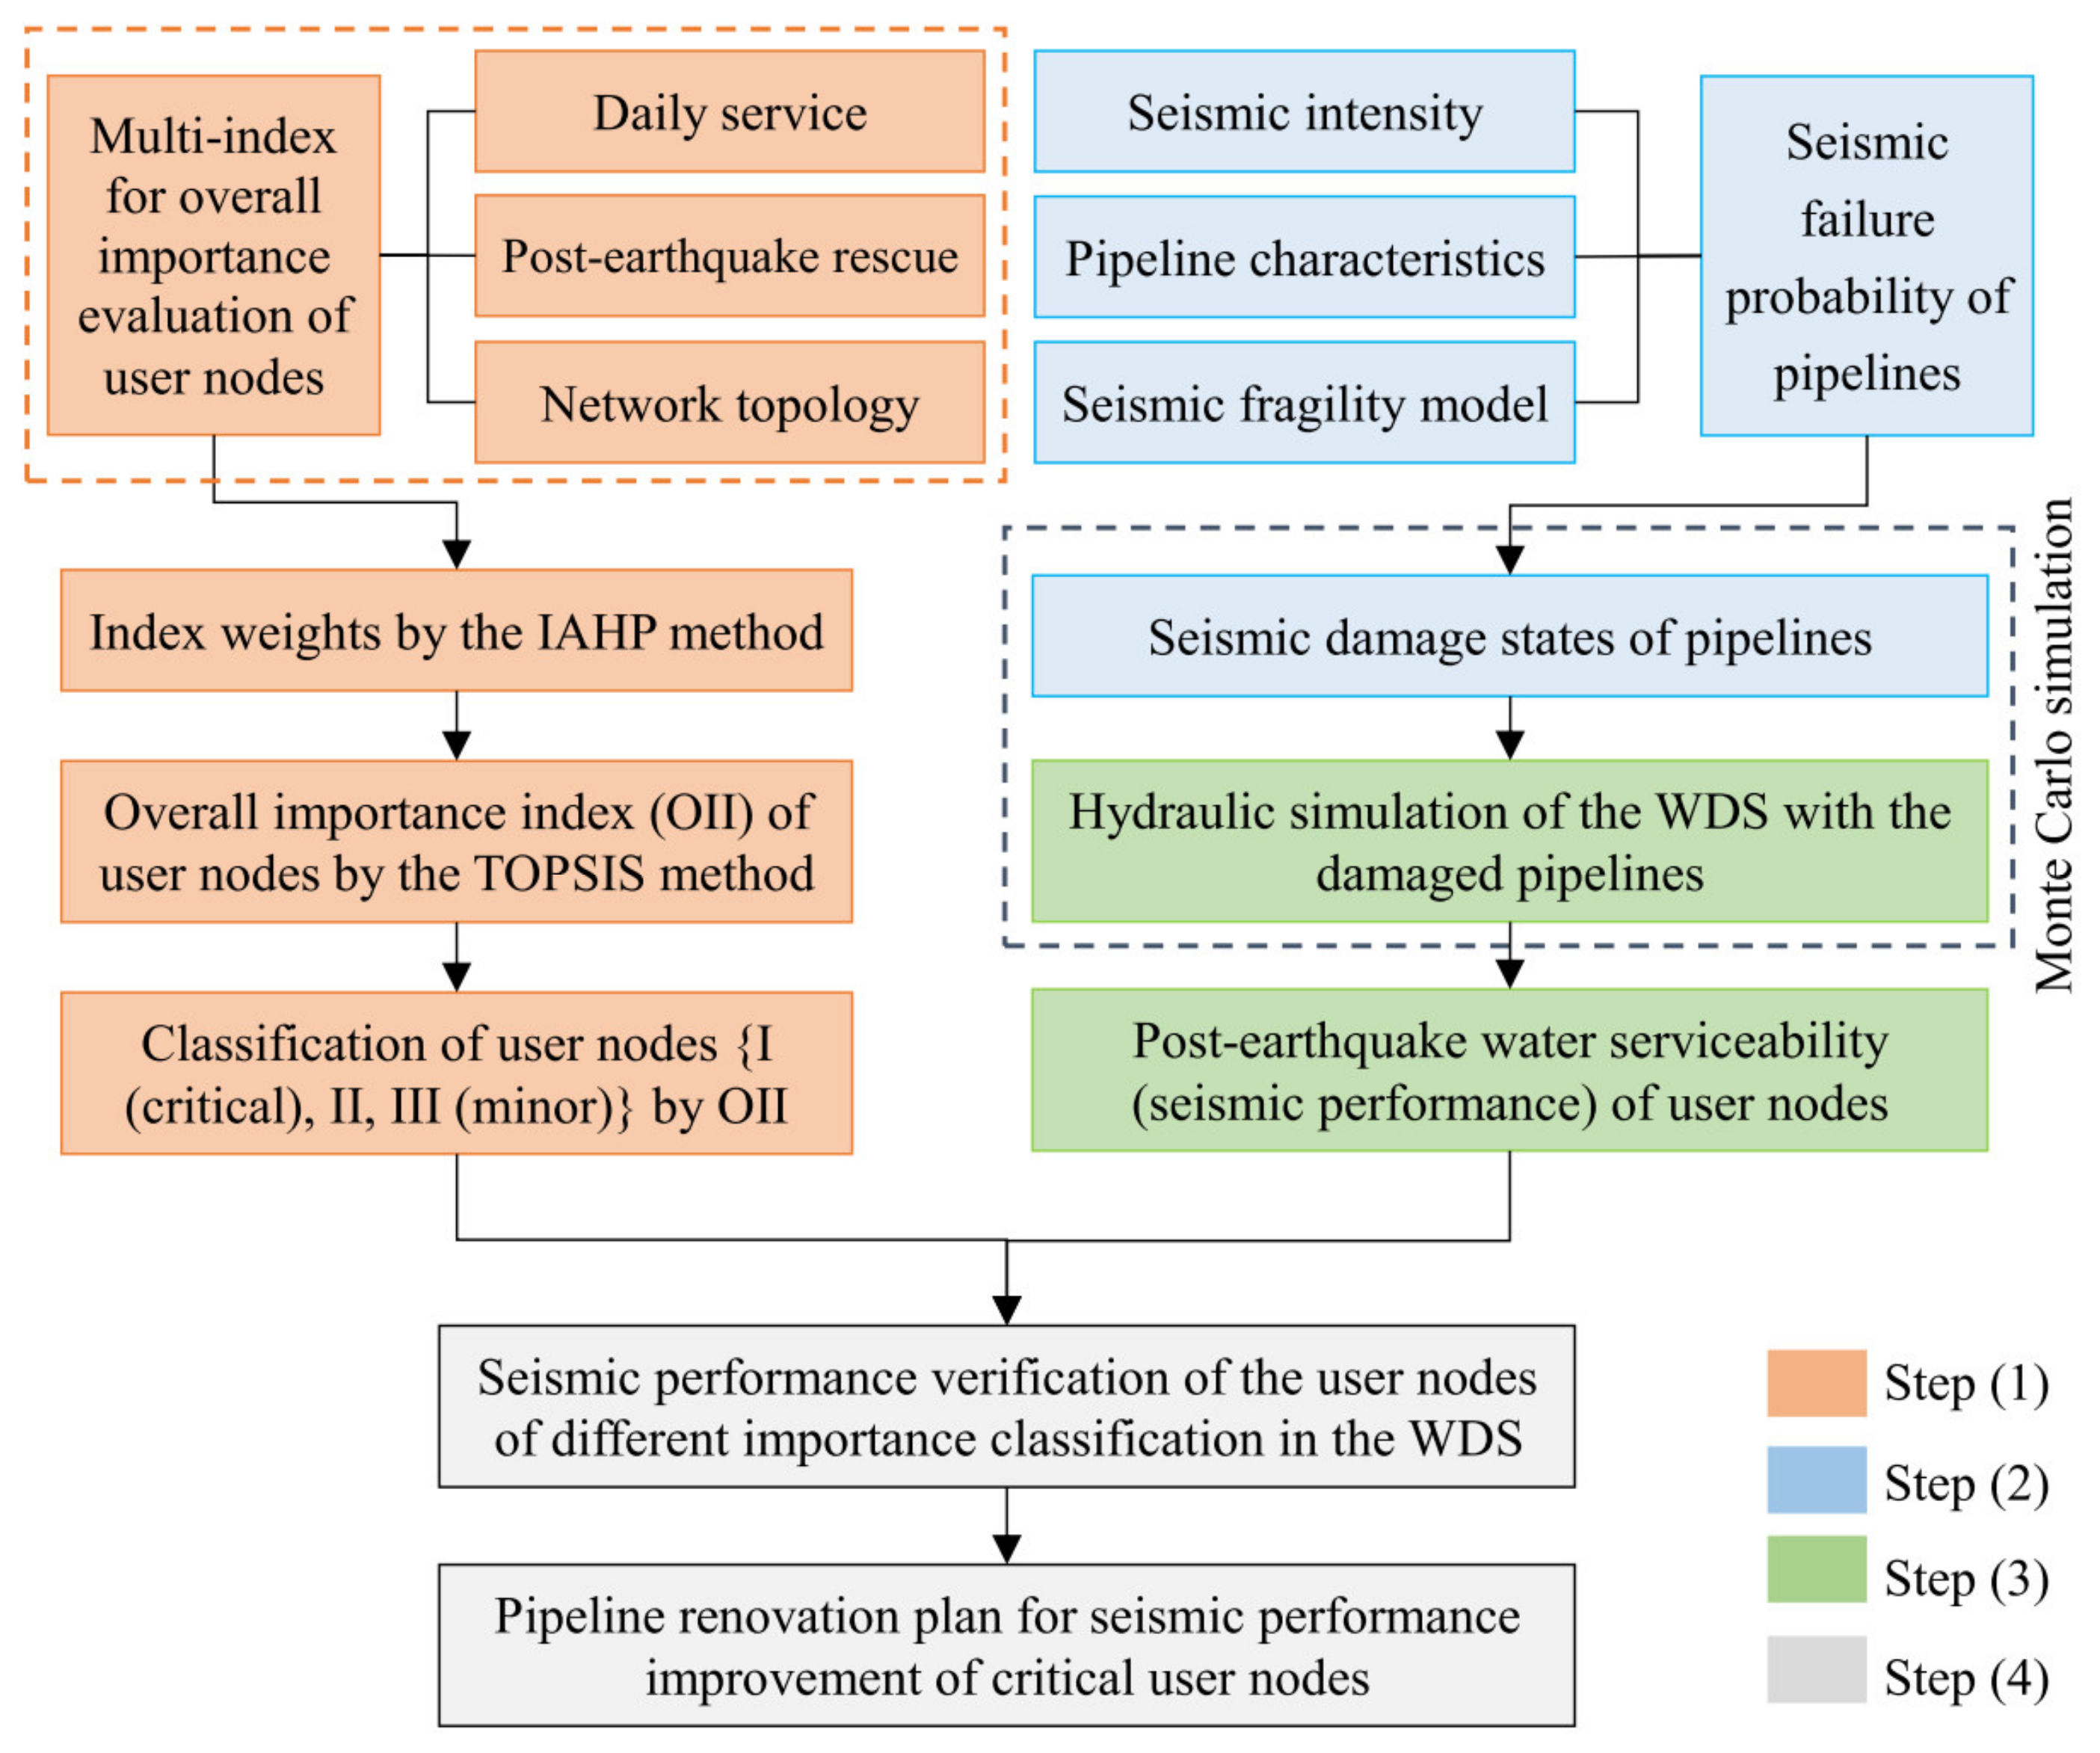
2. Methodology
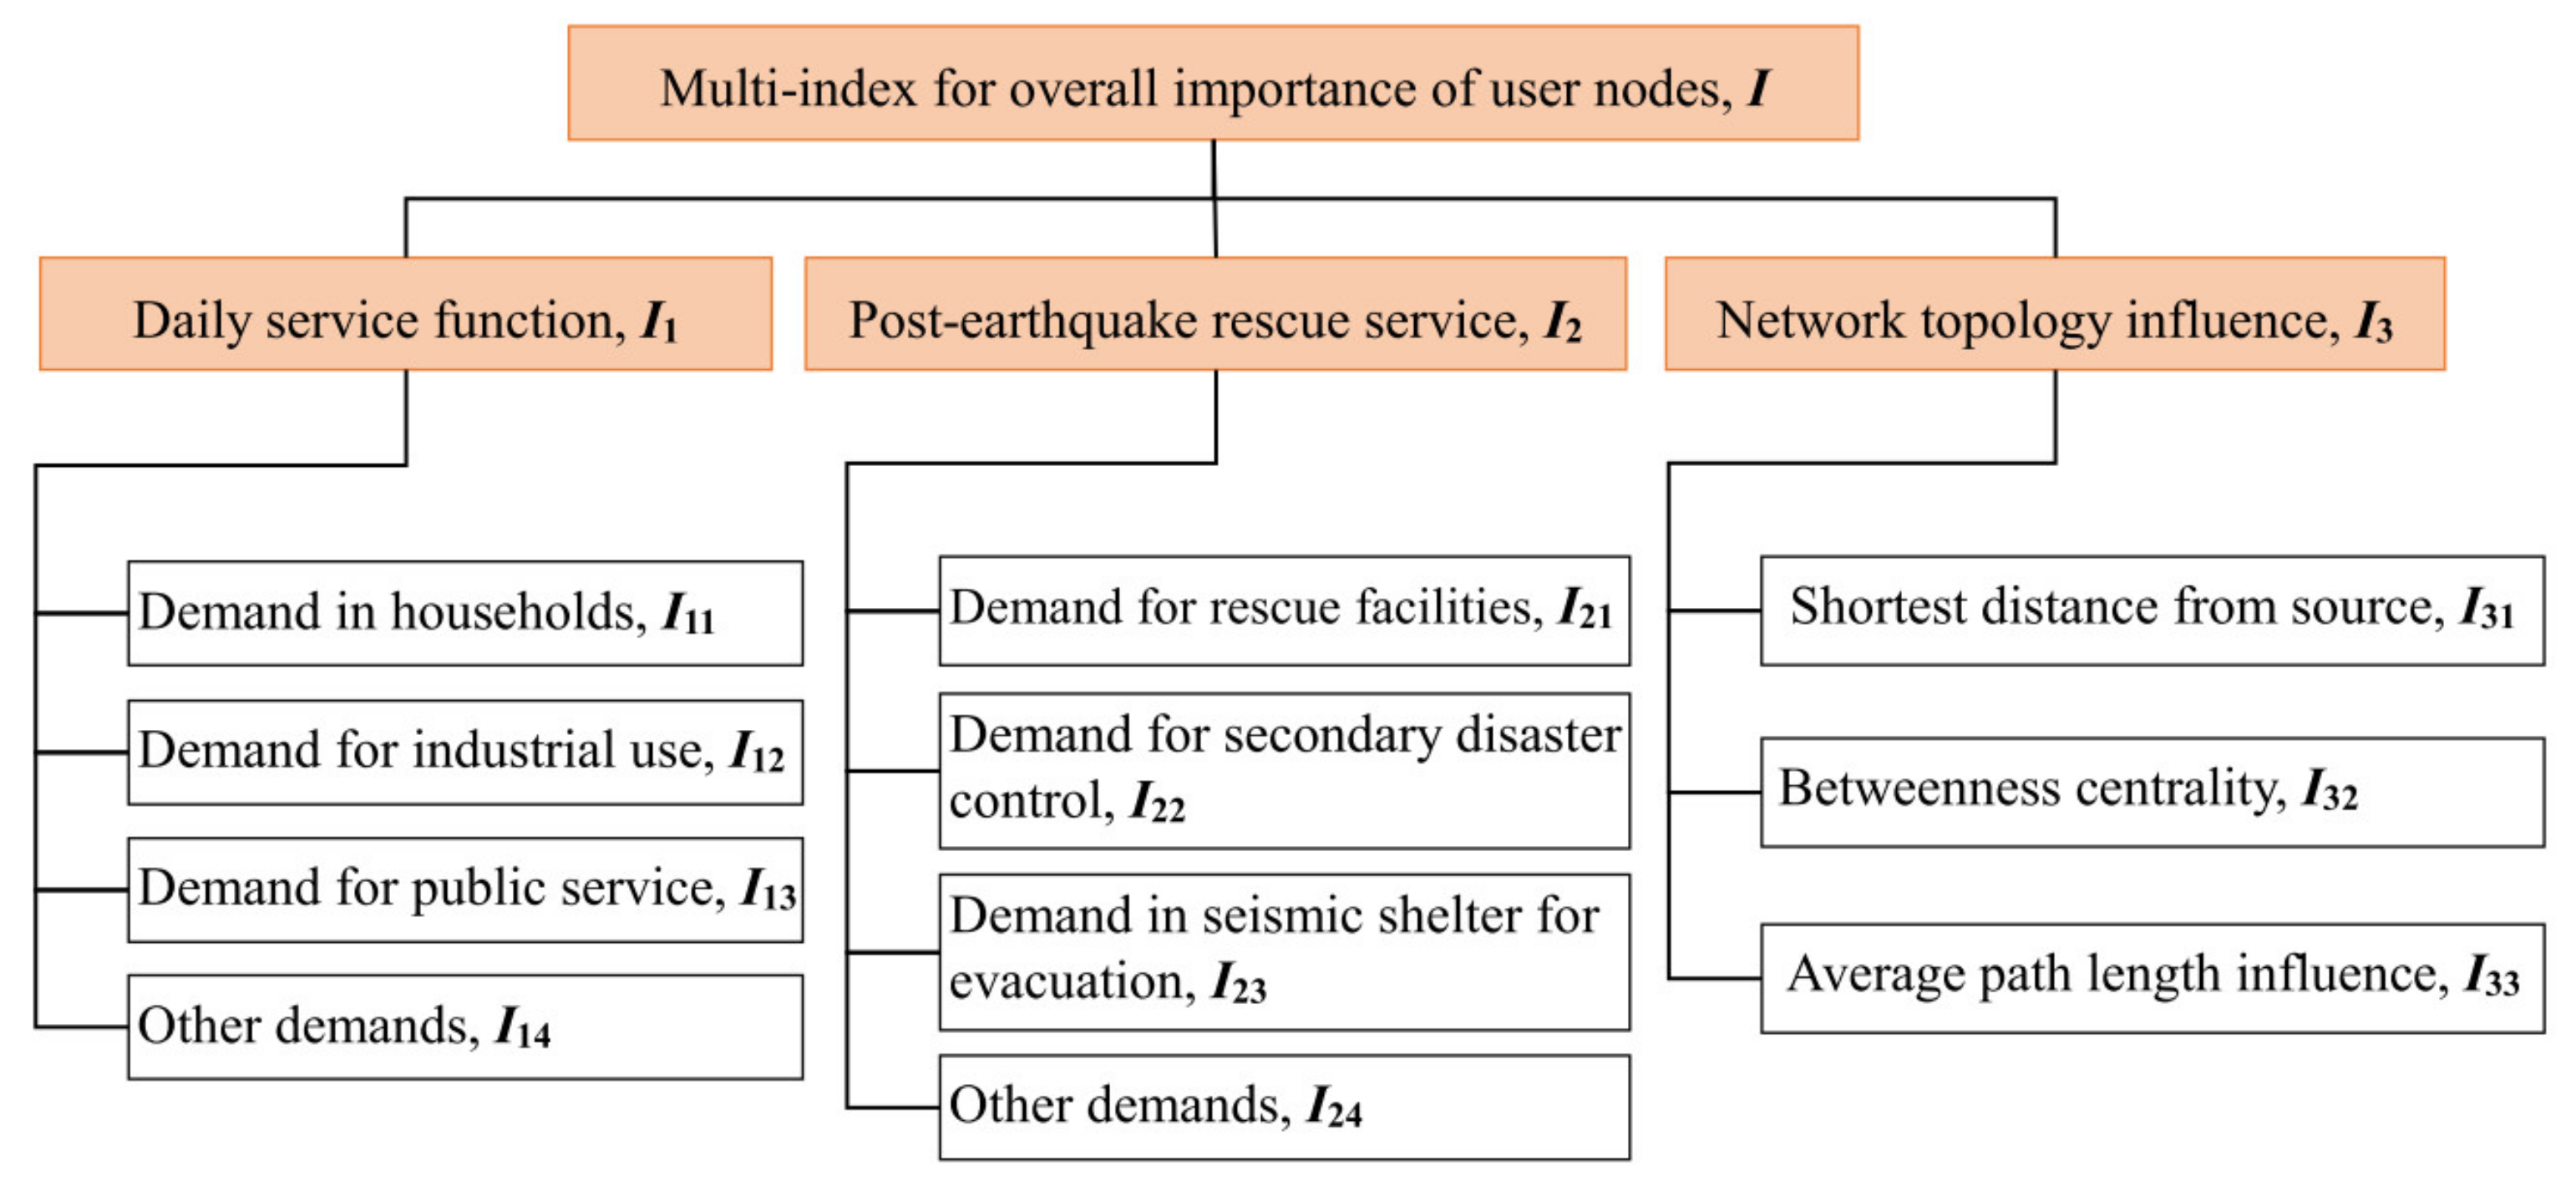
2.1. Multi-Indexed Importance Measure of User Nodes
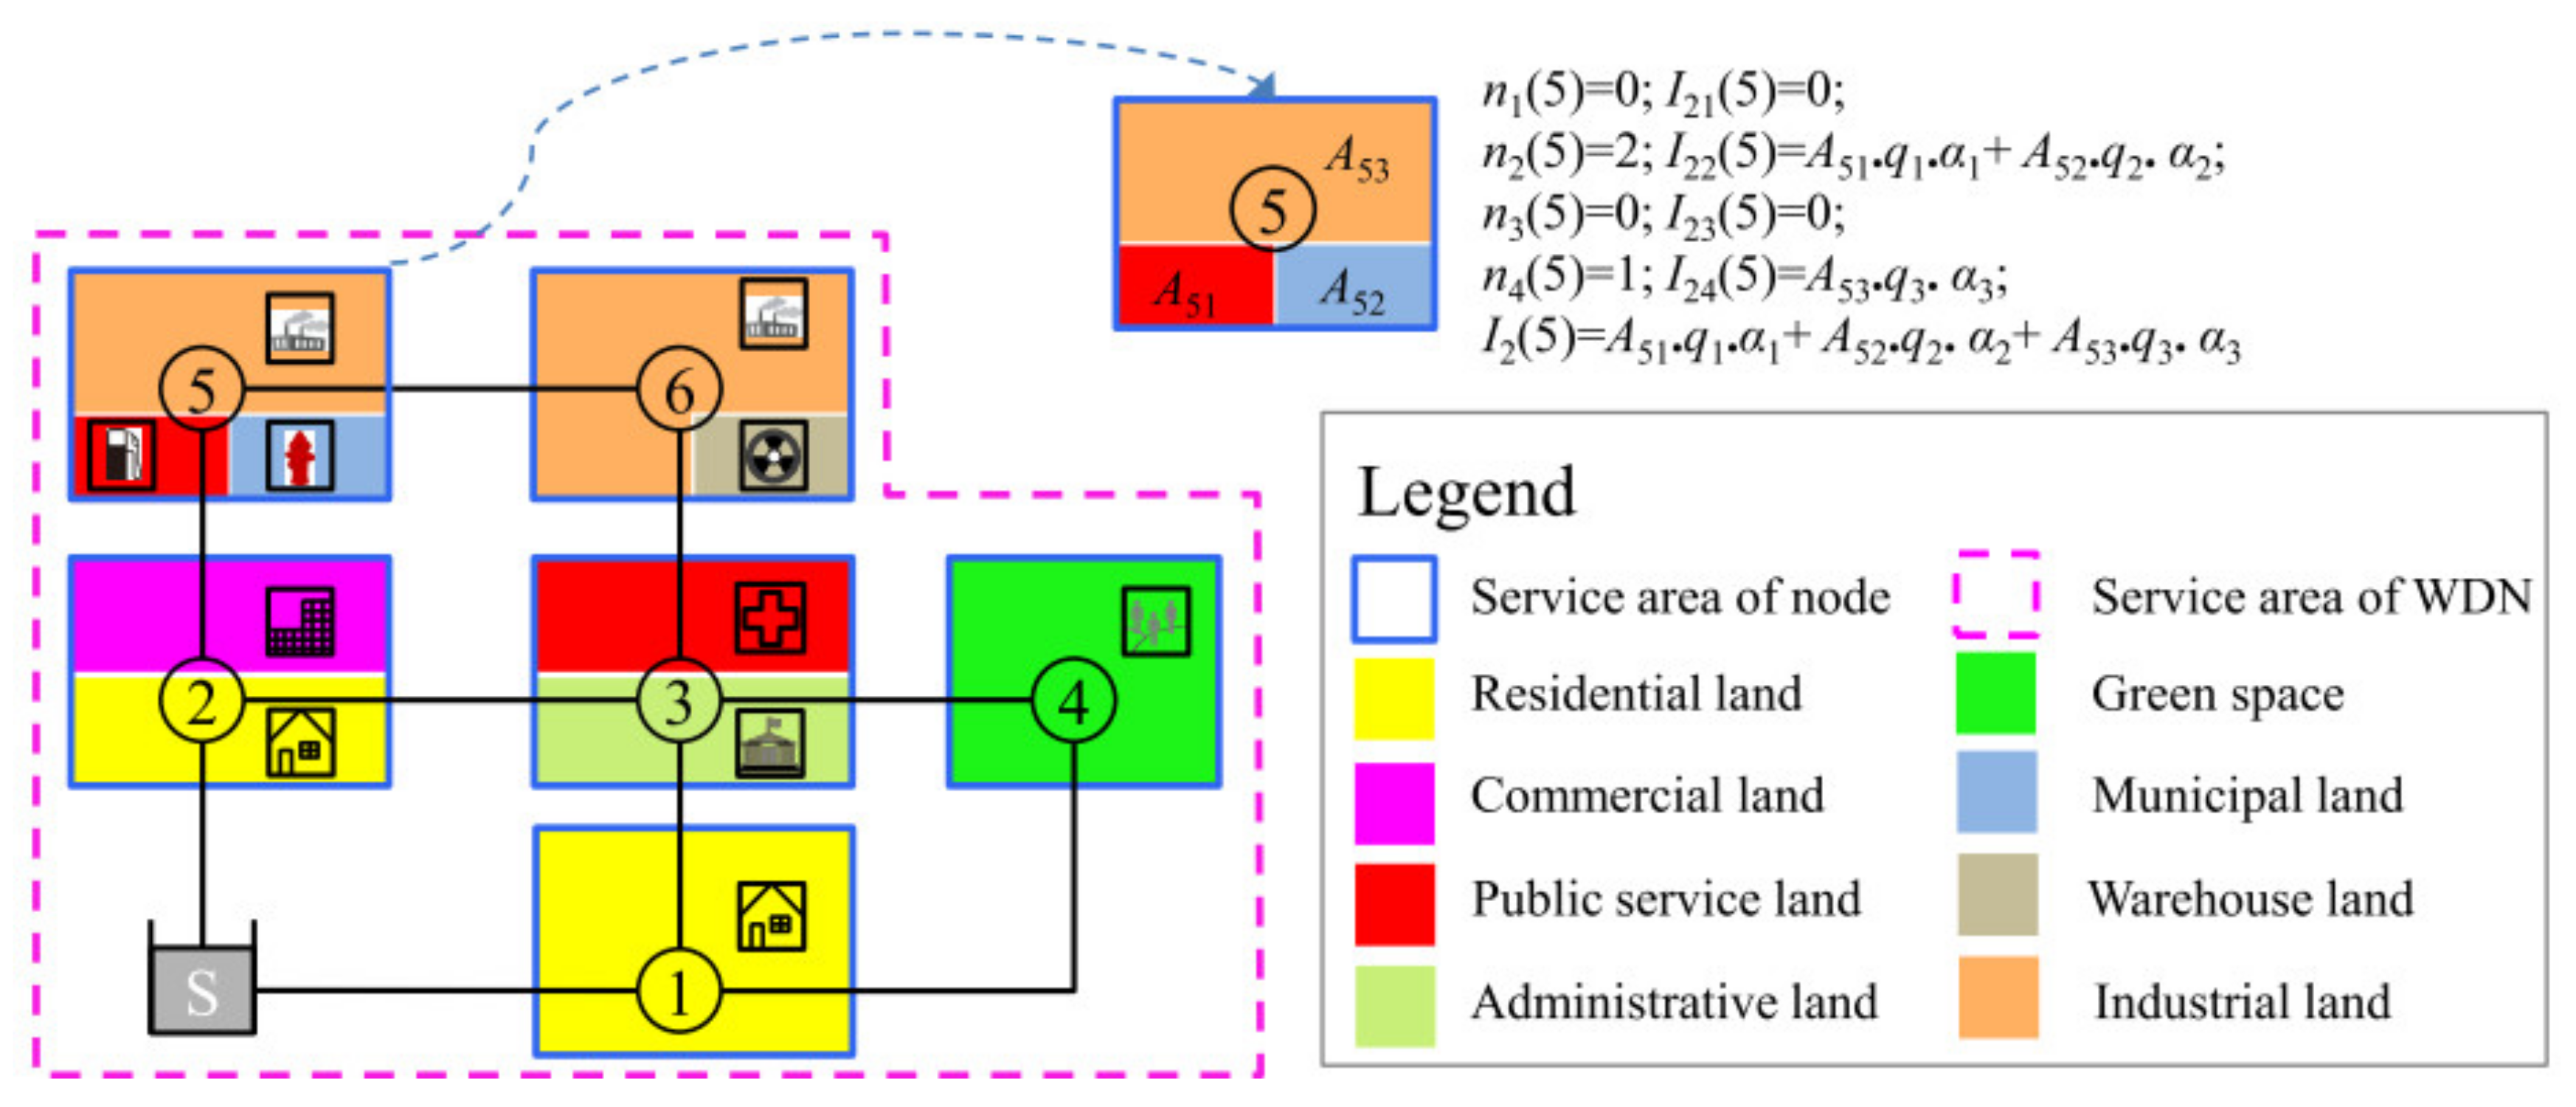
2.1.1. Importance Indices of Daily Service
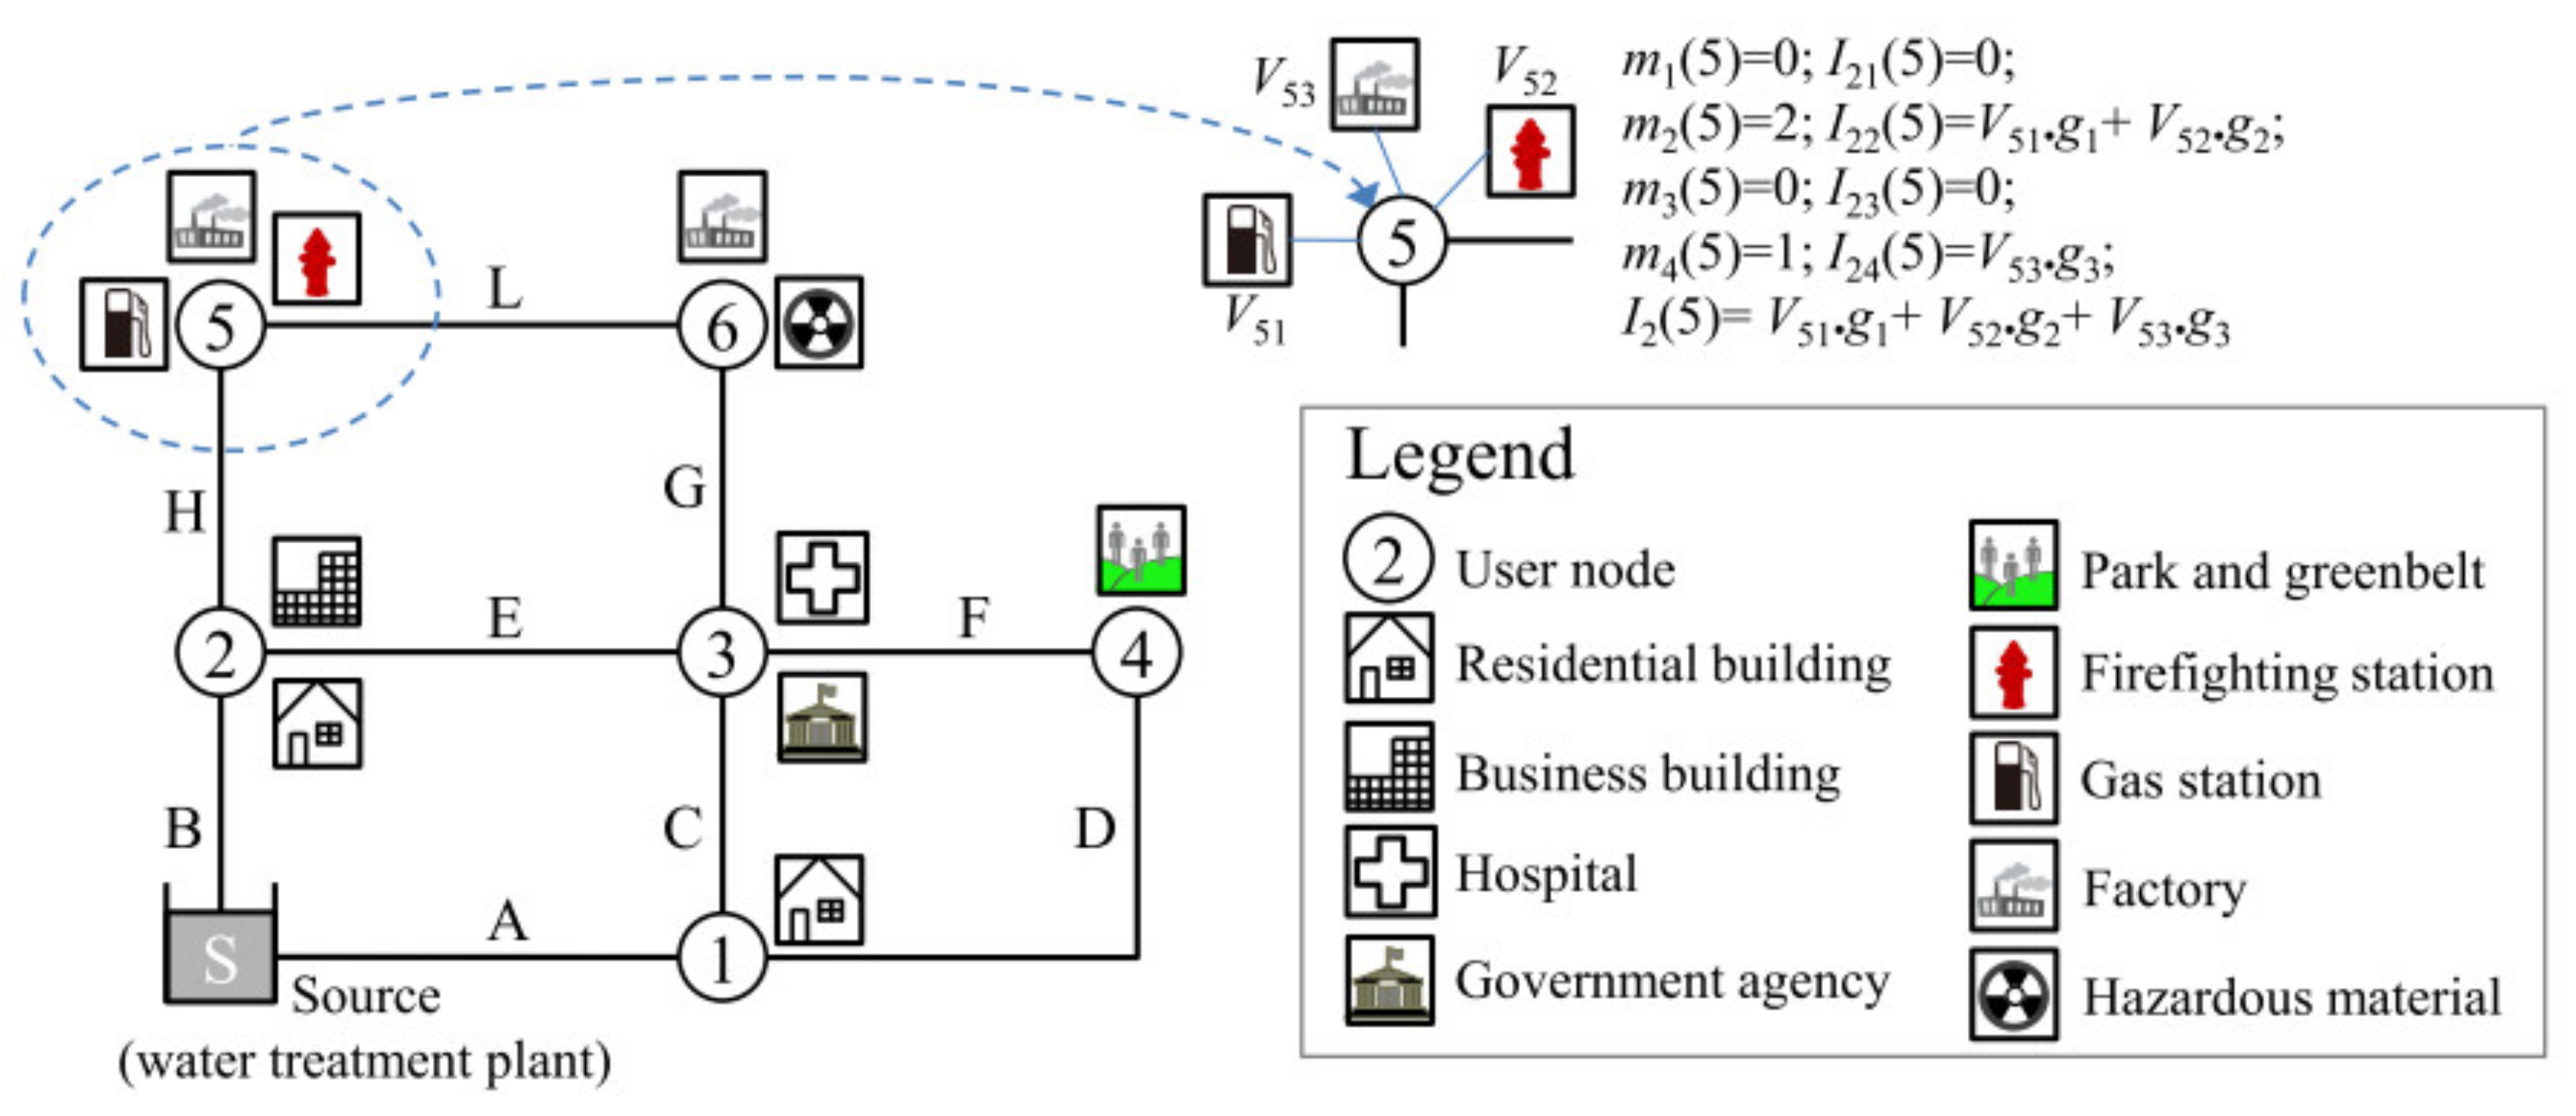
2.1.2. Importance Indices of Post-Earthquake Rescue Service
2.1.3. Importance Indices of Network Topology
2.1.4. Overall Importance Evaluation and Classification of User Nodes
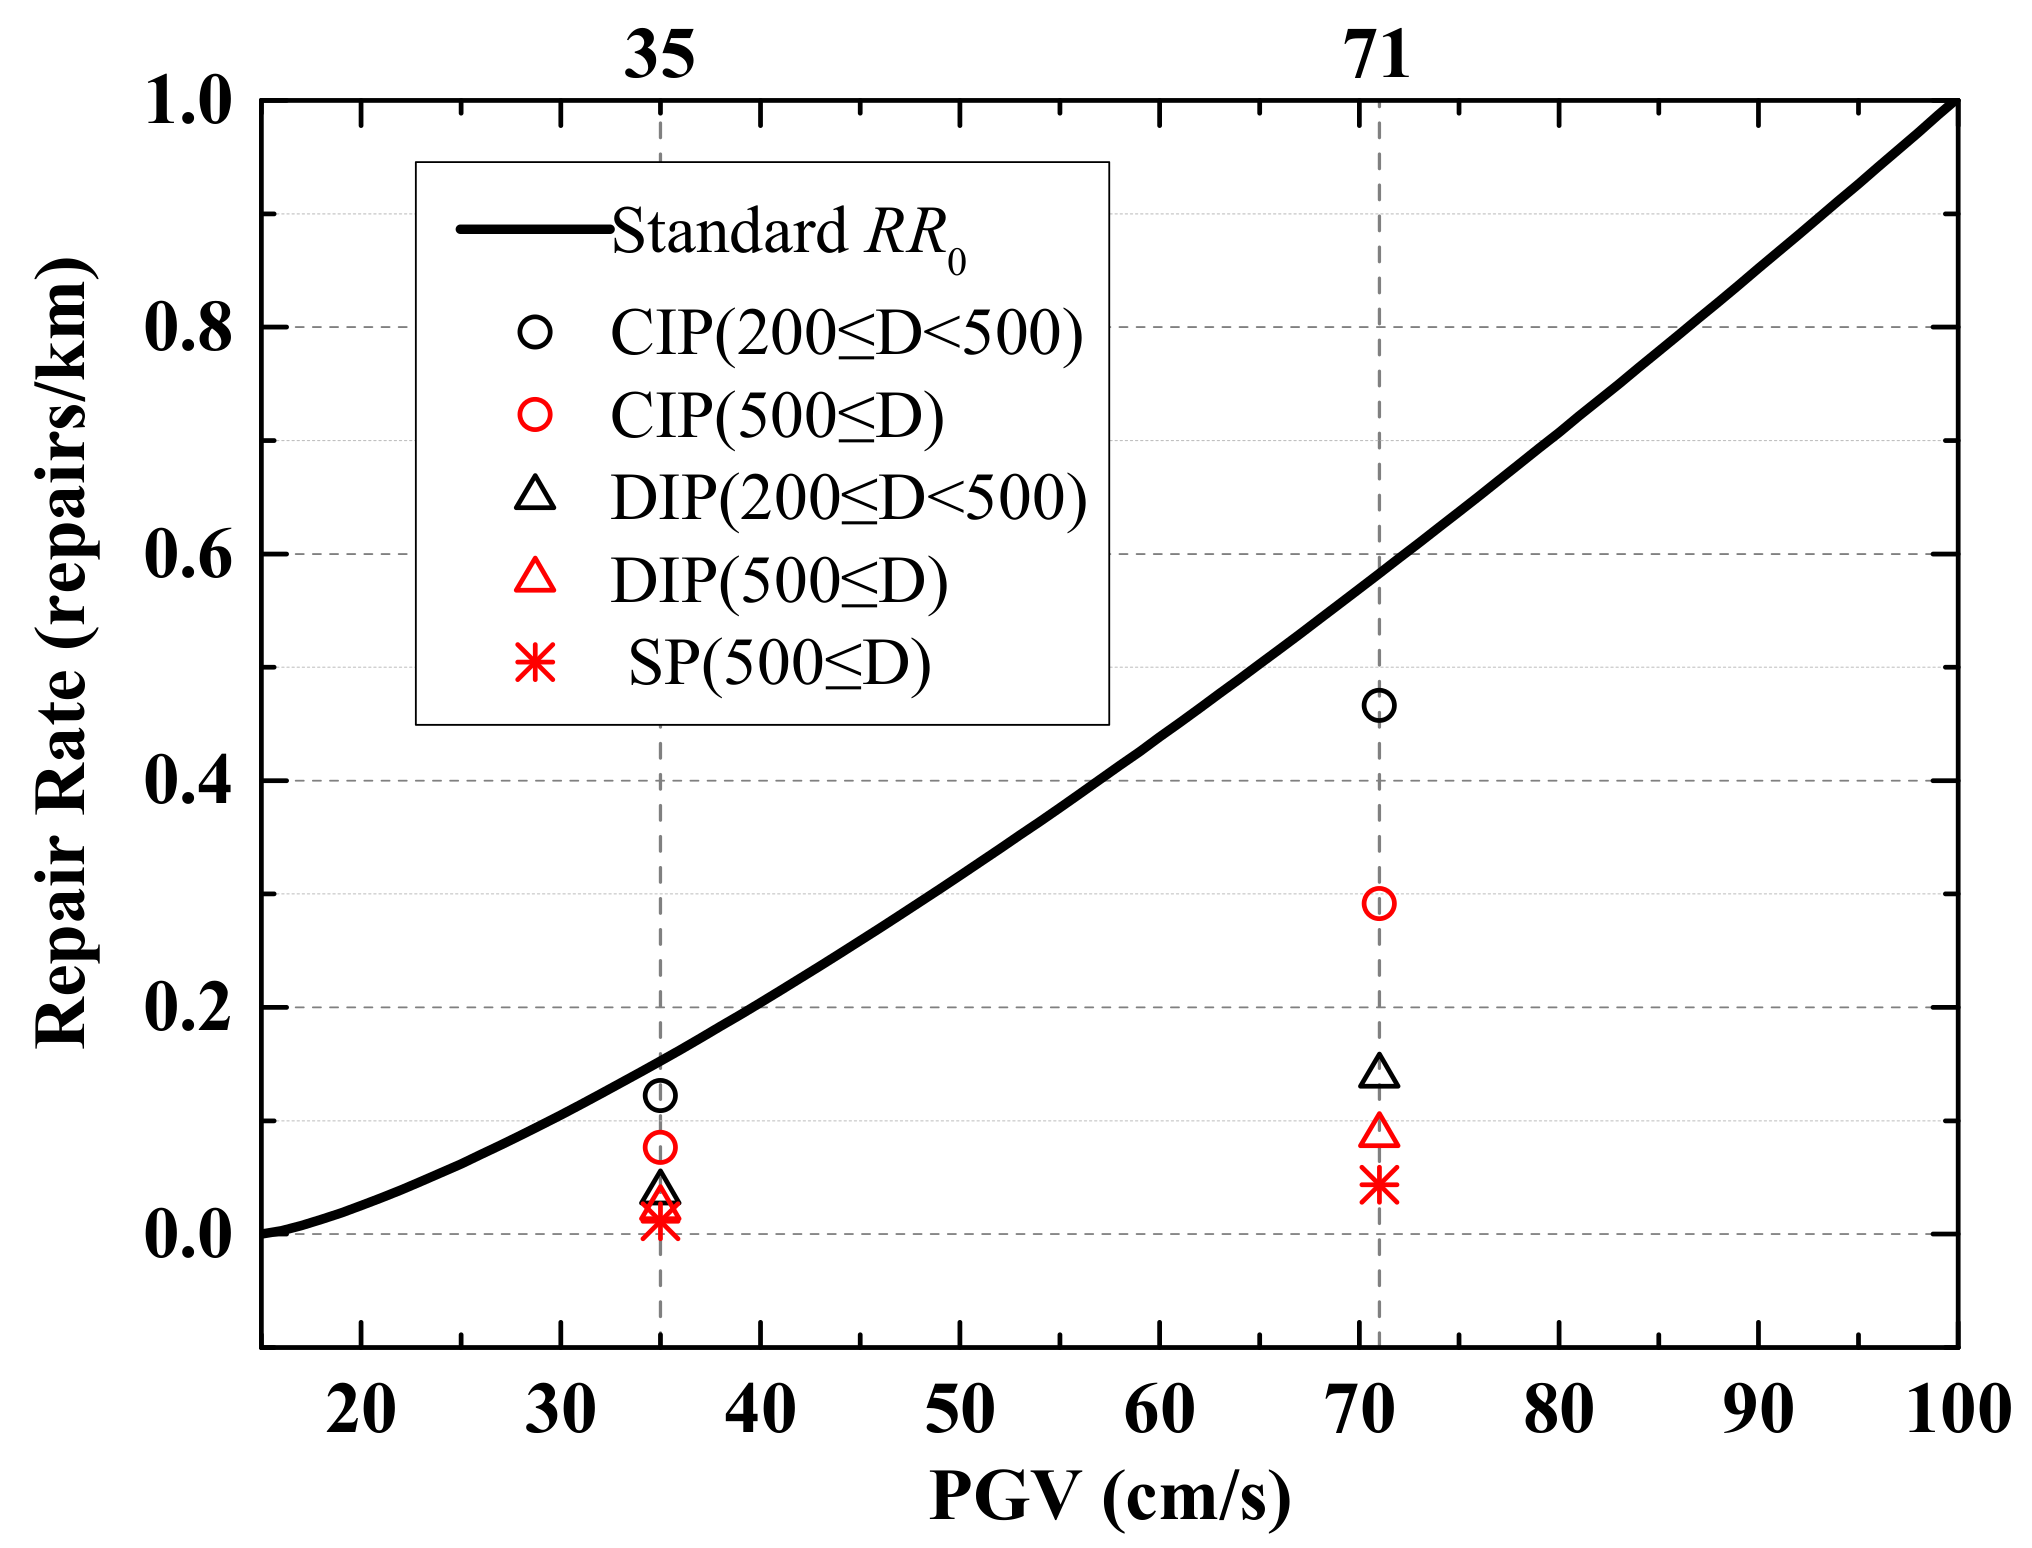
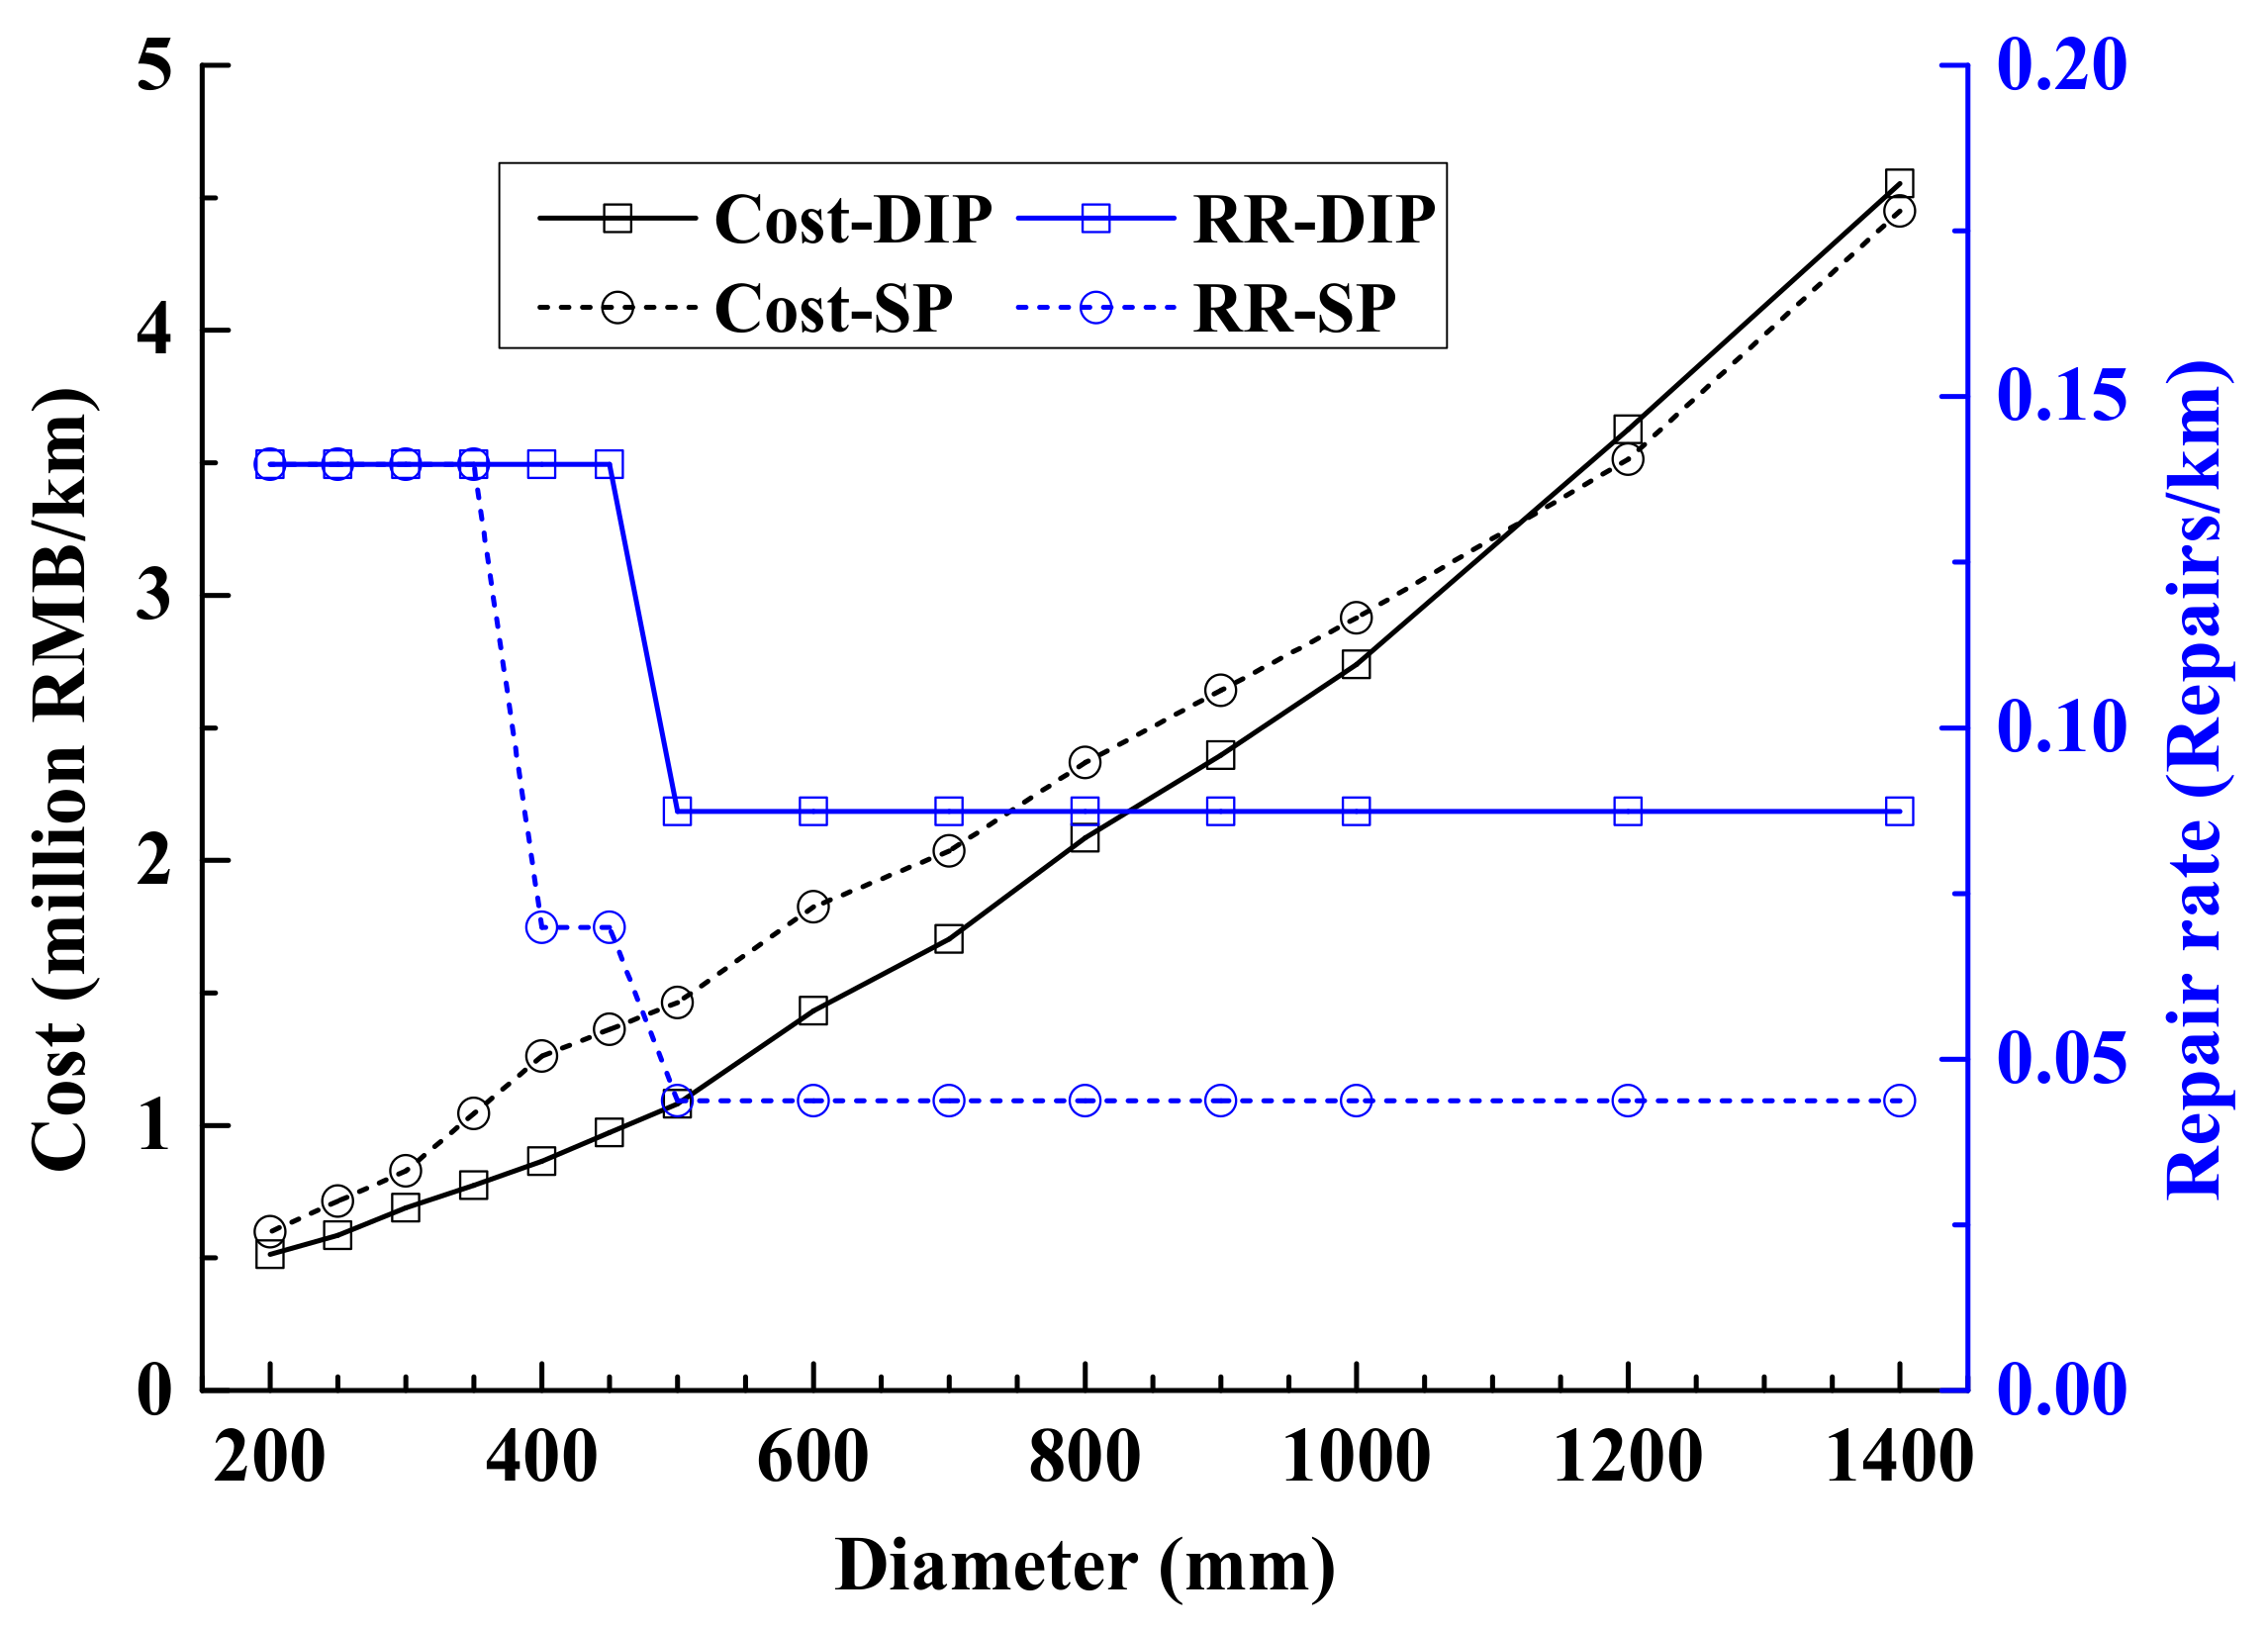
2.2. Seismic Fragility of Pipelines
2.3. Seismic Performance Evaluation of WDS by Hydraulic Simulation
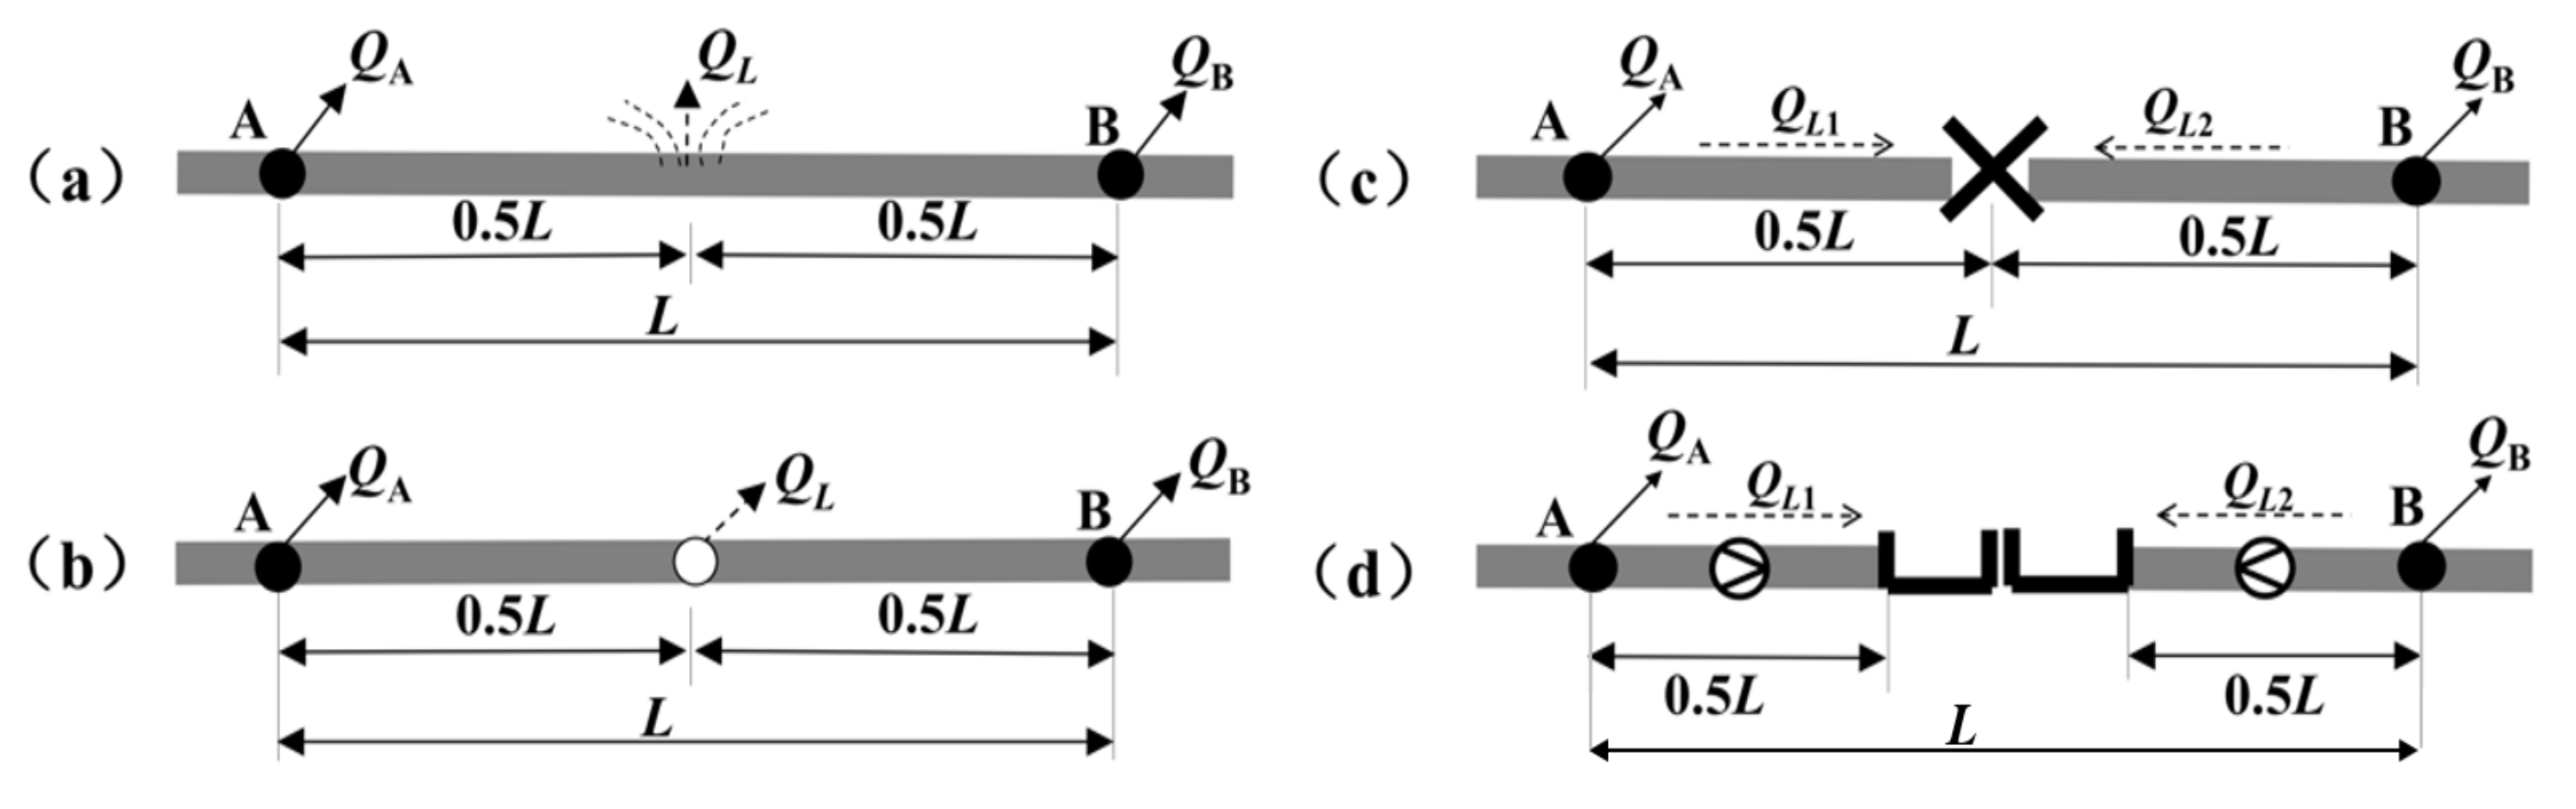
2.3.1. Hydraulic Model of the WDS with Earthquake Damaged Pipelines
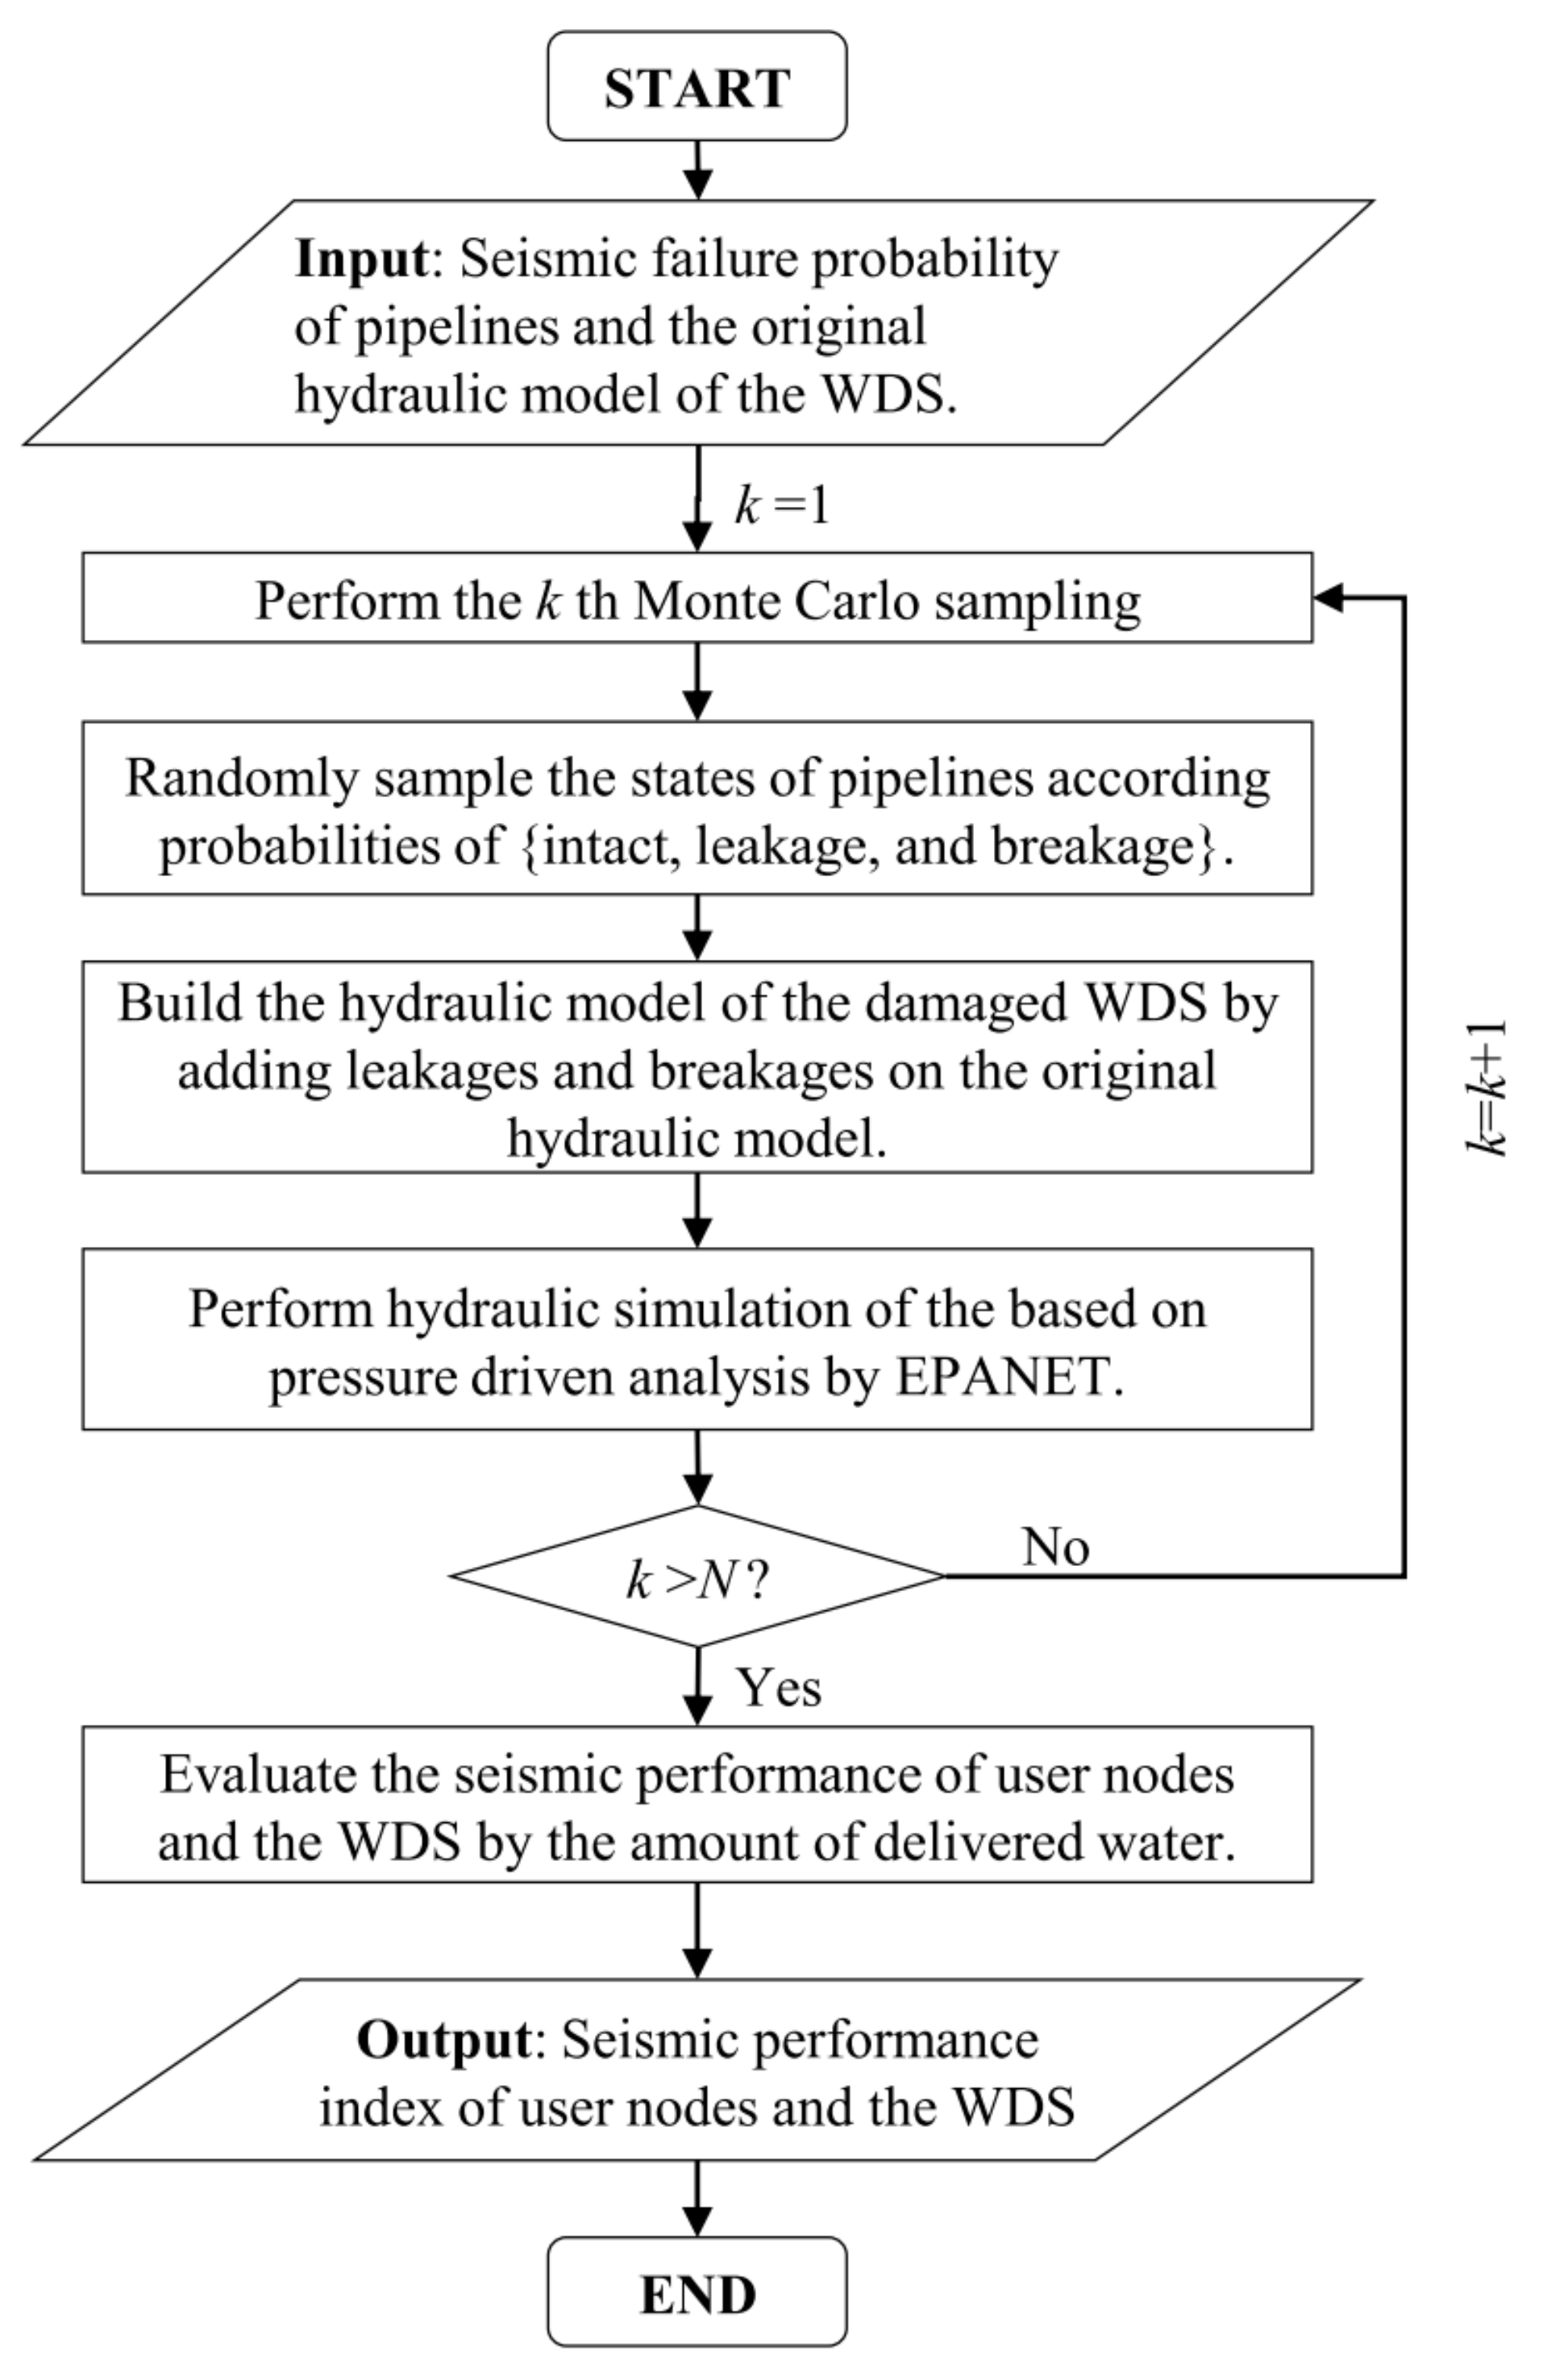
2.3.2. Probabilistic Analysis by Monte Carlo Simulation
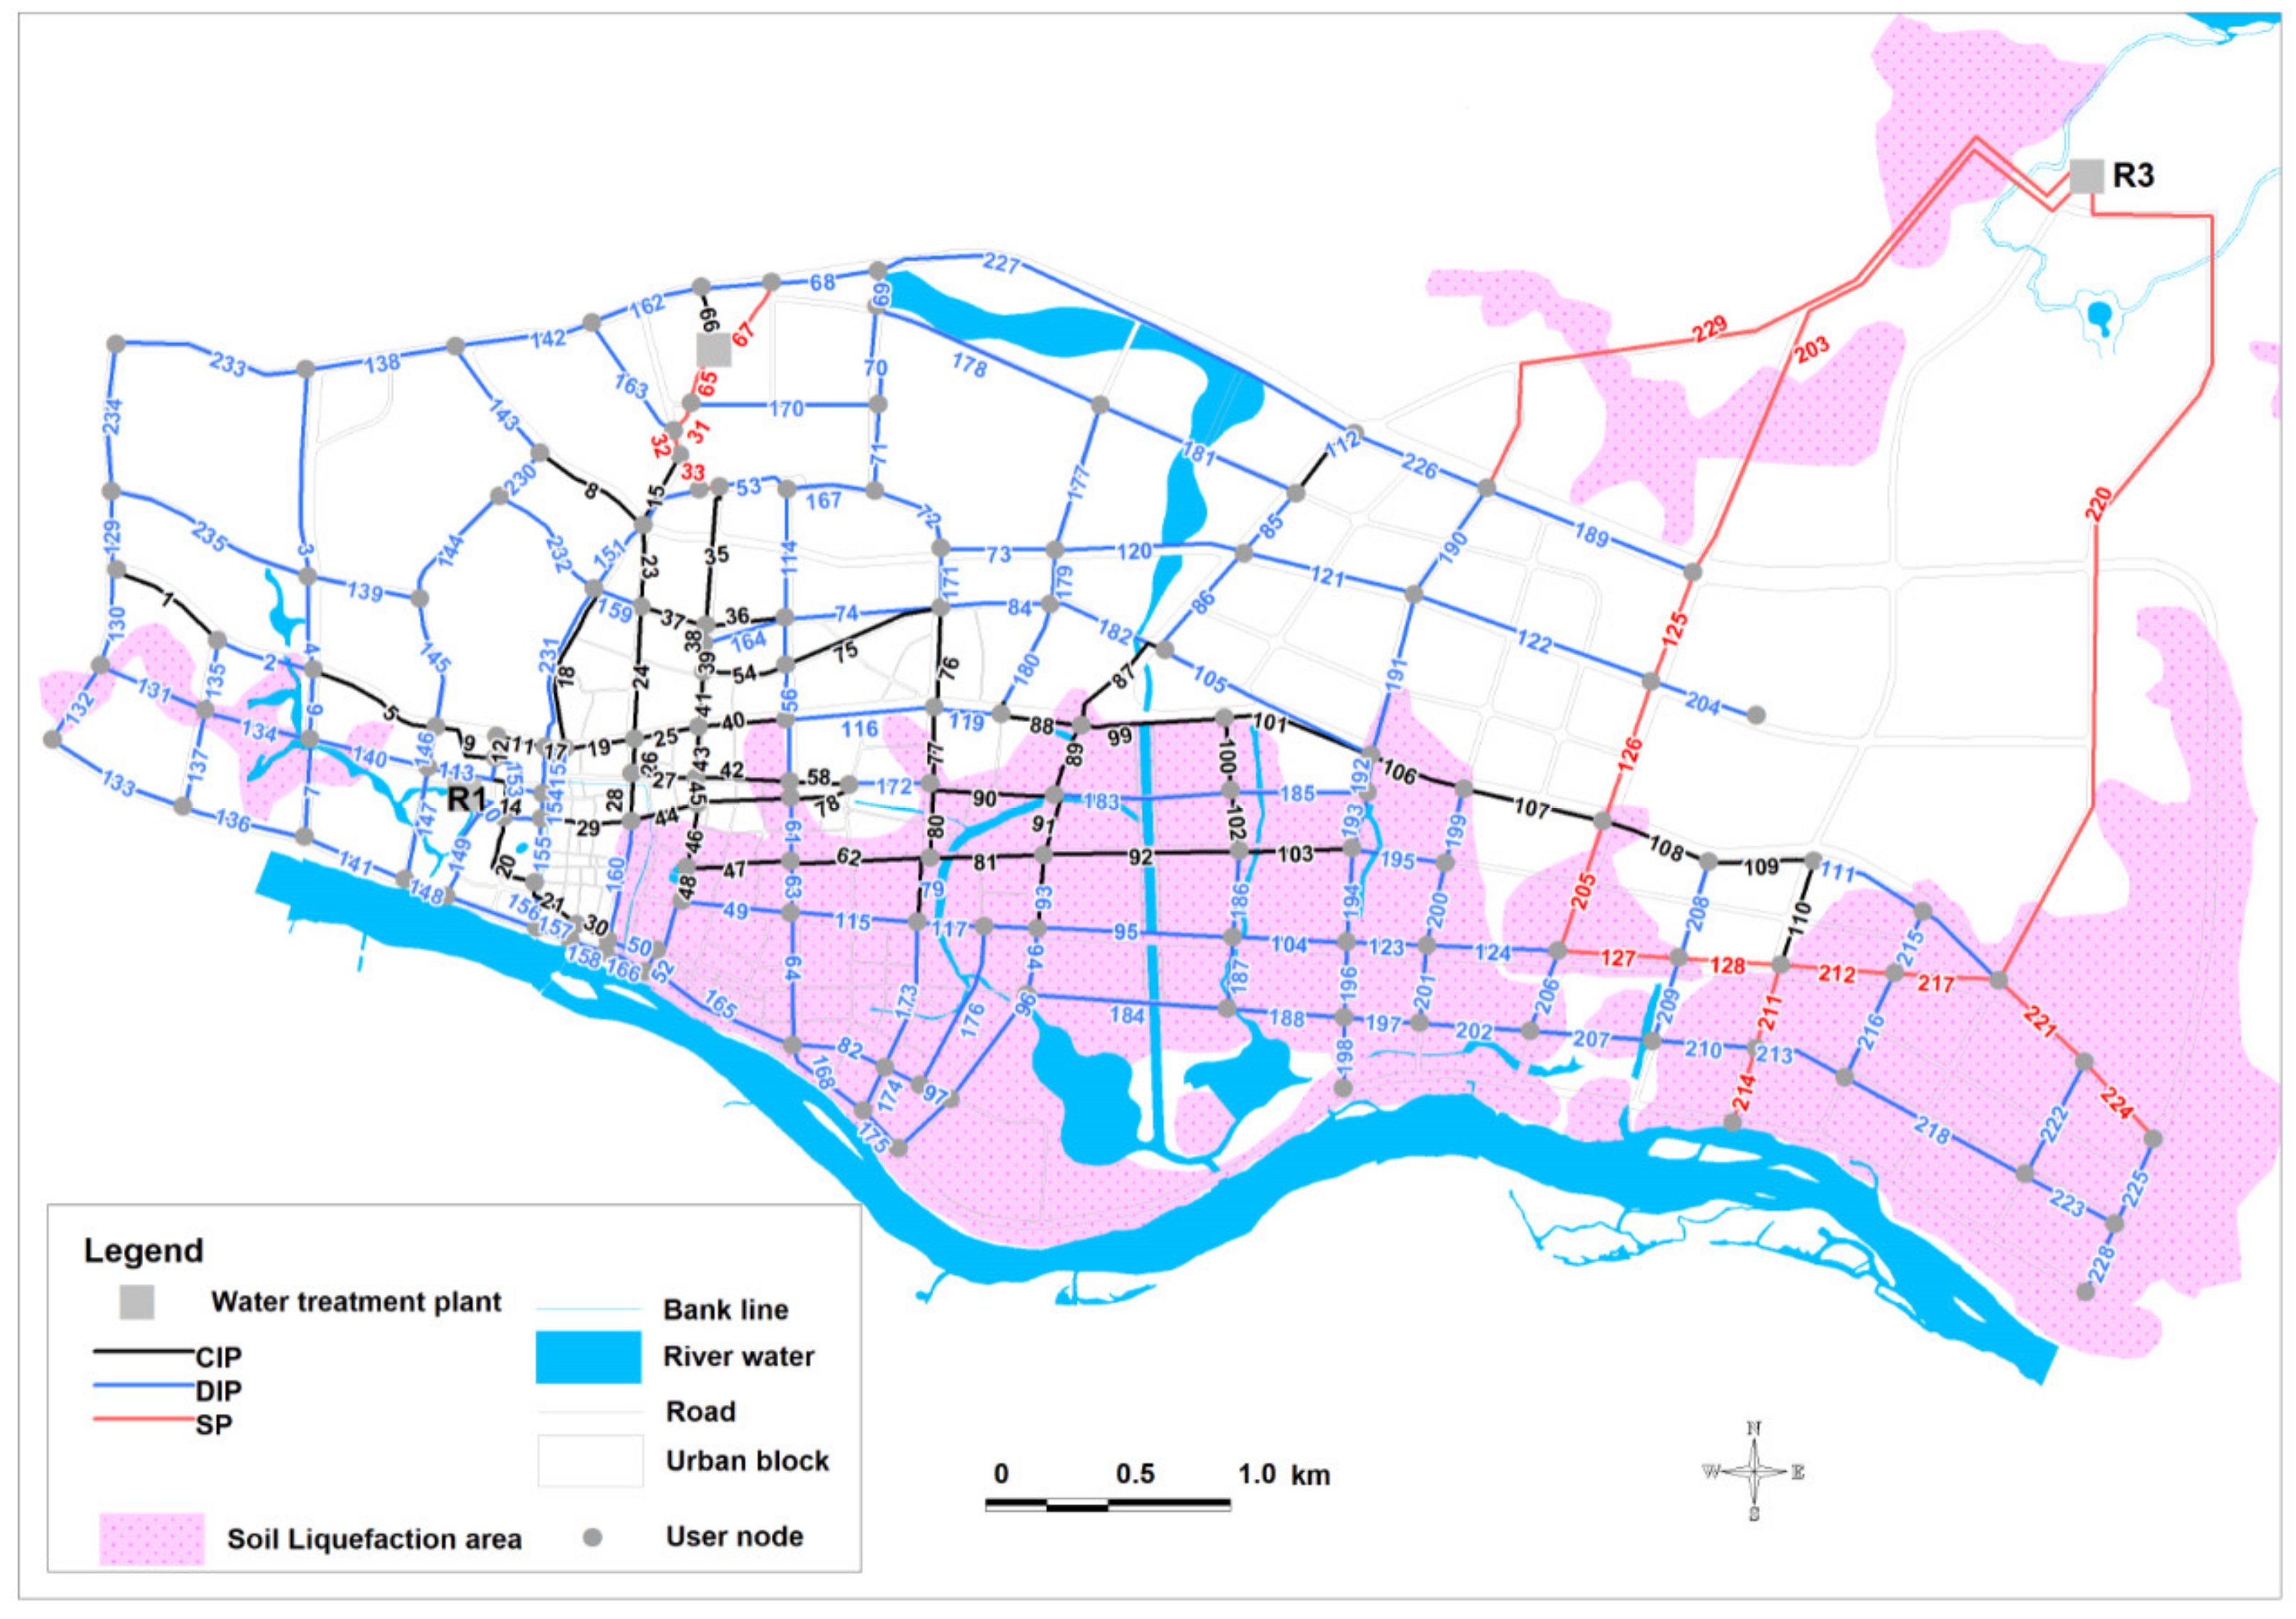
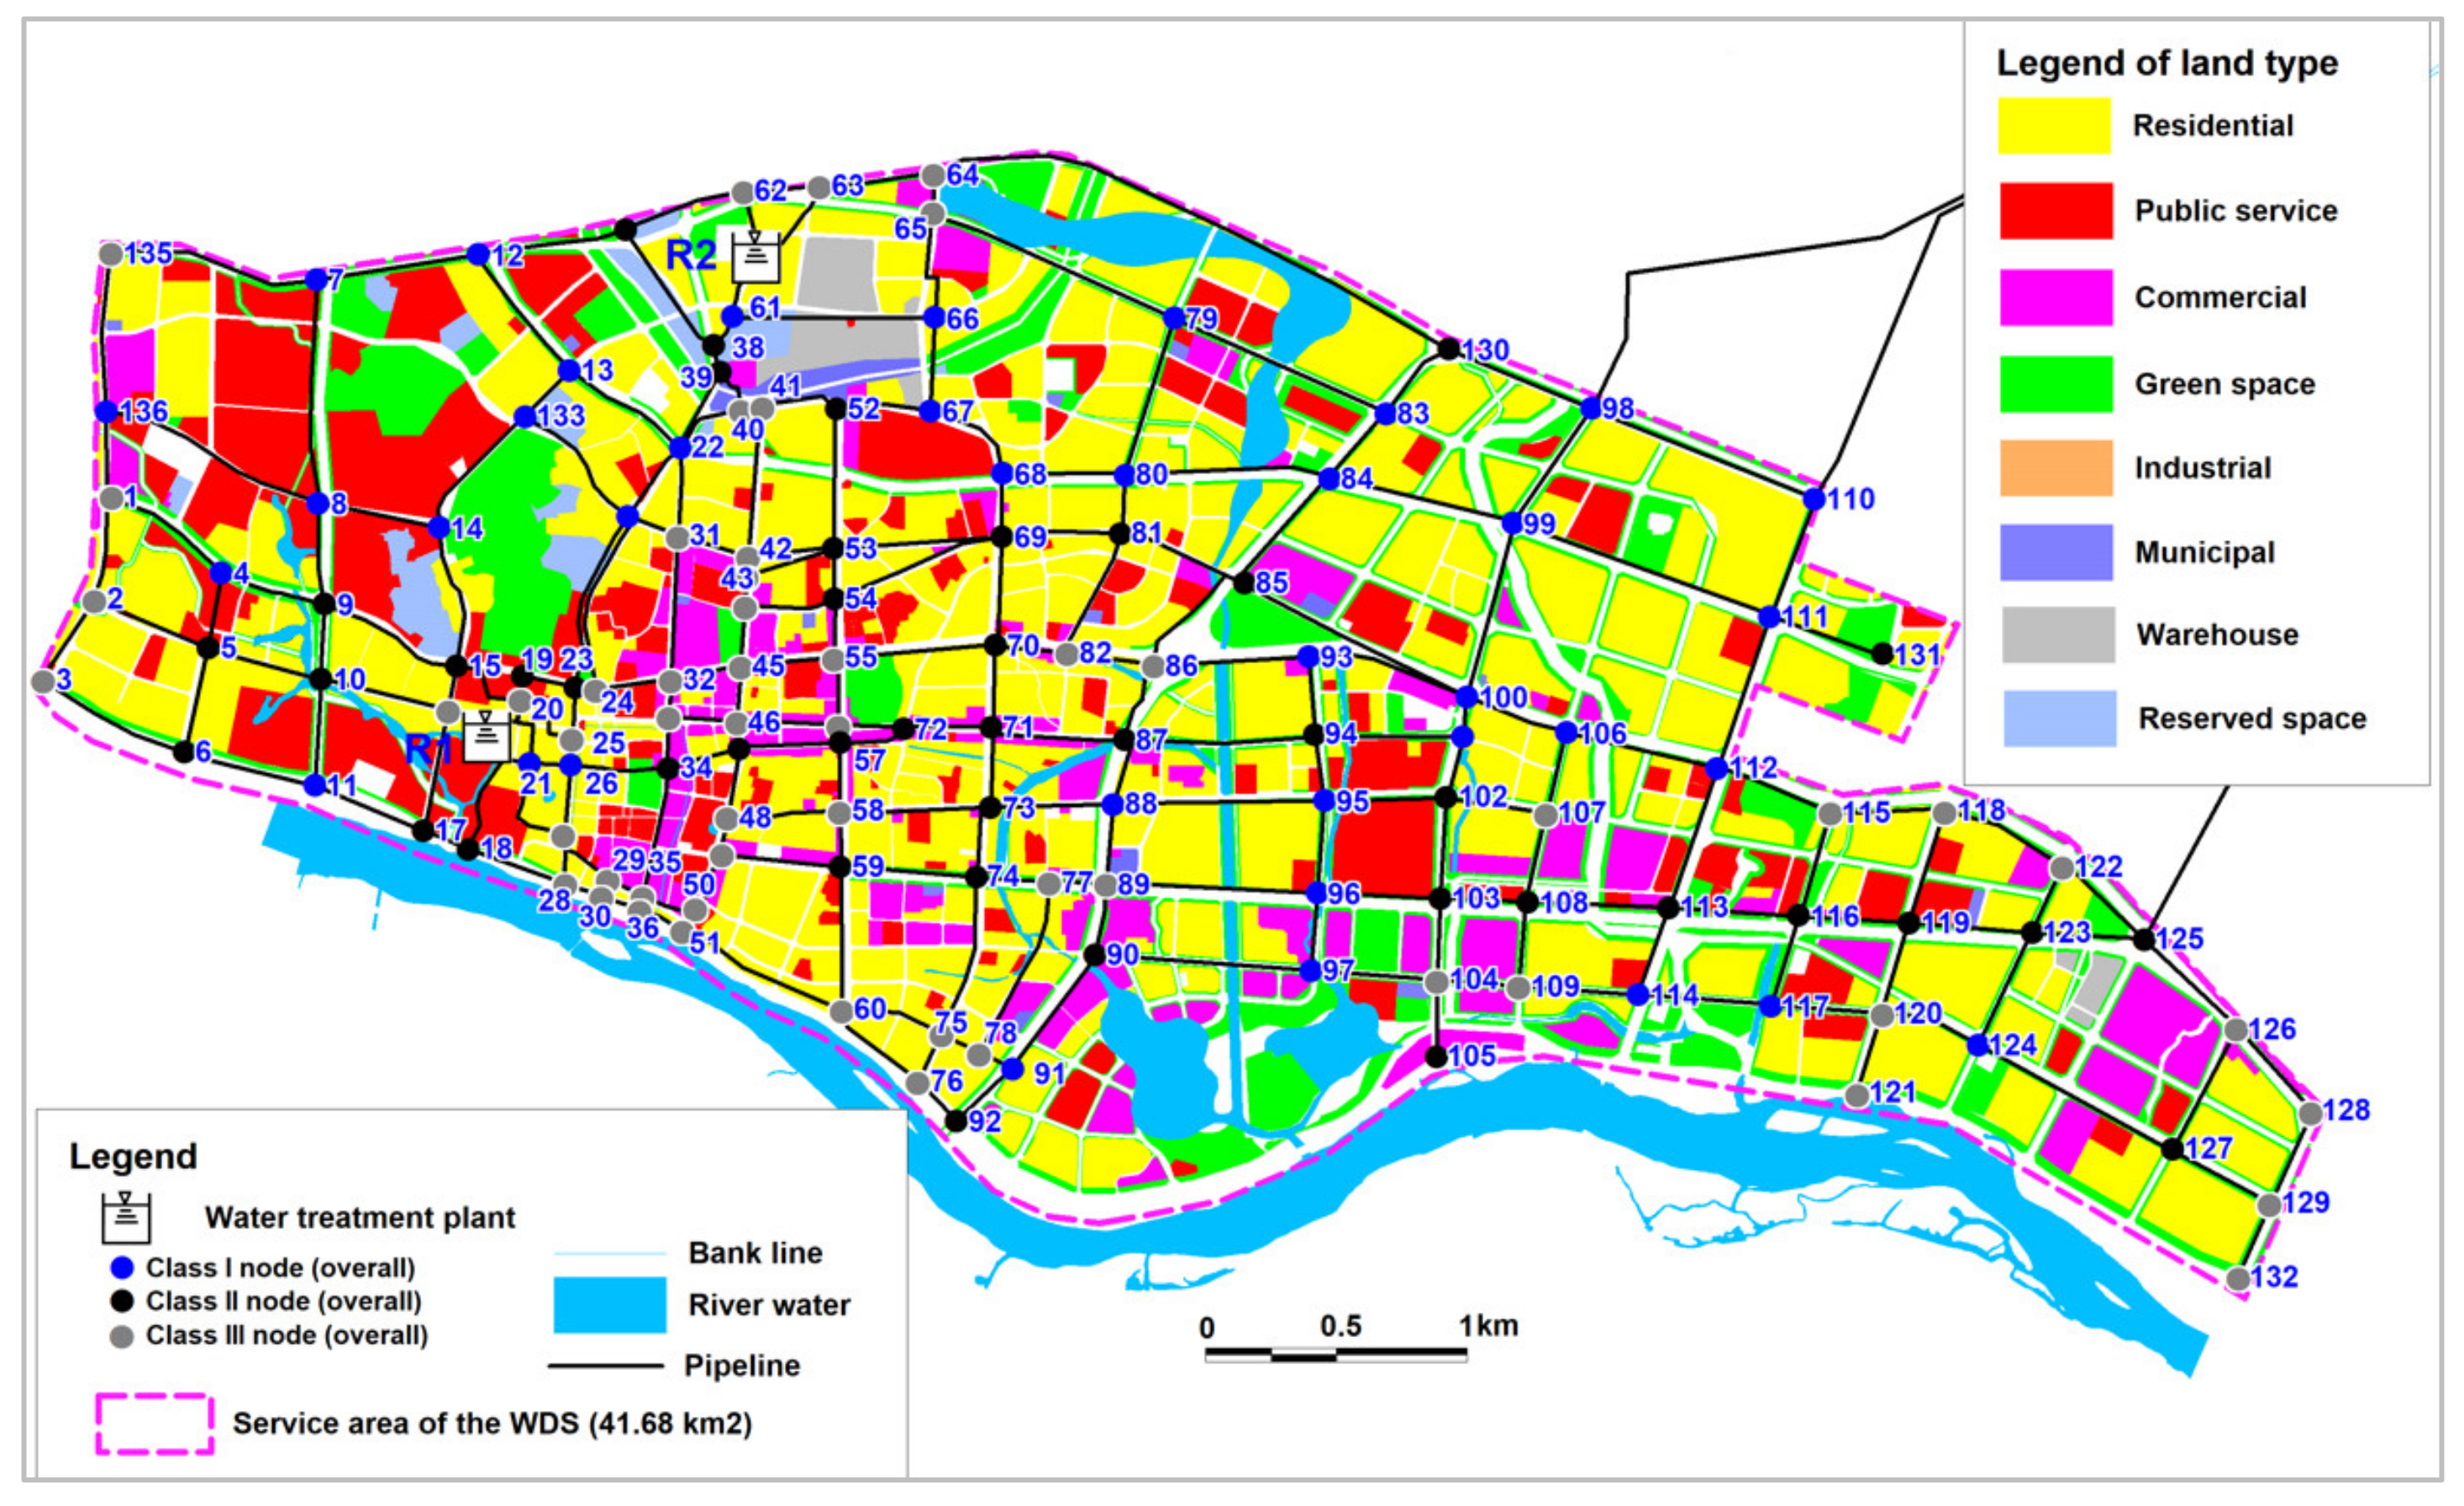
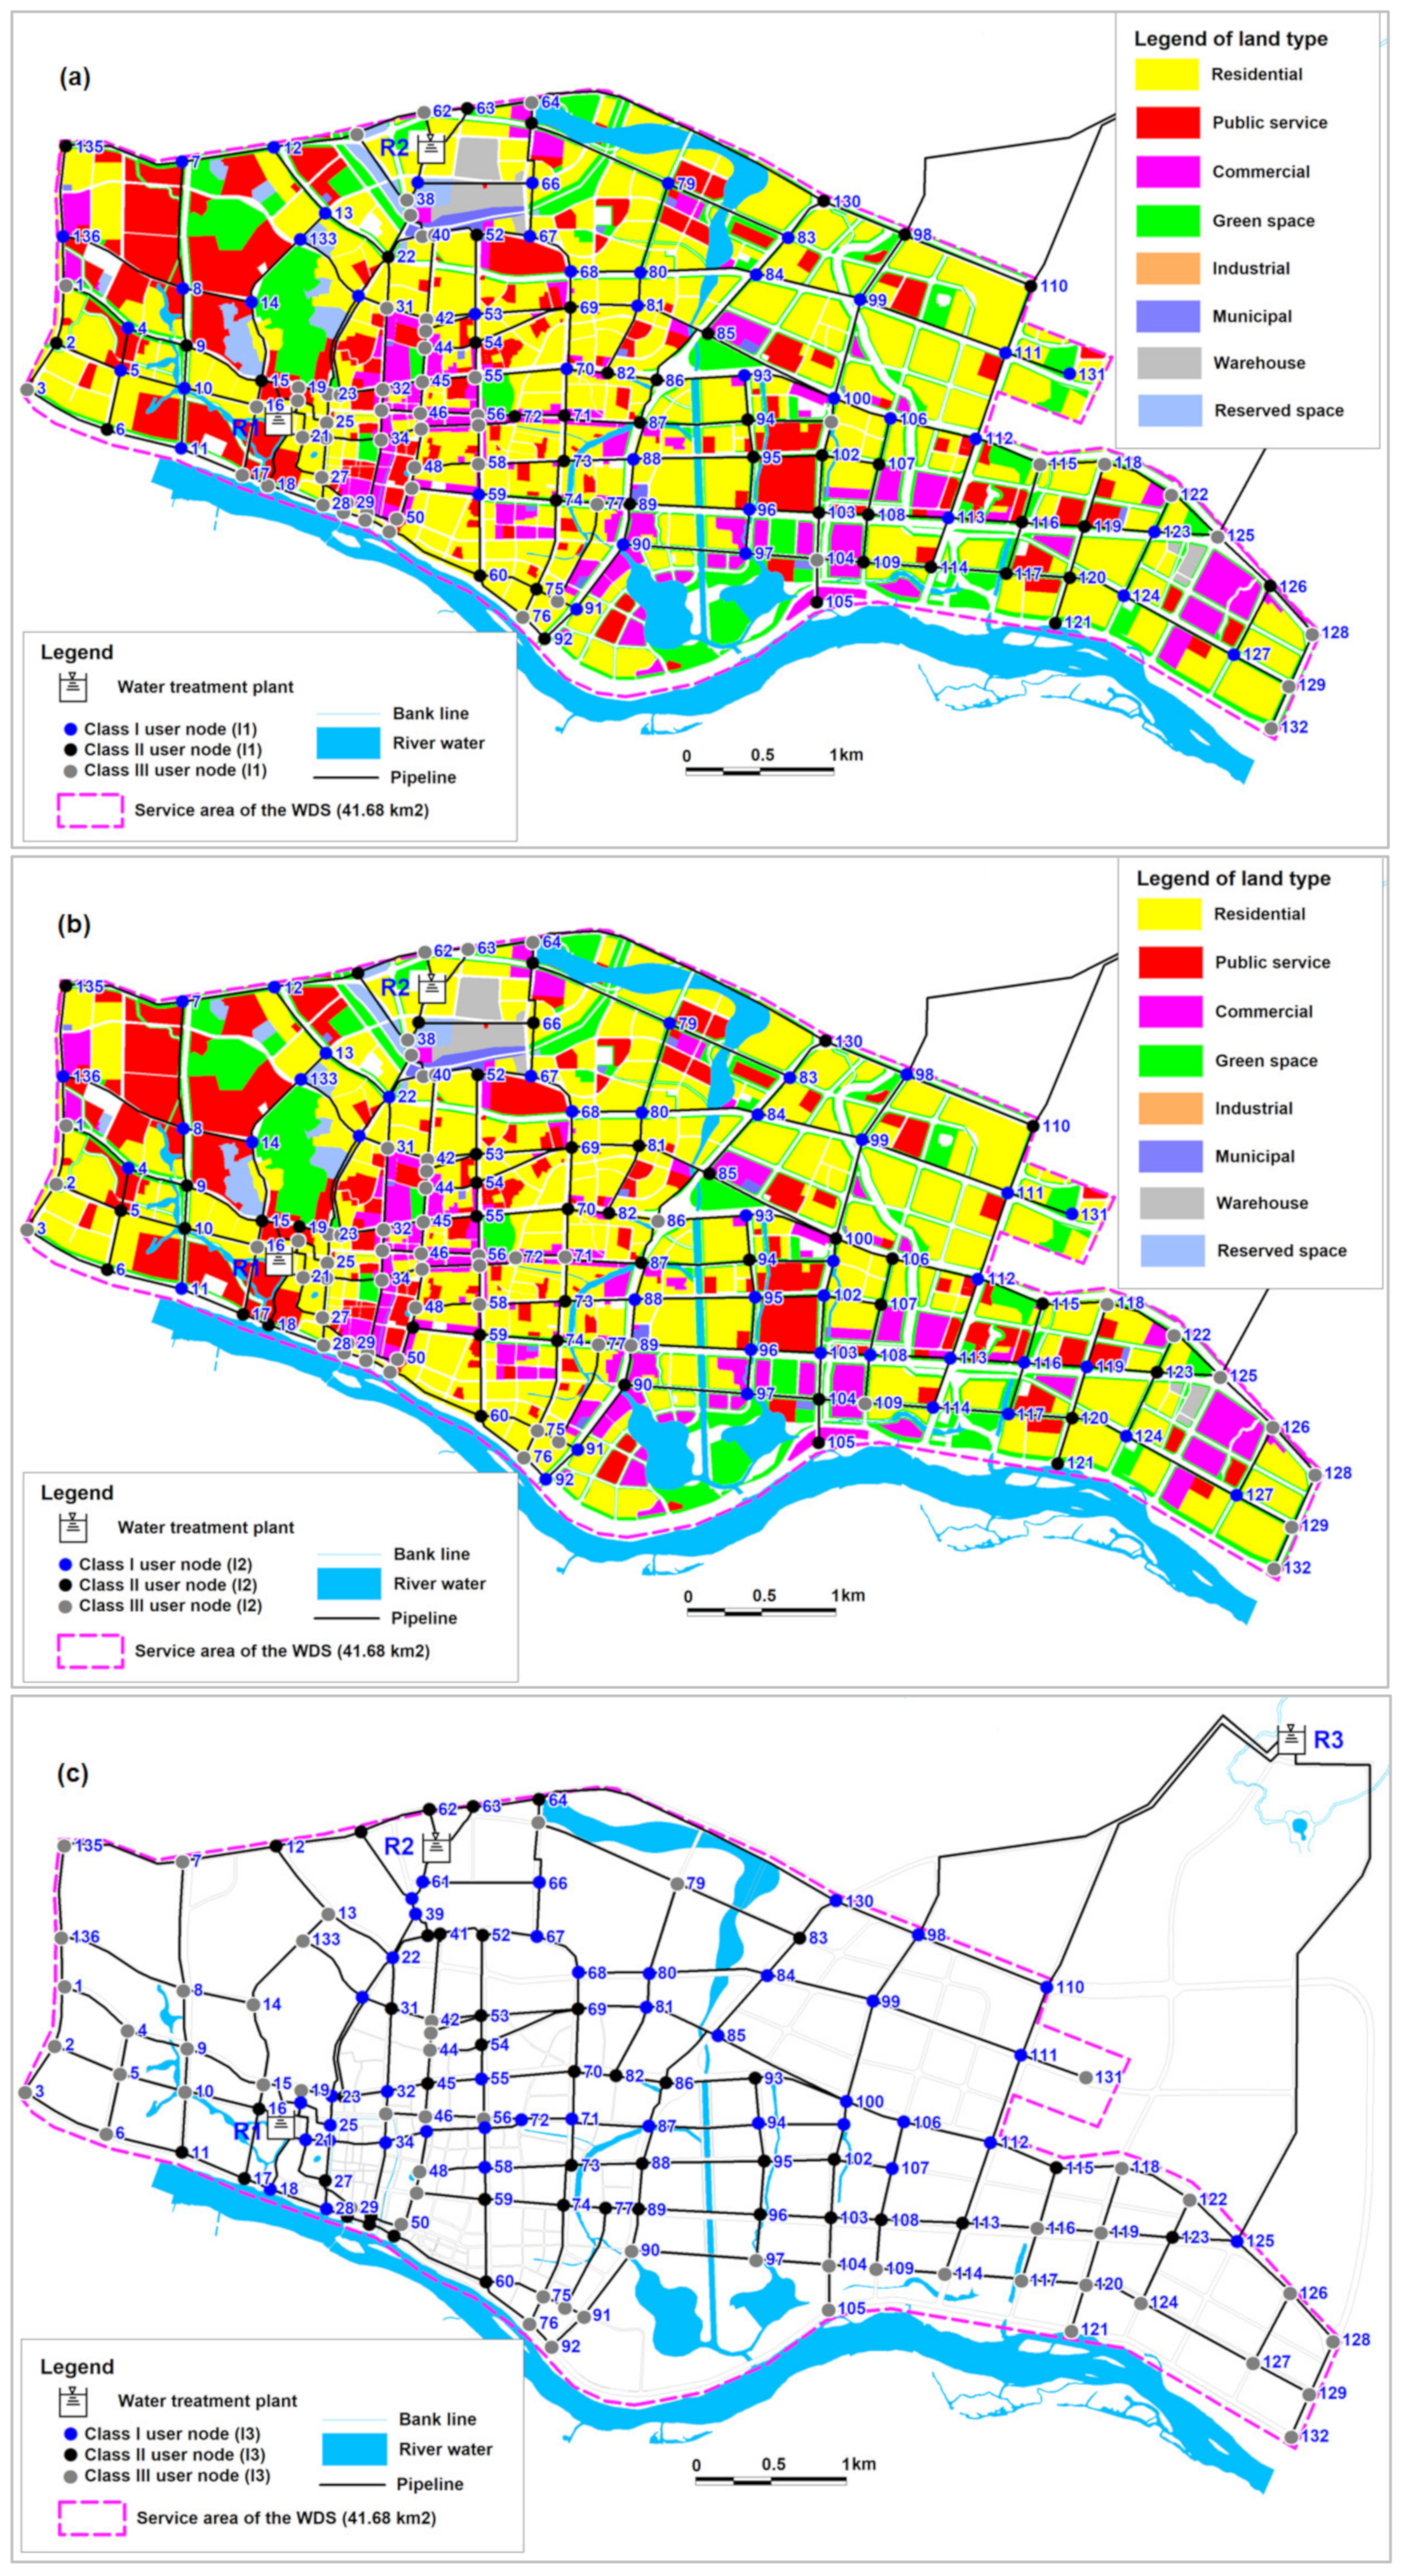
3. Case Study
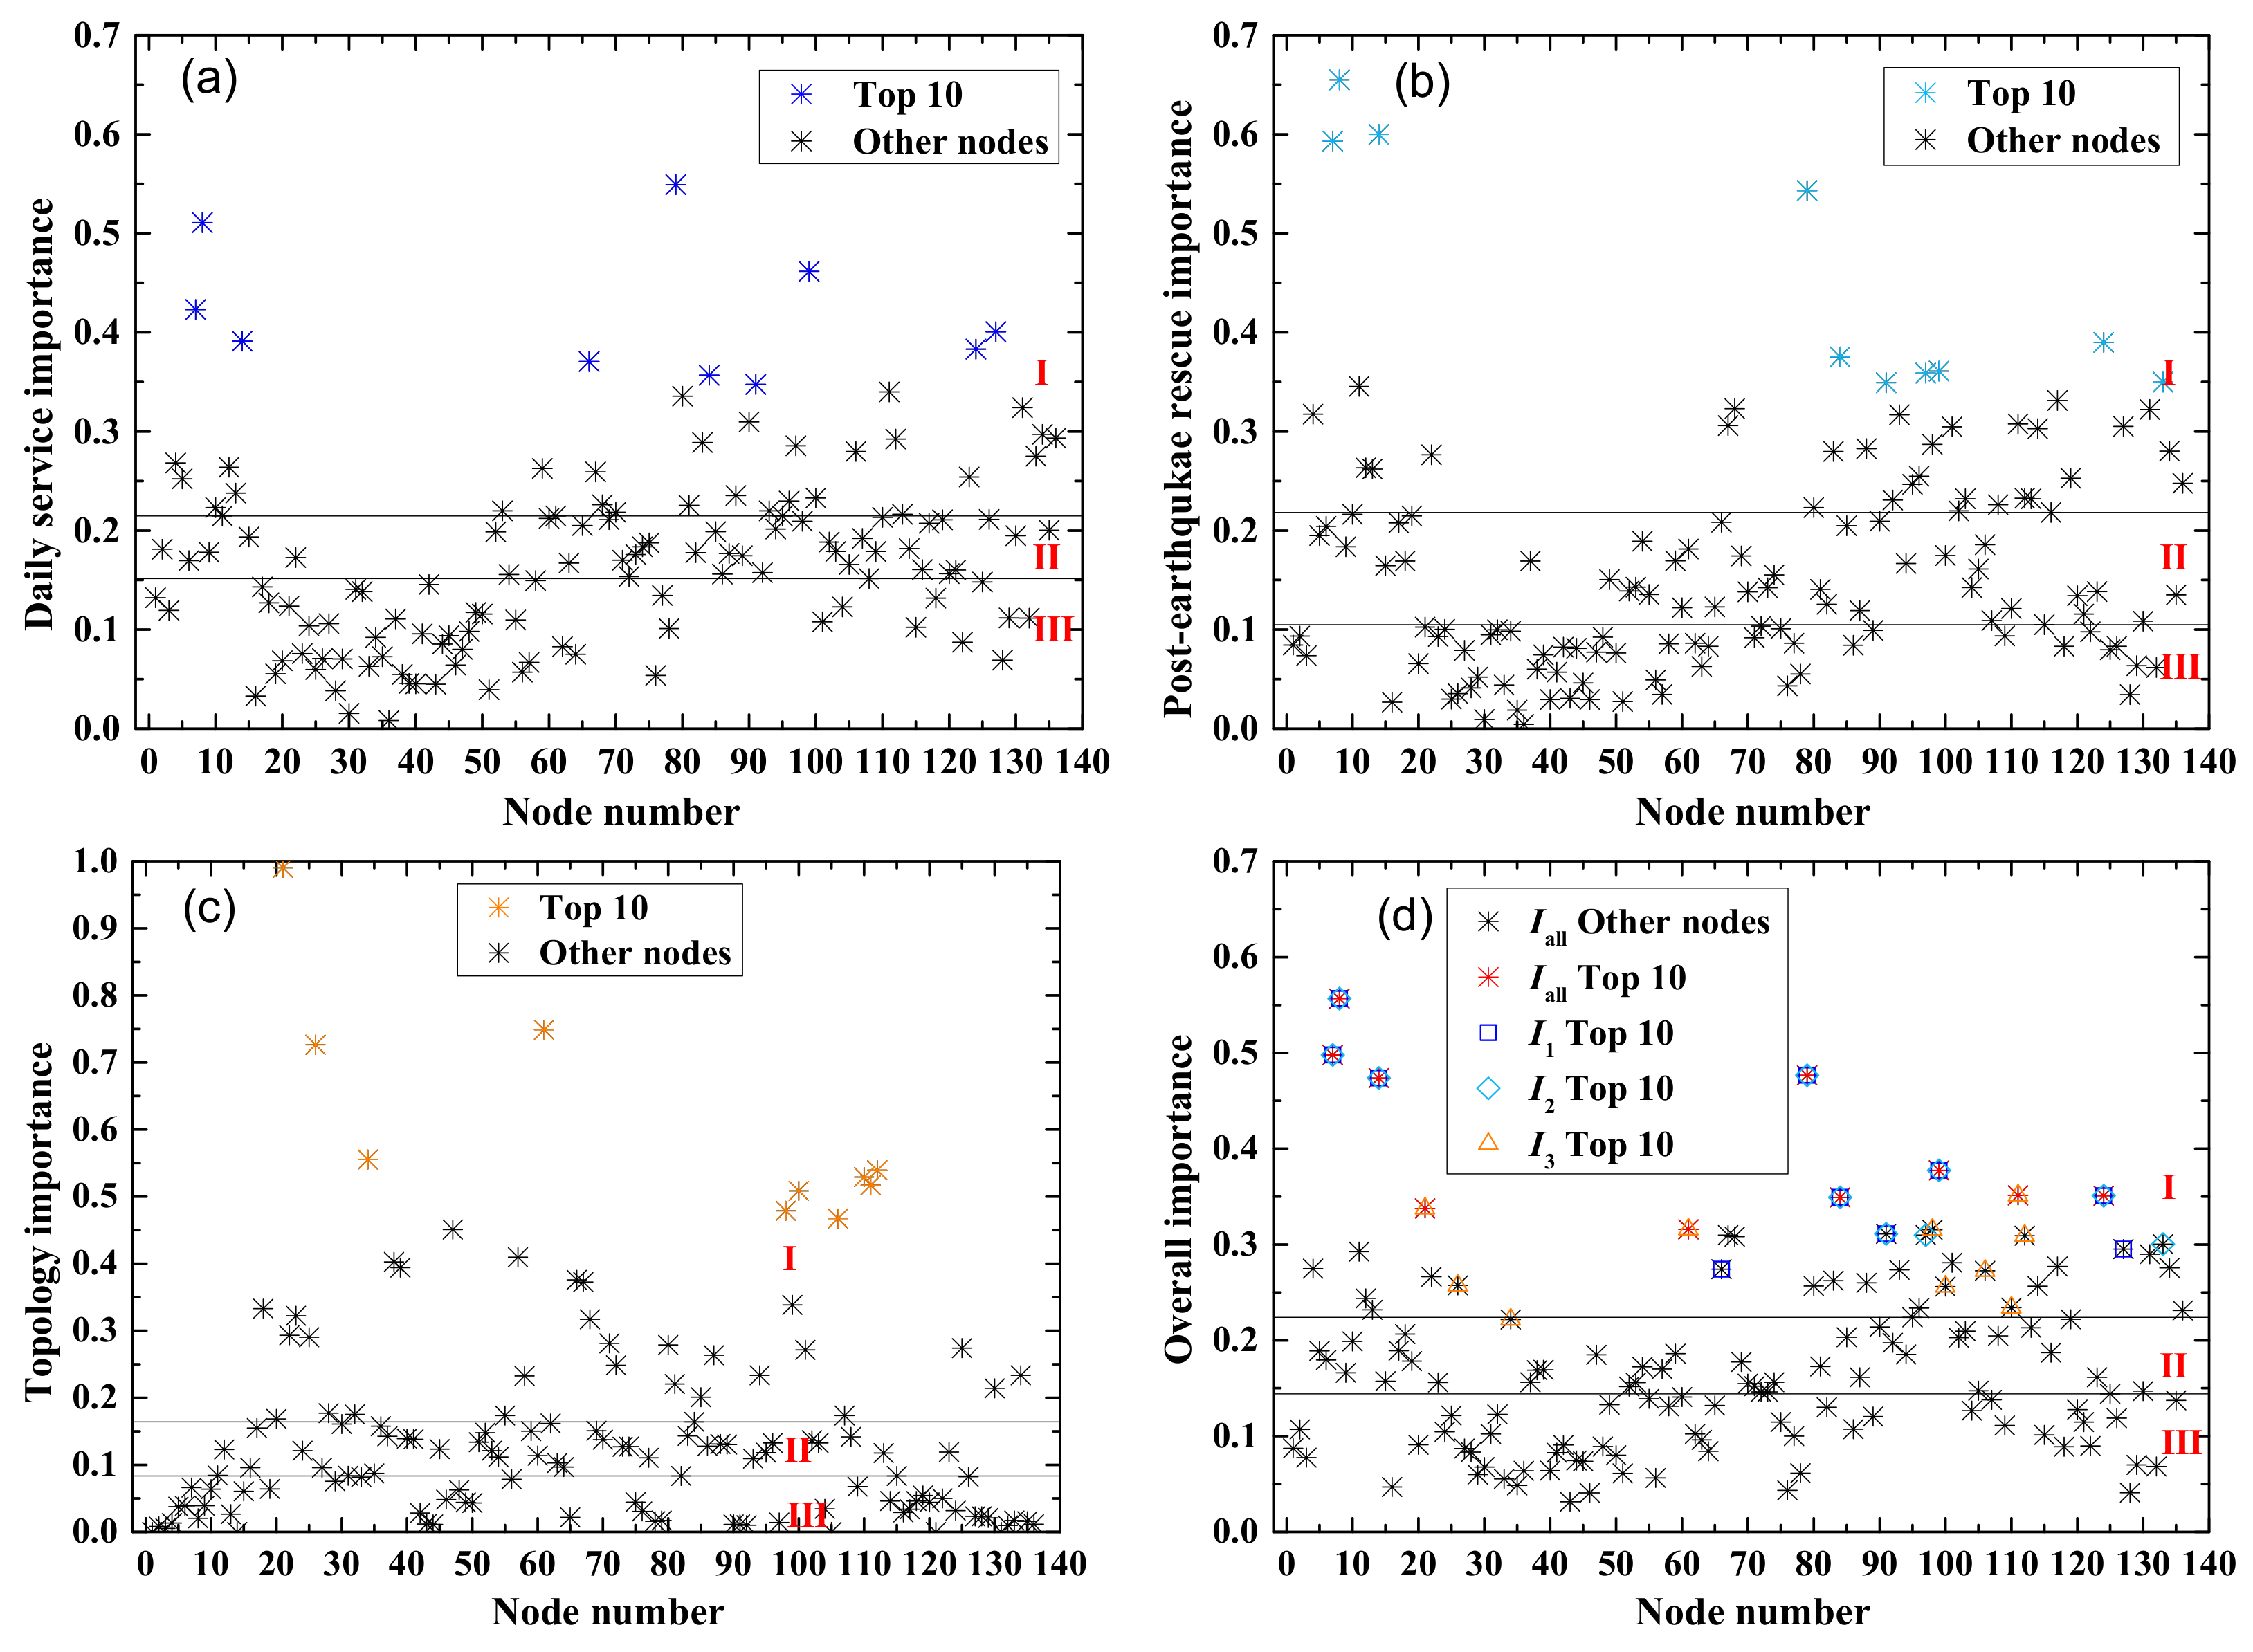
4. Importance Classification of User Nodes
5. Seismic Performance of the WDS and Pipeline Renovation Plan
6. Conclusions and Remarks
- The importance classification to user nodes by the multi-index measures is different from those by a single importance index; the multi-index approach can identify the critical user nodes for post-earthquake rescue service, which may be ignored by the indices for daily service and network topology influence.
- Seismic performance of individual user nodes provides insightful information of the WDS performance than the average or overall value of the system. The locations of critical user nodes with poor performance provide a target for pre-disaster interventions.
- The seismic performance evaluation of the WDS considering the importance of classification to user nodes has a notable impact on the selection of pipeline renovation schemes. The proposed framework provides a novel perspective for the decision-makers to focus the limited resources on the seismic performance improvement of critical user nodes.
Author Contributions
Funding
Acknowledgments
Conflicts of Interest
References
- Kammouh, O.; Cimellaro, G.P.; Mahin, S.A. Downtime estimation and analysis of lifelines after an earthquake. Eng. Struct. 2018, 173, 393–403. [Google Scholar] [CrossRef]
- Li, J.; He, J. A recursive decomposition algorithm for network seismic reliability evaluation. Earthq. Eng. Struct. D 2002, 31, 1525–1539. [Google Scholar] [CrossRef]
- Adachi, T.; Ellingwood, B.R. Serviceability assessment of a municipal water system under spatially correlated seismic intensities. Comput.-Aided Civ. Inf. 2009, 24, 237–248. [Google Scholar] [CrossRef]
- Selcuk-Kestel, A.S.; Duzgun, H.S.; Oduncuoglu, L. A GIS-based software for lifeline reliability analysis under seismic hazard. Comput. Geosci. 2012, 42, 37–46. [Google Scholar] [CrossRef]
- Lim, H.; Song, J. Efficient risk assessment of lifeline networks under spatially correlated ground motions using selective recursive decomposition algorithm. Earthq. Eng. Struct. D 2012, 41, 1861–1882. [Google Scholar] [CrossRef]
- Shi, P.; O’Rourke, T.D. Seismic Response Modeling of Water Supply Systems; Technical Report MCEER-08-0016; The Multidisciplinary Center for Earthquake Engineering Research, University at Buffalo, State University of New York: Buffalo, NY, USA, 2008. [Google Scholar]
- Laucelli, D.; Giustolisi, O. Vulnerability assessment of water distribution networks under seismic actions. J. Water Resour. Plan. Manag. 2015, 141, 4014082. [Google Scholar] [CrossRef]
- Pagano, A.; Sweetapple, C.; Farman, R.; Giordano, R.; Butler, D. Water distribution networks resilience analysis: A comparison between graph Theory-Based approaches and global resilience analysis. Water Resour. Manag. 2019, 33, 2925–2940. [Google Scholar] [CrossRef]
- Shinozuka, M.; Tan, R.Y.; Toike, T. Serviceability of water transmission systems under seismic risk. In Lifeline Earthquake Engineering: The Current State of Knowledge; American Society of Civil Engineers: New York, NY, USA, 1981. [Google Scholar]
- Yazdani, A.; Jeffrey, P. Applying network theory to quantify the redundancy and structural robustness of water distribution systems. J. Water Resour. Plan. Manag. 2012, 138, 153–161. [Google Scholar] [CrossRef]
- Yazdani, A.; Jeffrey, P. Water distribution system vulnerability analysis using weighted and directed network models. Water Resour. Res. 2012, 48, W06517. [Google Scholar] [CrossRef]
- Yoon, S.; Lee, Y.; Jung, H. A comprehensive framework for seismic risk assessment of urban water transmission networks. Int. J. Disast. Risk Reduct. 2018, 31, 983–994. [Google Scholar] [CrossRef]
- Meijer, D.; van Bijnen, M.; Langeveld, J.; Korving, H.; Post, J.; Clemens, F. Identifying critical elements in sewer networks using Graph-Theory. Water 2018, 10, 136. [Google Scholar] [CrossRef] [Green Version]
- Markov, I.; Grigoriu, M.; O’Rourke, T.D. An Evaluation of Seismic Serviceability of Water Supply Networks with Application to the San Francisco Auxiliary Water Supply; Technical Report NCEER-94-0001; National Center for Earthquake Engineering Research University of Buffalo, State University of New York: Buffalo, NY, USA, 1994. [Google Scholar]
- Hwang, H.H.M.; Lin, H.; Shinozuka, M. Seismic performance assessment of water delivery systems. J. Infrastruct. Syst. 1998, 4, 118–125. [Google Scholar] [CrossRef]
- Yoo, D.G.; Kang, D.; Kim, J.H. Optimal design of water supply networks for enhancing seismic reliability. Reliab. Eng. Syst. Saf. 2016, 146, 79–88. [Google Scholar] [CrossRef]
- Bonneau, A.L.; O’Rourke, T.D. Water Supply Performance during Earthquakes and Extreme Events; Technical Report MCEER-09-0003; The Multidisciplinary Center for Earthquake Engineering Research, University at Buffalo, State University of New York: Buffao, NY, USA, 2009. [Google Scholar]
- Romero, N.; O’Rourke, T.D.; Nozick, L.K.; Davis, C.A. Seismic hazards and water supply performance. J. Earthq. Eng. 2010, 14, 1022–1043. [Google Scholar] [CrossRef]
- Yoo, D.G.; Lee, J.H.; Lee, B.Y. Comparative study of hydraulic simulation techniques for water supply networks under earthquake hazard. Water 2019, 11, 333. [Google Scholar] [CrossRef] [Green Version]
- Wang, Y.; Au, S. Spatial distribution of water supply reliability and critical links of water supply to crucial water consumers under an earthquake. Reliab. Eng. Syst. Saf. 2009, 94, 534–541. [Google Scholar] [CrossRef]
- Lee, C.W.; Kwon, H.J.; Yoo, D.G. Seismic reliability assessment of water supply systems considering critical paths. Appl. Sci. 2020, 10, 8056. [Google Scholar] [CrossRef]
- Didrik, M.; Johan, P.; Jan, P.H.; Hans, K.; Jeroen, L.; François, C. Identifying critical elements in drinking water distribution networks using graph theory. Struct. Infrastruct. Eng. 2020, 17, 347–360. [Google Scholar] [CrossRef] [Green Version]
- Li, J.; Dueñas-Osorio, L.; Chen, C.; Shi, C. AC power flow importance measures considering multi-element failures. Reliab. Eng. Syst. Saf. 2017, 160, 89–97. [Google Scholar] [CrossRef] [Green Version]
- Li, J.; Liu, W.; Bao, Y.F. Genetic algorithm for seismic topology optimization of lifeline network systems. Earthq. Eng. Struct. Dyn. 2008, 37, 1295–1312. [Google Scholar] [CrossRef]
- Applied Technology Council (ATC). Critical Assessment of Lifeline System Performance: Understanding Societal Needs in Disaster Restoration; Technical Report NIST GCR 16-917-39; The Engineering Laboratory of the National Institute of Standards and Commerce: Gaithersburg, MD, USA, 2016. [Google Scholar]
- Paez, D.; Filion, Y.; Castro-Gama, M.; Quintiliani, C.; Santopietro, S.; Sweetapple, C.; Walski, T. Battle of postdisaster response and restoration. J. Water Resour. Plan. Manag. 2020, 146, 04020067. [Google Scholar] [CrossRef]
- Zhang, Q.; Zheng, F.; Chen, Q.; Kapelan, Z.; Diao, K.; Zhang, K.; Huang, Y. Improving the resilience of postdisaster water distribution systems using dynamic optimization framework. J. Water Resour. Plan. Manag. 2020, 146, 4019075. [Google Scholar] [CrossRef] [Green Version]
- Bałut, A.; Brodziak, R.; Bylka, J.; Zakrzewski, P. Ranking approach to scheduling repairs of a water distribution system for the post-disaster response and restoration service. Water 2019, 11, 1591. [Google Scholar] [CrossRef] [Green Version]
- Han, Z.; Ma, D.; Hou, B.; Wang, W. Seismic resilience enhancement of urban water distribution system using restoration priority of pipeline damages. Sustainability 2020, 12, 914. [Google Scholar] [CrossRef] [Green Version]
- Kim, G.T.; Park, C.S.; Yoon, K.P. Identifying investment opportunities for advanced manufacturing systems with comparative-integrated performance measurement. Int. J. Prod. Econ. 1997, 50, 23–33. [Google Scholar] [CrossRef]
- Mukherjee, A.; Nath, P. An empirical assessment of comparative approaches to service quality measurement. J. Serv. Mark. 2005, 19, 174–184. [Google Scholar] [CrossRef]
- Ministry of Housing and Urban-Rural Development of the People’s Republic of China (MOHURD). Code for Urban Water Supply Engineering Planning (GB50282); China Architecture & Building Press: Beijing, China, 1998. [Google Scholar]
- Davis, C.A. Water system service categories, post-earthquake interaction, and restoration strategies. Earthq. Spectra 2014, 30, 1487–1509. [Google Scholar] [CrossRef]
- Ministry of Housing and Urban-Rural Development of the People’s Republic of China (MOHURD). Code for Seismic Design of Buildings (GB50011); China Architecture & Building Press: Beijing, China, 2010. [Google Scholar]
- American Society of Civil Engineering (ASCE). Minimum Design Loads and Associated Criteria for Buildings and Other Structures (ASCE/SEI 7-16); American Society of Civil Engineering: Reston, VA, USA, 2017. [Google Scholar]
- Ministry of Housing and Urban-Rural Development of the People’s Republic of China (MOHURD). Standard for Urban Planning on Earthquake Resistance and Hazardous Prevention (GB50413); China Architecture & Building Press: Beijing, China, 2007. [Google Scholar]
- Ministry of Housing and Urban-Rural Development of the People’s Republic of China (MOHURD). Code for Design of Disasters Mitigation Emergency Congregate Shelter (GB51143); China Architecture & Building Press: Beijing, China, 2015. [Google Scholar]
- Meng, F.; Fu, G.; Farmani, R.; Sweetapple, C.; Butler, D. Topological attributes of network resilience: A study in water distribution systems. Water Res. 2018, 143, 376–386. [Google Scholar] [CrossRef] [PubMed]
- Giudicianni, C.; Herrera, M.; Di Nardo, A.; Oliva, G.; Scala, A. The faster the better: On the shortest paths role for near real-time decision making of water utilities. Reliab. Eng. Syst. Saf. 2021, 212, 107589. [Google Scholar] [CrossRef]
- West, D.B. Introduction to Graph Theory; Prentice Hall: Upper Saddle River, NJ, USA, 2001. [Google Scholar]
- Torres, J.M.; Duenas-Osorio, L.; Li, Q.; Yazdani, A. Exploring topological effects on water distribution system performance using graph theory and statistical models. J. Water Resour. Plan. Manag. 2017, 143, 4016068. [Google Scholar] [CrossRef]
- Giudicianni, C.; Herrera, M.; Nardo, A.D.; Greco, R.; Creaco, E.; Scala, A. Topological placement of quality sensors in water-distribution networks without the recourse to hydraulic modeling. J. Water Resour. Plan. Manag. 2020, 146, 4020030. [Google Scholar] [CrossRef]
- Giudicianni, C.; Di Nardo, A.; Greco, R.; Scala, A. A Community-Structure-Based Method for Estimating the Fractal Dimension, and its Application to Water Networks for the Assessment of Vulnerability to Disasters. Water Resour. Manag. 2021, 35, 1197–1210. [Google Scholar] [CrossRef]
- Lee, S.; Jung, D. Shortest-path-based two-phase design model for hydraulically efficient water distribution network: Preparing for extreme changes in water availability. IEEE Access 2021, 9, 53358–53369. [Google Scholar] [CrossRef]
- Winkler, J.; Duenas-Osorio, L.; Stein, R.; Subramanian, D. Performance assessment of topologically diverse power systems subjected to hurricane events. Reliab. Eng. Syst. Saf. 2010, 95, 323–336. [Google Scholar] [CrossRef]
- Duenas-Osorio, L.; Vemuru, S.M. Cascading failures in complex infrastructure systems. Struct. Saf. 2009, 31, 157–167. [Google Scholar] [CrossRef]
- Brandes, U. A faster algorithm for betweenness centrality. J. Math. Sociol. 2001, 25, 163–177. [Google Scholar] [CrossRef]
- Wu, J.; Baker, J.W. Statistical learning techniques for the estimation of lifeline network performance and retrofit selection. Reliab. Eng. Syst. Saf. 2020, 200, 106921. [Google Scholar] [CrossRef]
- Olson, D.L. Comparison of weights in TOPSIS models. Math. Comput. Model. 2004, 40, 721–727. [Google Scholar] [CrossRef]
- Li, F.; Phoon, K.K.; Du, X.; Zhang, M. Improved AHP method and its application in risk identification. J. Constr. Eng. Manag. 2013, 139, 312–320. [Google Scholar] [CrossRef] [Green Version]
- Certa, A.; Enea, M.; Galante, G.; Lupo, T. A Multi-decision Makers Approach to Select the Maintenance Plan for a MultiComponent System. In Proceedings of the 19th ISSAT international Conference on Reliability and Quality in Design, Honolulu, HI, USA, 5–7 August 2013. [Google Scholar]
- Nojima, N. Restoration Processes of Utility Lifelines in the Great East Japan Earthquake Disaster. In Proceedings of the 15th World Conference on Earthquake Engineering (15WCEE), Lisbon, Portugal, 24–28 September 2012. [Google Scholar]
- American Lifelines Alliance (ALA). Seismic Guidelines for Water Pipelines. USA, March 2005. Available online: http://www.americanlifelinesalliance.com/pdf/SeismicGuidelines_WaterPipelines_P1.pdf (accessed on 15 October 2020).
- Jeon, S.S.; O’Rourke, T.D. Northridge earthquake effects on pipelines and residential buildings. Bull. Seismol. Soc. Am. 2005, 95, 294–318. [Google Scholar] [CrossRef]
- Isoyama, R.; Ishida, E.; Yune, K.; Shirozu, T. Seismic Damage Estimation Procedure for Water Supply Pipelines. In Proceedings of the 12th World Conference on Earthquake Engineering (WCEE), Auckland, New Zealand, 30 January–4 February 2020. [Google Scholar]
- Japan Water Works Association (JWWA). Seismic Damage Prediction of Water Supply Pipelines; Japan Water Works Association: Tokyo, Japan, 1998. [Google Scholar]
- Finnemore, J.; Franzini, J.B. Fluid Mechanics with Engineering Applications, 10th ed.; McGraw-Hill Education, McGraw-Hill Publishing Company: Boston, MA, USA, 2001. [Google Scholar]
- Rossman, L. EPANET 2.2 User Manual; United States Environmental Protection Agency: Cincinnati, OH, USA, 2020. [Google Scholar]
- Barton, N.A.; Farewell, T.S.; Hallett, S.H.; Acland, T.F. Improving pipe failure predictions: Factors affecting pipe failure in drinking water networks. Water Res. 2019, 164, 114926. [Google Scholar] [CrossRef] [PubMed]
- Wagner, J.M.; Shamir, U.; Marks, D.H. Water distribution reliability: Simulation methods. J. Water Resour. Plan. Manag. 1988, 114, 276–294. [Google Scholar] [CrossRef] [Green Version]
- Liu, Z.; Yu, H.; Yang, F. Evaluate the node importance for water network based on complex network theory. Scientia Sinica Technol. 2014, 44, 1280–1294. [Google Scholar] [CrossRef]
- China Earthquake Administration (CEA). Seismic Ground Motion Parameter Zonation Map of China; Standards Press of China: Beijing, China, 2015. [Google Scholar]
- China National Standardization Administration (CNSA). The Chinese Seismic Intensity Scale (GB/T 17742); Standards Press of China: Beijing, China, 2008. [Google Scholar]
- Liu, S.; Zheng, X. Investigation Report on Earthquake Damage and Restoration of Water Supply System in the Wenchuan Earthquake; Tongji University Press: Shanghai, China, 2013. [Google Scholar]


| Demand Categories | Disaster Rescue, I21 | Secondary Disaster Control, I22 | Seismic Shelter for Evacuation, I23 | Other Demands, I24 |
|---|---|---|---|---|
| Facility | Disaster rescue headquarters, hospitals, transportation hub, etc. | Firefighting stations, potential fire site, explosive facilities, etc. | Parks, squares, large-scale stadiums, etc. | Households, commercial and office buildings, factories, etc. |
| Land type | Land for administrative facilities, medical land, transportation land, etc. | Fire control land, fuel, and gas storage land, etc. | Green space and square, sports land, etc. | Residential, commercial, business, and industrial land, etc. |
| User Node No. | 1 | 2 | 3 | 4 | 5 | 6 |
|---|---|---|---|---|---|---|
| Shortest source distance, I31 | 1 | 1 | 2 | 3 | 2 | 3 |
| Betweenness centrality, I32 | 1.83 | 2.17 | 0.67 | 0 | 0.33 | 0 |
| Average path length influence, I33 | 0 | 1 | 0 | 0 | 0 | 0 |
| Category | Description | Correction Factor |
|---|---|---|
| Pipe Diameter (mm) Cd | 75 | 1.6 |
| 100~150 | 1.0 | |
| 200~450 | 0.8 | |
| 500~ | 0.5 | |
| Pipe Material Cp | DIP | 0.3 |
| CIP | 1.0 | |
| SP | 0.3 (0.15) | |
| ACP | 1.2 | |
| Ground Topography Cg | Disturbed Hill | 1.1 |
| Terrace | 1.5 | |
| Narrow Valley | 3.2 | |
| Alluvial | 1.0 | |
| Stiff Alluival | 0.4 | |
| Soil Liquefaction Cl | None | 1.0 |
| Partial | 2.0 | |
| Serious | 2.4 |
| Item | Parameter | Value |
|---|---|---|
| Seismic hazard intensity measure | Peak ground velocity (PGV) | 71 cm/s |
| Pressure driven analysis | Hmin Hreq | 0 m 20 m |
| Sampling No. of MCS | N | 1000 |
| Land Type | qj (1000 m3/km2.day) | αj | Land Type | qj (1000 m3/km2.day) | αj |
|---|---|---|---|---|---|
| Residential | 19 | 0.3 | Reserved space | 10 | 1.0 |
| Public service | 10 | 2.0 | Warehouse | 3.5 | 1.0 |
| Commercial | 10 | 0.3 | Municipal | 10 | 2.0 |
| Green space | 2.0 | 5.0 | Industrial | 20 | 0.3 |
| Main Indices Weight (wi) | Sub-Indices Weight (w*j) | Integrate Weight (wij) | ||
|---|---|---|---|---|
| I1 | 0.25 | I11 | 0.2819 | 0.0705 |
| I12 | 0.2000 | 0.0500 | ||
| I13 | 0.3677 | 0.0919 | ||
| I14 | 0.1504 | 0.0376 | ||
| I2 | 0.50 | I21 | 0.2819 | 0.1410 |
| I22 | 0.2000 | 0.1000 | ||
| I23 | 0.3677 | 0.1839 | ||
| I24 | 0.1504 | 0.0752 | ||
| I3 | 0.25 | I31 | 0.2599 | 0.0650 |
| I32 | 0.3275 | 0.0819 | ||
| I33 | 0.4126 | 0.1032 | ||
| Nodal Rank | 1 | 2 | 3 | 4 | 5 | 6 | 7 | 8 | 9 | 10 | |
|---|---|---|---|---|---|---|---|---|---|---|---|
| Index | I1 | 79 | 8 | 99 | 7 | 127 | 14 | 124 | 66 | 84 | 91 |
| I2 | 8 | 14 | 7 | 79 | 124 | 84 | 99 | 97 | 133 | 91 | |
| I3 | 21 | 61 | 26 | 34 | 112 | 110 | 111 | 100 | 98 | 106 | |
| Iall | 8 | 7 | 79 | 14 | 99 | 111 | 124 | 84 | 21 | 61 | |
| Classification of User Nodes | Class I | Class II | Class III | All | |
|---|---|---|---|---|---|
| Original WDS | SSIQ | 0.8180 | 0.7869 | 0.8022 | 0.8018 |
| No. of SIQ < 0.6 | 6 | 7 | 6 | 19 | |
| Renovation Scheme A Cost = 7.72 million RMB | SSIQ | 0.8411 | 0.8221 | 0.8320 | 0.8314 |
| No. of SIQ < 0.6 | 2 | 4 | 2 | 8 | |
| Nodes of SIQ < 0.6 | {88,93} | {74,87,90,94} | {77,89} | ||
| Renovation Scheme B Cost = 6.92 million RMB | SSIQ | 0.8402 | 0.8124 | 0.8195 | 0.8231 |
| No. of SIQ < 0.6 | 2 | 3 | 4 | 9 | |
| Nodes of SIQ < 0.6 | {88,93} | {73,74,94} | {48,77,78,89} | ||
| Renovation Scheme C Cost = 6.64 million RMB | SSIQ | 0.8374 | 0.8184 | 0.8235 | 0.8258 |
| No. of SIQ < 0.6 | 4 | 3 | 2 | 9 | |
| Nodes of SIQ < 0.6 | {88,93,95,97} | {87,90,94} | {77,89} | ||
Publisher’s Note: MDPI stays neutral with regard to jurisdictional claims in published maps and institutional affiliations. |
© 2021 by the authors. Licensee MDPI, Basel, Switzerland. This article is an open access article distributed under the terms and conditions of the Creative Commons Attribution (CC BY) license (https://creativecommons.org/licenses/by/4.0/).
Share and Cite
Hou, B.; Ma, X.; Diao, K.; Zhong, Z.; Wu, S. Seismic Performance Assessment of Water Distribution Systems Based on Multi-Indexed Nodal Importance. Water 2021, 13, 2362. https://doi.org/10.3390/w13172362
Hou B, Ma X, Diao K, Zhong Z, Wu S. Seismic Performance Assessment of Water Distribution Systems Based on Multi-Indexed Nodal Importance. Water. 2021; 13(17):2362. https://doi.org/10.3390/w13172362
Chicago/Turabian StyleHou, Benwei, Xitao Ma, Kegong Diao, Zilan Zhong, and Shan Wu. 2021. "Seismic Performance Assessment of Water Distribution Systems Based on Multi-Indexed Nodal Importance" Water 13, no. 17: 2362. https://doi.org/10.3390/w13172362
APA StyleHou, B., Ma, X., Diao, K., Zhong, Z., & Wu, S. (2021). Seismic Performance Assessment of Water Distribution Systems Based on Multi-Indexed Nodal Importance. Water, 13(17), 2362. https://doi.org/10.3390/w13172362