1. Introduction
Sand mining has been defined as one of the major sustainability challenges of the 21st century by the United Nations [
1]. Fluvial sands, whose textural characteristics provide the best quality source for various industries and construction, are highly sought after. The current rate of sand and gravel mining in coastal areas and rivers (~40,000 Mt yr
−1) [
2] is larger than the estimate of global fluvial sediment discharge (19,000 Mt yr
−1) [
3,
4]. With extraction exceeding natural renewal [
2], demand might outstrip supply by the mid-century [
5,
6]. Additionally, excessive fluvial sand extraction and ensuing sand starvation exacerbate rivers’ vulnerability and their channel-floodplain coupled system and deltas. For example, the decrease in sediment fluxes to the coast alters coastal morphodynamics and habitats [
7,
8].
The mining of fluvial aggregates (sand, gravel) in Southeast Asia (SE Asia) is exerting enormous pressure on the regional rivers, given regional economies and populations’ growth. Research on mining of fluvial aggregates and sediment fluxes in SE Asia has mostly focused on the Mekong River because of its strategic socio-economic and environmental role. Sand flux entering the Mekong River delta has been estimated to be far smaller than the current extraction rates (50 Mt yr
−1) [
4].
An additional problem is the proliferation of illegal mining of fluvial aggregates. By 2018, 70 countries had reported illegal fluvial sand extraction [
7]. Cambodia, Vietnam, and Indonesia are legal and illicit sand sources in the region [
7]. Sand and gravel mining is also increasing in Laos and skyrocketing in Myanmar.
For fluvial aggregates mining to be sustainable, we need to know where, for how long, and what intensity fluvial aggregates have been extracted from Southeast Asian rivers. Nevertheless, to date, the areas of Southeast Asia impacted by sand mining have not even been systematically identified, and no spatial-temporal analyses have been conducted.
Although sand mining is the most used terminology, the extraction of fluvial aggregates from large rivers can include a dominant grain size population of sand and a proportion of gravel. This article will generically refer to “sand mining”, although the concept includes the dredging and extraction of sand but also secondarily gravel from large river’s beds such as the Ayeyarwady River (also known as Irrawaddy River).
Remote sensing methods are useful tools because they allow monitoring sand extraction on large scales and in areas that are hard to access in time and space. To date, India is the only country in Asia to have implemented a national remote sensing-based Mining Surveillance System (MSS) to monitor illegal mining activities. However, the Indian MSS system does not identify or monitor sand barges dredging fluvial beds, which are the primary means of sand extraction and the cause of environmental concern in Southeast Asian rivers. But sand extraction takes a large diversity of forms and occurs in a variety of physical contexts. Thus, implementing a field-calibrated remote sensing monitoring system capable of detecting, at a high resolution, mining activities in fluvial channels and barges extracting sand from rivers and lakes is crucial for tackling this problem.
Herein, we present a methodology for a high-resolution regional multitemporal assessment of sand mining activities in fluvial systems. We tested the Ayeyarwady River’s surveillance system, the second largest river in Southeast Asia after the Mekong River but though one of the unknown sand mining hotspots in the region, with very few mentions of the sand/gravel extractions in the literature. The choice of the Ayeyarwady River was not arbitrary, as multiple factors make the river a priority for environmental research. It is the fluvial artery that concentrates the majority of the population and GDP of Myanmar, and it is vulnerable to human-made environmental pressure such as mining, dredging, deforestation, and damming. It is also a top priority among the world’s transboundary river basins due to risks related to hydro-political tensions and the lack of water governance at a national level [
9].
2. Fluvial Aggregates Extraction in Myanmar and the Ayeyarwady River
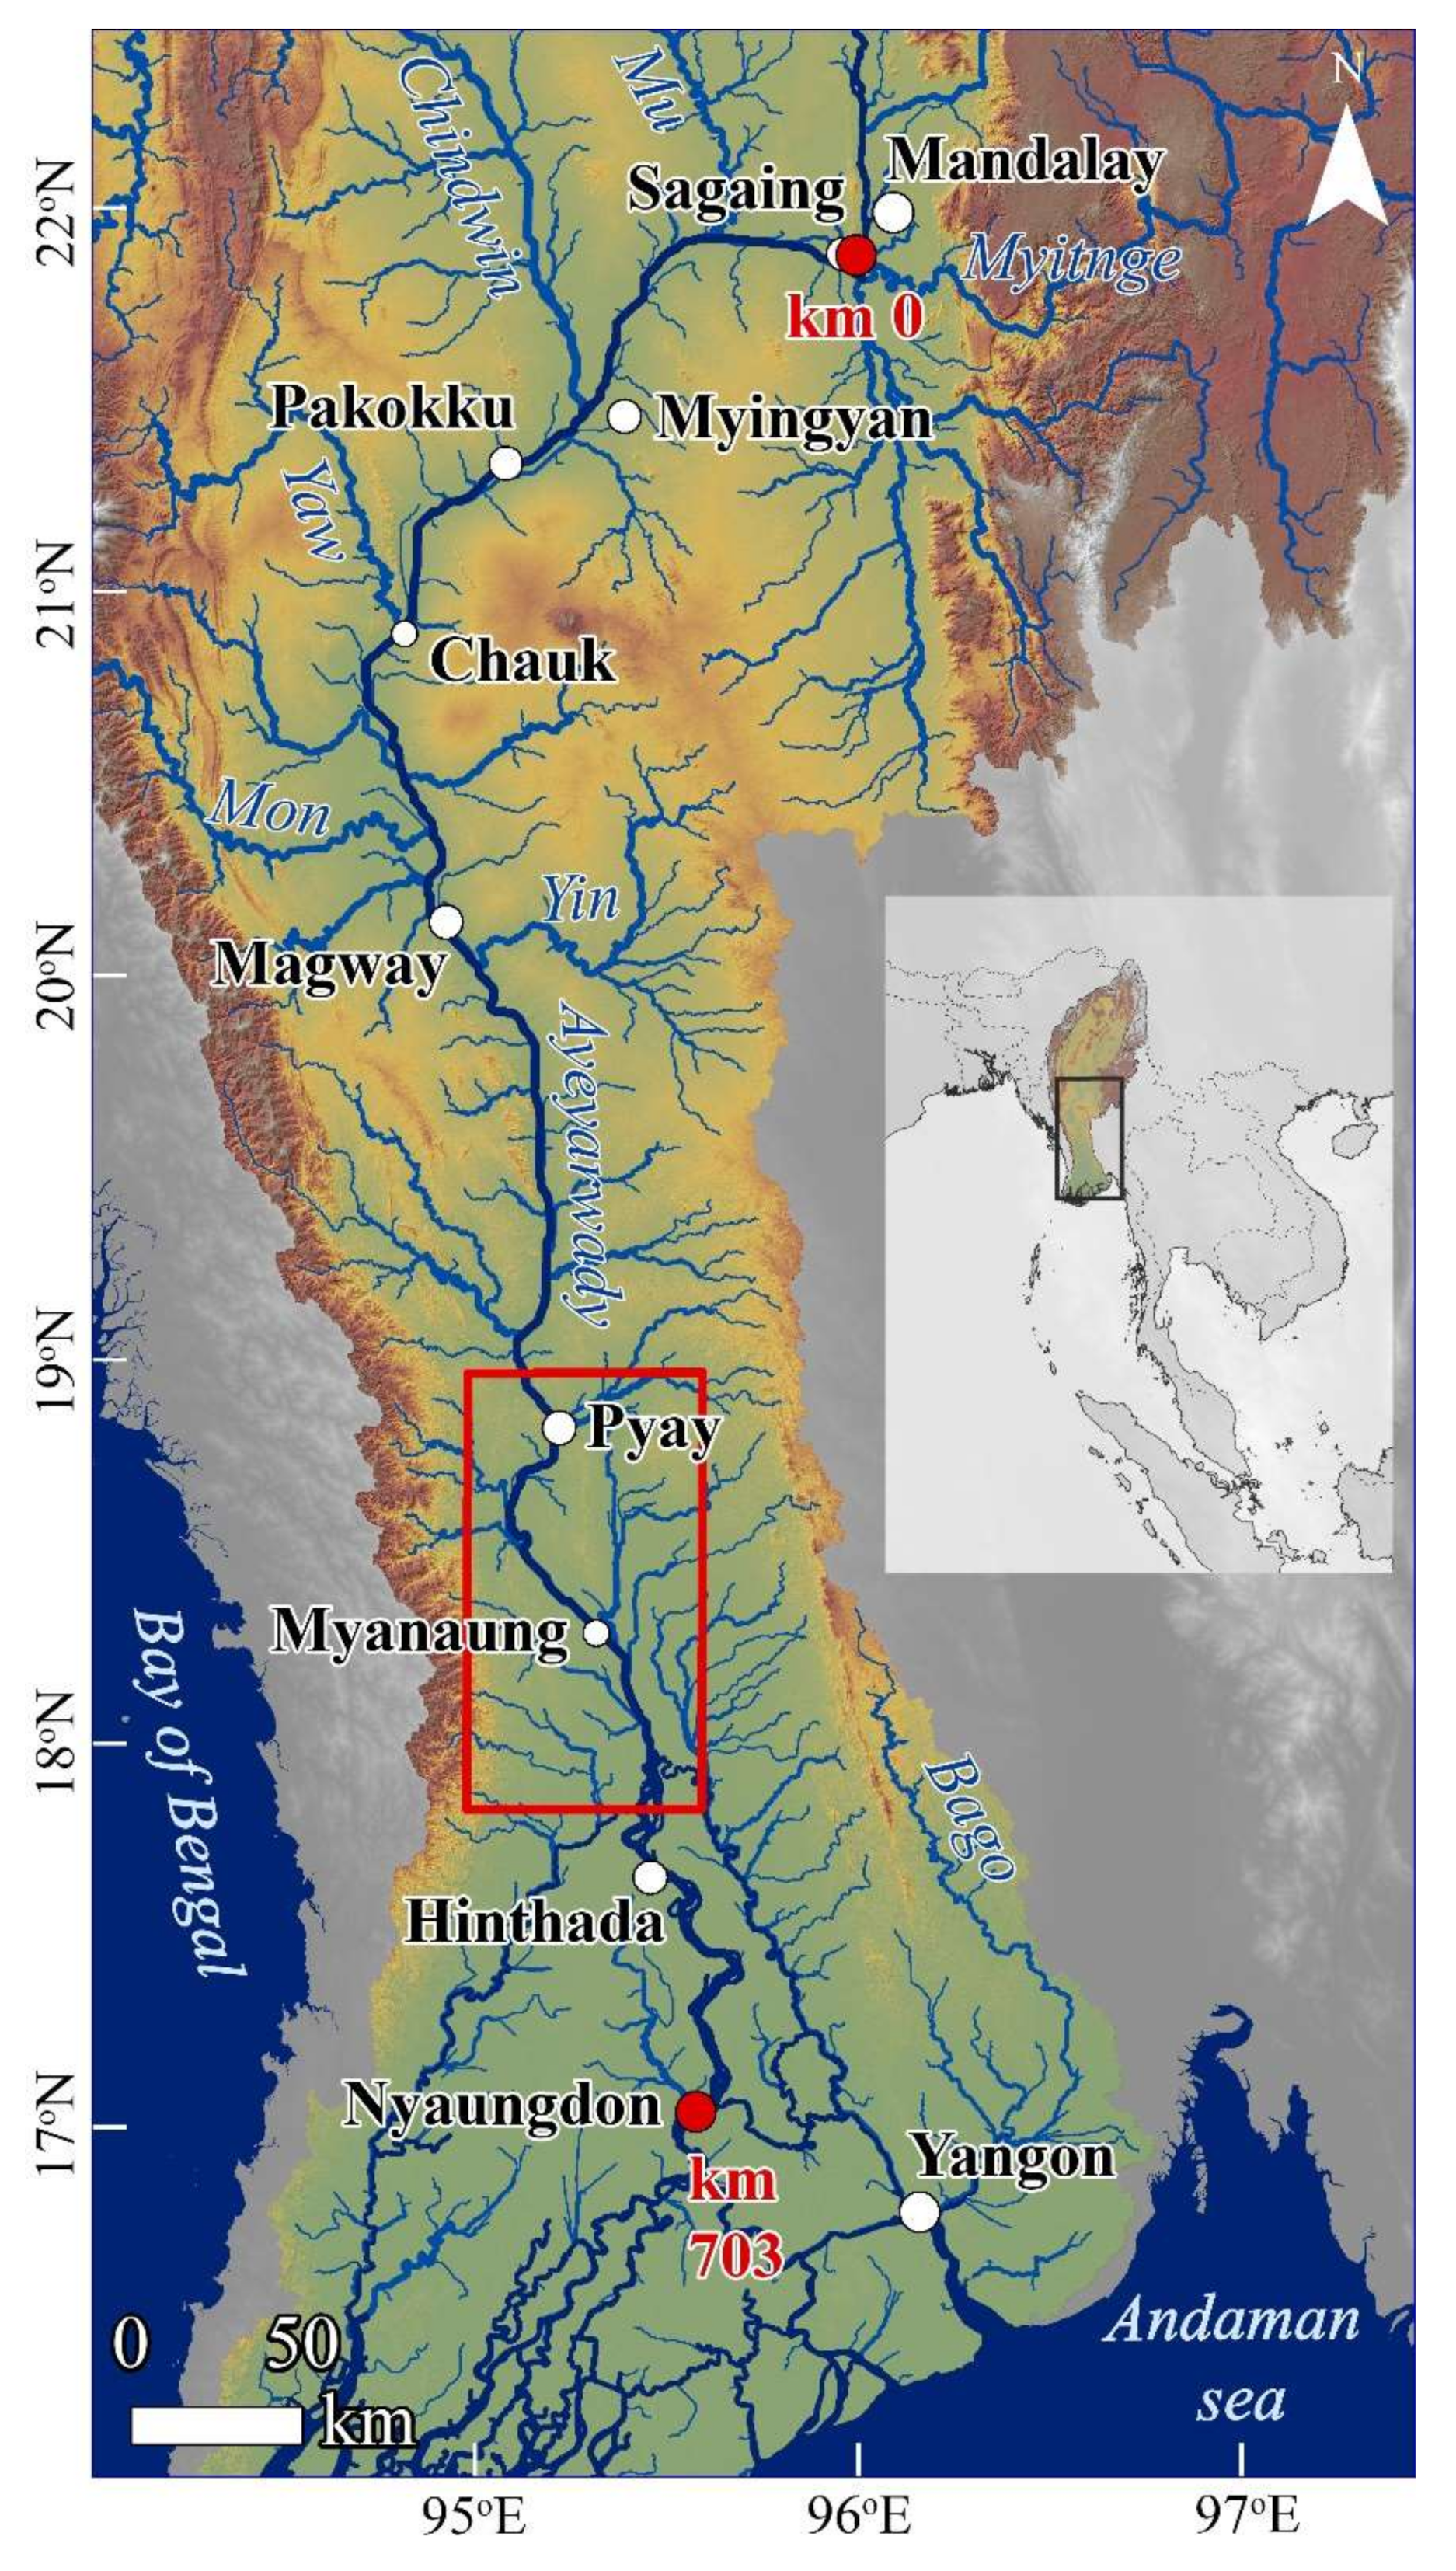
The Ayeyarwady River stretches for about 2100 km from the Himalayan mountains to the Andaman Sea. The basin drains an area of about 418,000 km
2, with 91% of the basin located in Myanmar, and 9% is shared with India (Manipur-Nagaland) and China (Yunnan-Xizang) [
10] (
Figure 1). With a mean annual discharge of ~11,600 m
3s
−1, the Ayeyarwady River is the second largest river in SE Asia after the Mekong River in water discharge, and the second or third largest global contributor of wash load to the Oceans [
11]. The hydrological regime is monsoonal with floods during the northern hemisphere summer (June–September) and a marked dry season and lower flows in winter (January–March). The discharge reaches an average wet-season maximum of 3.9 × 10
4 m
3 s
−1. Because of the high seasonality, the mean monthly discharge in August is on average 10 times higher than the discharge in February [
11].
The Ayeyarwady River delta is still one of the most pristine in the world, but it is experiencing increasing human-environmental pressure and degradation [
12,
13], and the system is considered the last largest river of SE Asia to flow relatively freely [
11].
Downstream Mandalay, the river alternates anabranching-multichannel alluvial reaches with geologically constrained (nodal zones) segments that are dominated by single-channel patterns. The anabranching reaches are characterized by large fluvial bars and islands. The sediment load of the Ayeyarwady River is still not well quantified. While the suspended load could reach 364 Mt y
−1 [
14], and the wash load was estimated in 144 Mt y
−1 [
11], the bedload transport of the Ayeyarwady River, the main source of the fluvial aggregates extracted by dredging, has not been systematically assessed. High erosion rates of ~1700 t km
−2y
−1 in the Chindwin River basin, draining the Indo-Burmese range, and ~1000 t km
−2 y
−1 mainly sourced by erosion of weather gneiss and plutonic rocks in the Upper Ayeyarwady are the main sources of the sediment load (
Figure 1) [
11,
15].
Because of the size of the river, the monsoonal hydrological regime, and the geomorphologic style of the channel, which is characterized by large and dynamic fluvial bars, it is assumed that the sandy load could represent a significant proportion of the total sediment load. Still, it has yet to be thoroughly quantified.
Sand and gravel in Myanmar are considered natural resources owned by the state. Under Article 37 of Myanmar’s 2008 constitution, the Union is the ultimate owner of all lands and natural resources above and below the ground, above and beneath the water, and in the atmosphere. The sand mining industry is regulated through licensing, which is linked to specific tracts within the river. The location of tracks is delineated by geographic coordinates, and the regulation could include limits on the volume of material that can be extracted [
16]. Part of the fluvial aggregates is used for local consumption or large government infrastructure projects, and part is exported [
16].
In Myanmar, sand mining management is regulated under the 2006 Conservation of Water Resources and Rivers Law. Operations extracting above 50,000 m
3 have to be assessed for their environmental impact [
17].
However, before 2015 there was no limit on the number of suds (about 2.83 m
3) that could be extracted from the rivers. Since then, two factors have been considered for licenses applications: first, the suitability of the area has to be assessed by the Directorate of Water Resources and Improvement of Rivers (DWIR); second, the boat size each company can operate cannot exceed two boats with a maximum capacity of 30 suds (85 m
3) each [
17].
Fluvial aggregates (sand and gravel) are mined in Myanmar both during the day and at night [
17] using various extraction techniques. For example, mixed grain size aggregates are directly excavated from the sand bars during the dry season and stocked on temporary storage-piles, nearby the banks. But the main technique of aggregates mining on the Ayeyarwady River is managed by direct dredging of the river bed using mobile floating structures organized in clusters of dredgers, pushers, and barges. The dredgers extract the aggregates by suction throughout a pipe, sort them, and transfer them to the barges using water as fluid. The barges have variable storage capacity and are moved by pusher boats that can drive one or two attached barges simultaneously toward the main towns or Yangon [
16].
3. Data and Methods: Sand Mining Monitoring System
A challenge when monitoring fluvial sand mining is that because the extraction concentrates underwater, the surface scars or other visible features used for remote sensing mining-detection of surface mining are not present, boats and barges have to be targeted as indicators of the activity. Furthermore, sand barges’ location shifts in time along and across the rivers, once sand supply has been exhausted in a particular reach or once the river shifts and generates new sandy areas. Additionally, adding more complexity, the dynamic character of fluvial mining the diversity of these combined structures (clusterization of barge, dredge, and pusher), make in some cases challenging to identify and characterize a specific remote sensing signature. To tackle the problem, we have implemented a module for sand mining that could efficiently monitor dredging barges along rivers. Similar systems, using radars, have been used to detect ships in areas where fishing is illegal [
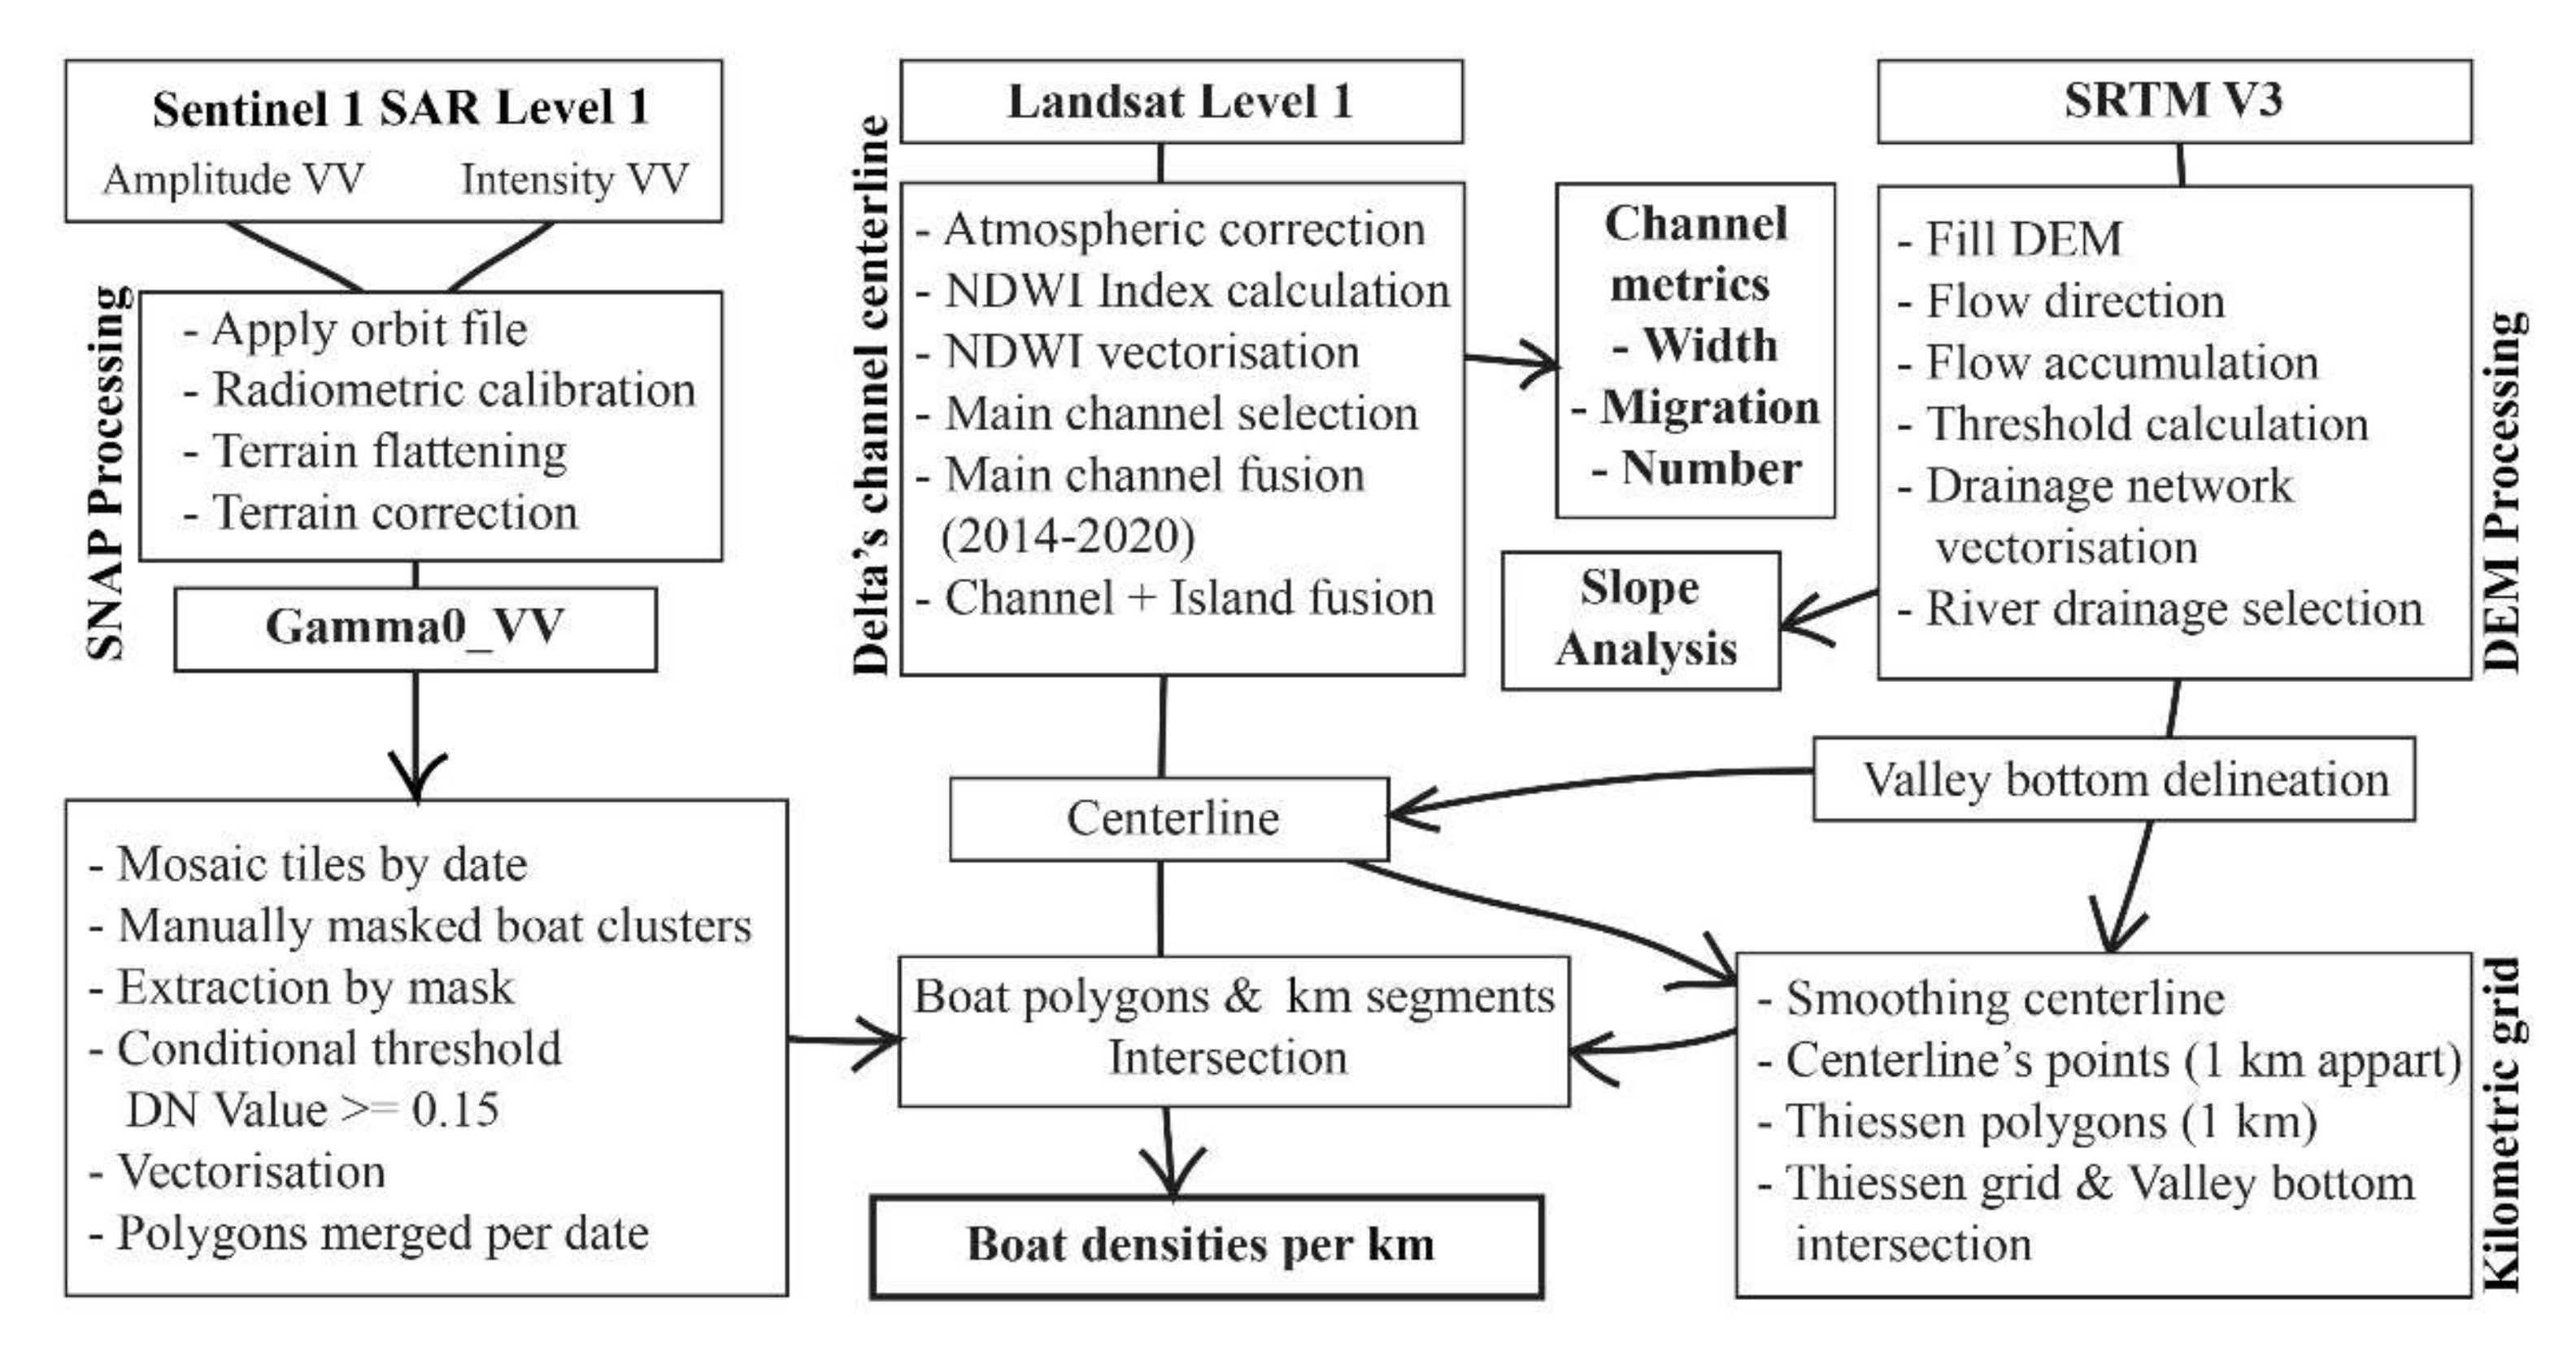
18]. The methodological procedures are synthesized in
Figure 2.
3.1. Imagery Selection
The primary objective was to identify barges effectively throughout the year, regardless of weather constraints such as cloud cover, which substantially limits the use of optical imagery in the tropics, and second, to devise a system that makes use of free imagery. Costly imagery could make the system difficult or even impossible to use in developing countries, where a substantial portion of sand mining from river-beds occurs. To set up the surveillance system, we opted for the Sentinel-1 mission, a radar component of the Copernicus joint initiative of the European Commission (EC) and the European Space Agency (ESA).
We downloaded a total of 500 Ground Range Detected High Resolution (GRD-HR) Sentinel 1 high-resolution products (five tiles by date) available every 12 days between 25 February 2017, and 21 June 2020, from the Copernicus Open Access Hub (
https://scihub.copernicus.eu/dhus/#/home) (accessed on 19 August 2021). This dataset corresponds to a total of 102 days i.e., 26 dates in 2017, 31 in 2018, 30 in 2019, and 15 in 2020.
Sentinel-1A satellite was launched on 3 April 2014 and the Synthetic Aperture Radar (SAR) free-of-charge has the advantage to be suitable for ship detection, and their resolution is constant, regardless of the distance from the observed targets [
19,
20]. Sentinel 1 provides a 12-day (ground track) repeated cycle, acquired in Interferometric Wide swath (IW) mode and a 6-day (ground track) repeat cycle for two satellites, with a 250-km swath, a 20 × 20 m spatial resolution, and burst synchronization for interferometry. The incidence angle variation across the swath is between 29.1° and 46.0°. We have chosen the ground range detected (GRD) product processed at Level 1 at high resolution in the ascending orbit because the time visit occurs more often yearlong after the sunset (explanation in “Time Series”).
On the other side, Sentinel 2 optical imagery has a 10-m resolution. They provide more details of objects and a large range of spectral bands than Sentinel 1, notably during the detection and recognition of boats (the distinction between barges and dredgers and the numbers of barges coupled). Unfortunately, the image quality is dependent on the sun elevation angle, the atmospheric conditions, and cloud cover, which is significantly dense in many places of Southeast Asia, where sand mining occurs.
The Sentinel-1 SAR is available in the C band (5.404 GHz central frequency, 5.6 cm of wavelength), and is provided at a single or dual-polarization. Radars equipped with C-band are generally not hindered by atmospheric effects and image through tropical clouds and rain showers. The penetration capability concerning vegetation canopies or soils is limited, restricted to the top layers (sources ESA). On the water bodies, the contrast between the low backscatering of the water and the high signal from the complex and angular structures of the boats, enables a high detection capability of vessels. Because of our small object scale and the 20 m resolution of the radar, the goal was to maximize our detection capabilities and avoid information loss (ex. small boats like dredges). Herein, we pre-processed these images using the ESA Sentinel Applications Platform (SNAP) with radiometric and geometric calibration using SRTM, removing the thermal noise, and georeferenced them into WGS84. Because of the small ship size we targeted and their proximity to each other, we did not apply a speckle filter and multilooking. Instead, after visual inspection and simulations, we applied a minimal threshold of 0.15 γand convertion into a binary raster. After testing different conditions, we selected the Vertical transmission and reception (VV) co-polarization instead of a cross-polarization Vertical transmission Horizontal reception (VH) because of the sharpest signal contrast between the boat and the water. The calibrated backscatter coefficient varies with the incidence angle and polarisation. The incidence angle mainly influences the geometry of vessels in SAR images, and co-polarization generally has a higher value than cross-polarization [
20].
Complementary, SRTM, and Landsat images collected from the US Geological Survey (USGS) (
https://earthexplorer.usgs.gov) (accessed on 19 August 2021) were used for geomorphological mapping. Six Landsat tiles by year using green and infrared bands for the NDWI Index were necessary to cover the studied area.
3.2. Boat Types and Detection
The first objective of the system was to set up a method for ship detection. SAR images are commonly used for ship detection on the ocean, and conventional methods generally utilize a constant false alarm detection (CFAR) technique, such as CA-CFAR, OS-CFAR [
20]. Ships are mostly made of metallic materials, and they usually have large hulls containing a lot of dihedral and trihedral structures. When detected, ships appear as bright regions in SAR images [
20], mainly due to the double reflection of the radar pulses emitted by the sensors [
20,
21]. The incidence angle is primarily influenced by the geometry of ships in SAR-C images.
The main difficulty encountered on the ocean is related to the texture of the waves, which decreases the contrast between the high backscattering of the ships and the specular reflection of the water body. The high wave rugosity reduces the specular reflection and increases the backscattering. Therefore, it is relatively simple to detect ships at high incidence angles and low wind speeds. Both factors influence the sigma 0 value contrast between the water and the ship [
20]. These methods also give the possibility for automatic classifications and measurements to know the size and the surface of the boats.
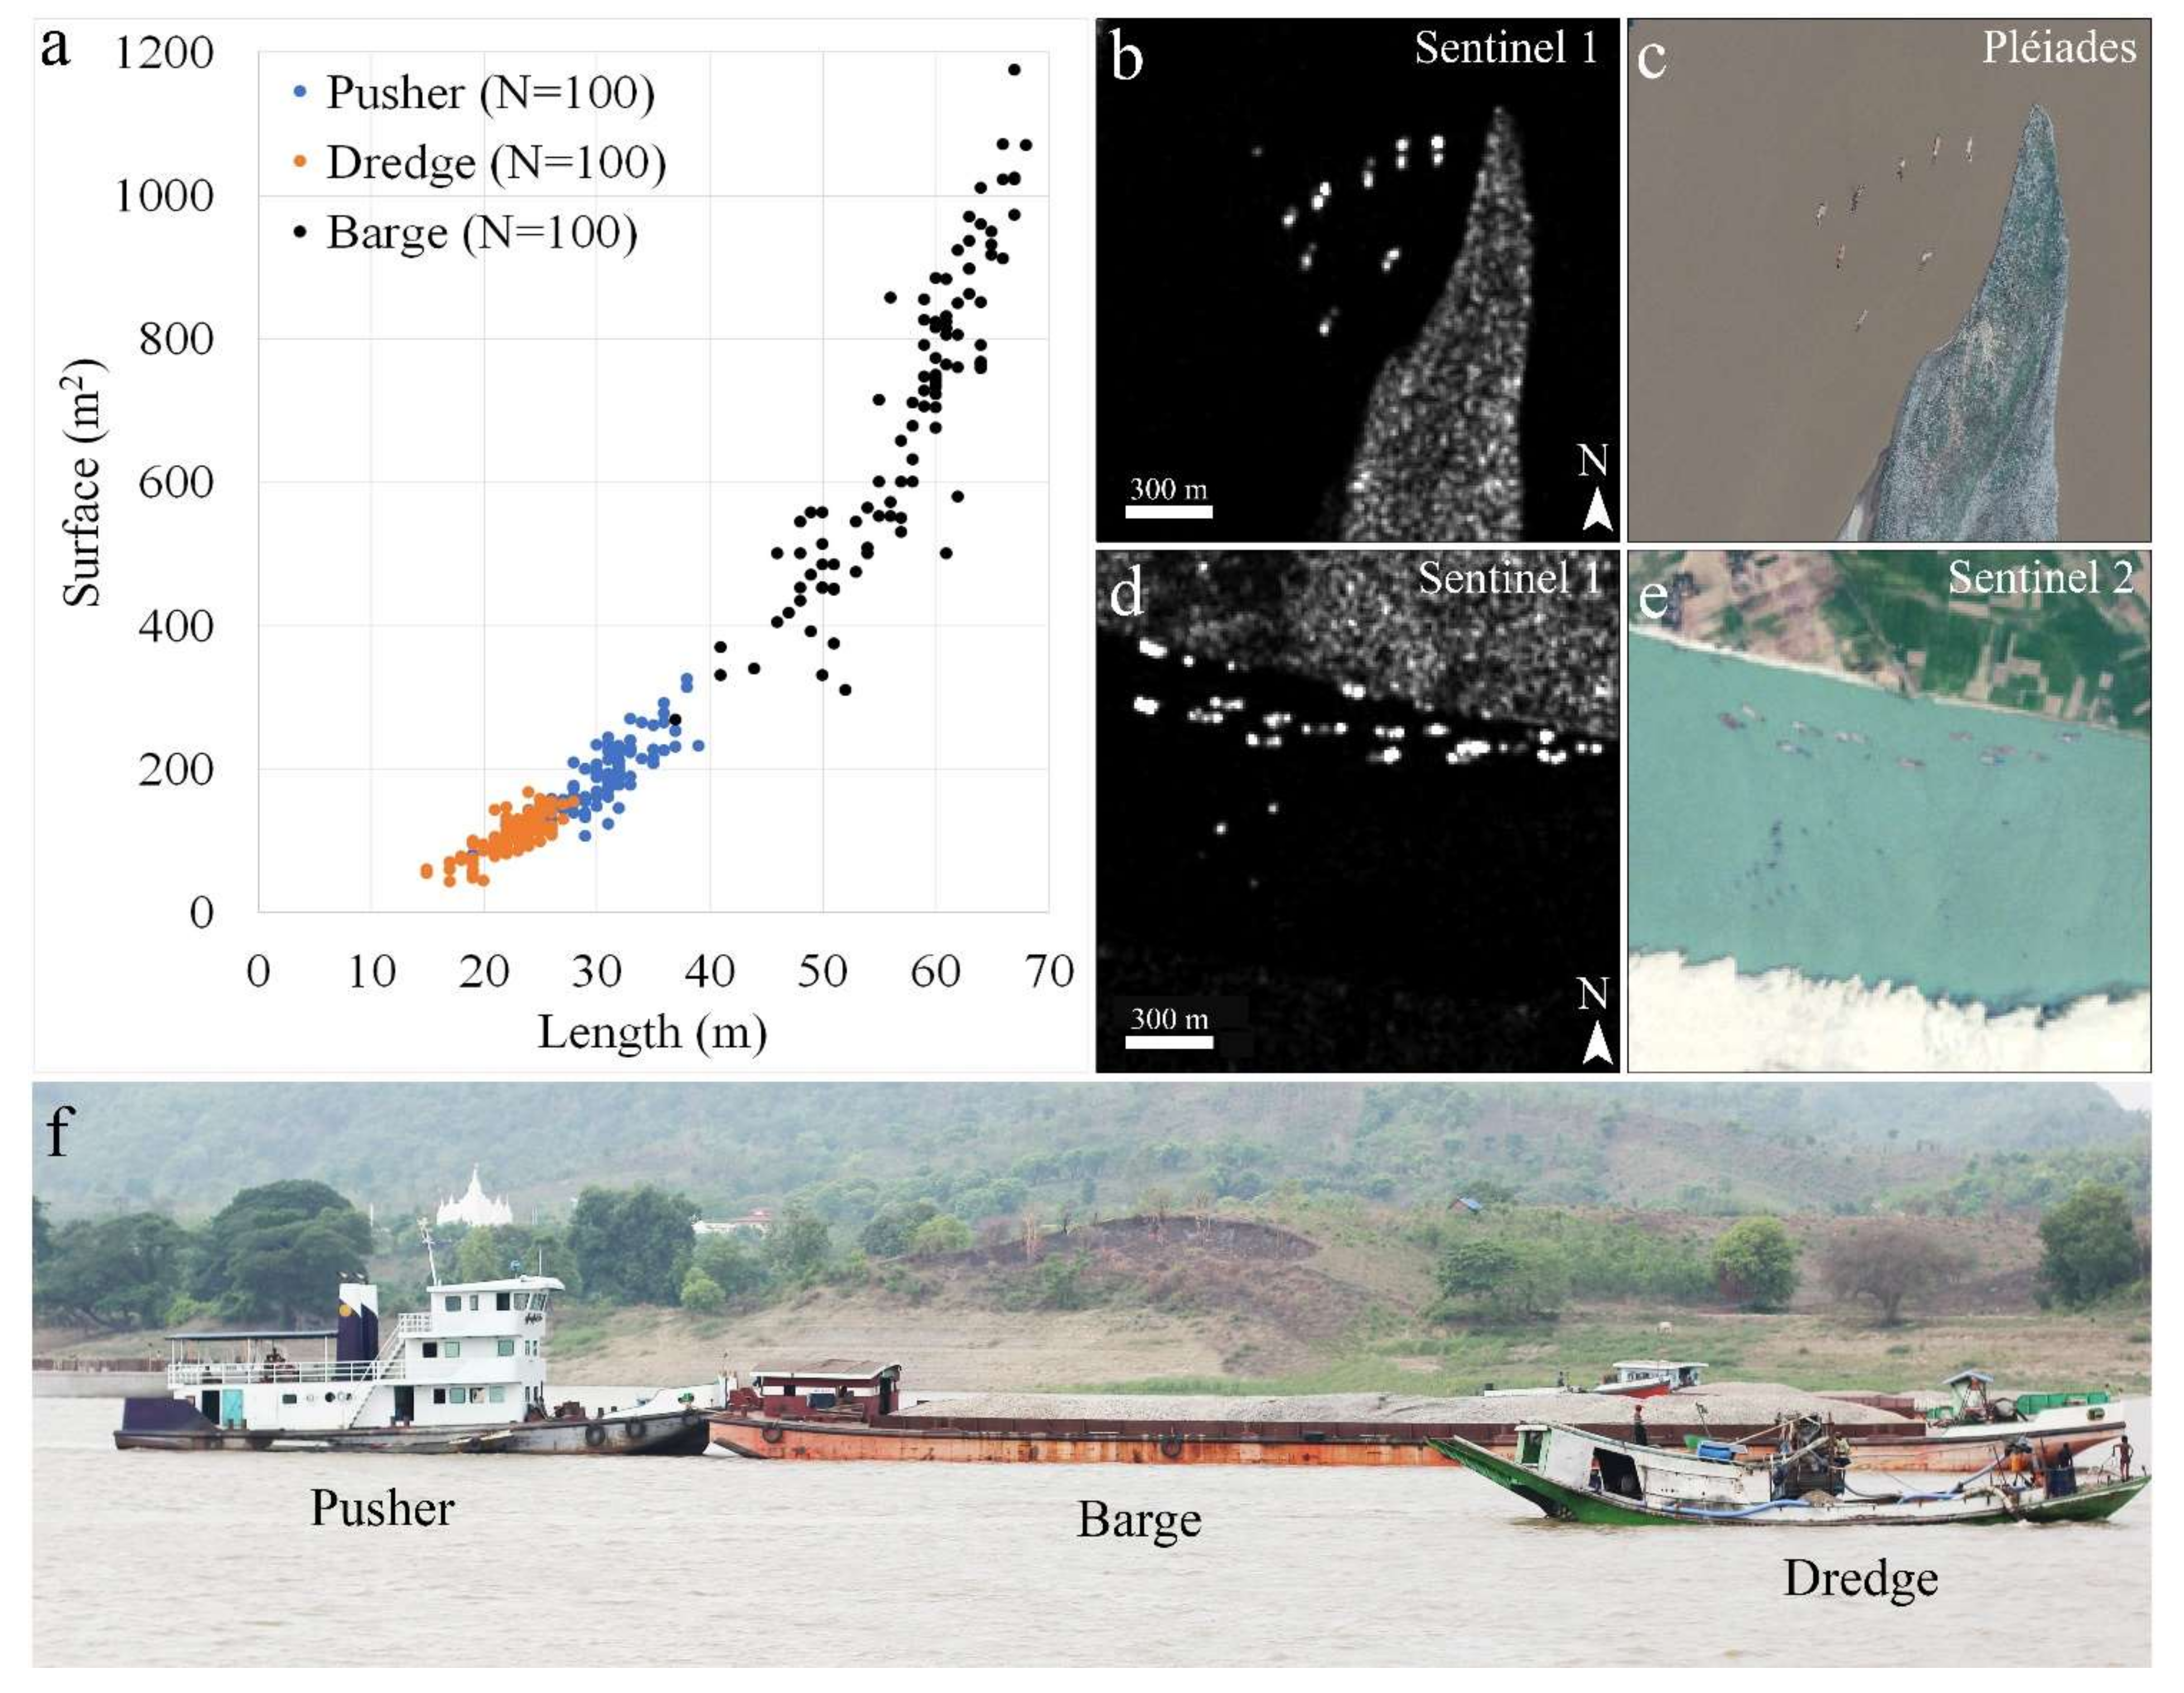
Applying the same method to detect vessels on rivers like the Ayeyarwady may seem less effective because river barges are smaller, ranging from 40 to 70 m in length and having 400–1200 m
2 of surface area (
Figure 3). Also, the mean river channel width is about 1 km during the dry season. However, the fluvial scale and dynamics reduce wave roughness and size, and increase the specular reflection when the surface fluctuation is less than the microwave wavelength (5.6 cm). Under these conditions, the river surface is considered smooth, and radar backscatter appears as a homogeneous background in a SAR image [
22], which is particularly advantageous for boat detection on large rivers such as the Ayeyarwady. Of course, limitations still exist. For example, the variety of sizes and types of the river vessels mining the channel or harboring precludes distinguishes between one or multiple vessels. It applies particularly to dredgers, which can be detected only in a cluster. To tackle this limitation, we account for the boat’s backscattering surface as a measure itself, understanding that this measure is also dependent on the position of the boat in relation to the satellite angle or the material stored on the deck. However, our goal is not to calculate the exact boat surface but to devise a standardized and reproducible method of detecting vessels on a multi-temporal scale in large tracts of this complex multi-channel river. Since the water body and sand-bars have flat and smooth surfaces and a high specular reflection in band C, the probability of reliably detecting and distinguishing the studied objects (boats) from other objects such as structures on the riverboats anchored to sand bars is also low. Therefore, we have used a Sentinel-2 optical image for each year to ascertain the central channel location during the dry season.
We focused our analysis by filtering the boats located in the mid-channel, as they are detached from the bank and thus identifiable. Barges for transporting goods were distinguished and filtered from sand-mining barges based on sand mining daily activity and based on the mid-channel working or berthing location during the night. As mentioned above, three kinds of vessels are used for sand mining: dredgers, barges, and pushers (
Figure 3). The dredgers typically range from 15 to 28 m in length (23 m on average). According to a 2017 survey [
16], there are three main classes of dredgers with different storage capacities for sand and gravel extraction. Small dredgers can store from 0.5 to 18 suds, medium-sized dredgers from 20 to 29 suds, and the largest ones can reach up to 30 suds (1 sud = 2.83 m
3).
The comparison between Sentinel-1 SAR (10-m resolution) and Pléiades images (0.5-m resolution) taken on the same day and for boats at the same location shows that Sentinel-1 cannot detect solitary dredgers (which are the core of sand mining activity), and a minimum of three dredgers together is required for the sensor to detect them. The barges can also differ in backscattering power, which is influenced by their size, orientation concerning the satellite swath axis, and the materials stocked on the platform, which either smoothen the surface or increase rugosity. Barge-pusher couples seem to be frequently characterized by two strong (peanut-shaped) backscatter signals (
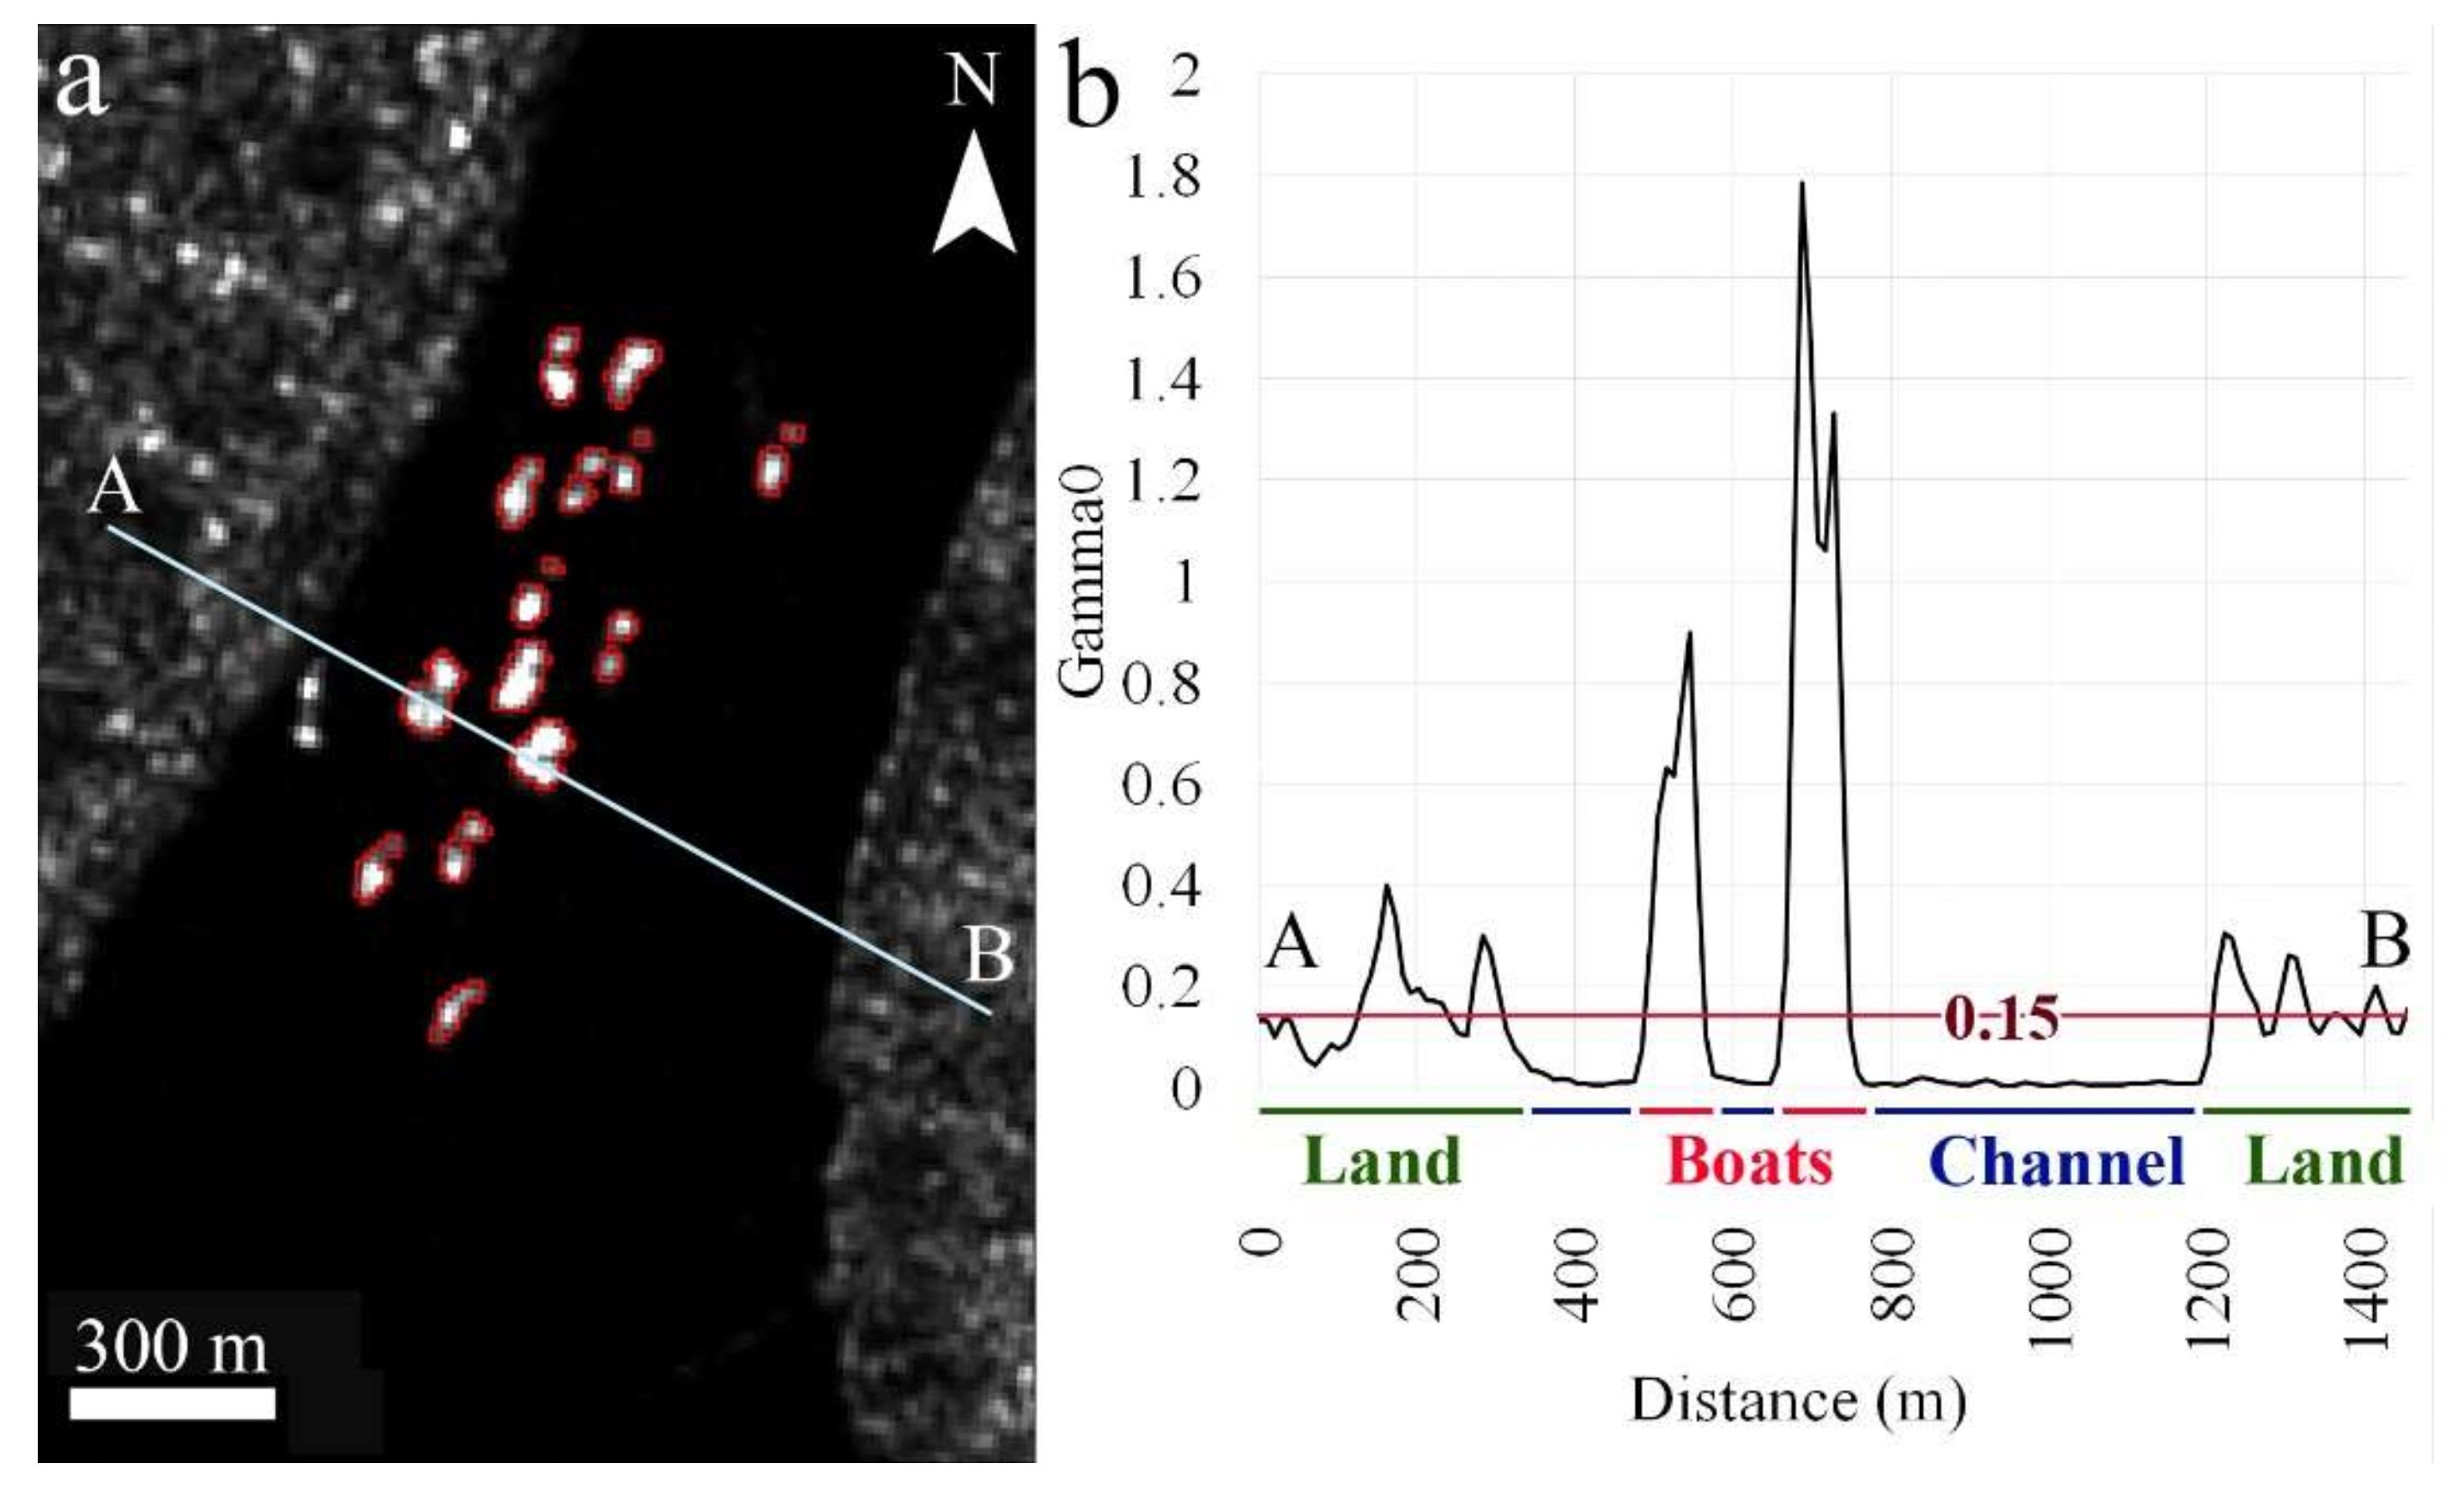
Figure 3b,d), with the first signal from the pusher boat and the second for the barge’s bow. There is a weaker backscattering signal from the flat or smooth central part between these extremities, where sand is stored on the flatboat surface. Due to the sharper contrast in the signal between the boats and the water background (
Figure 3b,d and
Figure 4), we selected vertical polarisation (Gamma VV), rather than vertical and horizontal (Gamma VH). After testing different situations to distinguish the boats from the water without losing the low values (i.e., dredges), we defined the DN value 0.15 as a threshold (
Figure 2 and
Figure 4).
Compared to other monitoring systems on lakes or oceans, the remarkable variability of the fluvial water extension (vertically and laterally) in a shifting river prevents using a single automatically-derived water mask (for automated detection of boats). For that, we delineated manually and extracted by mask each individual or clustered ships before processing the monitoring system.
3.3. Time Series
Two satellites’ orbit swaths (ascending and descending) are available for the whole length of 703 km, with a visit every 12 days for each orbit. The data allows for synchronic results of the boat activity. However, we selected only the ascending orbit since this satellite track enables imaging of the studied area around 6:15 p.m. (Myanmar time). On this orbit, the satellite reaches the latitude of Mandalay (21°58′ N), the northernmost point of the studied area, after the sunset during 192 days in a year (from 7 September to 18 March), and the southernmost point of the studied area, Nyaugdone (17°03′ N), during 184 days (from 6 September to 9 March). In contrast, in the descending orbit, the satellite images the area around 6.02 a.m., reaching Mandalay (21°58′ N) before the sunrise during 163 days (from 16 October to 28 March), and Nyaugdone (17°03′ N) during 158 days (from 24 October to 31 March).
The selection of the ascending orbit is based on the following rationale. According to the literature [
7,
17] and field observations, sand mining boats are active day and night or barges storing the mined sand also use to stay anchored in the middle of the channel during the night. In contrast, boats for goods transport are typically anchored in harbors during the night to avoid hazardous navigation. Indeed, the later the image could be taken, the better it could filter and discriminate the sand mining boats from vessels for transport.
Thus, following the sunset and hours of darkness, we selected the ascending satellite orbits. Note that the images are taken from the ascending orbit in the daylight (before the sunset) around 6:15 p.m. (between 9 March and 7 September), which corresponds partly to the rainy season when the boat activity is supposed to be lower.
Our monitoring spans four full calendar years and three full hydrological-mining years (HMY), from 25 February 2017 to 2020, with a complete and regular cover every 12 days. Beyond the selected time series used to set up and test the system, the surveillance system has been implemented to monitor continuously.
3.4. Georeferencing of Detected Boats in a Temporally Mobile Alluvial Channel
Like many other large rivers in the world, the Ayeyarwaddy River is, morphogenetically, a mobile system. Thus, systematic multi-temporal monitoring of boats in a dynamic fluvial system faces additional challenges because the river changes in planform through lateral shifting and the generation of new fluvial landforms such as branches, islands, and bars. For that reason, it was not possible to develop a simplified automatic detection system by using a standardized and fixed water mask. The high rate of lateral mobility of the Ayeyarwady River at a multi-year and even monthly scale, and the need to compare and normalize the data of occurrence of boats and longitudinal locations, demanded the development and implementation of a kilometer grid breakdown to locate boats as related to the changing morphology of the river. Thus, we created a Thiessen polygons grid following the axis (centreline) of the valley bottom (structural constraint and old terraces) delineation to have a stable referenced geospatial base for studying the whole length and width river changes over time. In our case, the period spans from 1988 (first Landsat images available) to undetermined future years ahead.
The valley was delineated with the Valley bottom tool of the Fluvial corridors toolbox [
23] on ArcGIS
®®®. It was applied to the Ayeyarwady River and its delta using both the river stream and the SRTM DEM (30 m of spatial resolution). The geomorphological characteristics of the valley and maximum flood extent were assessed from S1 C-SAR images during the peak floods of 2015, 2018, and 2019. The river water body from 1988 to 2020 was used to control the lateral mobility, and manual adjustments were also made where the active channel was close to steep slopes and on the narrow stream in rocky controlled nodal reaches. Furthermore, an additional positive 50 m-wide buffer was created around the floodplain boundaries to ensure that the water surface in the narrow zones would be inside these limits.
Because the Thiessen polygon required a defined axis, a centreline was first designed manually along the previously delineated valley bottom and extracted as a frame for determining it. It provides coherence for the river stream multi-year channel delineation. A smoothing tool was used for sharp angles among fluvial reaches, decreasing artifacts of the Thiessen polygons angles to maintain better consistency for multi-temporal comparisons. The grid extends from the Sagaing bridge and was numbered by kilometers, from upstream (km 1) to downstream (Nyaungdon bridge, km 703).
Regarding the procedures described in
Section 3.1 and
Section 3.2, Sentinel 1 Ground Range Detected (level 1) data were first processed using the Sentinel Application Platform (SNAP). The Sentinel 1 dual polarisation VV both Intensity and Amplitude in high resolution, IW mode, were geometrically corrected using SRTM 30 m (1 Arc sec) Digital Elevation Model and projected in the 46N UTM zone. The data were corrected for near-far range incidence angle variations and are thus given as Gamma0 (γ) values.
Because the main objective is the surveillance of sand mining in almost real-time, after obtaining the Gamma0_VV images corrected from the SNAP (
Figure 2), the five tiles covering the studied area were merged by date. Using the image’s displayed in standard deviation, boats (single or clusters) detached from the bank were delineated with polygons and the polygons combined by date. The polygon delineations were used as a mask to extract the boats from the Gamma0_VV raster mosaic image to isolate the boat backscatter from any other objects. Using the conditional tool, we excluded the values below the DN 0.15 γo threshold. The remaining cells corresponding to the boat backscattering were vectorized and then merged by date. To cross the boat entities with their kilometric locations, we intersected the vectorized boats with the kilometric grid. The surface calculation in square meters by kilometric polygon was calculated and exported as a table.
5. Concluding Remarks
A global program for detection and monitoring of sand mining has been regarded as crucial for quantifying the location and extent of sediment mining and the natural variations in sand flux in the world’s rivers [
1,
6,
7,
24].
Thus, our outcomes are relevant for both efforts: (a) the design and implementation of a field-calibrated remote sensing detection and monitoring system of sand mining that can be applied worldwide; (b) specifically for Myanmar, where access to data and field works is difficult, the monitoring and information we developed allow to understand the spatial-temporal distribution and level of intensity of sand mining in the Ayeyarwady River, a strategic fluvial basin in Southeast Asia. Sand mining in the Ayeyarwady River requires close monitoring as excessive sand extraction can affect the morphodynamic balance, the sediment budgets of the fluvial belt, and negatively impacts the supply of sediments to the delta.
Our monitoring system demonstrates to be capable of detecting sand mining locations on large rivers and cloudy tropical areas in almost real-time, accurately, and free of charge, making it accessible to a range of users, decision-makers, and stakeholders such as government agencies, environmental organizations, NGOs and local communities.


