4.1. Factors Controlling Nitrogen Fluxes
Estuarine ecosystems function as a source, sink, or transformer of nitrogen depending on the relative rates of biological, chemical, and physical processes involving nitrogen transformations in subtidal and intertidal habitats [
49,
50,
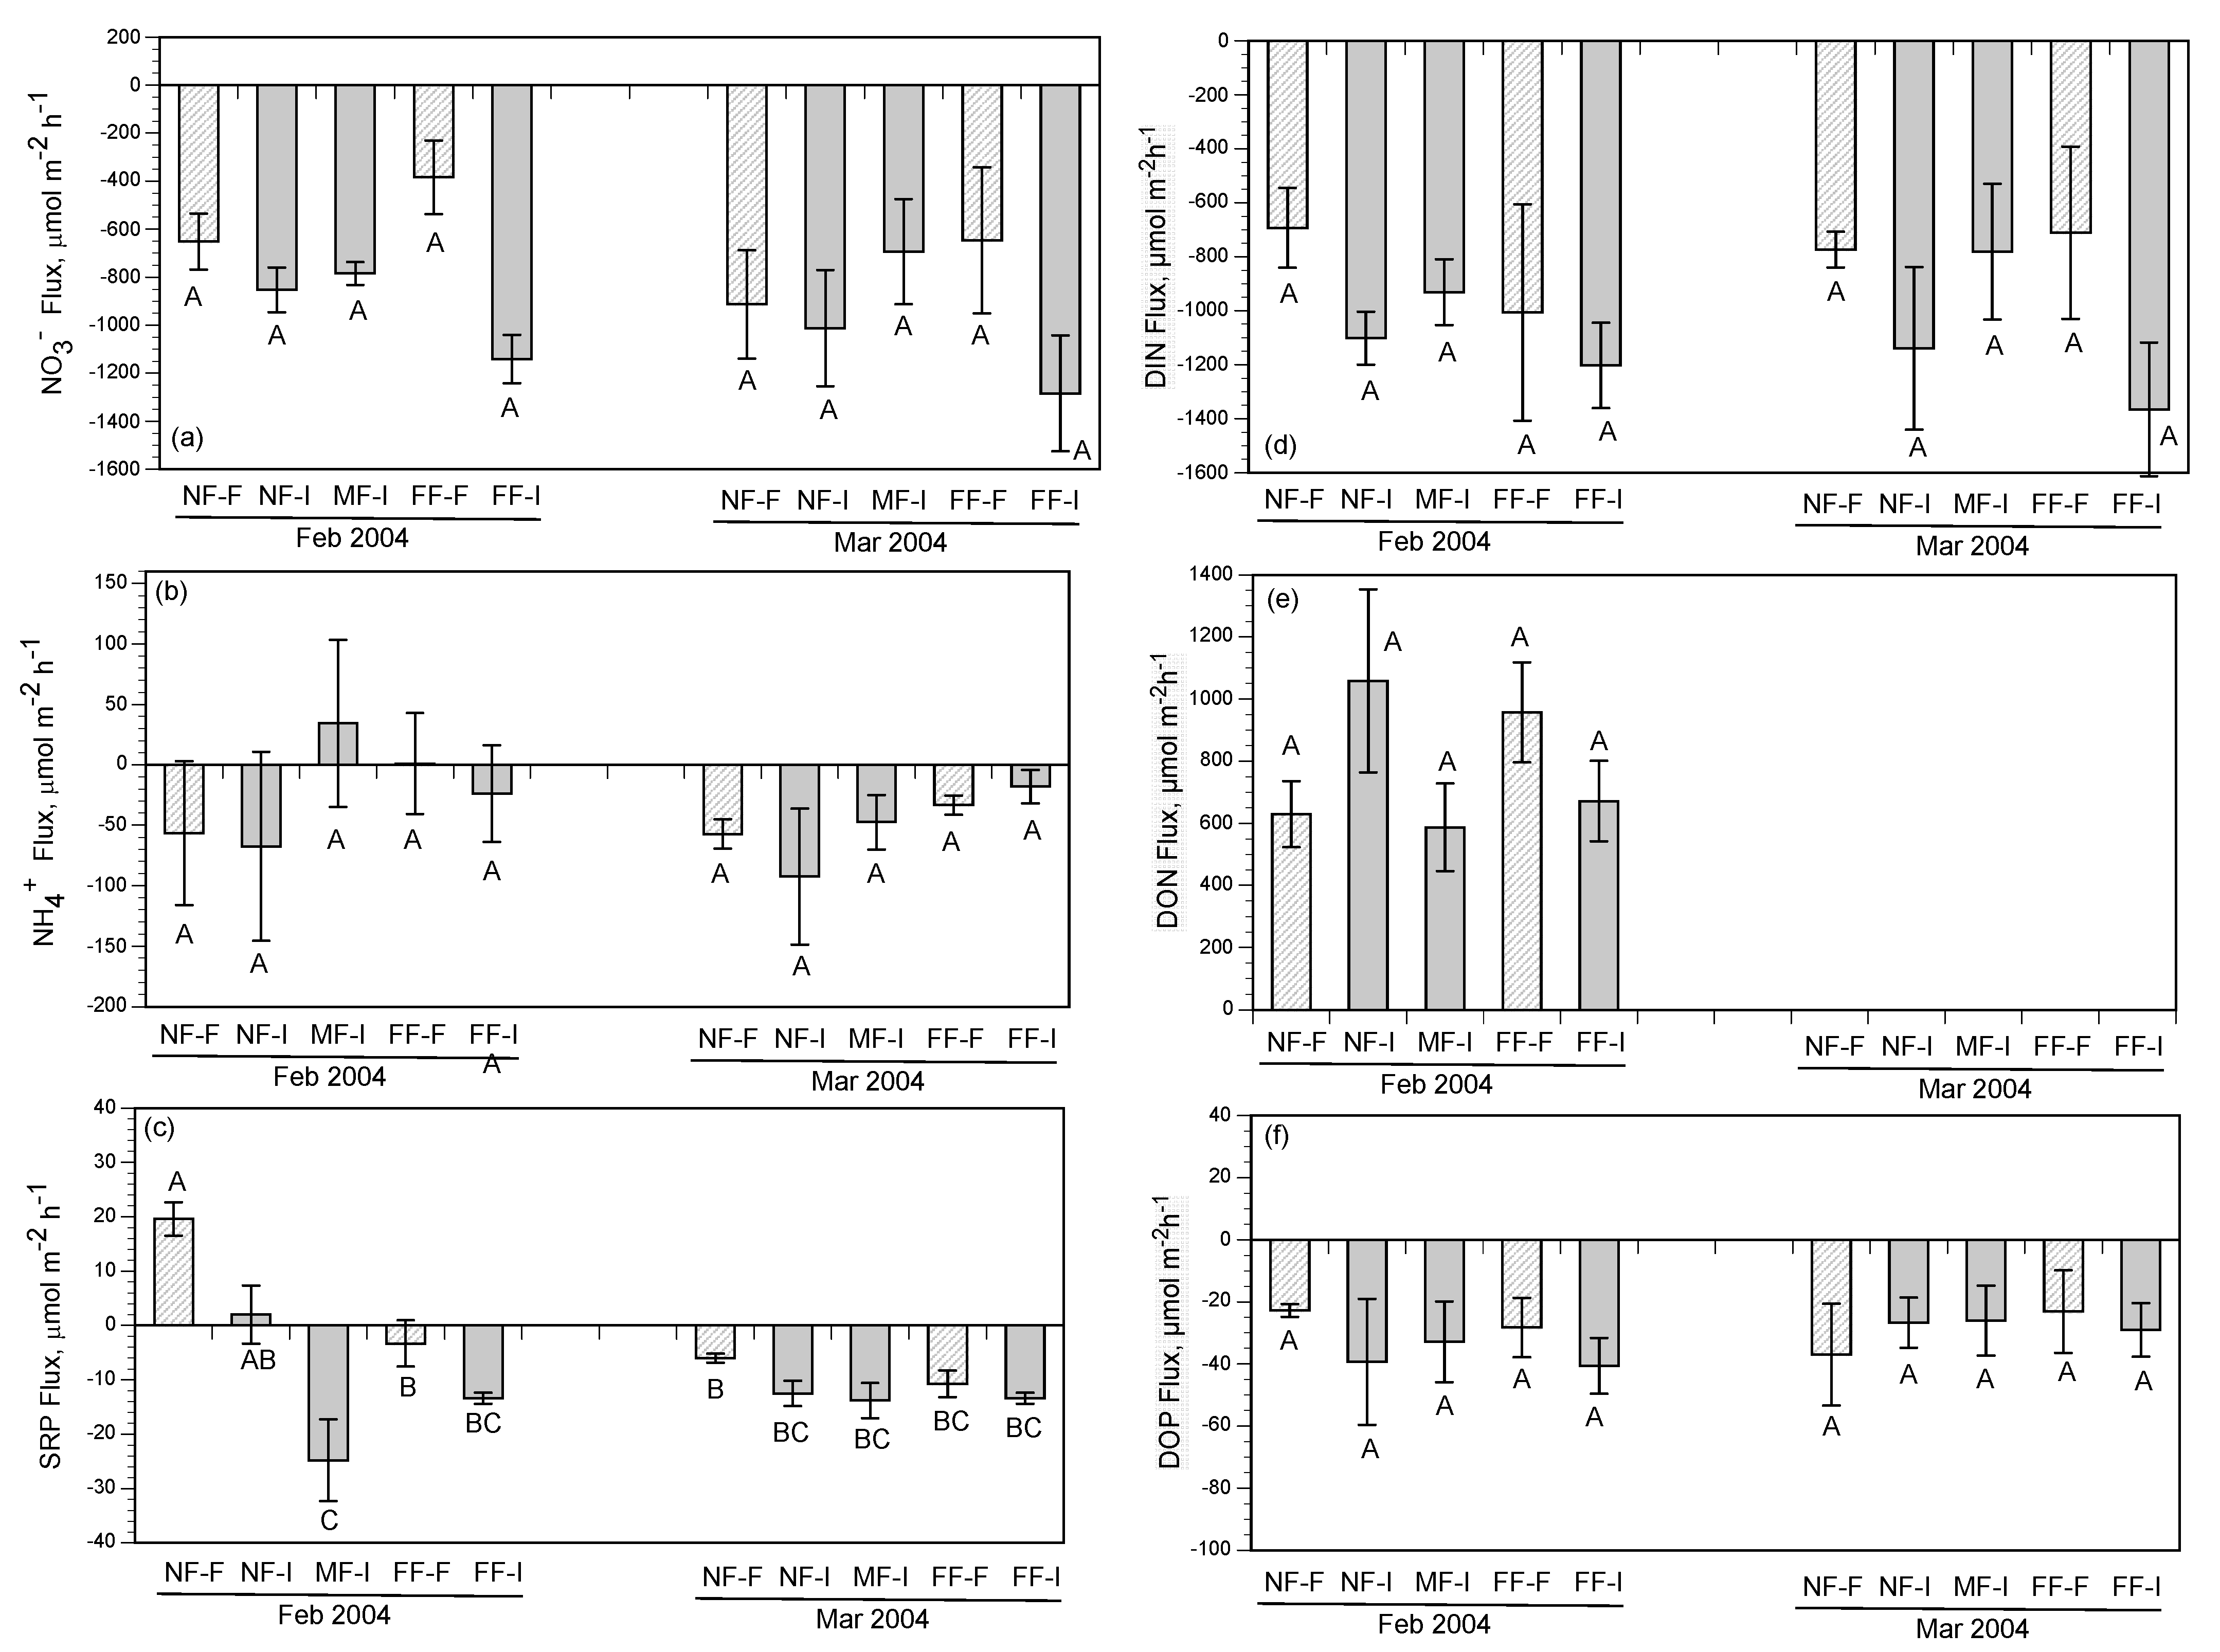
51]. In our study, NO
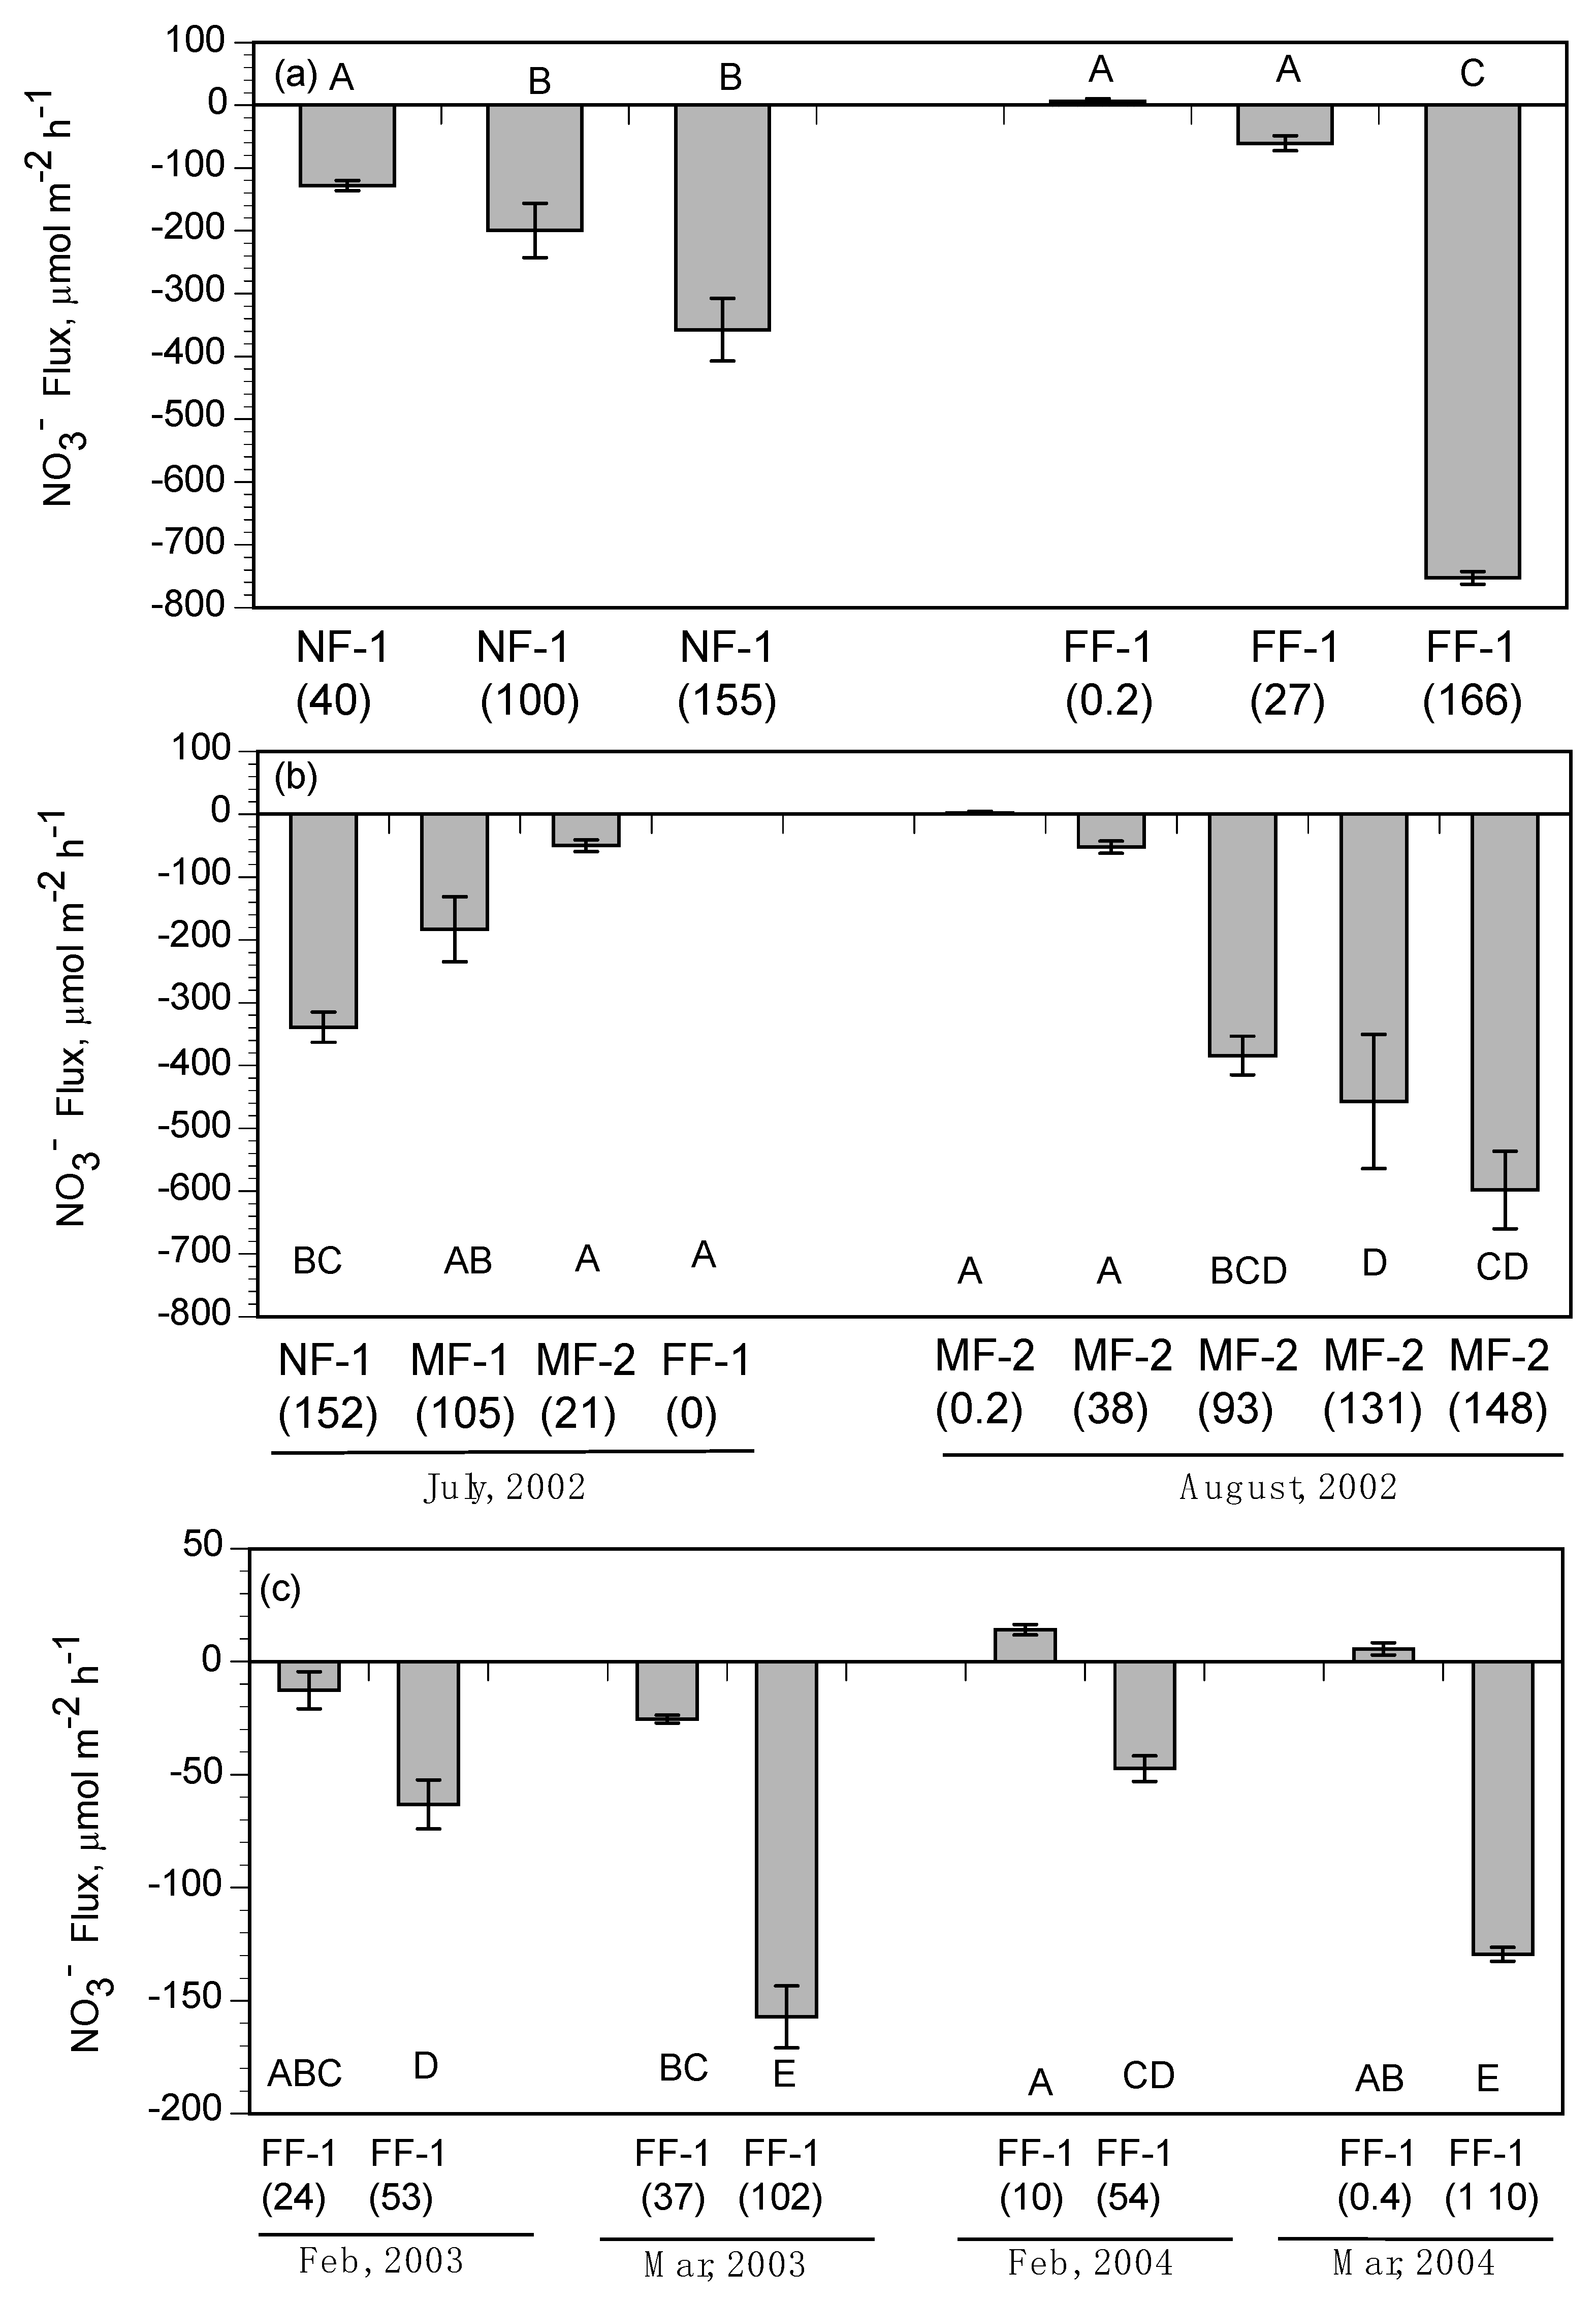
3− removal rates from the water column in intertidal habitats ranged from −383.7 to −1289.3 µmol m
−2 h
−1. Benthic NO
3− fluxes were always into the marsh soil, as high concentrations of NO
3− in the diversion water set up a relatively strong concentration gradient between the pore water and the overlying water in each experiment. High NO
3− concentrations in the water column can enhance diffusion into wetland soils, as NO
3− concentrations are typically very low under reduced soil conditions. A previous flux study conducted using benthic sediment slurries [
52] in the diversion outfall area measured NO
3− removal rates ranging from −137 to −1390 µmol m
−2 h
−1, which are similar to range observed in our study.
Denitrification, the biologically mediated reduction of NO
3−, removes NO
3− in wetland systems and rates have been shown to be dependent on NO
3− concentration [
27,
53,
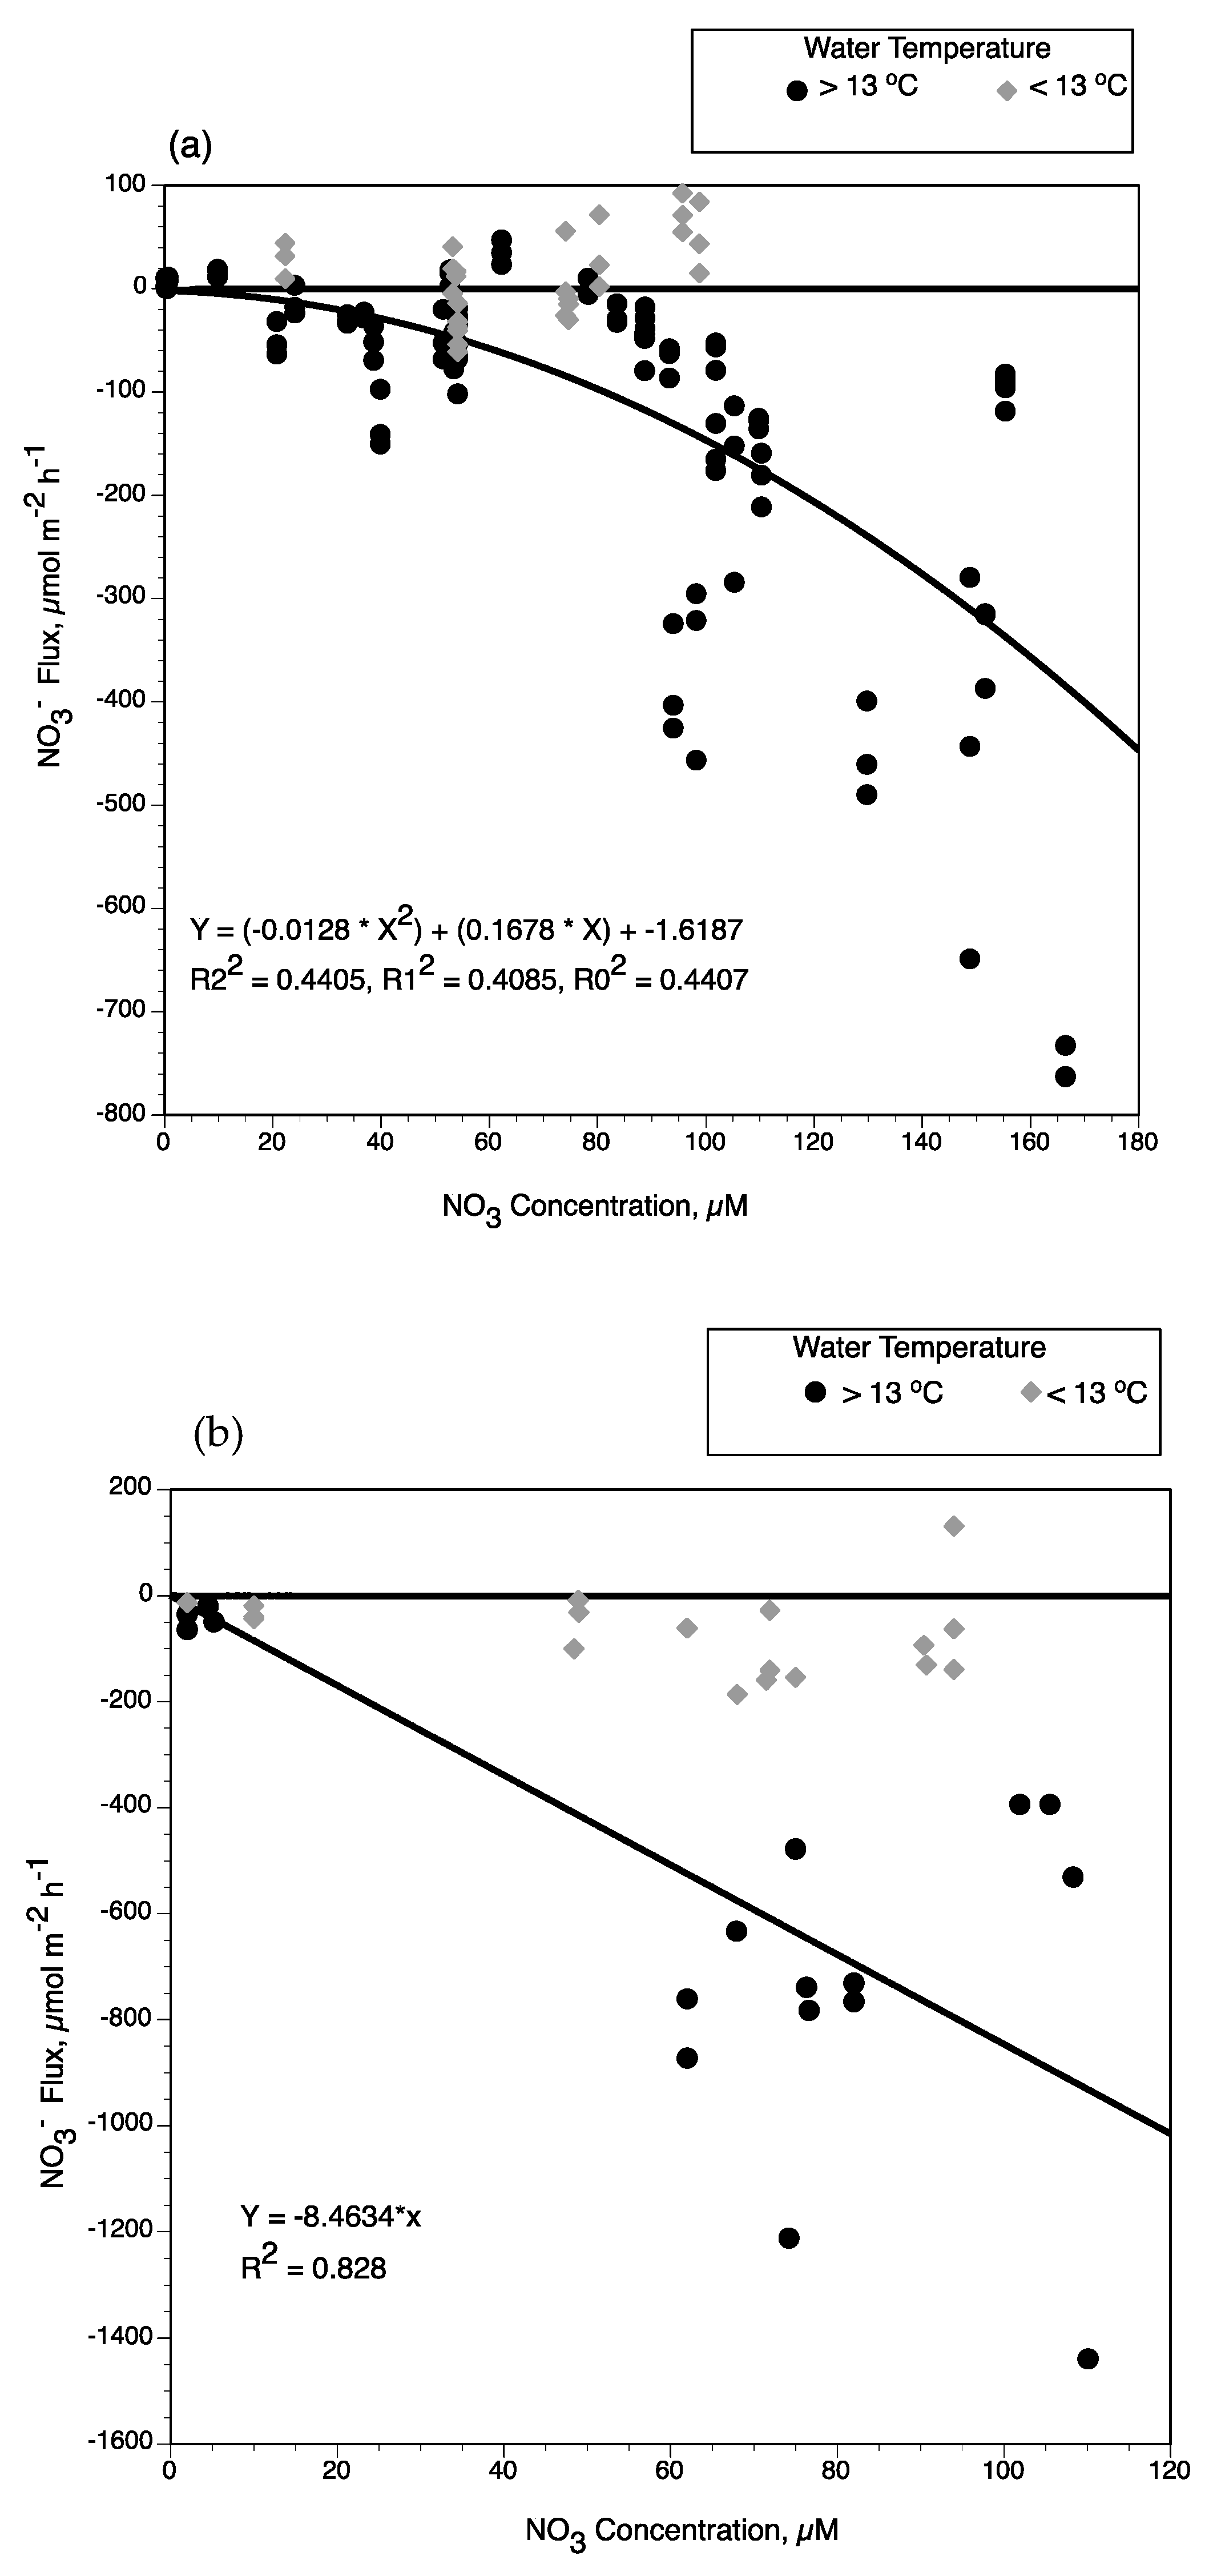
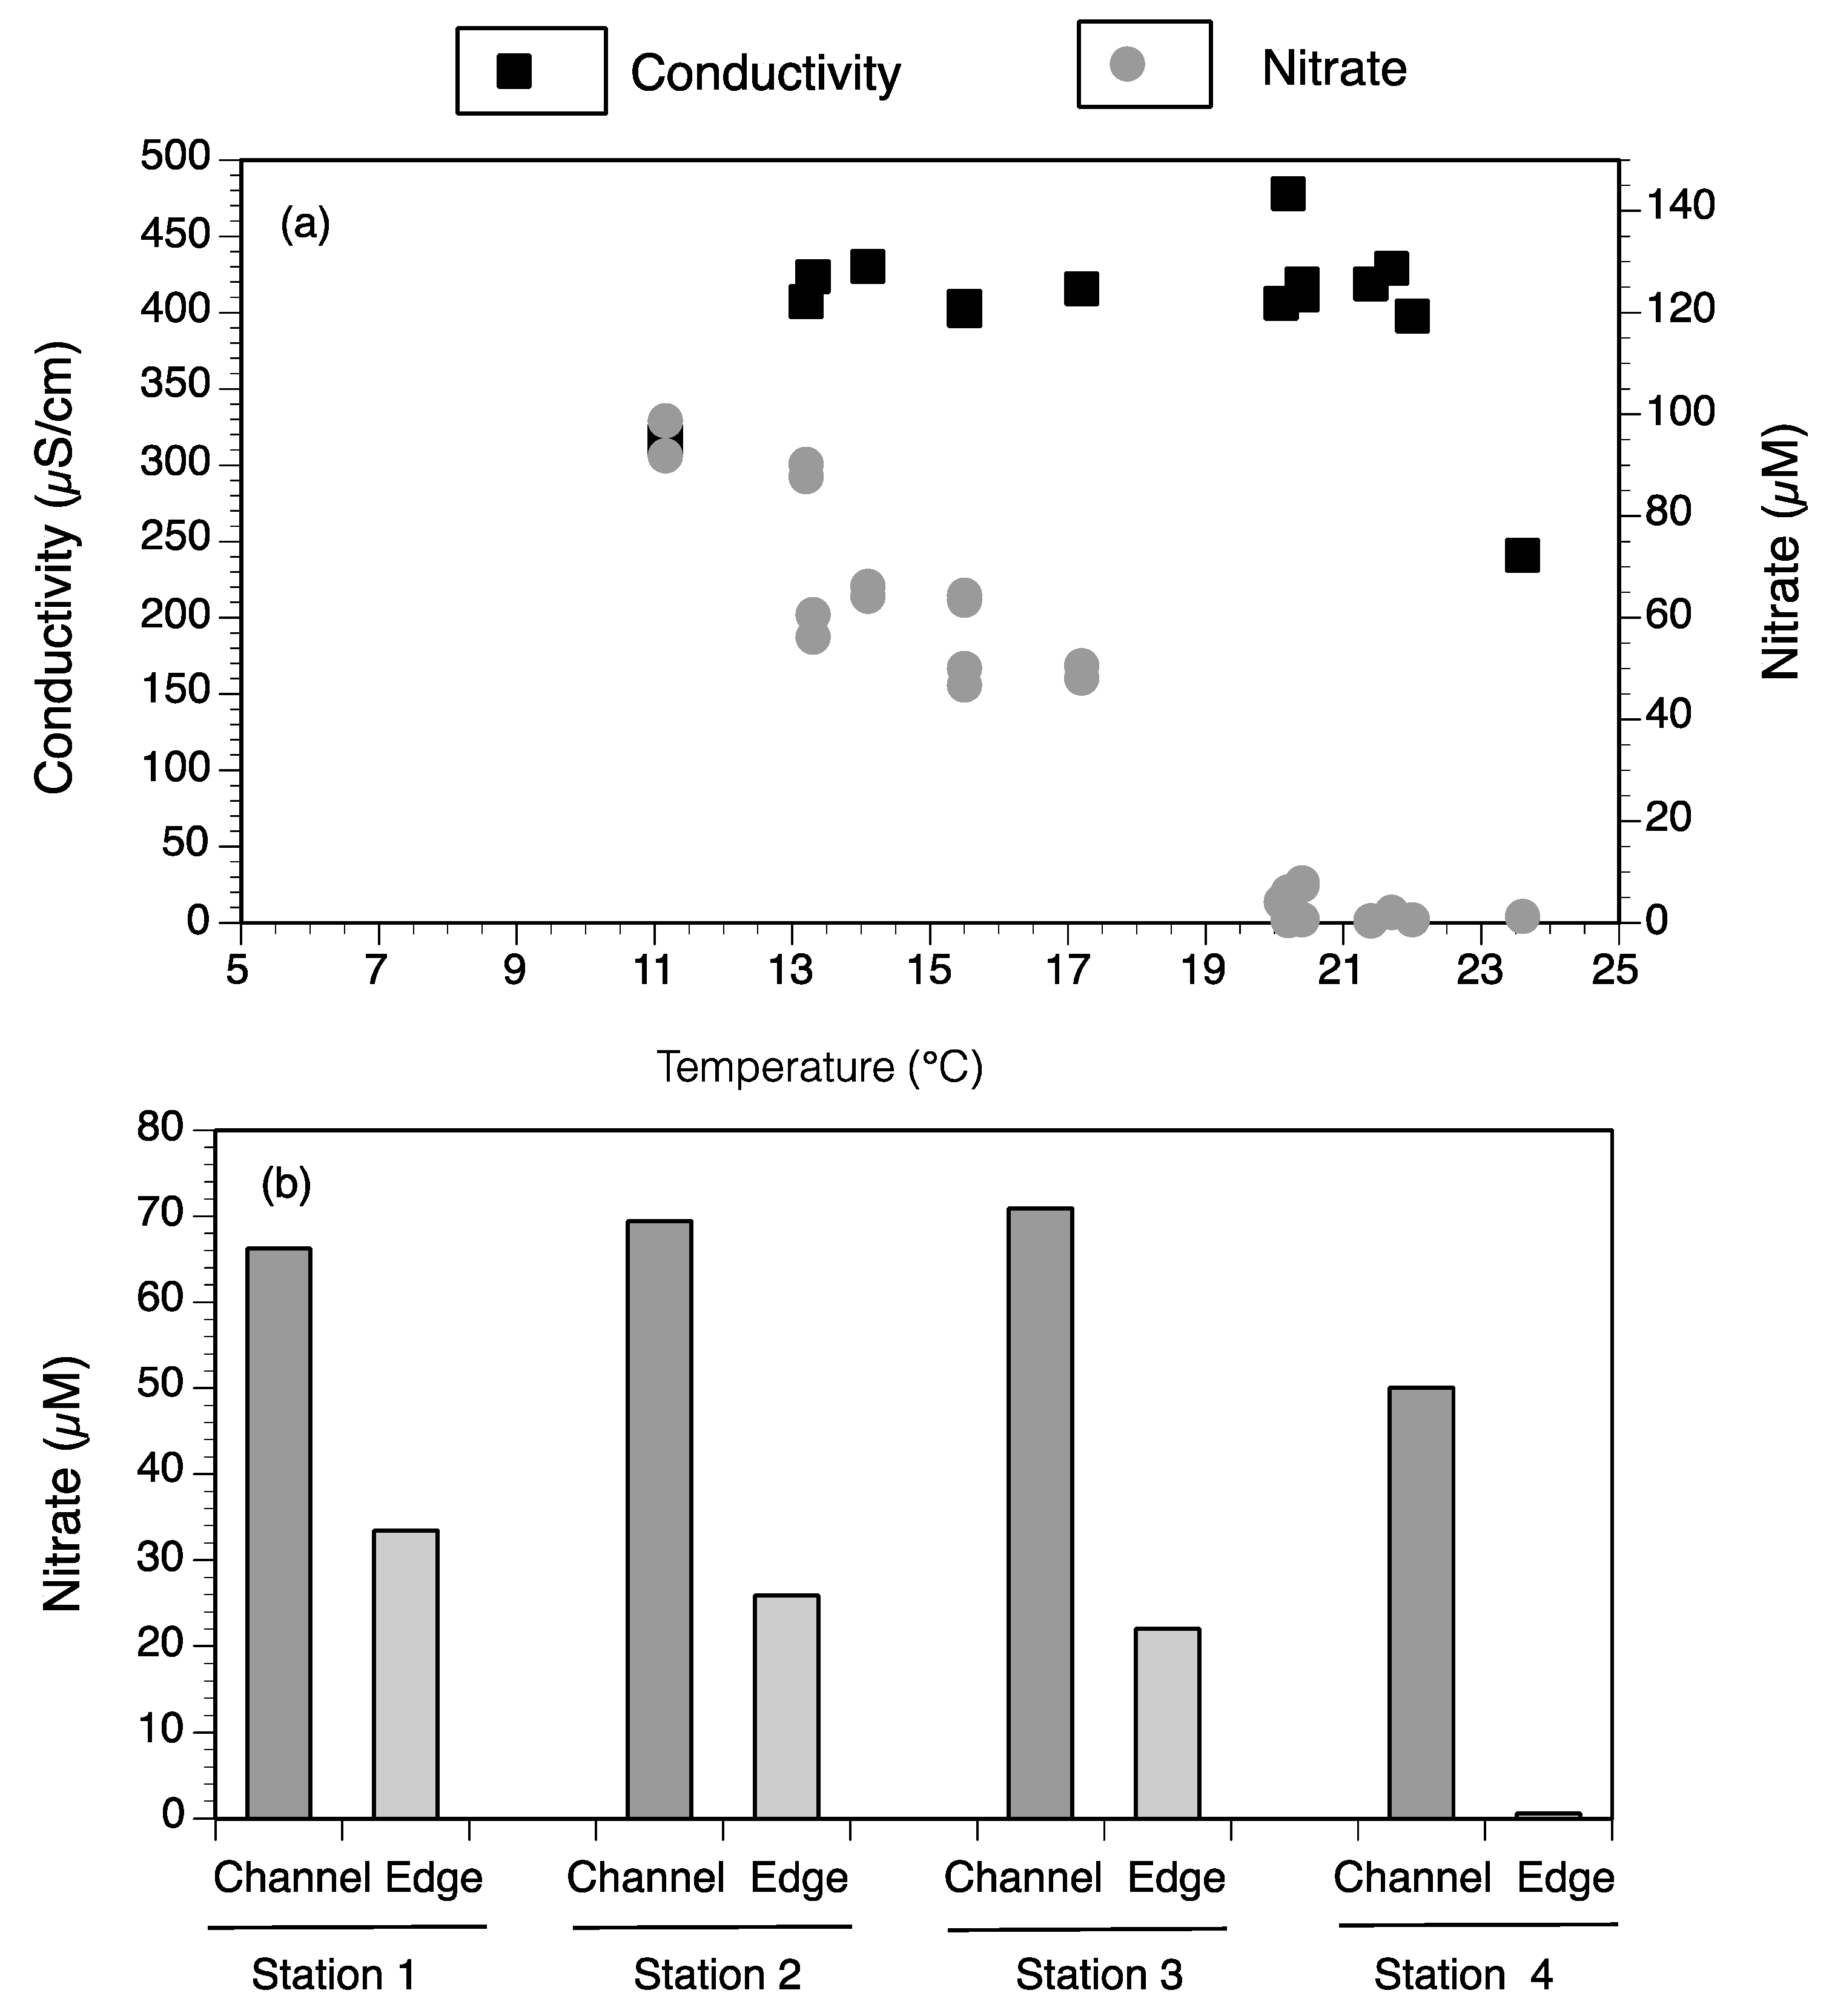
54]. Benthic NO
3− uptake rates by subtidal sediments were higher during warmer months and more strongly dependent on the available NO
3− concentration in the overlying water (
Figure 9a). Sediment removal rates were greater when water temperatures were warm and NO
3− concentrations >75 µM. When water temperatures at near-field stations were colder during river-pulse events in February, NO
3− concentration was not a determining factor in NO
3− uptake rates by subtidal sediments. Seasonal conditions of the river-pulse via the diversion structure influences water temperatures in the near-field outfall area. The effect of colder water temperatures from river-pulses was also observed in mid-field regions during the stronger pulse events in February 2002, 2003, and 2004 (water conductivities were similar to river conditions at all stations during these pulses).
When all the benthic NO
3− fluxes at water temperatures <13 °C are plotted versus NO
3− concentration, the range in benthic flux rates are mostly NO
3− release from sediments (
Figure 9a). When flux rates are plotted for those experiments with water temperature >13 °C, there is a significant polynomial expression with two degrees between NO
3− concentration and NO
3− uptake by subtidal sediments (Y = (−0.0128 × X
2) + (0.1678 × X) − 1.6187, R2
2 = 0.441, R1
2 = 0.409, R
2 = 0.441). This seasonal pattern of benthic NO
3− removal in response to water temperature and NO
3− concentration in overlying water was observed for sediment oxygen demand and benthic NO
3− fluxes in subtidal and intertidal soils of Wax Lake Delta [
25]. These biogeochemical patterns also describe how an active delta ecosystem responds to seasonal conditions associated with the controlled diversion of the Mississippi River [
11]. As observed in upper Breton Sound, river water temperatures at Wax Lake Delta are 8–10 °C in February and March in the channel and in subtidal wetlands inundated with overbank flooding. As water residence time increases in coastal deltaic floodplains, water temperature increases up to 10 °C above those in the channel [
24]. When water temperatures increased during late spring and summer, higher NO
3− concentrations caused increased rates of benthic NO
3− removal and denitrification [
25,
53].
There is evidence that seasonal water temperatures also controlled benthic fluxes of NO3− in intertidal habitats. Chamber experiments of intertidal fluxes regulated water temperatures >20 °C to match higher mid-field conditions observed in landscape surveys. This is in contrast to the colder water temperatures observed in near-field flume in February. In addition, we used water from Big Mar in all the intertidal sediment flux experiments, and therefore did not experiment with varying NO3− concentrations as we did for the subtidal benthic flux experiments. Accordingly, there were no significant differences in NO3− fluxes of intertidal soils between the February and March river-pulse events since higher water temperatures and NO3− concentrations were used in all river-pulse experiments. Based on flume observations, the overlying water column at the near-field sites is approximately 10 °C colder than water at the mid-field and far-field sites in February and March, due to colder river water controlling sheet-flow when the river-pulse is routed onto wetland platforms. River waters in intertidal habitats in the near-field locations also had greater NO3− concentrations, as observed in the near-field subtidal habitats during river-pulse events. However, as intertidal sheet-flow moved downstream, water temperatures increased and NO3− concentrations decreased, indicating that NO3− benthic fluxes in the field should vary in contrast to the intertidal flux rates measured in our chamber experiments.
We used NO
3− flux experiments from intertidal wetlands in Wax Lake Delta [
24,
25,
53,
55] along with intertidal rates measured for upper Breton Sound in this study to estimate temperature and NO
3− concentration effects on NO
3− removal by intertidal soils (
Figure 9b). NO
3− fluxes at water temperatures >13 °C and NO
3− concentrations ranging from 2 to 80 µM were selected from the combined data sets for Wax Lake Delta intertidal soils. However, sediment organic matter had to be accounted for in developing a function between NO
3− concentration and NO
3− flux rates, given the strong response of NO
3− uptake rates to this soil variable experimentally demonstrated at Wax Lake Delta [
25,
53]. Sediment organic matter content of the intertidal wetlands soils at Breton Sound were greater (85–350 mg/gdm) than intertidal wetlands at Wax Lake Delta (20–100 mg/gdm). Lower sediment organic matter concentrations in Wax Lake Delta is particularly evident in younger intertidal soils [
56]. As observed for subtidal sediments, water temperatures below 13 °C reduce the response of NO
3− fluxes relative to NO
3− concentrations in Wax Lake Delta intertidal soils. We excluded those experiments with water temperature <13 °C and sediment organic matter <50 mg/g dm to compare with intertidal soils of upper Breton Sound (
Figure 9b). Using intertidal wetlands flux rates in this study along with the selected fluxes from studies at Wax Lake Delta, we developed a significant linear function between NO
3− concentration and NO
3− removal rates (
Figure 9b; Y = −8.4634 × X, R
2 = 0.828). This supports previous research results that sediment NO
3− fluxes and denitrification rates are proportional to NO
3− concentrations in overlying waters depending on water temperatures [
57,
58,
59,
60].
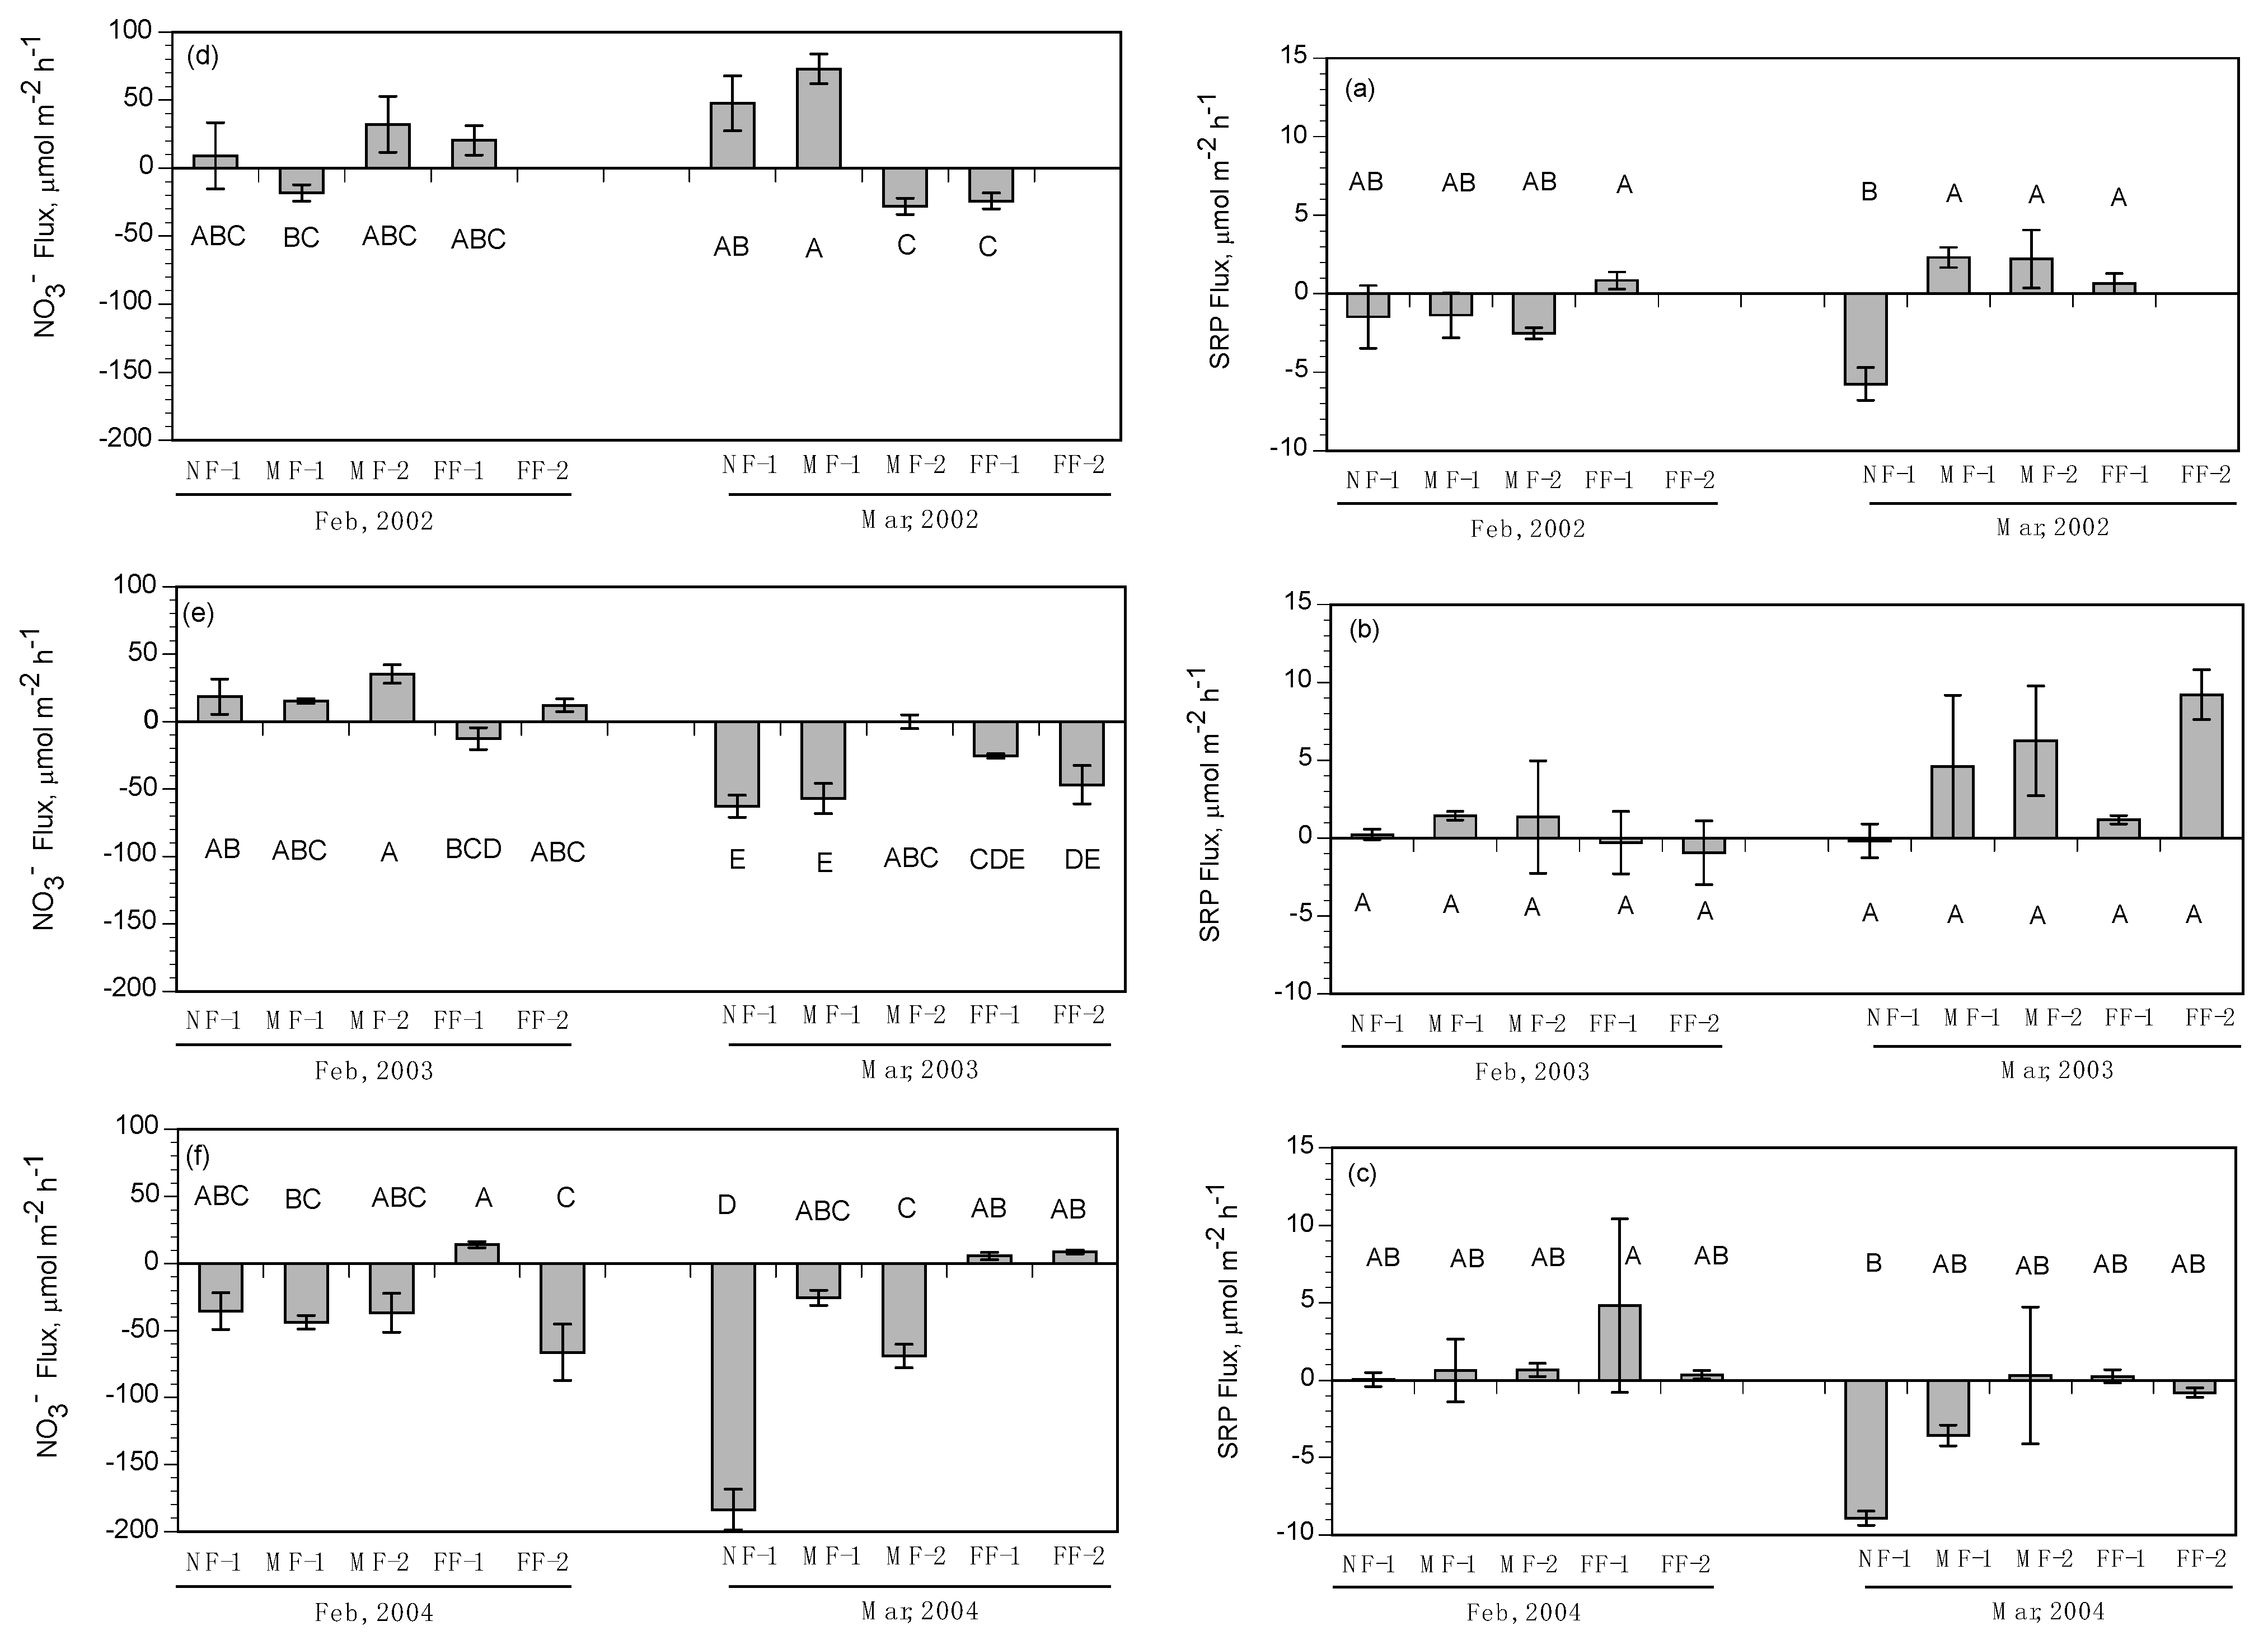
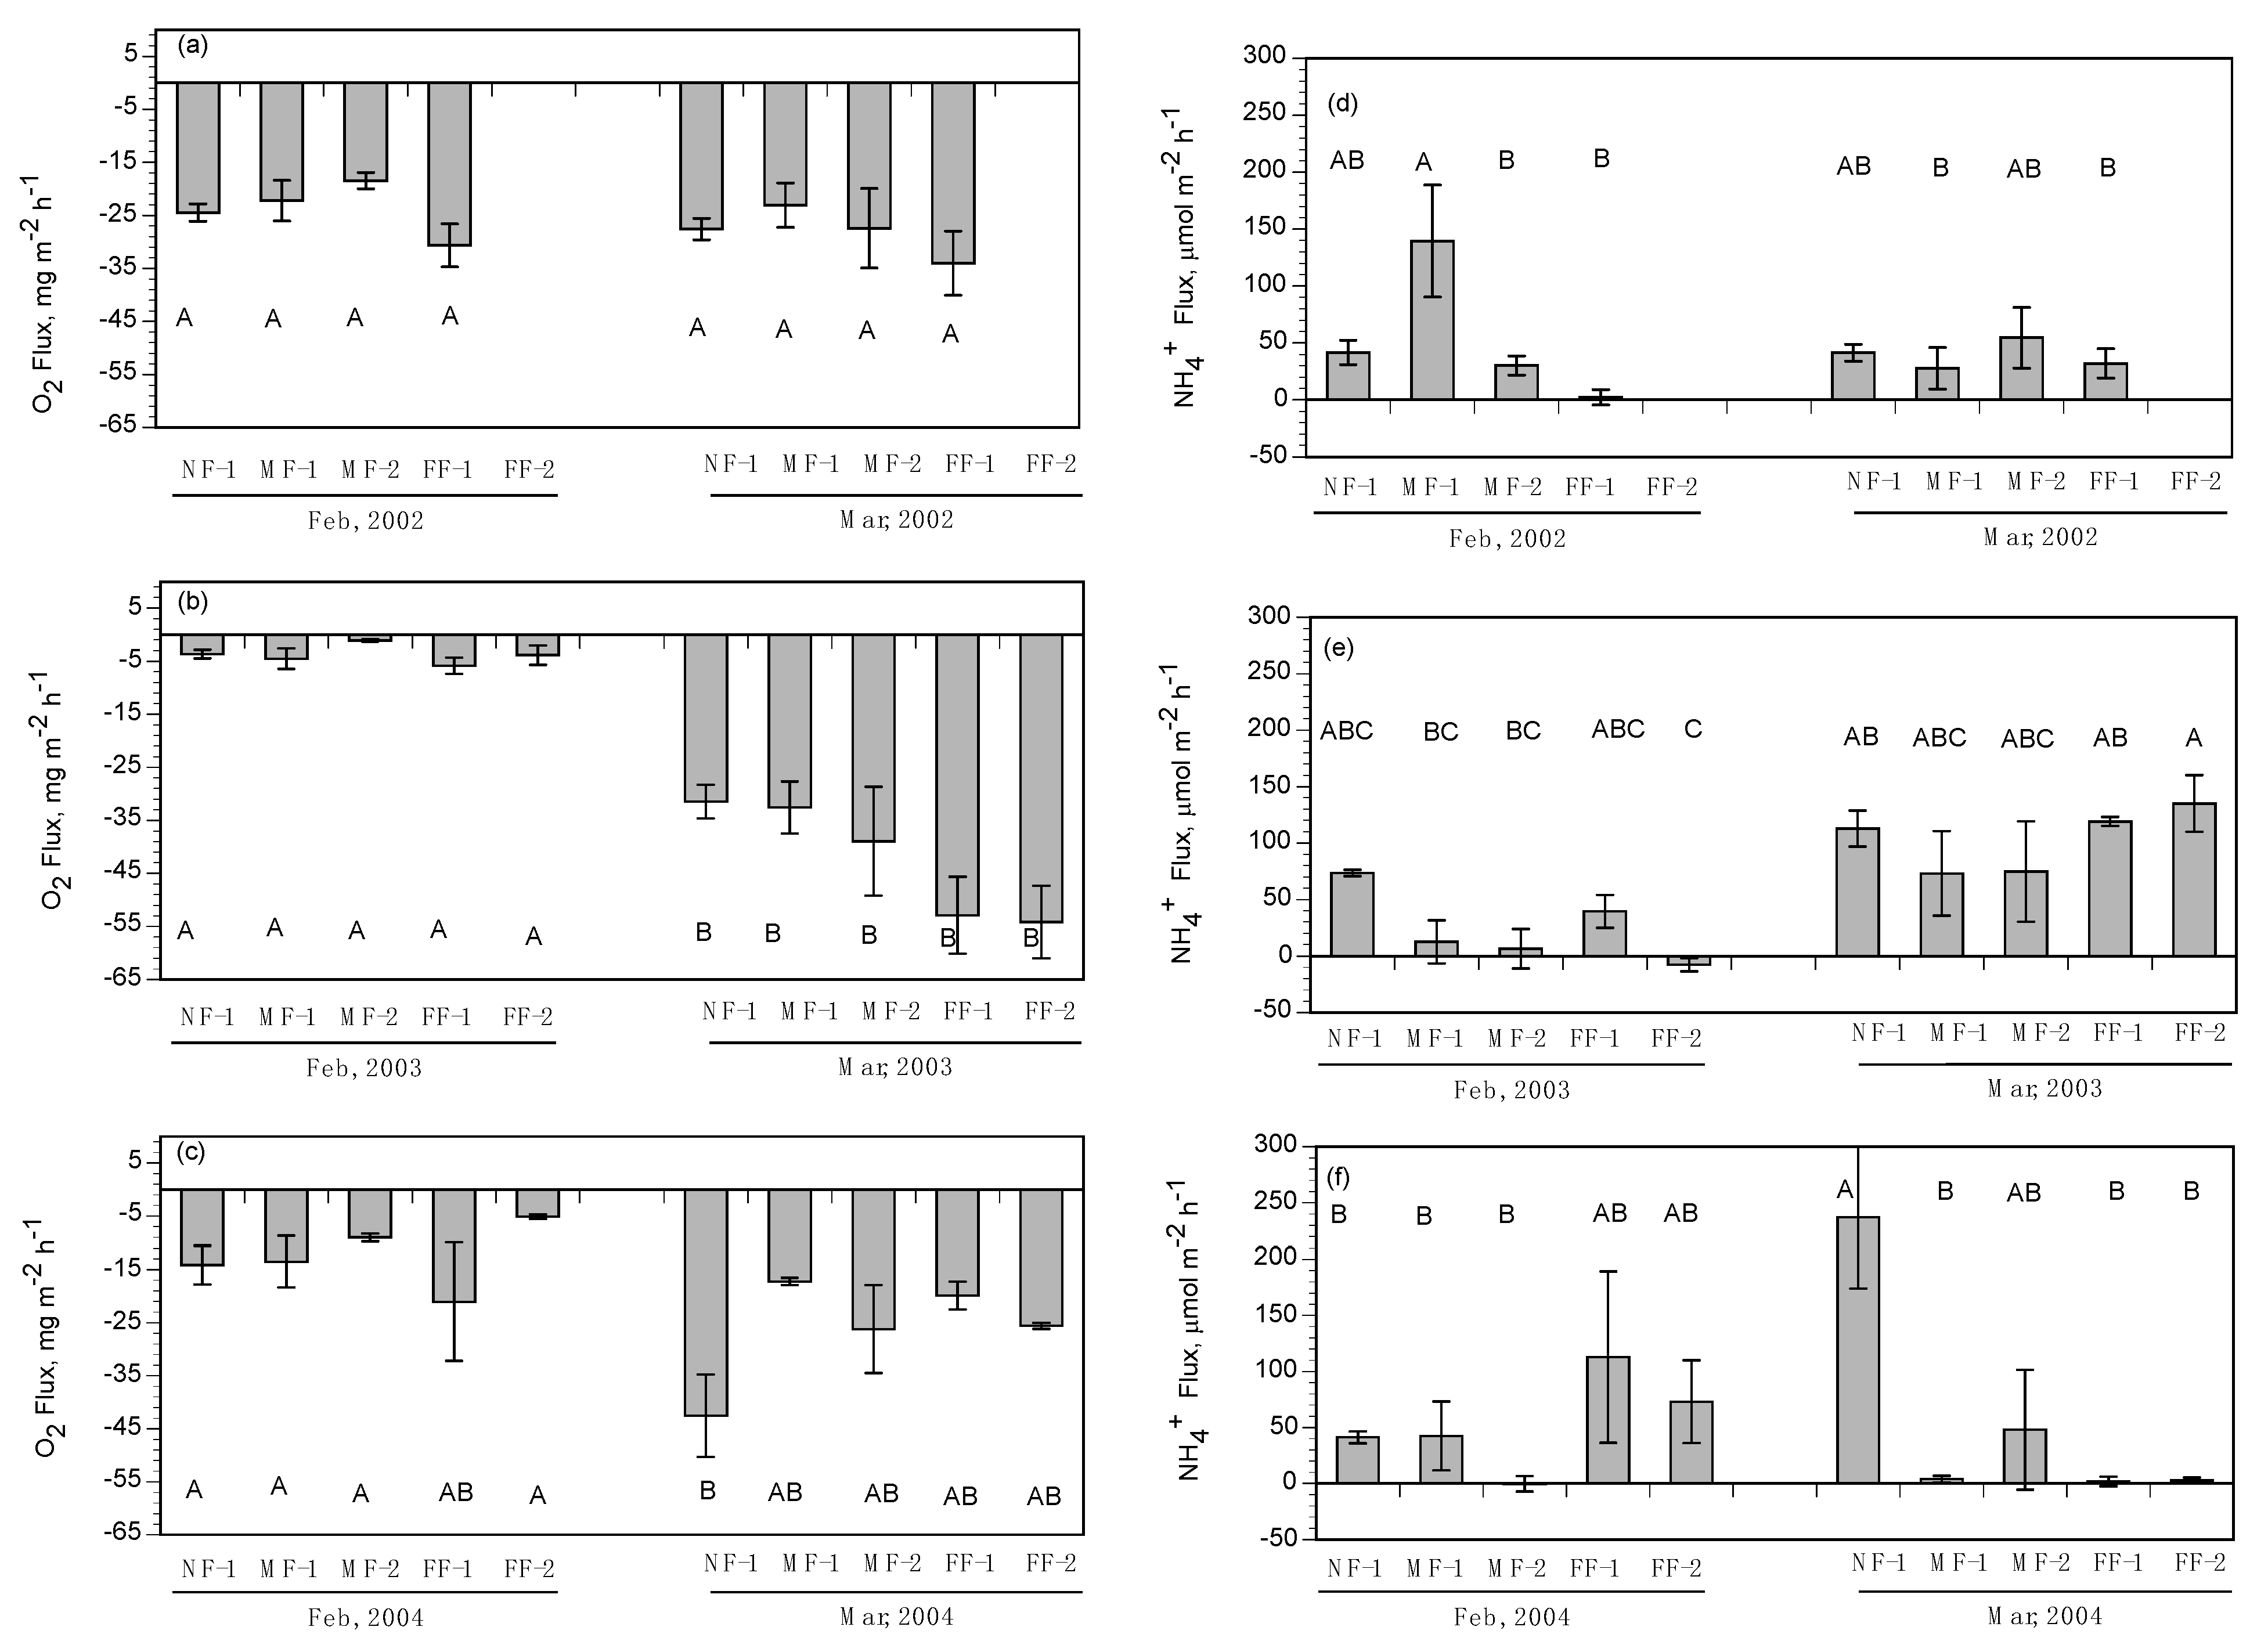
NH
4+ fluxes were highly variable with no clear pattern except for a slight uptake of NH
4+ during the February and March flood-pulse experiments. This trend seems to contradict the general estuarine model of wetlands exporting reduced nitrogen forms to surrounding water bodies, but key differences between the methods used in this study and the standard approaches (benthic cores and flumes) may have resulted in a greater uptake of NH
4+ by marsh soils in our study. A flume study conducted in a tidal freshwater marsh [
61] showed that the marsh consistently acted as a sink for NH
4, and those vegetated areas removed more NH
4 from the water column than unvegetated areas. The inclusion of vegetation in the cores, along with relatively high NH
4+ concentrations in the diversion water, may have contributed to the increased variability of flux direction and rate. Plants take up NH
4+ preferentially as a source of nitrogen, and the presence of intact vegetation could have led to higher rates of NH
4+ uptake in our study. The flux rates in this study show that the marshes of Breton Sound may have the capacity to remove small amounts of NH
4+ from the water column under specific conditions.
4.2. Nitrate Removal
The capacity of nutrients, particularly NO
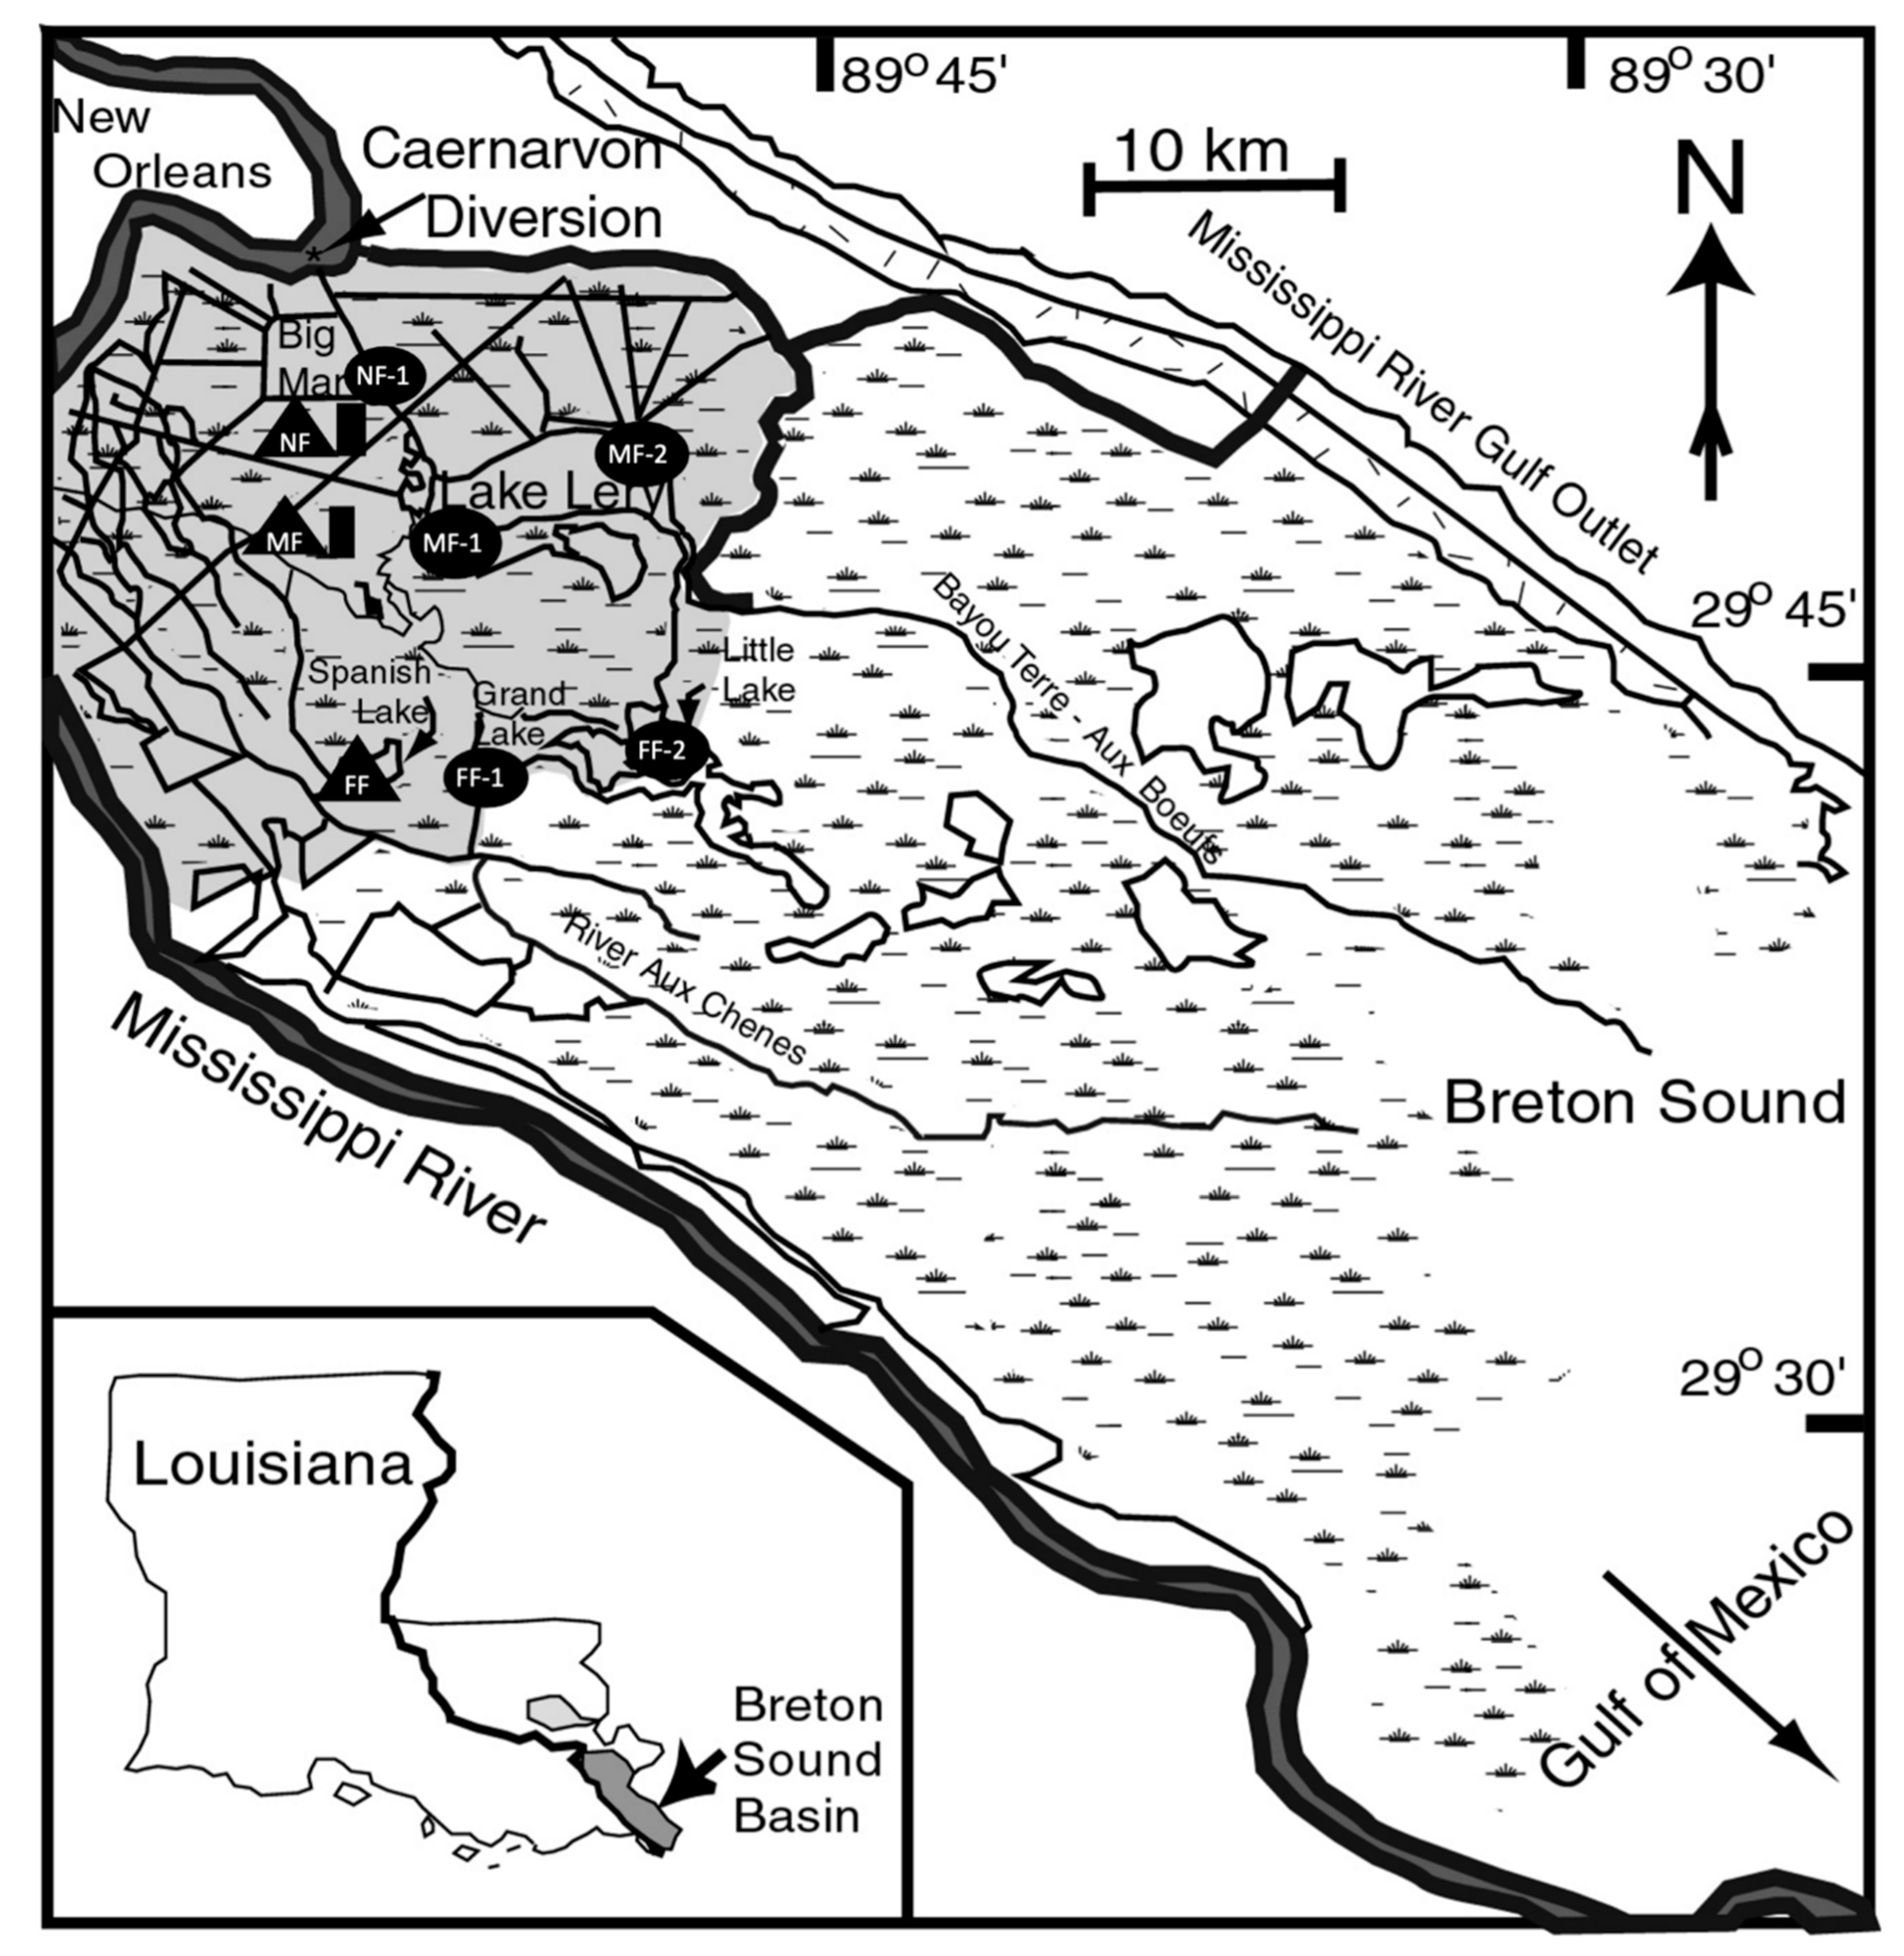
3−, to be removed from river water diverted by the Caernarvon structure in the upper region of Breton Sound is particularly important since the anticipated increase in nutrient loading downstream could potentially reduce water quality [
26,
54]. NO
3− concentration in the Mississippi River at Caernarvon typically ranges from 60 to 120 µM, which is substantially higher than most ambient concentrations found in the adjacent coastal estuaries [
26]. It is therefore critical to understand the capacity of habitats in the outfall region of upper Breton Sound to remove NO
3− from the water column prior to its transport downstream. The impact of the Mississippi River diversion at Caernarvon on nutrient cycling in the upper Breton Sound estuary is an important factor in establishing operational management guidelines for this restoration strategy [
1,
2].
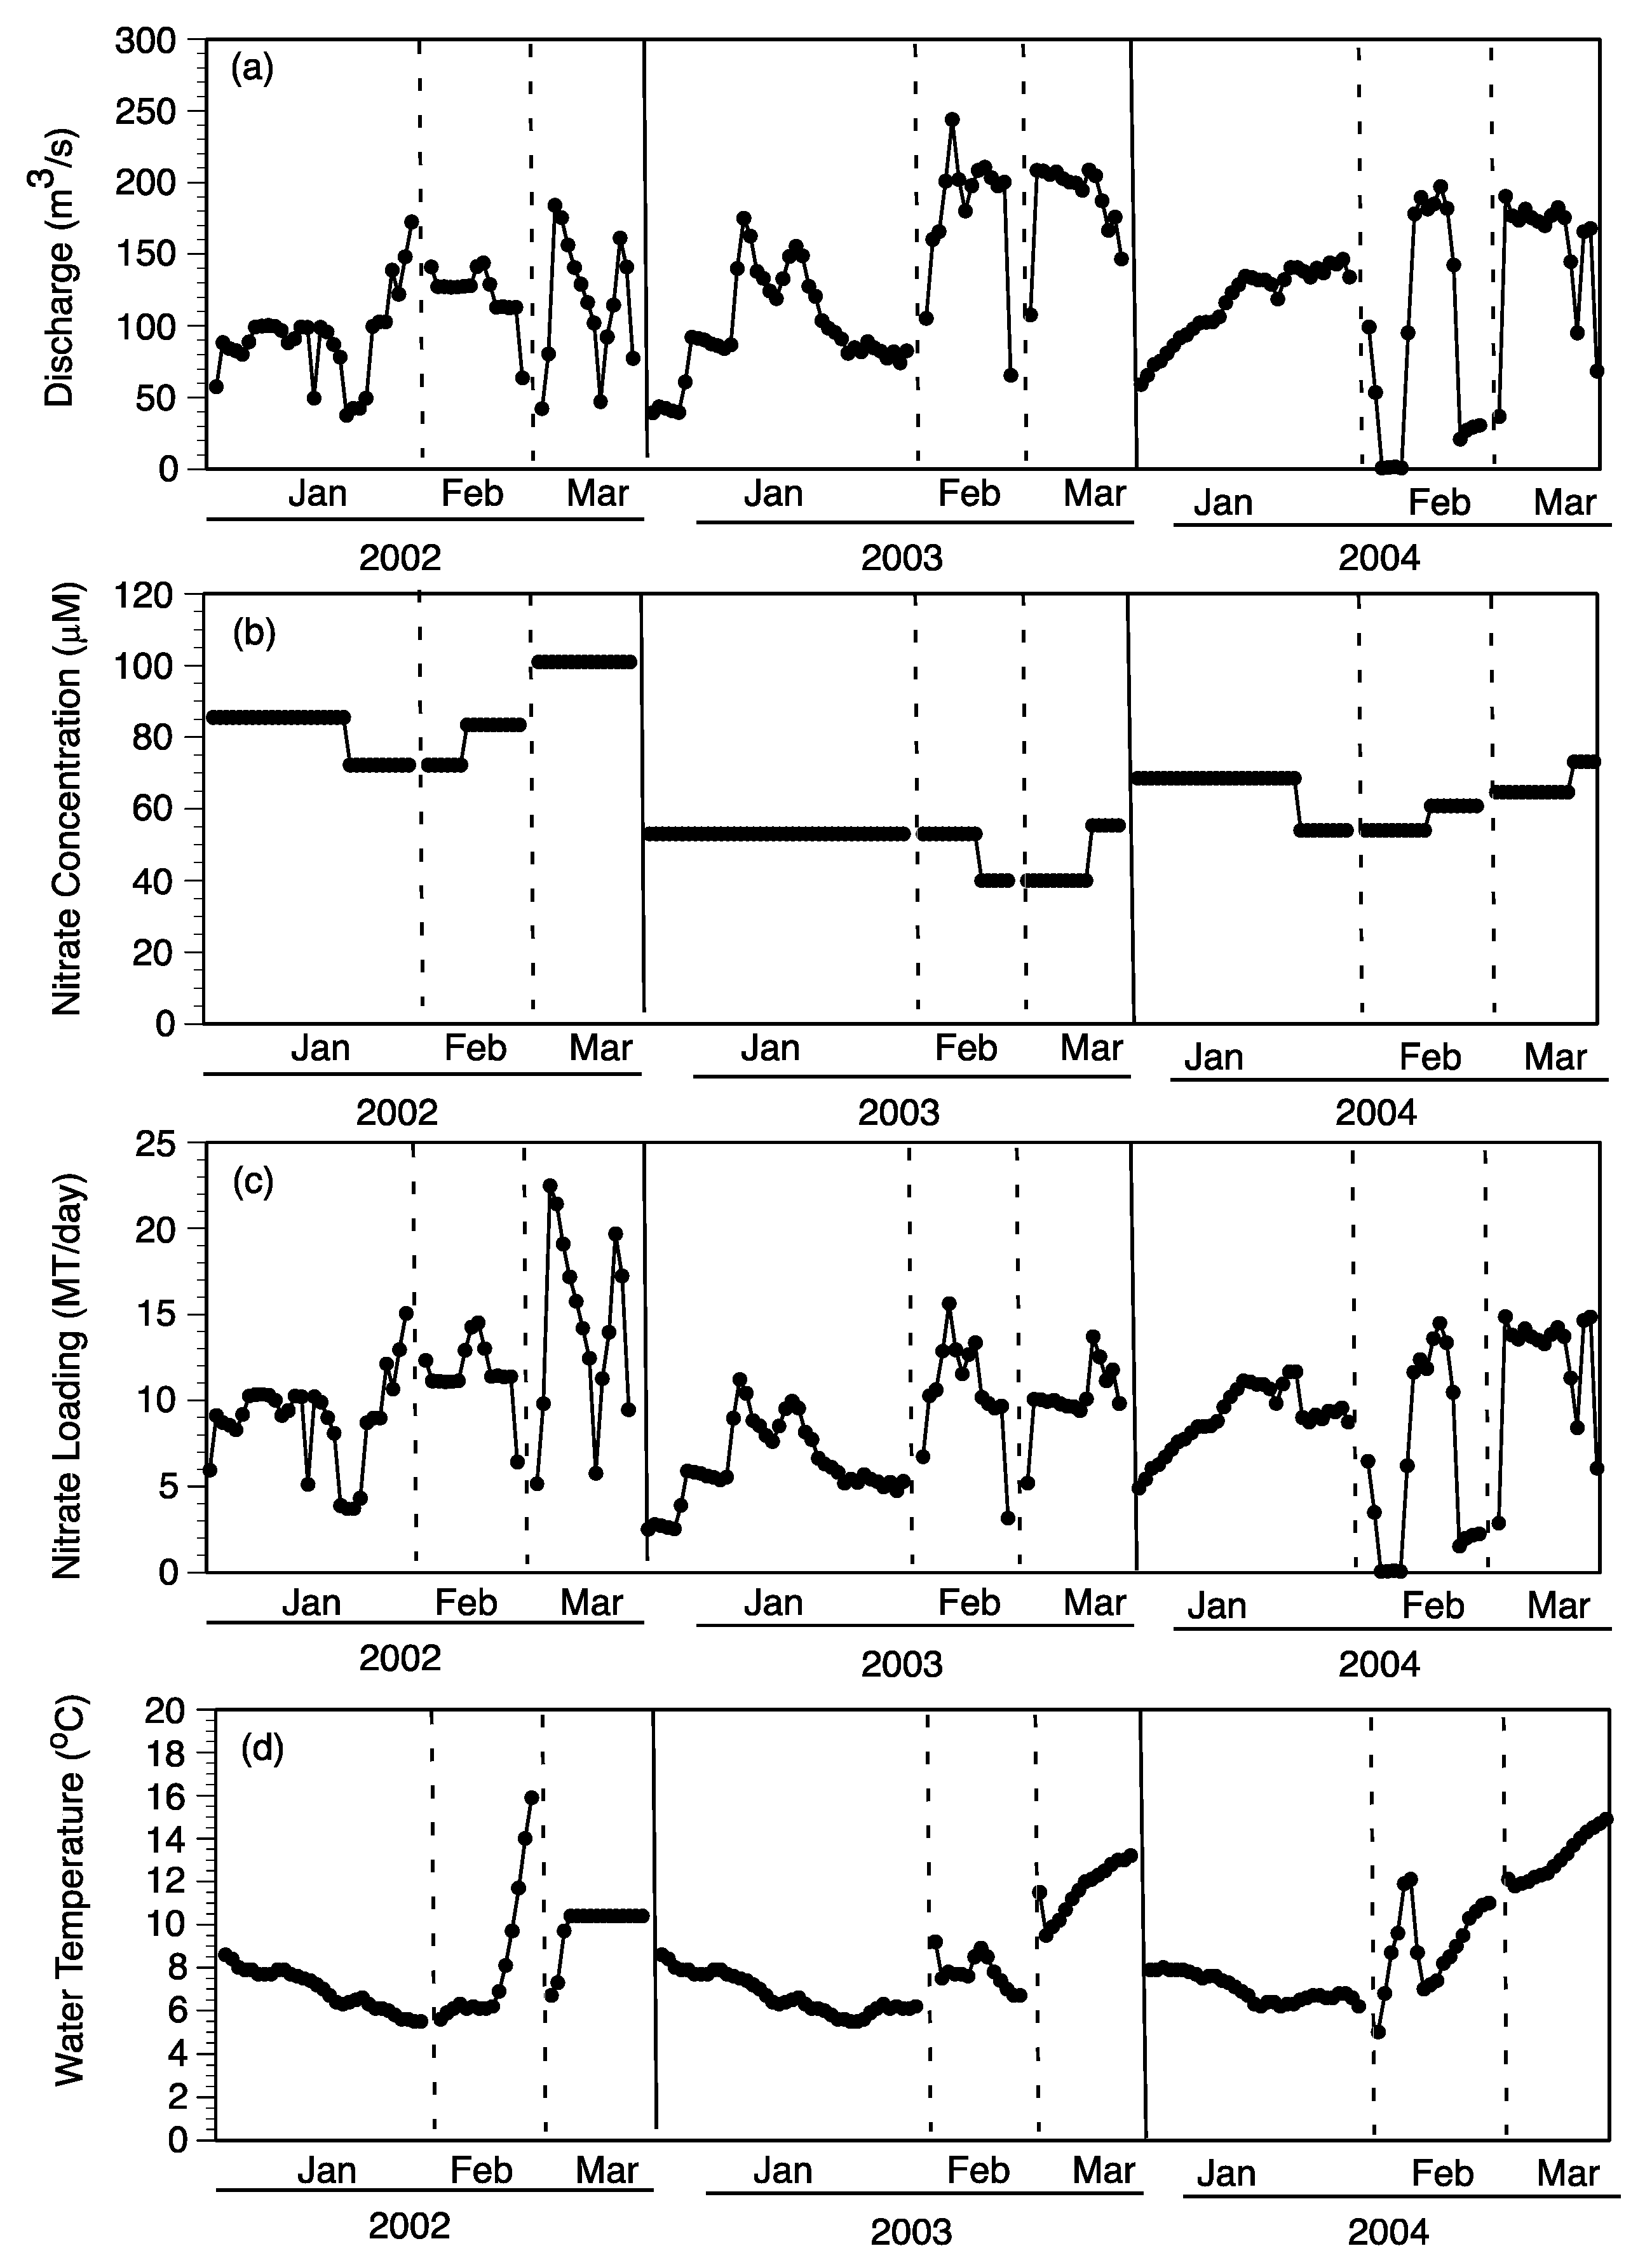
Daily NO
3− loading (MT/day) for each of the nine pulse events (three each in 2002, 2003, and 2004) was based on the discharge rate and NO
3− concentration at the Caernarvon diversion structure (
Figure 10a–c). The daily NO
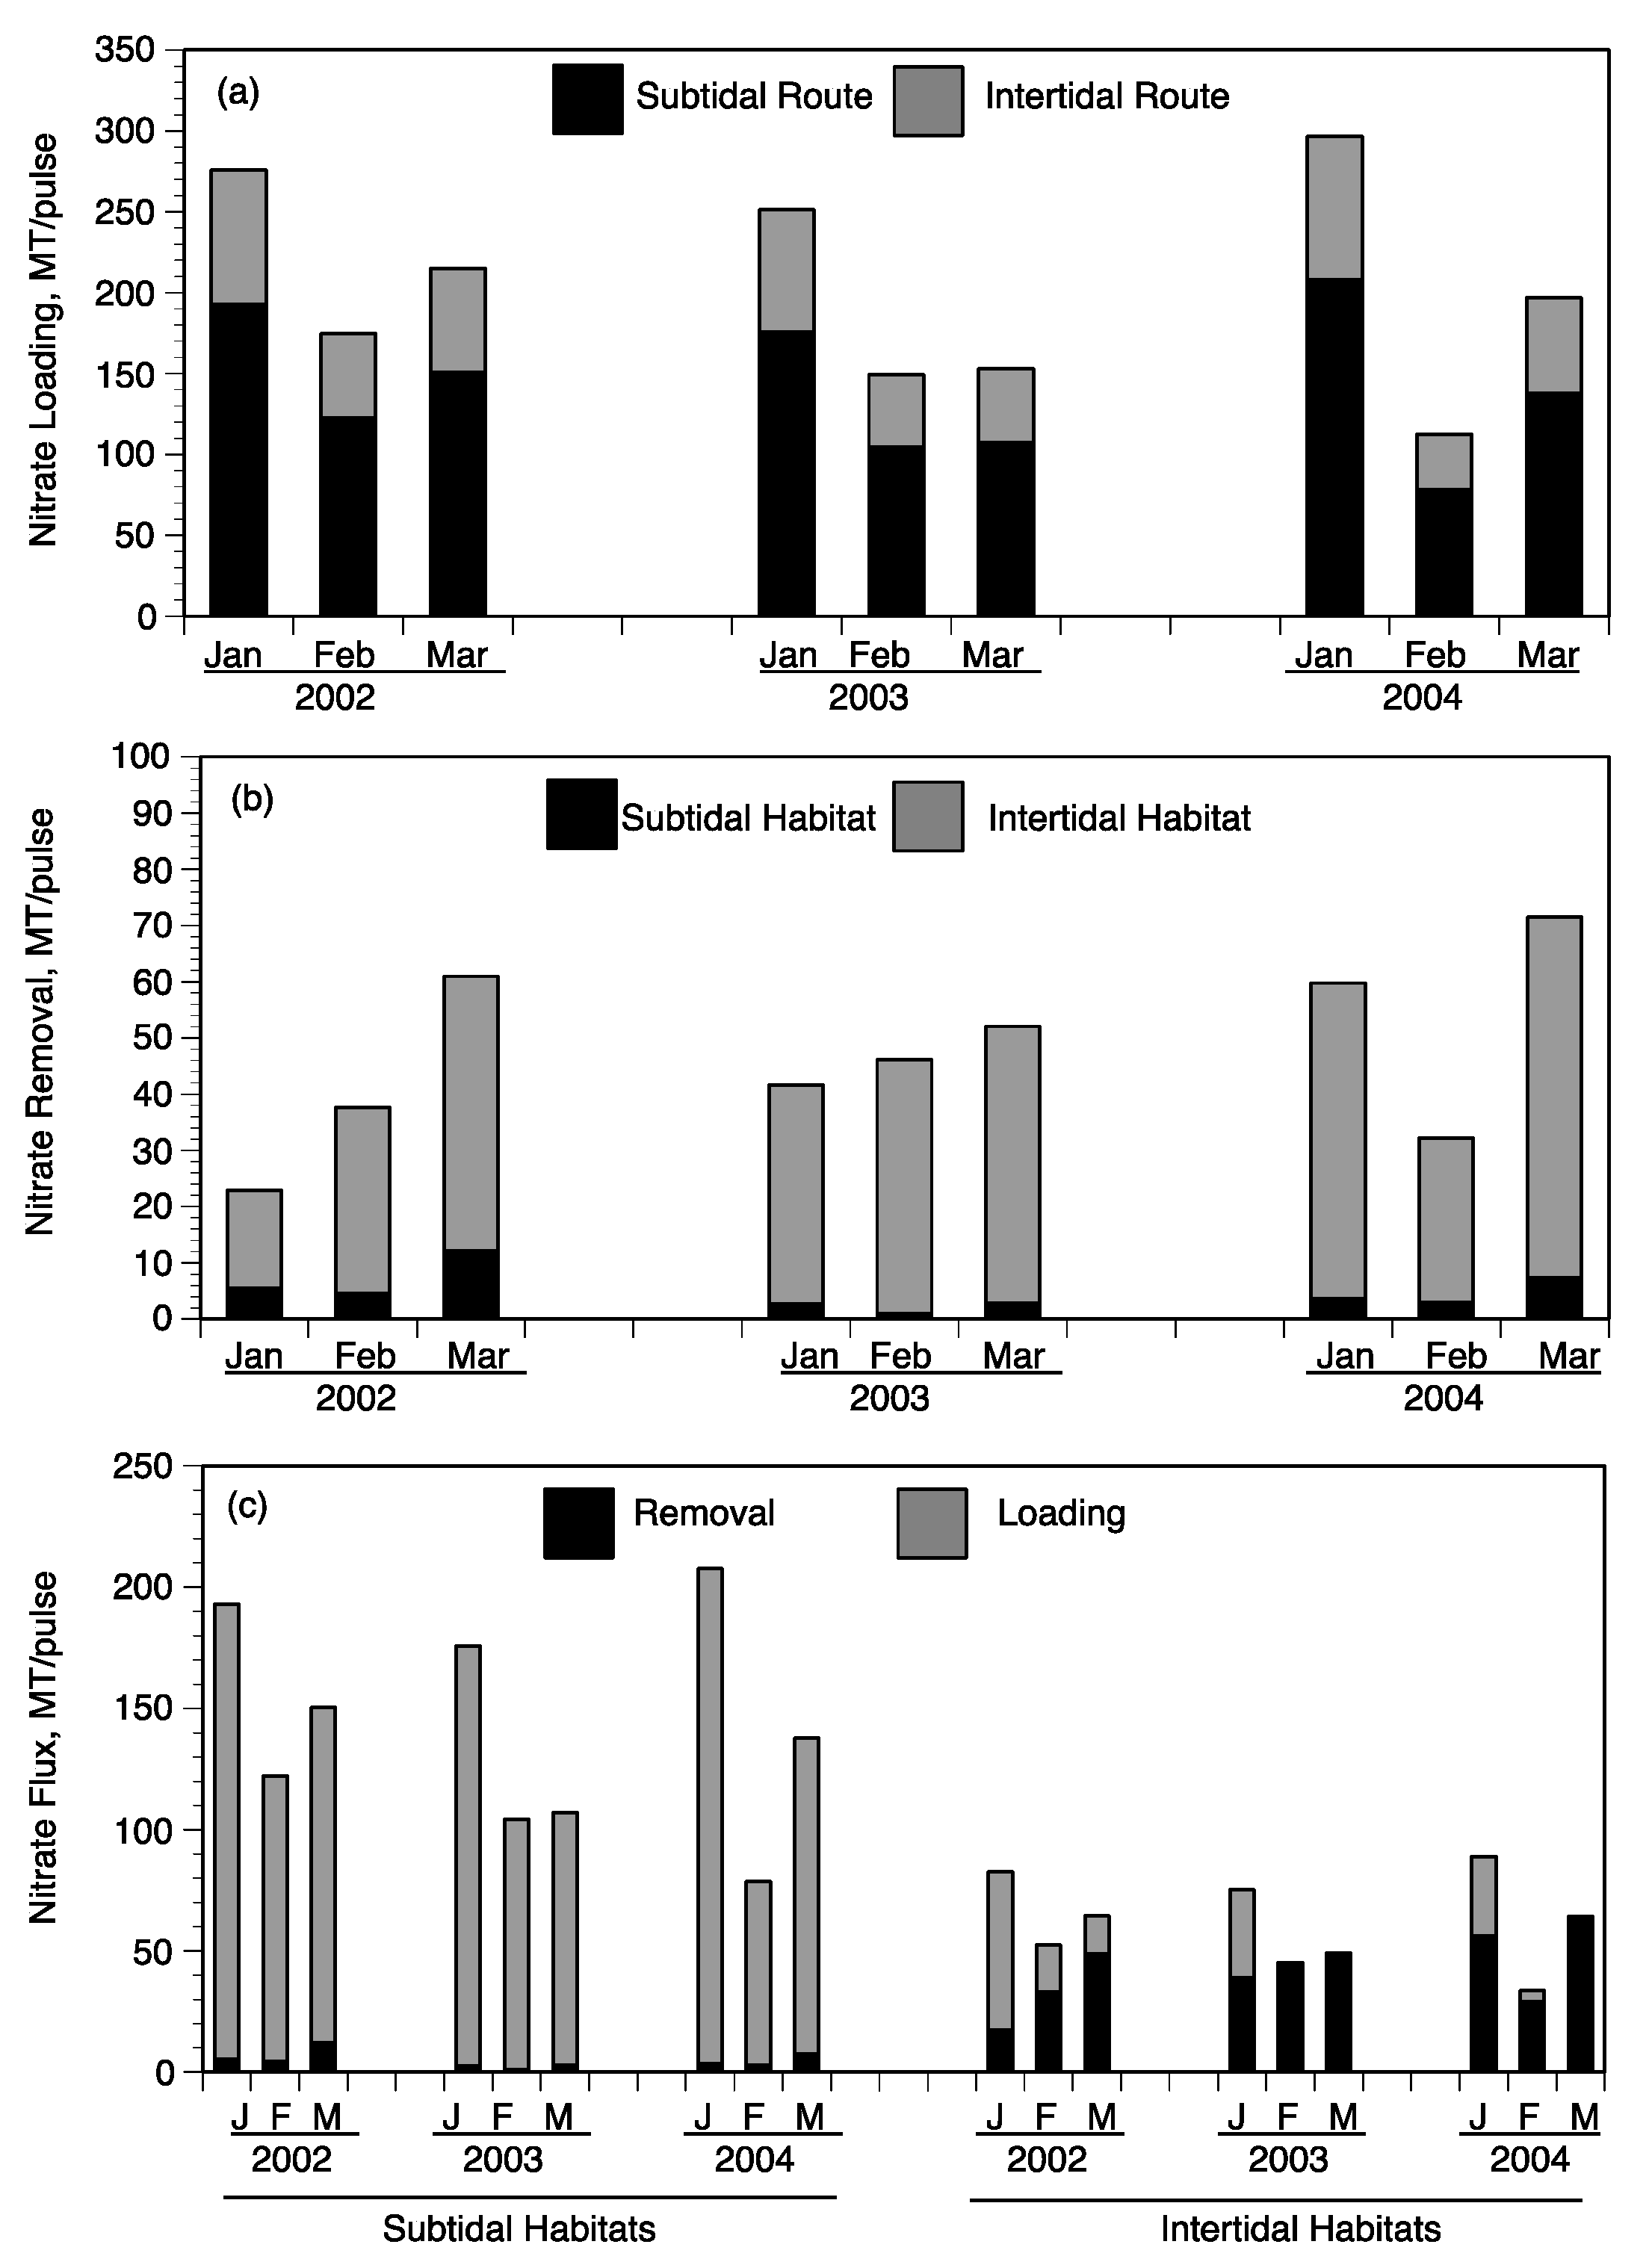
3− loading was summed for the duration of each pulse event to determine total input as MT N/pulse (
Figure 11a). The distribution of 70% to subtidal habitats and 30% to intertidal habitats was used to estimate the relative loading to each of these two habitats for each pulse (
Figure 11a). Nitrate loading was always higher in the January pulse of each year due to the longer duration ranging from 251 (2003) to 296 (2004) MT/pulse compared to lower NO
3− loading in February pulses ranging from 112 (2004) to 174 (2002) MT/pulse (
Figure 11a). The February and March pulses were shorter in duration but had greater daily discharge rates (
Figure 10a). The highest daily NO
3− loading occurred during March 2002 pulse at about 20 MT/day (
Figure 10C). Based on the 70:30 split between subtidal and intertidal flows, the majority of NO
3− per pulse came in contact with subtidal sediments ranging from 78 (February 2004) to 207 (January 2004) MT/pulse (
Figure 11a).
The contact of diversion water with subtidal habitats was considered each day during a river-pulse. The two major factors controlling NO
3− flux for both subtidal and intertidal soils were water temperature and NO
3− concentration, as described in
Section 4.1. First, water temperature had to be >13 °C for subtidal removal rates to be calculated with the function established with NO
3− concentration (see
Figure 9). The near-field subtidal habitats used water temperatures observed at Caernarvon diversion (USGS 295124089542100 Caernarvon Outfall Channel at Caernarvon, LA) and NO
3− concentration at Big Mar to calculate NO
3− fluxes using the equation in
Figure 9a. The near-field station had water temperature from Caernarvon outfall channel increased by 3 °C and NO
3− concentrations at Big Mar reduced by 20% to calculate daily NO
3− fluxes (based on changes observed in the field, see
Table 2). Daily NO
3− fluxes at far-field locations are based on adjustments to water temperature and NO
3− concentration of 7 °C and 50%, respectively (
Table 2). Using these rules, daily NO
3− fluxes were calculated for each of the three respective regions (near-, mid-, far-field), multiplied by the area of each region (
Table 5), and summed for the days of the respective nine pulse events to estimate total NO
3− removal for subtidal habitats (
Figure 11b).
Contact of waters from a river-pulse with intertidal habitats occurred only on days the daily diversion discharge reached threshold for near- and mid-field marshes described above (115 and 145 m
3/s, respectively). As stated, our calculations assume that far-field marshes were not inundated with water from the Caernarvon diversion [
13]. NO
3− concentrations used to calculate daily benthic fluxes were adjusted from those measured at Big Mar assuming a 50% reduction in concentration for waters in the near-field intertidal wetlands and 90% reduction in concentration for waters in the mid-field region. These assumptions in reducing NO
3− concentrations are based on observations at the flumes and landscape surveys in each region (
Table 3). Water temperature was not used to calculate daily benthic NO
3− fluxes, but a water temperature factor was imposed on the near-field marshes by assuming the first 150 m inland along shore was not active due to colder water temperatures. This assumption resulted in about 25% of the near-field intertidal wetlands being considered as inactive when inundation occurred. The intertidal area used in the near-field region was 3045 ha rather than the 4061 ha of near-field wetlands (
Table 5). Daily NO
3− removal for the near- and mid-field regions was calculated depending on diversion discharge (threshold that determines if intertidal habitat is inundated) and concentration (using function in
Figure 9b), then summed to estimate NO
3− removal per pulse for intertidal habitats (
Figure 11b).
The amount of NO
3− removed in the subtidal and intertidal habitats was calculated for each river-pulse event and compared to NO
3− loading to that habitat for all nine river-pulse events (
Figure 11b,c). The sum of NO
3− removed by subtidal and intertidal habitats was compared to the total NO
3− loading during each pulse event (
Figure 11c). It is important to compare the efficiency of NO
3− removed relative to the amount loaded to each respective habitat and then evaluate the total amount of NO
3− removed during any one river-pulse event. During each river-pulse event, the total amount of NO
3− removed by the intertidal habitat was much greater (17 to 64 MT/pulse) than removal by subtidal sediments (1–12 MT/pulse) (
Figure 11b). Subtidal sediments removed from 1–8% of the NO
3− loaded to channels and lakes of the outfall region of upper Breton Sound (
Figure 11c). Intertidal soils, however, removed 6–109% of the NO
3− loaded to intertidal wetlands during the nine pulse events (
Figure 11c). The lower percentage of NO
3− removal for both subtidal and intertidal soils was during the January river-pulses of each year and greater removal values occurred during the March pulses. This seasonal difference in the efficiency of NO
3− removal was particularly evident in the intertidal wetlands as demonstrated by the range of 6–19% in January compared to 76–109% in March (
Table 6).
The lower efficiencies in NO
3− removal in January compared to February and March are associated with conditions during diversion operations. One such condition is that water temperatures are colder in January, with most days <12 °C and reaching 8 °C during operations. These temperatures reduced subtidal NO
3− removal, even at the mid-field stations. The lower NO
3− removal efficiencies of intertidal wetland soils were not due to such a factor as water temperature since the shallow water would heat up to >12 °C within 150 m transport across the wetland surface. However, diversion discharge rates in January, particularly in 2002, did not reach the thresholds for wetland inundation. The intertidal NO
3− removal efficiency in January 2002 was only 6% and 16% in January 2003. At higher daily discharge rates in February and March of 2003 and 2004, nearly all the NO
3− that was loaded into intertidal wetlands was removed (
Figure 11c). These estimates are consistent with both the observations of NO
3− concentrations at the mid-field flume and landscape surveys.
Total NO
3− removal ranged from a low of 22.99 MT/pulse in January 2002 to high of 71.51 MT in March 2004 (
Figure 11b). These ranges are also the river-pulses when the lowest and highest of total NO
3− removal efficiencies occurred (8–36%,
Table 6). Removal efficiencies were much greater in March and February than January, associated with factors of temperature and frequency of wetland inundation noted in previous paragraph. These total NO
3− removal efficiencies are much lower than the 55–86% removal based on changes in NO
3− concentration in the upper Breton Sound outfall region [
26,
30,
62]. These reported removal efficiencies consider the differences in upstream and downstream concentrations of NO
3− accounting for dilution using salinity as a conservative constituent. Estimates of NO
3− removal in this study only consider the contribution of benthic NO
3− fluxes as the removal process. All our experiments were run with filtered overlying water in cores incubated in the dark to exclude water column processing of nutrients in our experimental system. Water-column phytoplankton as well as heterotrophs may compete for the dissolved NO
3− in the water, with rates under strong control of water temperature. During higher standing stocks of phytoplankton in March, this competition may significantly contribute to NO
3− removal within the system, and thus concentrations in upstream and downstream stations. In those situations, estimates of system NO
3− removal may be underestimated by sediment fluxes alone. Phytoplankton serve only as a temporary sink for NO
3−, while NO
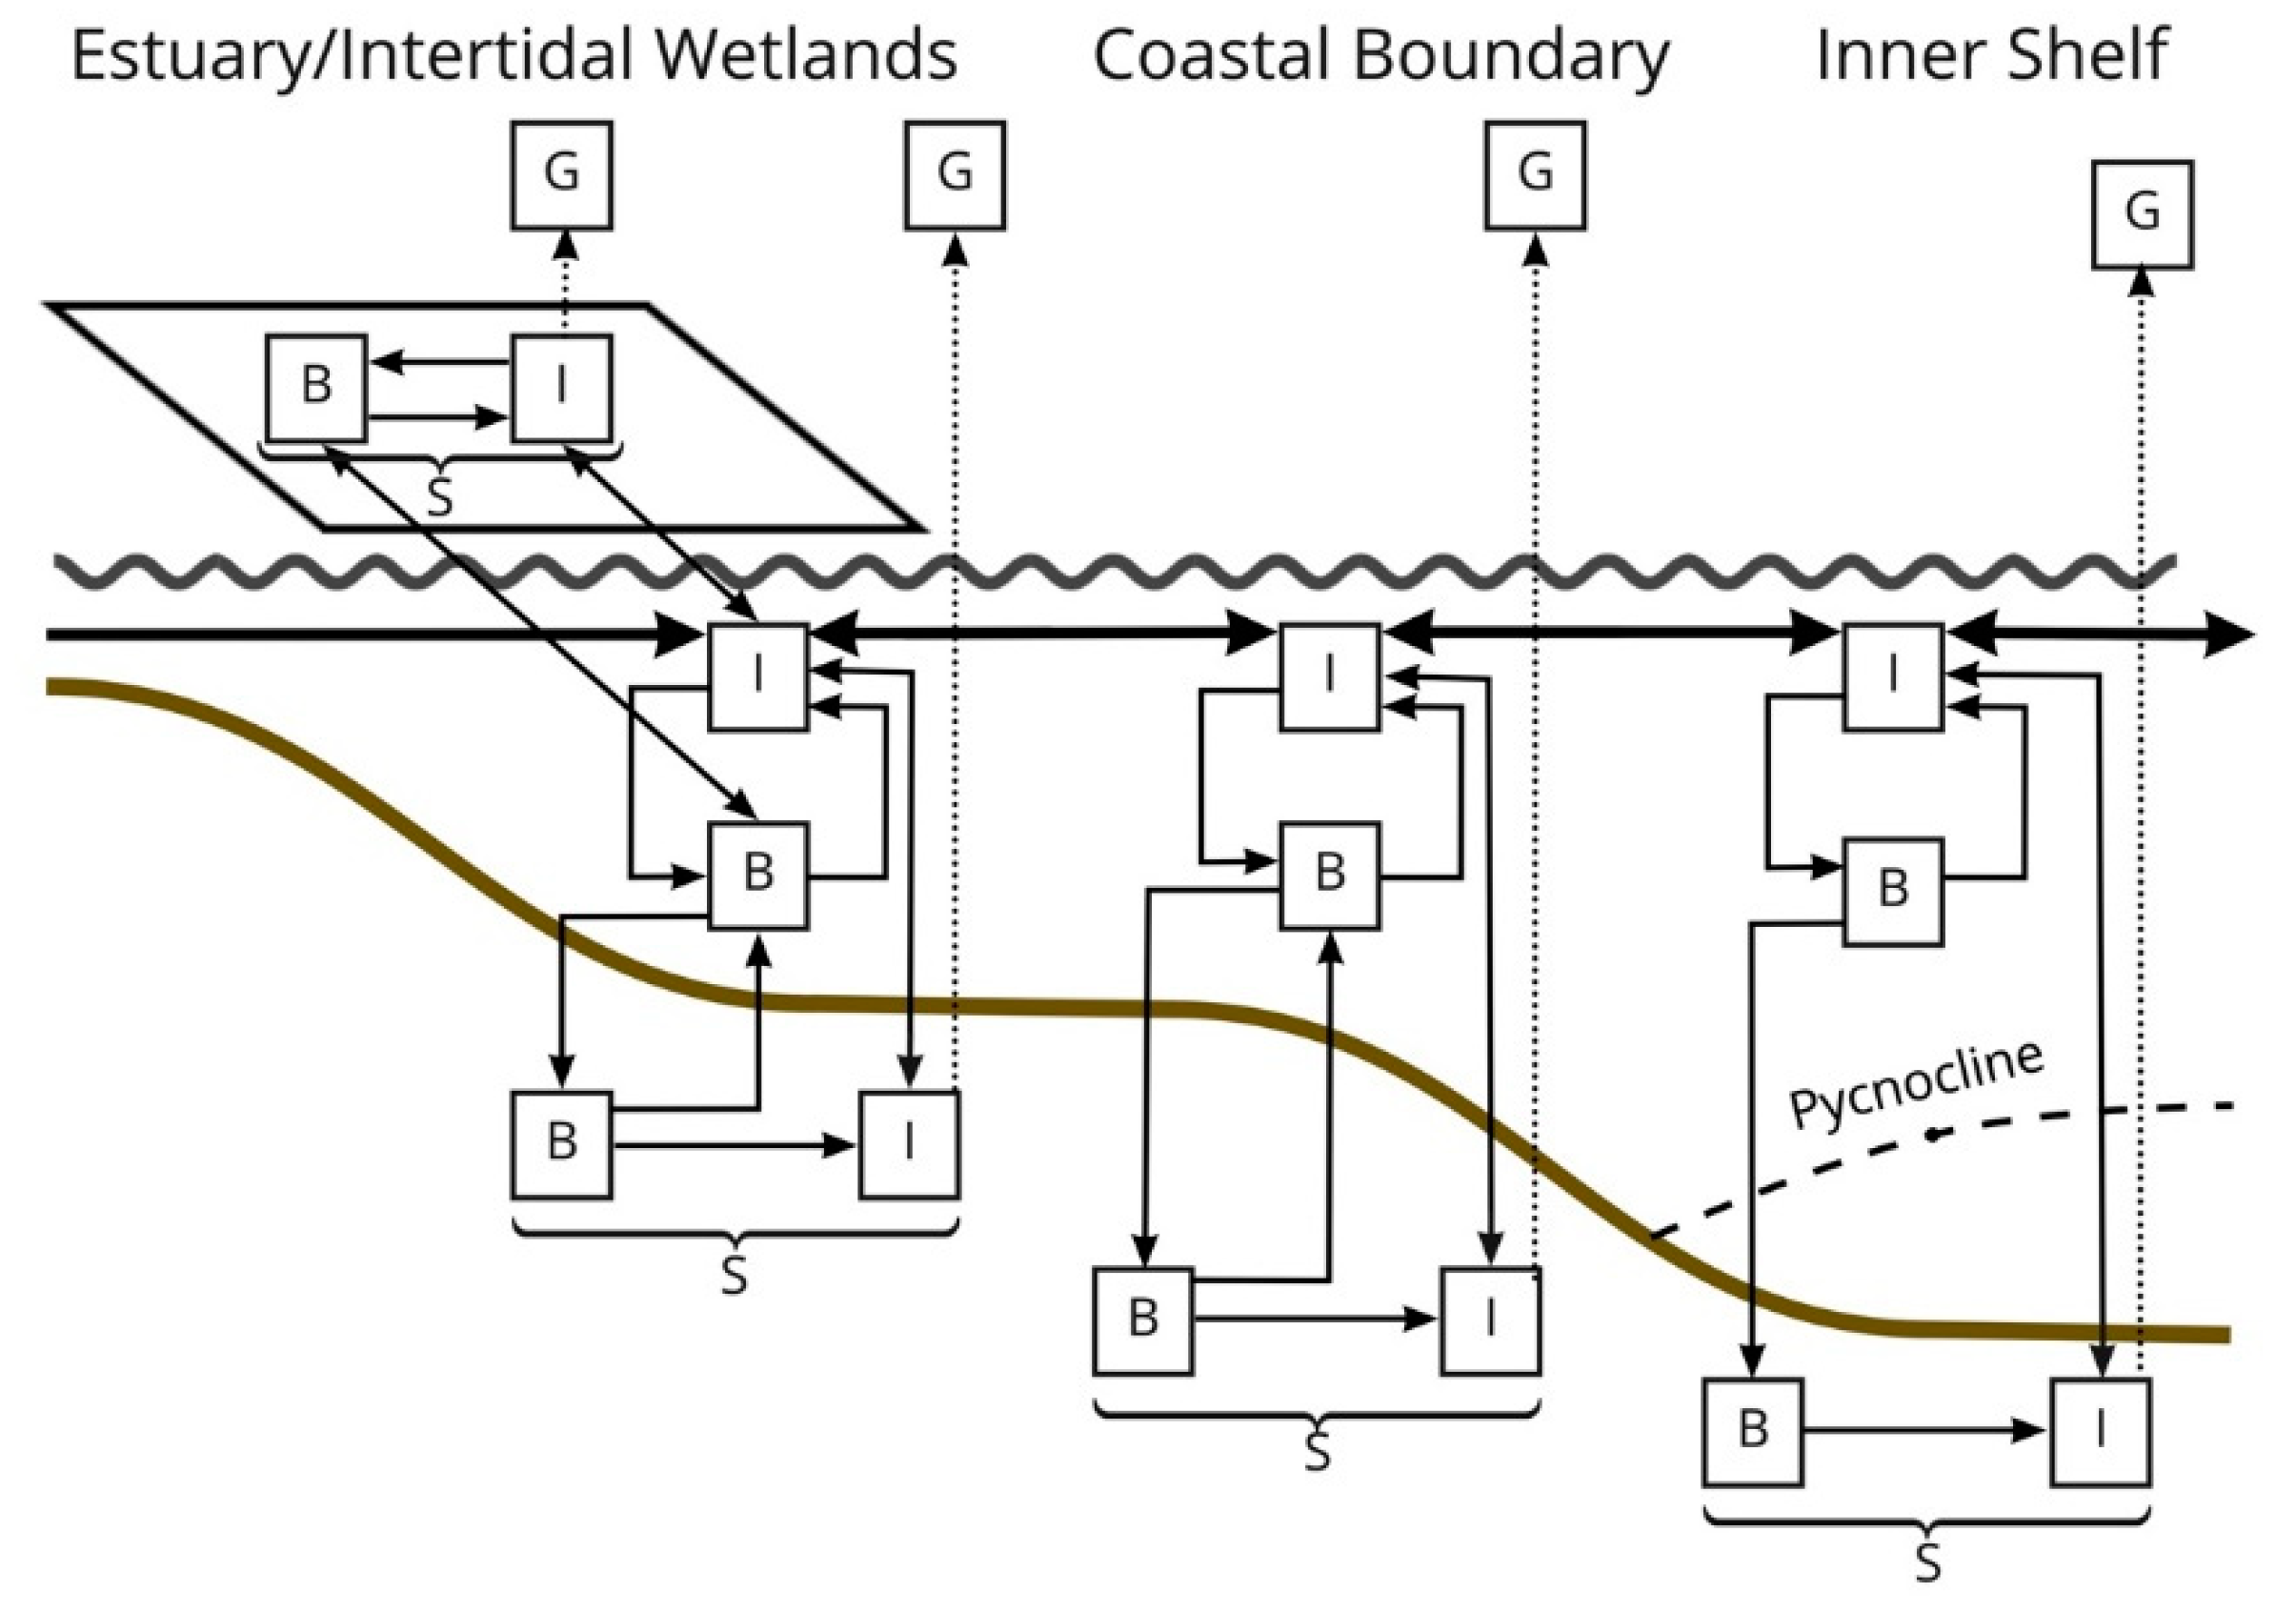
3− taken up by the sediments can be denitrified, thus providing a more permanent sink. Plankton organisms convert inorganic N to biogenic N (
Figure 1) that can be cycled through the food chain, excreted as NH
4 or DON, or exported with tidal flux out of the estuary. Biogenic N deposited on the sediment surface can be buried over time and provide a permanent sink of the river-derived nitrogen.
Following the fate of NO
3− during river-pulse events in upper Breton Sound using the methods described in this study does not account for the net flux of total nitrogen (TN) during these events. The loss of TN in the outfall region has been noted to average about 50% [
26,
30,
62], based on the decrease in concentration greater than the dilution with seawater downstream from the diversion input. It is obvious in our few sediment flux observations that while there may be a net uptake of NO
3− and dissolved inorganic nitrogen (DIN) by subtidal and intertidal soils, there were several observations of significant efflux of DON. At times, the DON efflux was greater than DIN influx. This pattern is consistent with many reports that wetland ecosystems may transform nutrients in estuaries with net uptake (removal) of DIN and export of organic nitrogen [
41,
50,
63]. Fluxes of DIN, made up mostly of NO
3− in our study, were dominated by intertidal soils, while DON was released from the soil into the water column. A comparison of the rates of DIN uptake and DON release by intertidal soils showed that the intertidal habitat acted as a sink for dissolved nitrogen, with uptake rates ranging from 11.5 to 25.3 g N m
−2 yr
−1. Various estimates of TN uptake across the upper Breton Sound outfall areas range from 2.3 g N m
−2 yr
−1 [
64] and 5.6 g N m
−2 yr
−1 [
26] to 13.4 g N m
−2 yr
−1 [
30]. Scaling all the different processes of nitrogen species from inorganic to organic to nitrogen gas will require better documentation to determine how subtidal and intertidal habitats contribute to the net sink, source or transformer of nitrogen introduced from river-pulse events. However, the contributions of benthic fluxes estimated in this study highlight the loss of NO
3− in the system, which is the major source of nitrogen from the river for downstream estuarine waters.


