
Estimation of the G2P Design Storm from a Rainfall Convectivity Index


Abstract
1. Introduction
2. Rainfall Characterization
2.1. Selection of an Irregularity Index for the Storm Temporal Structure
2.2. Rainfall Data
2.3. Return Period Assignment
3. G2P Design Storm Estimation from the Rainfall Convectivity n-Index
3.1. G2P Design Storm: Analytical Definition
3.2. Relationship between the G2P Shape Parameter and the n-Index
3.3. Practical Estimation of the G2P Design Storm for Urban Drainage Applications
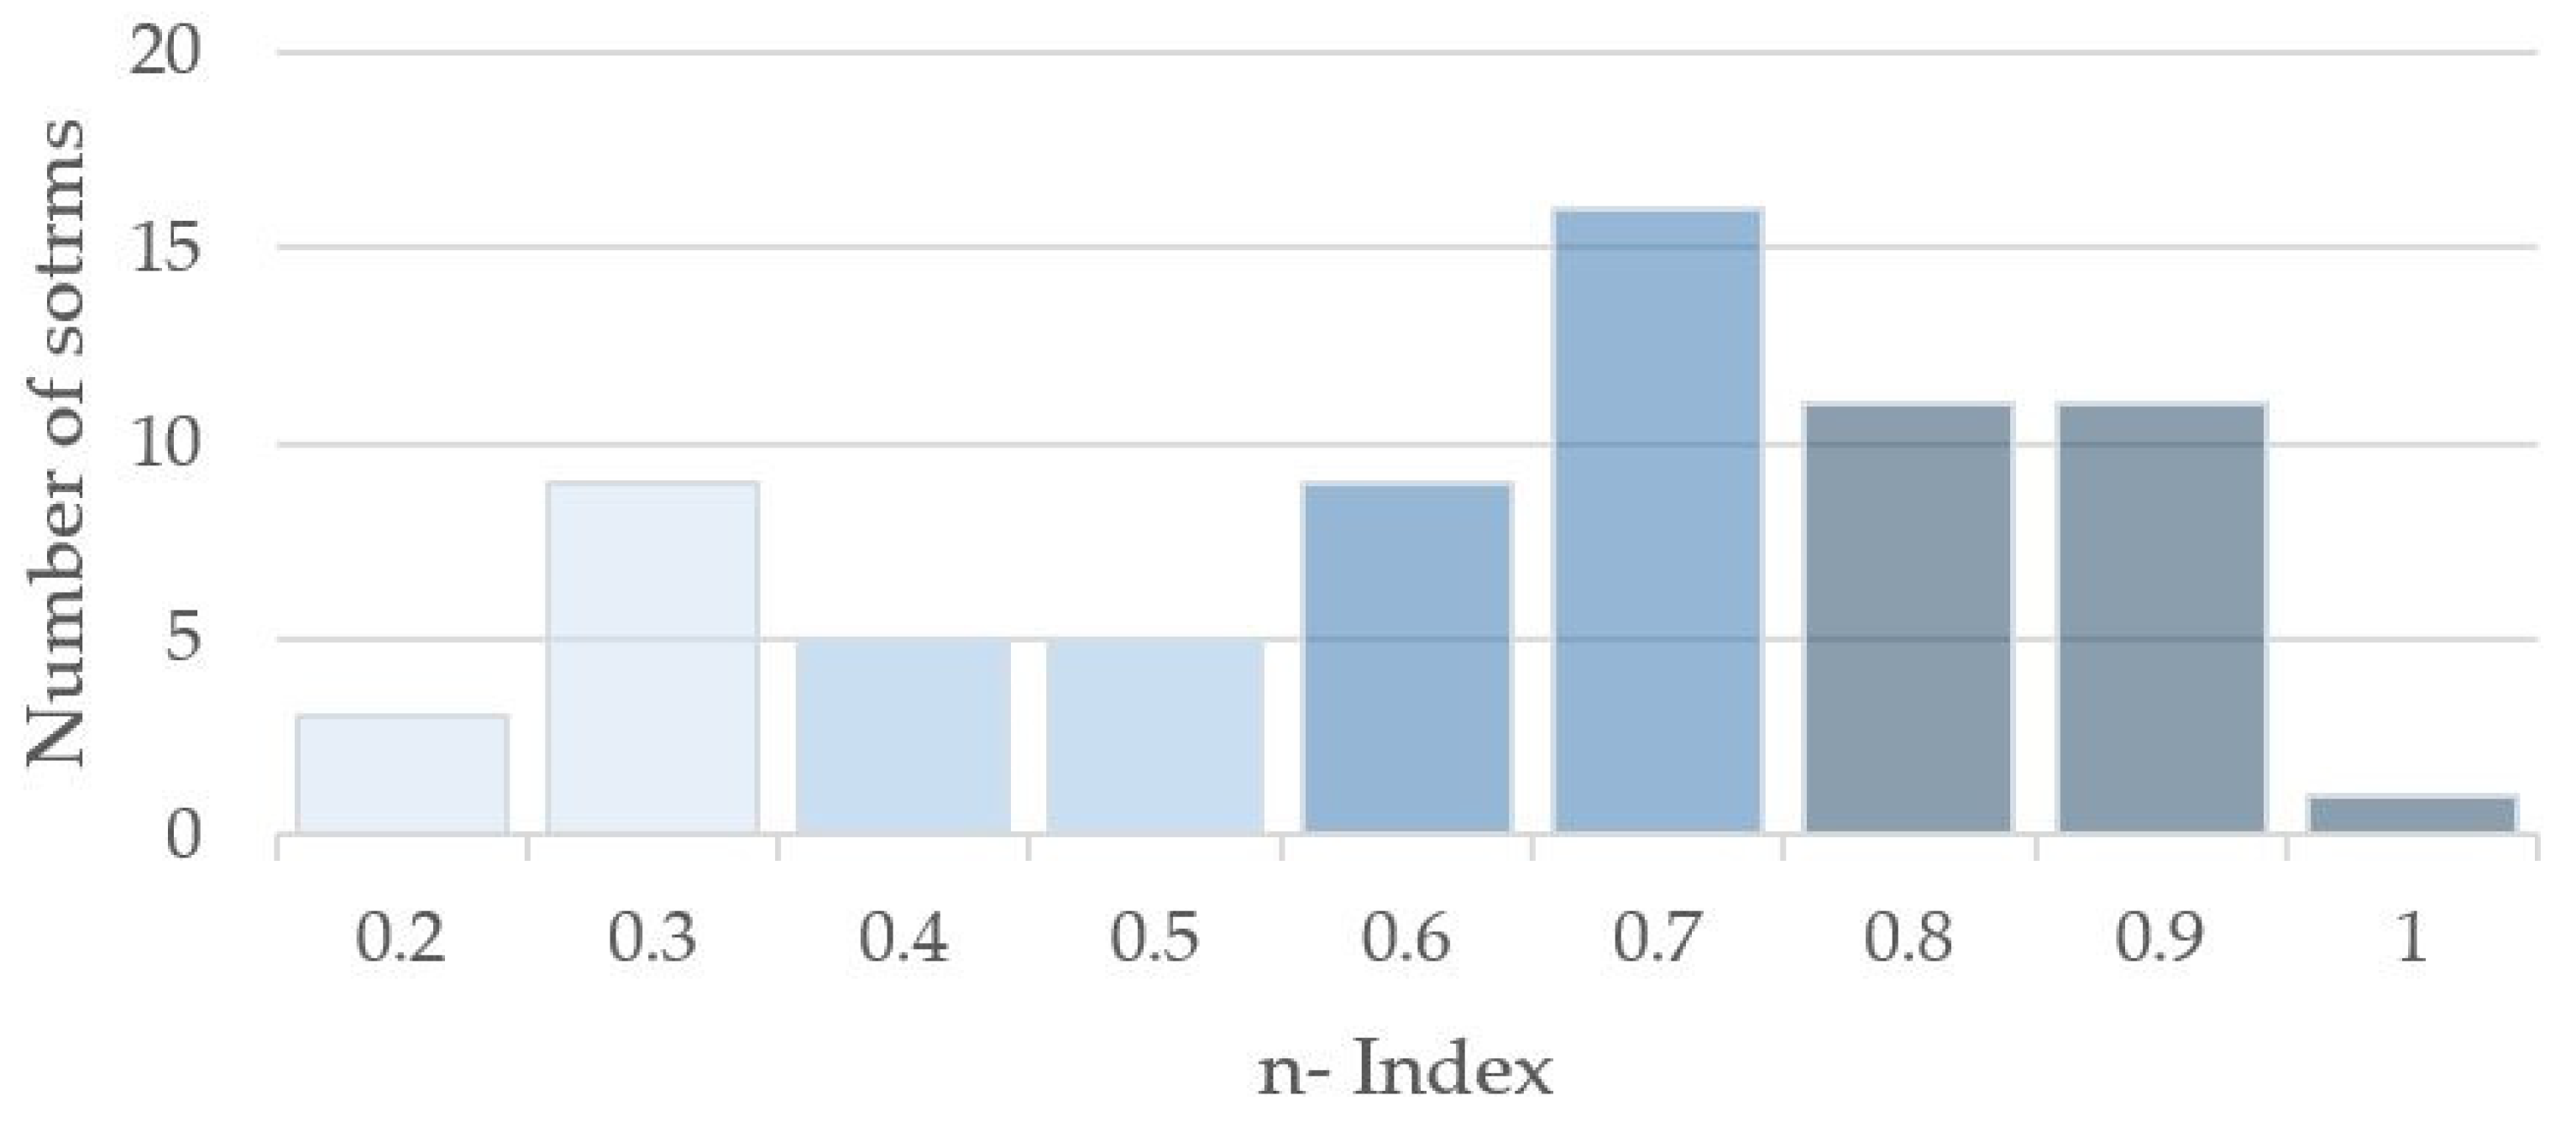
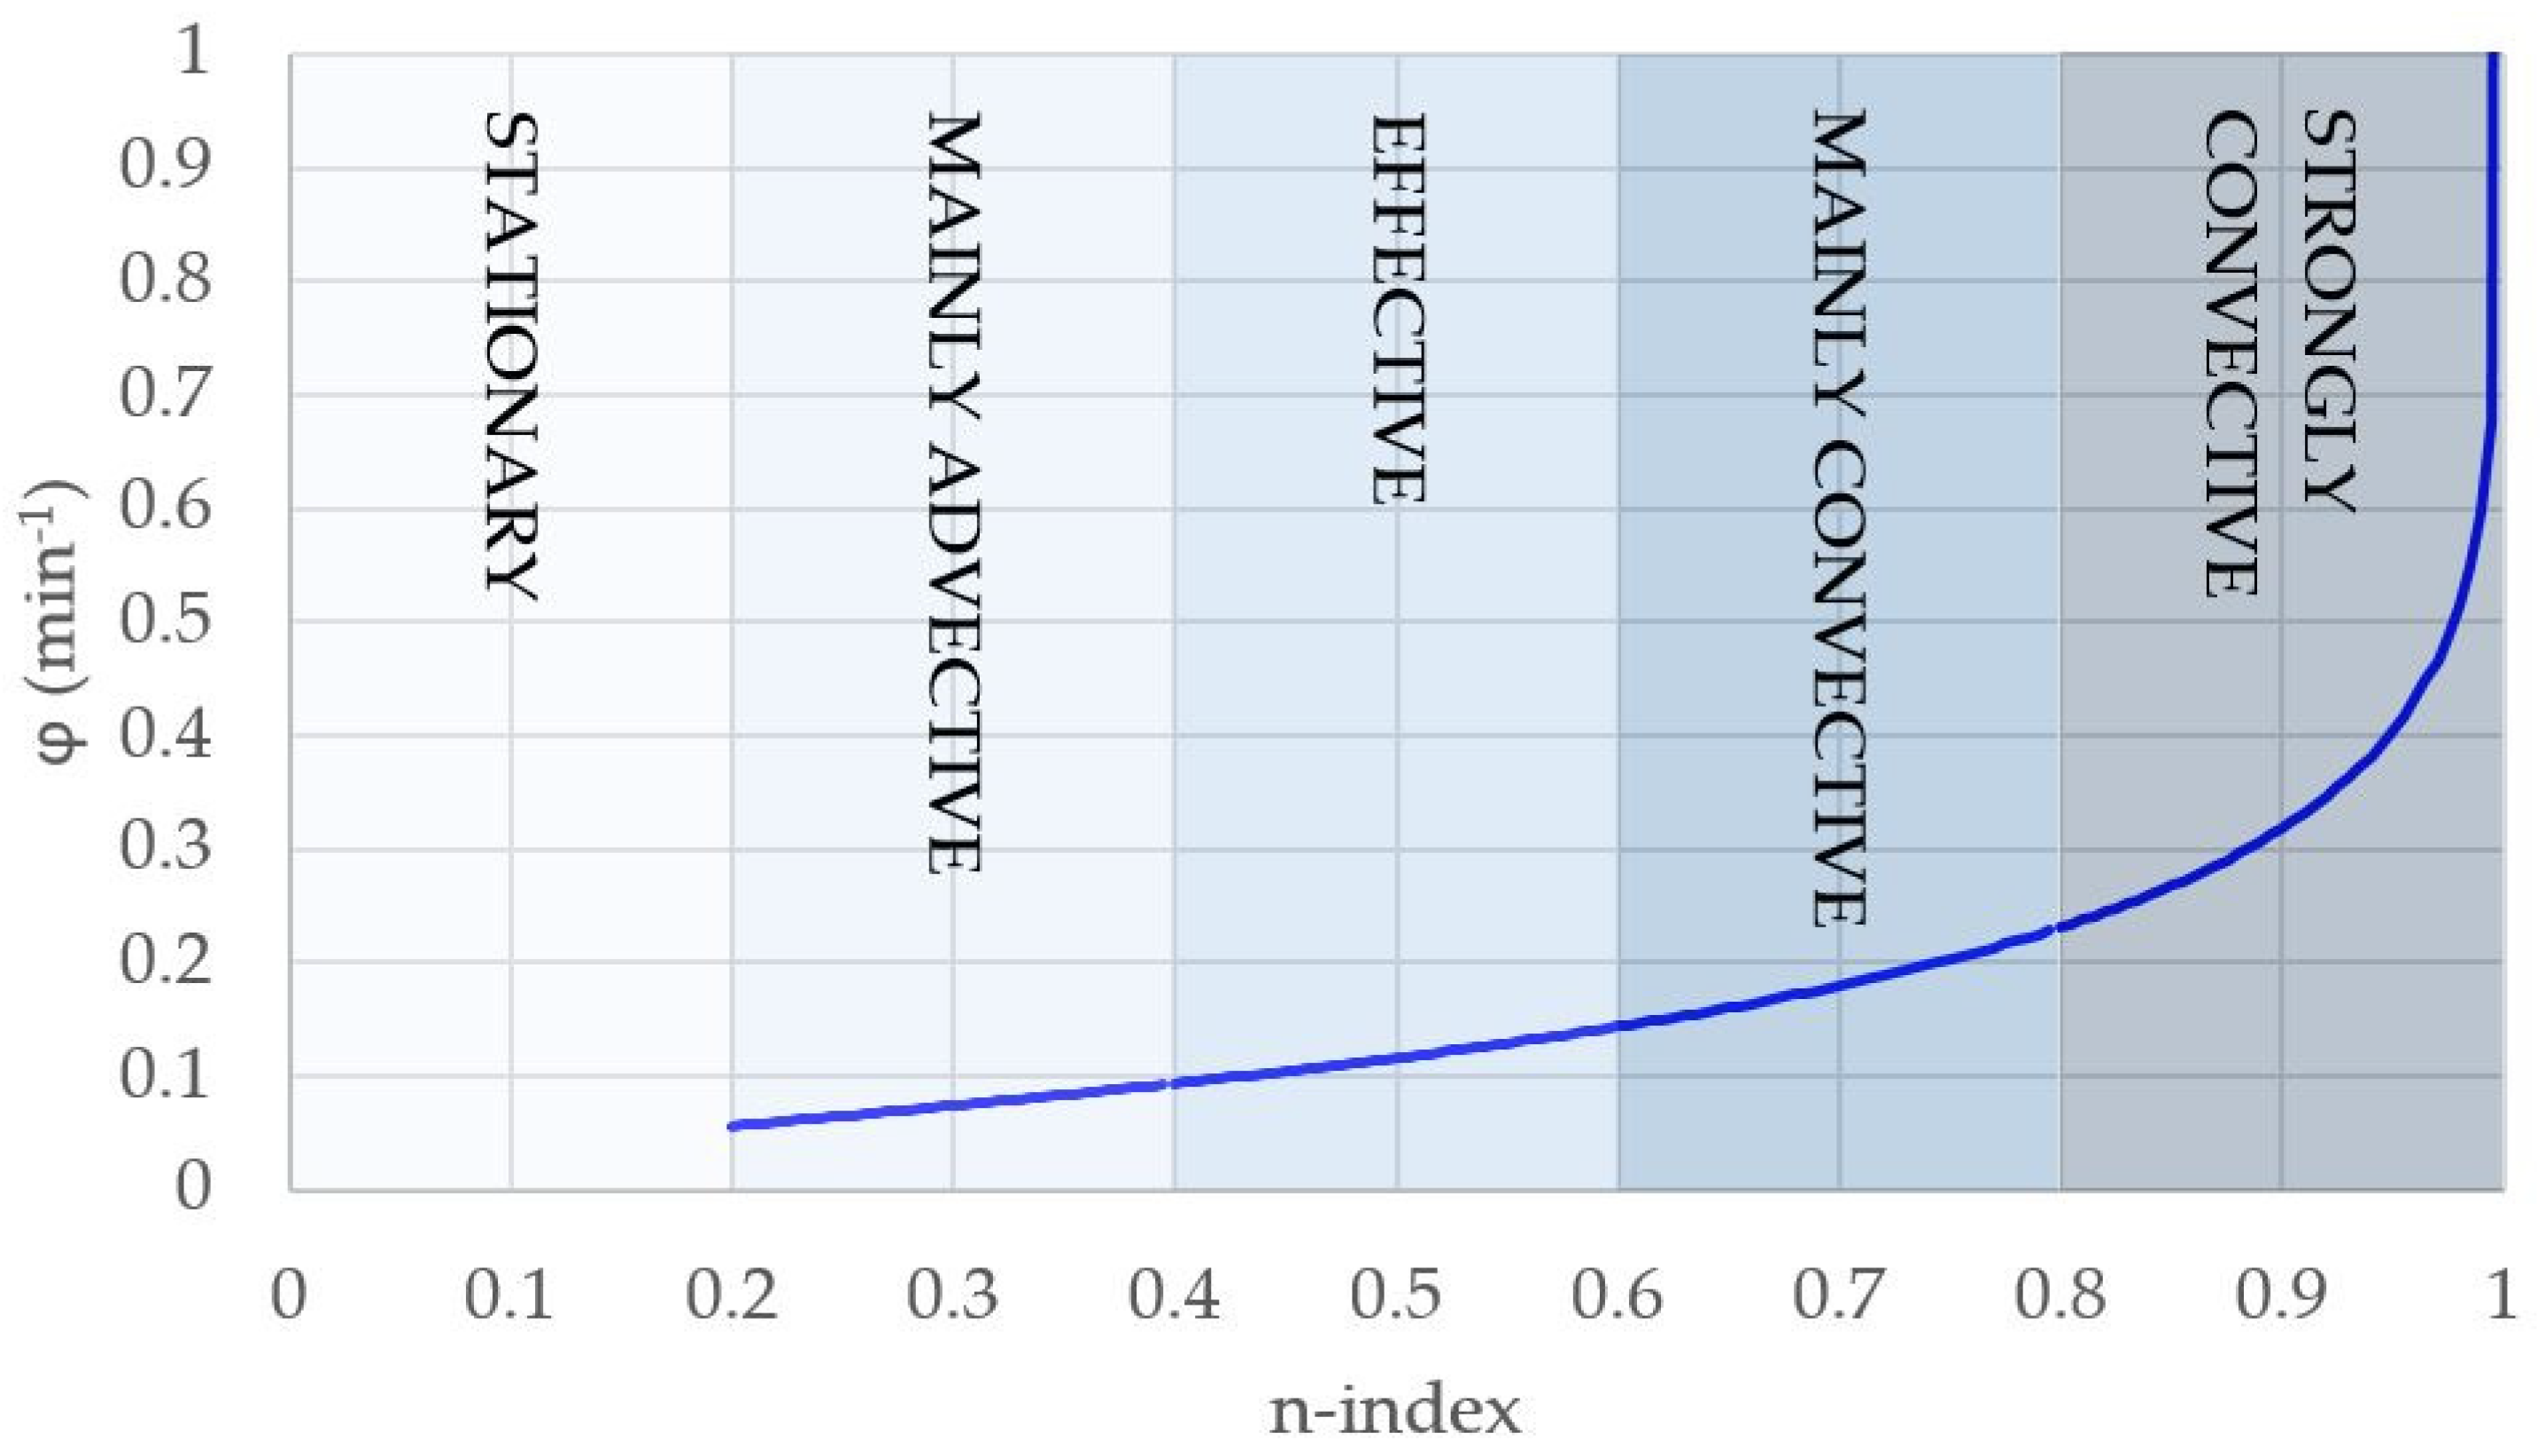
- Shape parameter, φ (min−1). It derives directly from the possible convectivity quantified in through the n-index, using Equation (11). Figure 6 shows the distribution of n-index values for the particular case study analysed herein. For each of the classes assumed, a representative central n-index value is adopted, i.e., n = 0.3, 0.5, 0.7 and n = 0.9. Different probabilities of occurrence might be assigned through the empirical histogram shown in Figure 4. In any case, Equation (11) provides a unique φ value for each of the selected n-index values. Table 6 shows the G2P shape parameter assigned to each of the representative n-index values.
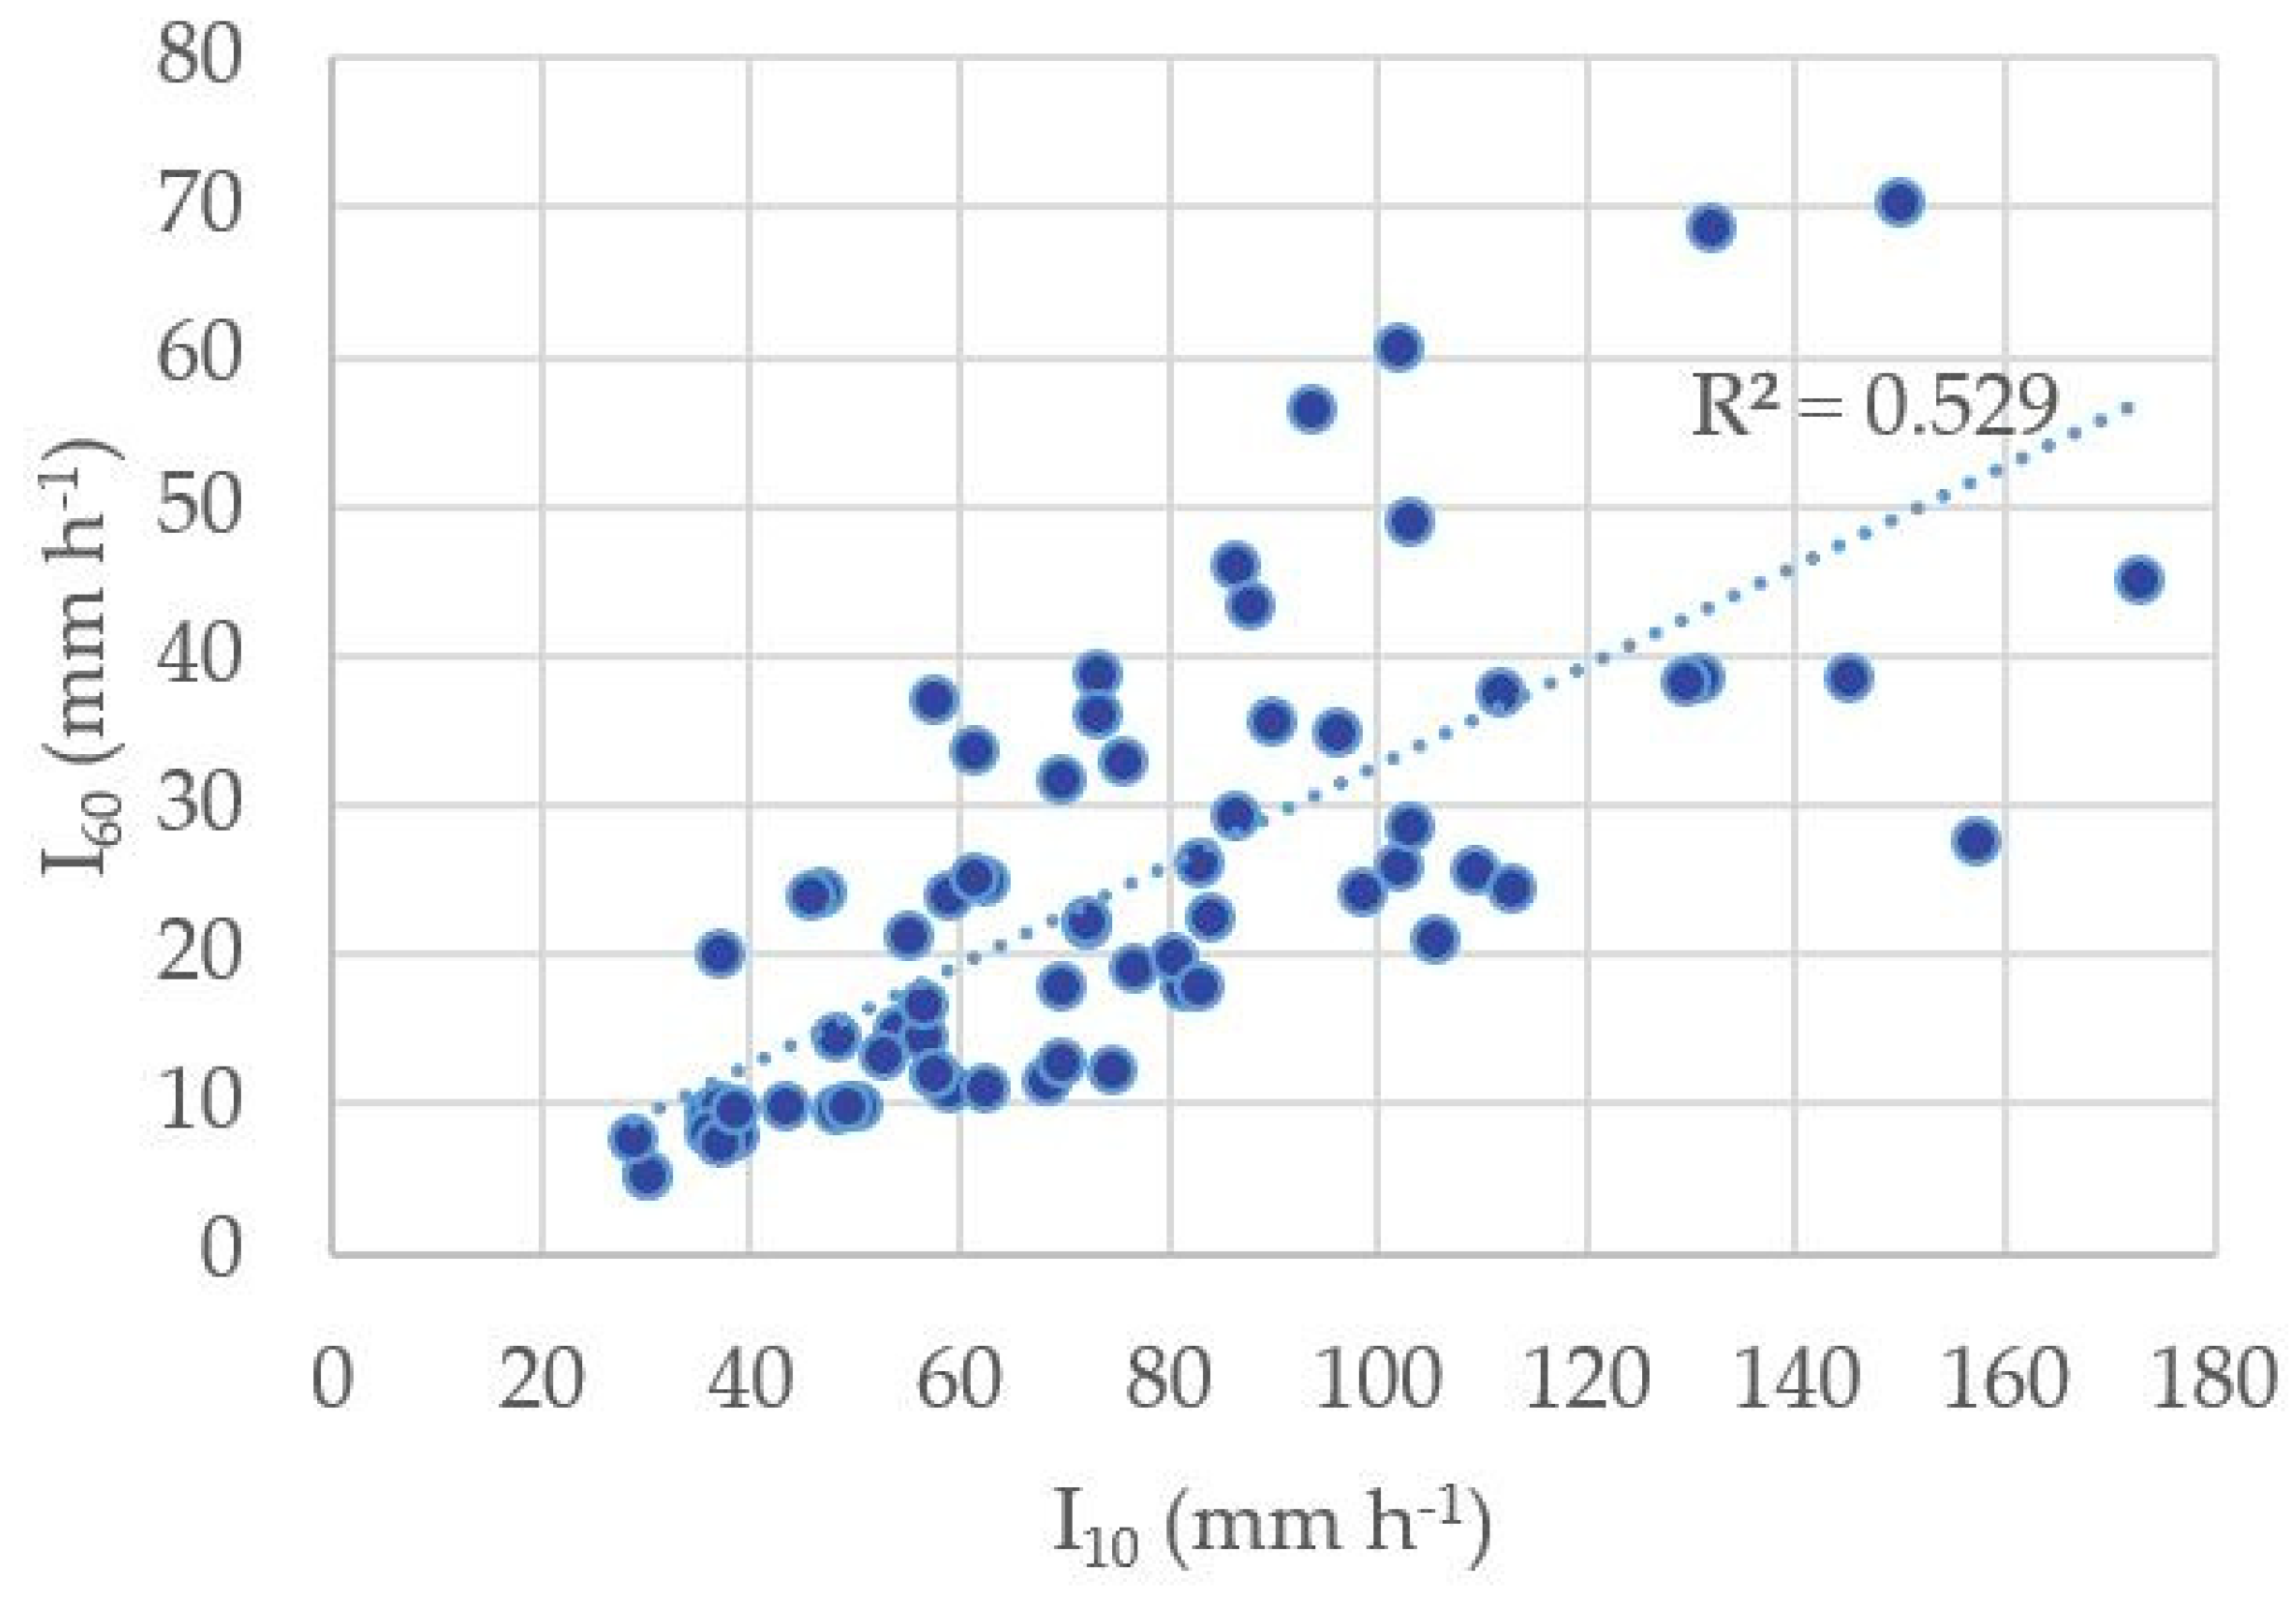
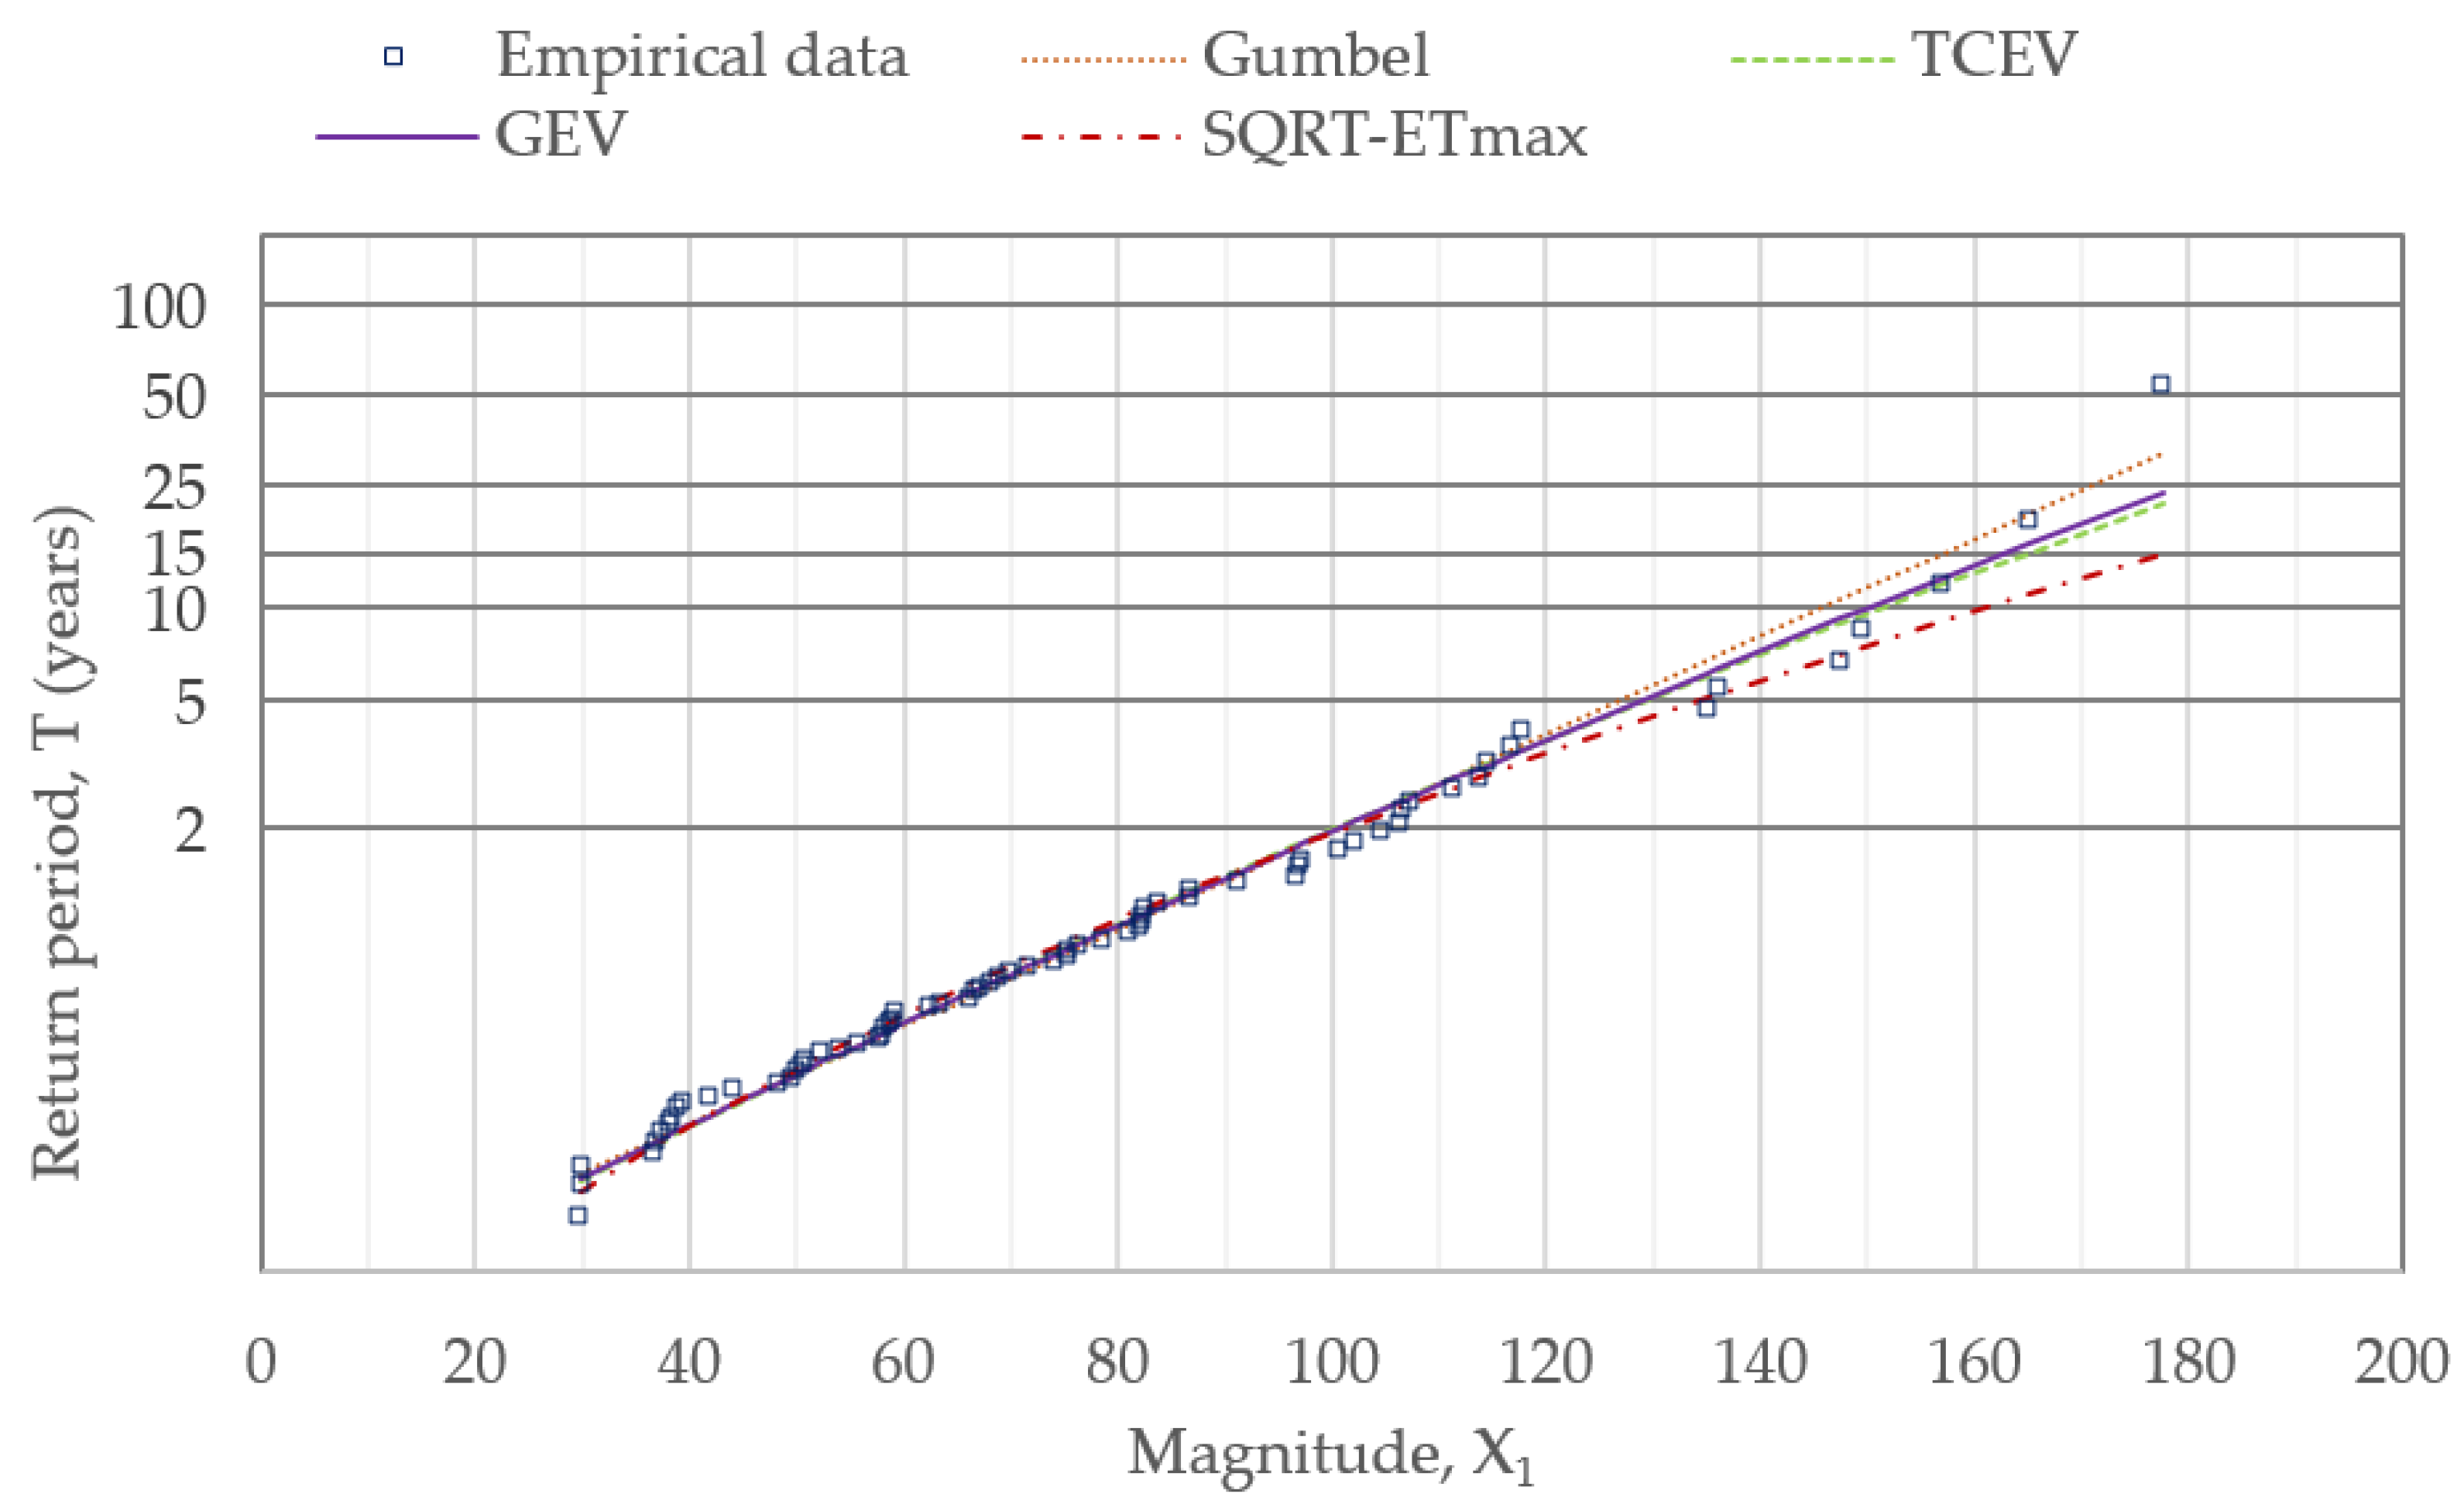
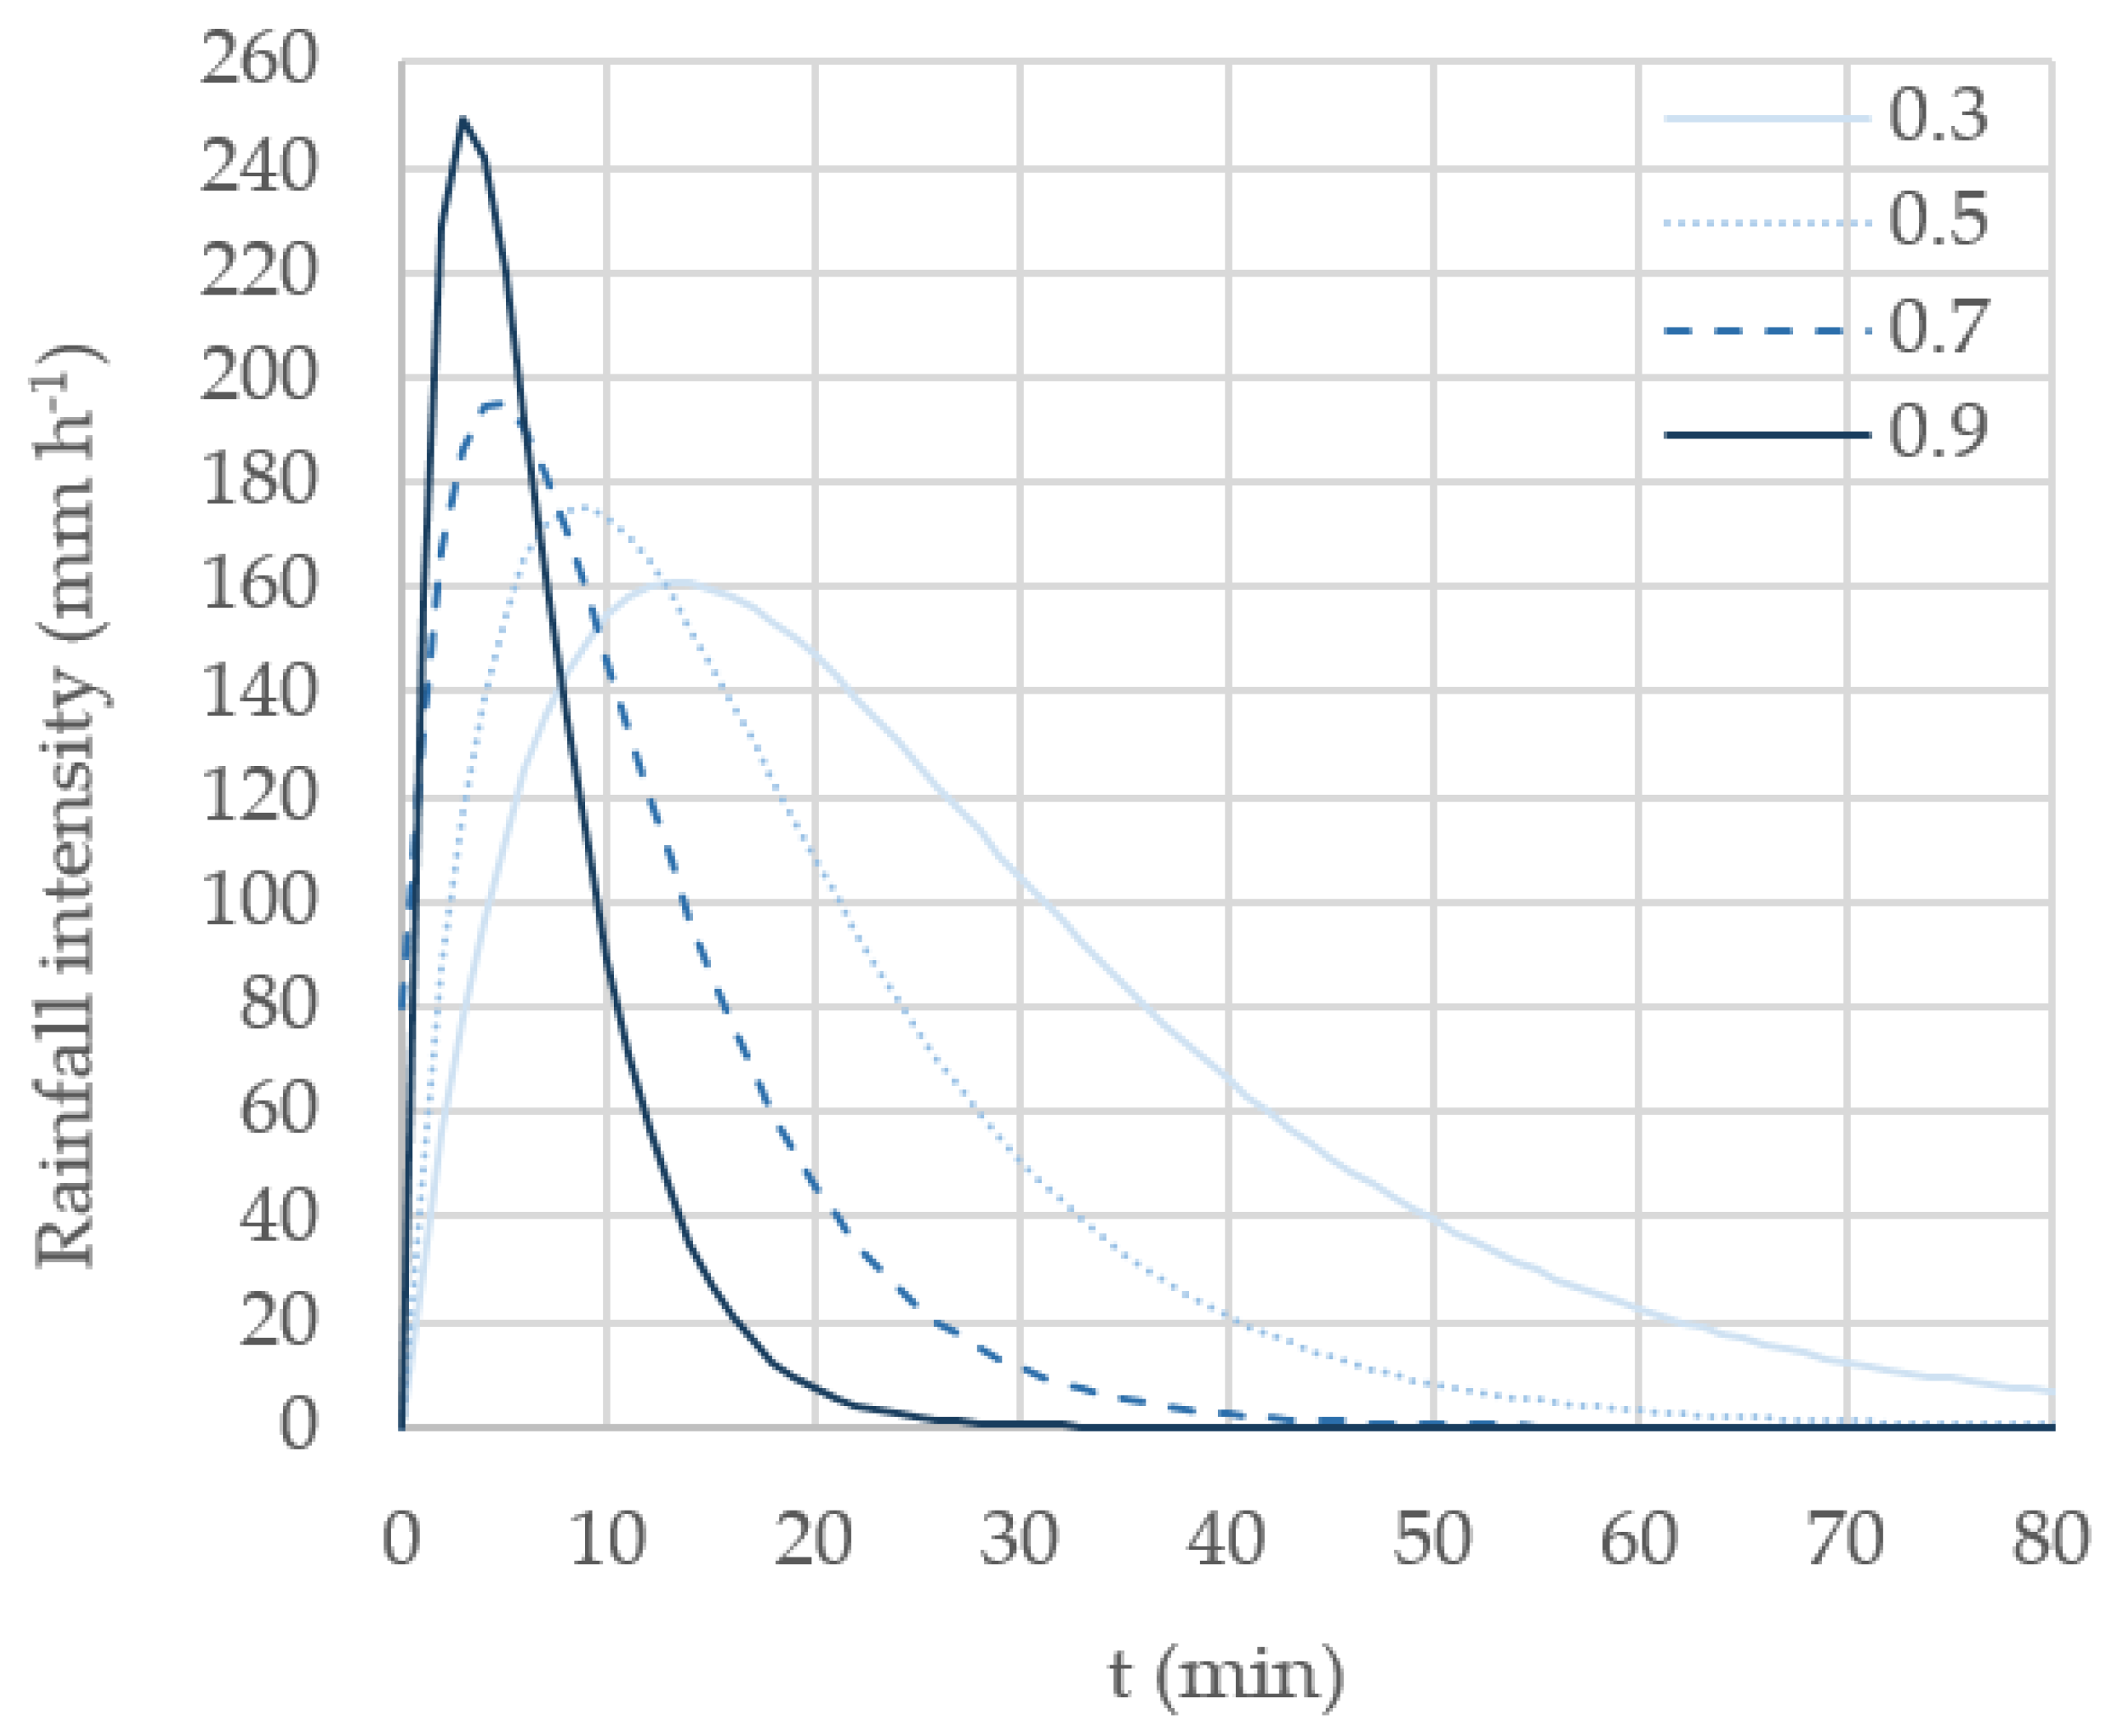
- Scale parameter, i0 (mm h−1). It basically depends on the return period. For T = 25 years, an X1 quantile is estimated (Table 5): X1 = 179.20. Then, solving Equations (2) and (9), we obtain I10 = 157.27 mm h−1 and I60 = 91.88 mm h−1. Finally, i0 is obtained from Equation (7), using either Δt = 10 min or Δt = 60 min. The resultant estimated values for the scale parameters are: i0 = 160.90 mm h−1 (for n = 0.3); i0 = 175.33 mm h−1 (for n = 0.5); i0 = 195.72 mm h−1 (for n = 0.7); i0 = 249.55 mm h−1 (for n = 0.9).
4. Conclusions
Author Contributions
Funding
Institutional Review Board Statement
Informed Consent Statement
Data Availability Statement
Acknowledgments
Conflicts of Interest
References
- Pulhin, J.M.; Inoue, M.; Shaw, R.; Pangilinan, M.J.Q.; Catudio, M.L.R.O. Climate Change and Disaster Risks in an Unsecured World. In Climate Change, Disaster Risks, and Human Security; Pulhin, J.M., Inoue, M., Shaw, R., Eds.; Springer: Singapore, 2021; pp. 1–19. [Google Scholar]
- Seneviratne, S.I.; Nicholls, N.; Easterling, D.; Goodess, C.M.; Kanae, S.; Kossin, J.; Luo, Y.; Marengo, J.; McInnes, K.; Rahimi, M. Changes in climate extremes and their impacts on the natural physical environment. In Managing the Risks of Extreme Events and Disasters to Advance Climate Change Adaptation; Field, C.B., Barros, V., Stocker, T.F., Qin, D., Dokken, D.J., Ebi, K.L., Mastrandrea, M.D., Mach, K.J., Plattner, G.-K., Allen, S.K., et al., Eds.; A Special Report of Working Groups I and II of the Intergovernmental Panel on Climate Change (IPCC); Cambridge University Press: Cambridge, UK; New York, NY, USA, 2012; pp. 109–230. [Google Scholar]
- Westra, S.; Fowler, H.J.; Evans, J.P.; Alexander, L.V.; Berg, P.; Johnson, F.; Kendon, E.J.; Lenderink, G.; Roberts, N.M. Fu-ture Changes to the Intensity and Frequency of Short-Duration Extreme Rainfall. Rev. Geophys. 2014, 52, 522–555. [Google Scholar] [CrossRef]
- Myhre, G.; Alterskjær, K.; Stjern, C.W.; Hodnebrog, Ø.; Marelle, L.; Samset, B.H.; Sillmann, J.; Schaller, N.; Fischer, E.; Schulz, M.; et al. Frequency of extreme precipitation increases extensively with event rareness under global warming. Sci. Rep. 2019, 9, 1–10. [Google Scholar] [CrossRef]
- Hannaford, J.; Marsh, T.J. High-flow and flood trends in a network of undisturbed catchments in the UK. Int. J. Clim. 2008, 28, 1325–1338. [Google Scholar] [CrossRef]
- Volosciuk, C.; Maraun, D.; Semenov, V.A.; Tilinina, N.; Gulev, S.K.; Latif, M. Rising Mediterranean Sea Surface Temperatures Amplify Extreme Summer Precipitation in Central Europe. Sci. Rep. 2016, 6, 32450. [Google Scholar] [CrossRef]
- Forestieri, A.; Caracciolo, D.; Arnone, E.; Noto, L. Derivation of Rainfall Thresholds for Flash Flood Warning in a Sicilian Basin Using a Hydrological Model. Procedia Eng. 2016, 154, 818–825. [Google Scholar] [CrossRef]
- Cipolla, G.; Francipane, A.; Noto, L.V. Classification of Extreme Rainfall for a Mediterranean Region by Means of Atmos-pheric Circulation Patterns and Reanalysis Data. Water Resour. Manag. 2020, 34, 3219–3235. [Google Scholar] [CrossRef]
- Kuichling, E. The Relation between the Rainfall and the Discharge of Sewers in Populous Districts. Trans. Am. Soc. Civ. Eng. 1889, 20, 1–56. [Google Scholar] [CrossRef]
- Yen, B.C.; Chow, V.T. Closure to “Design Hyetographs for Small Drainage Structures”. J. Hydraul. Div. 1981, 107, 945–946. [Google Scholar] [CrossRef]
- Sifalda, V. Entwicklung eines Berechnungsregens für die Bemessung von Kanalnetzen. Gwf-Wasser/Abwasser 1973, 114, 435–440. (In German) [Google Scholar]
- Desbordes, M. Urban Runoff and Design Storm Modelling. In Proceedings of the International Conference on Urban Storm Drainage, Southampton, UK, 11–14 April 1978; Pentech Press: London, UK, 1978; pp. 353–361. [Google Scholar]
- Watt, W.E.; Chow, K.C.A.; Hogg, W.D.; Lathem, K.W. A 1-h urban design storm for Canada. Can. J. Civ. Eng. 1986, 13, 293–300. [Google Scholar] [CrossRef]
- Keifer, C.J.; Chu, H.H. Synthetic Storm Pattern for Drainage Design. J. Hydraul. Div. 1957, 83, 1332. [Google Scholar] [CrossRef]
- Te Chow, V.; Maidment, D.R.; Mays, L.W. Applied Hydrology; McGraw-Hill: New York, NY, USA, 1988. [Google Scholar]
- Terstriep, M.L.; Stall, J.B. The Illinois Urban Drainage Area Simulator, ILLUDAS; Bulletin 58; Illinois State Water Survey: Urbana, IL, USA, 1974. [Google Scholar]
- Cronshey, R. Urban Hydrology for Small Watersheds; US Department of Agriculture, Soil Conservation Service, Engineering Division: Washington, DC, USA, 1986.
- Pilgrim, D.H.; Cordery, I. Rainfall Temporal Patterns for Design Floods. J. Hydraul. Div. 1975, 101, 81–95. [Google Scholar] [CrossRef]
- García-Bartual, R.; Andrés-Doménech, I. A two-parameter design storm for Mediterranean convective rainfall. Hydrol. Earth Syst. Sci. 2017, 21, 2377–2387. [Google Scholar] [CrossRef]
- Balbastre-Soldevila, R.; García-Bartual, R.; Andrés-Doménech, I. A Comparison of Design Storms for Urban Drainage System Applications. Water 2019, 11, 757. [Google Scholar] [CrossRef]
- Gutierrez-Lopez, A.; Jimenez-Hernandez, S.B.; Escalante Sandoval, C. Physical Parameterization of IDF Curves Based on Short-Duration Storms. Water 2019, 11, 1813. [Google Scholar] [CrossRef]
- Schertzer, D.; Lovejoy, S. Physical Modeling and Analysis of Rain and Clouds by Anisotropic Scaling Mutiplicative Processes. J. Geophys. Res. 1987, 92, 9693–9714. [Google Scholar] [CrossRef]
- Gupta, V.K.; Waymire, E.C. A Statistical Analysis of Mesoscale Rainfall as a Random Cascade. J. Appl. Meteorol. 1993, 32, 251–267. [Google Scholar] [CrossRef]
- Koutsoyiannis, D.; Onof, C.; Wheater, H.S. Multivariate rainfall disaggregation at a fine timescale. Water Resour. Res. 2003, 39. [Google Scholar] [CrossRef]
- Westra, S.; Mehrotra, R.; Sharma, A.; Srikanthan, R. Continuous rainfall simulation: 1. A regionalized subdaily disaggregation approach. Water Resour. Res. 2012, 48, 1–16. [Google Scholar] [CrossRef]
- Müller-Thomy, H. Temporal rainfall disaggregation using a micro-canonical cascade model: Possibilities to improve the autocorrelation. Hydrol. Earth Syst. Sci. 2020, 24, 169–188. [Google Scholar] [CrossRef]
- Vašková, I. Cálculo de Las Curvas Intensidad-Duración-Frecuencia Mediante La Incorporación de Las Propiedades de Escala y de Dependencia Temporales. PhD Thesis, Universitat Politècnica de València, Valencia, Spain, 2001. (In Spanish). [Google Scholar]
- García-Marín, A.P. Análisis Multifractal de Series de Datos Pluviométricos En Andalucía. PhD Thesis, Universidad de Cór-doba, Córdoba, Spain, 2007. [Google Scholar]
- Martin-Vide, J. Spatial distribution of a daily precipitation concentration index in peninsular Spain. Int. J. Clim. 2004, 24, 959–971. [Google Scholar] [CrossRef]
- Maraun, D.; Osborn, T.J.; Gillett, N.P. United Kingdom daily precipitation intensity: Improved early data, error estimates and an update from 2000 to 2006. Int. J. Clim. 2008, 28, 833–842. [Google Scholar] [CrossRef]
- Llasat, M.C. An Objective Classification of Rainfall Events on the Basis of Their Convective Features: Application to Rainfall Intensity in the Northeast of Spain. Int. J. Climatol. 2001, 21, 1385–1400. [Google Scholar] [CrossRef]
- Casas, M.C.; Codina, B.; Lorente, J. A methodology to classify extreme rainfall events in the western mediterranean area. Theor. Appl. Clim. 2004, 77, 139–150. [Google Scholar] [CrossRef]
- Moncho, R. Análisis de La Intensidad de Precipitación. Método de La Intensidad Contigua. RAM3. January 2008. Available online: https://afly.co/slm5 (accessed on 10 June 2021). (In Spanish).
- Monjo, R. Measure of rainfall time structure using the dimensionless n-index. Clim. Res. 2016, 67, 71–86. [Google Scholar] [CrossRef]
- Monjo, R.; Martin-Vide, J. Daily precipitation concentration around the world according to several indices. Int. J. Clim. 2016, 36, 3828–3838. [Google Scholar] [CrossRef]
- Peel, M.C.; Finlayson, B.L.; McMahon, T.A. Updated World Map of the Köppen-Geiger Climate Classification. Hydrol. Earth Syst. Sci. 2007, 11, 1633–1644. [Google Scholar] [CrossRef]
- Moncho, R.; Belda, F.; Caselles, V. Climatic Study of the Exponent “n” in IDF Curves: Application for the Iberian Peninsula. Thethys 2009, 6, 3–14. [Google Scholar] [CrossRef]
- Monjo, R. El Índice n de la Precipitación Intensa. Available online: https://bit.ly/3veM9bL (accessed on 10 June 2021). (In Spanish).
- Jenkinson, A.F. The frequency distribution of the annual maximum (or minimum) values of meteorological elements. Q. J. R. Meteorol. Soc. 1955, 81, 158–171. [Google Scholar] [CrossRef]
- Jenkinson, A.F. Estimation of Maximum Floods. World Meteorol. Organ. Tech. Note 1969, 98, 183–257. [Google Scholar]
- Gumbel, E.J. Statistics of Extremes; Columbia University Press: New York, NY, USA, 1958. [Google Scholar]
- Etoh, T.; Murota, A.; Nakanishi, M. SQRT-Exponential Type Distribution of Maximum. In Proceedings of the International Symposium on Flood Frequency and Risk Analyses, Baton Rouge, LA, USA, 14–17 May 1986; Springer: Dordrecht, The Netherlands, 1987; pp. 253–264. [Google Scholar]
- Rossi, F.; Fiorentino, M.; Versace, P. Two-Component Extreme Value Distribution for Flood Frequency Analysis. Water Resour. Res. 1984, 20, 847–856. [Google Scholar] [CrossRef]
- Yah, A.S.; Nor, N.M.; Rohashikin, N.; Ramli, N.A.; Ahmad, F.; Ul-Saufie, A.Z. Determination of the Probability Plotting Position for Type I Extreme Value Distribution. J. Appl. Sci. 2012, 12, 1501–1506. [Google Scholar] [CrossRef][Green Version]
- Gringorten, I.I. A plotting rule for extreme probability paper. J. Geophys. Res. 1963, 68, 813–814. [Google Scholar] [CrossRef]
- Cunnane, C. Unbiased plotting positions—A review. J. Hydrol. 1978, 37, 205–222. [Google Scholar] [CrossRef]
- Stedinger, J.R.; Vogel, R.M.; Foufoula-Georgiou, E. Frequency analysis of extreme events. In Handbook of Hydrology; Maidment, D.A., Ed.; McGraw-Hill: New York, NY, USA, 1993; Chapter 18. [Google Scholar]
- Guo, S. A discussion on unbiased plotting positions for the general extreme value distribution. J. Hydrol. 1990, 121, 33–44. [Google Scholar] [CrossRef]
- Shabri, A.; Ani, F.N. A Comparison of Plotting Formulas for the Pearson Type III Distribution. J. Teknol. 2002, 36, 61–74. [Google Scholar] [CrossRef]
- Akaike, H. Information Theory and an Extension of the Maximum Likelihood Principle. In Selected Papers of Hirotugu Akaike; Parzen, E., Tanabe, K., Kitagawa, G., Eds.; Springer: New York, NY, USA, 1998; pp. 199–213. [Google Scholar]
- Ajuntament de València. Normativa Para Obras de Saneamiento y Drenaje Urbano de la Ciudad de Valencia. Ciclo Integral del Agua. 2016. Available online: https://www.ciclointegraldelagua.com/castellano/normativa-documentacion.php (accessed on 13 June 2021).
- Hailegeorgis, T.; Thorolfsson, S.T.; Alfredsen, K. Regional frequency analysis of extreme precipitation with consideration of uncertainties to update IDF curves for the city of Trondheim. J. Hydrol. 2013, 498, 305–318. [Google Scholar] [CrossRef]
- Bharath, R.; Srinivas, V.V. Regionalization of extreme rainfall in India. Int. J. Clim. 2015, 35, 1142–1156. [Google Scholar] [CrossRef]
- Darwish, M.M.; Fowler, H.J.; Blenkinsop, S.; Tye, M.R. A Regional Frequency Analysis of UK Sub-Daily Extreme Precipita-tion and Assessment of Their Seasonality. Int. J. Climatol. 2018, 38, 4758–4776. [Google Scholar] [CrossRef]
- Chavan, S.R.; Srinivas, V.V. Regionalization based envelope curves for PMP estimation by Hershfield method. Int. J. Clim. 2016, 37, 3767–3779. [Google Scholar] [CrossRef]
- Zhang, Z.; Stadnyk, T.A. Investigation of Attributes for Identifying Homogeneous Flood Regions for Regional Flood Fre-quency Analysis in Canada. Water 2020, 12, 2570. [Google Scholar] [CrossRef]
- Yang, Z. The unscented Kalman filter (UKF)-based algorithm for regional frequency analysis of extreme rainfall events in a nonstationary environment. J. Hydrol. 2021, 593, 125842. [Google Scholar] [CrossRef]


| Storm Duration
D (min) | Maximum Intensity I5 (mm h−1) | Rainfall Depth
V (mm) | |
|---|---|---|---|
| Maximum | 8530.0 | 223.2 | 220.8 |
| Minimum | 15.0 | 50.4 | 5.2 |
| Mean | 1049.3 | 96.9 | 43.8 |
| Median | 530.0 | 82.8 | 26.3 |
| Standard deviation | 1484.2 | 42.8 | 46.7 |
| Bias | 2.9 | 1.2 | 2.1 |
| Kurtosis | 10.8 | 0.8 | 3.9 |
| n | Type of Curve | Intensity | Temporal Distribution | Interpretation of Rainfall Type |
|---|---|---|---|---|
| 0.00–0.20 | Very gentle | Practically constant | Very regular | Stationary/highly predominantly advective |
| 0.20–0.40 | Gentle | Lightly variable | Regular | Predominantly advective |
| 0.40–0.60 | Normal | Variable | Irregular | Effective |
| 0.60–0.80 | Pronounced | Moderately variable | Very irregular | Predominantly convective |
| 0.80–1.00 | Very pronounced | Strongly variable | Nearly instantaneous | Highly predominantly convective |
| Cumulative Distribution Function (CDF) | Parameters | ||||
|---|---|---|---|---|---|
| GEV [39,40] | α | β | x0 | ||
| 26.0882 | −0.0480 | 62.324 | |||
| Gumbel [41] | θ | λ | |||
| 0.0376 | 10.6652 | ||||
| SQRT-ET max [42] | α | κ | |||
| 0.5219 | 41.8091 | ||||
| TCEV [43] | θ1 | θ2 | λ1 | λ2 | |
| 0.0456 | 0.0265 | 11.1031 | 1.8180 | ||
| Criterion | SQRT-ET Max | TCEV | Gumbel | GEV |
|---|---|---|---|---|
| χ2 | 0.1896 | 0.1709 | 0.1542 | 0.1537 |
| AIC | 686.096 | 686.100 | 686.078 | 685.890 |
| T (Years) | 2 | 5 | 10 | 15 | 25 | 50 |
|---|---|---|---|---|---|---|
| X1 (-) | 100.73 | 129.05 | 150.38 | 163.02 | 179.20 | 201.68 |
| Storm Classification | n | φ (min−1) |
|---|---|---|
| Mainly advective | 0.3 | 0.0745 |
| Effective | 0.5 | 0.1163 |
| Mainly convective | 0.7 | 0.1799 |
| Strongly convective | 0.9 | 0.3189 |
Publisher’s Note: MDPI stays neutral with regard to jurisdictional claims in published maps and institutional affiliations. |
© 2021 by the authors. Licensee MDPI, Basel, Switzerland. This article is an open access article distributed under the terms and conditions of the Creative Commons Attribution (CC BY) license (https://creativecommons.org/licenses/by/4.0/).
Share and Cite
Balbastre-Soldevila, R.; García-Bartual, R.; Andrés-Doménech, I. Estimation of the G2P Design Storm from a Rainfall Convectivity Index. Water 2021, 13, 1943. https://doi.org/10.3390/w13141943
Balbastre-Soldevila R, García-Bartual R, Andrés-Doménech I. Estimation of the G2P Design Storm from a Rainfall Convectivity Index. Water. 2021; 13(14):1943. https://doi.org/10.3390/w13141943
Chicago/Turabian StyleBalbastre-Soldevila, Rosario, Rafael García-Bartual, and Ignacio Andrés-Doménech. 2021. "Estimation of the G2P Design Storm from a Rainfall Convectivity Index" Water 13, no. 14: 1943. https://doi.org/10.3390/w13141943
APA StyleBalbastre-Soldevila, R., García-Bartual, R., & Andrés-Doménech, I. (2021). Estimation of the G2P Design Storm from a Rainfall Convectivity Index. Water, 13(14), 1943. https://doi.org/10.3390/w13141943