
Analysis of the Water–Energy Nexus of Treated Wastewater Reuse at a Municipal Scale


Abstract
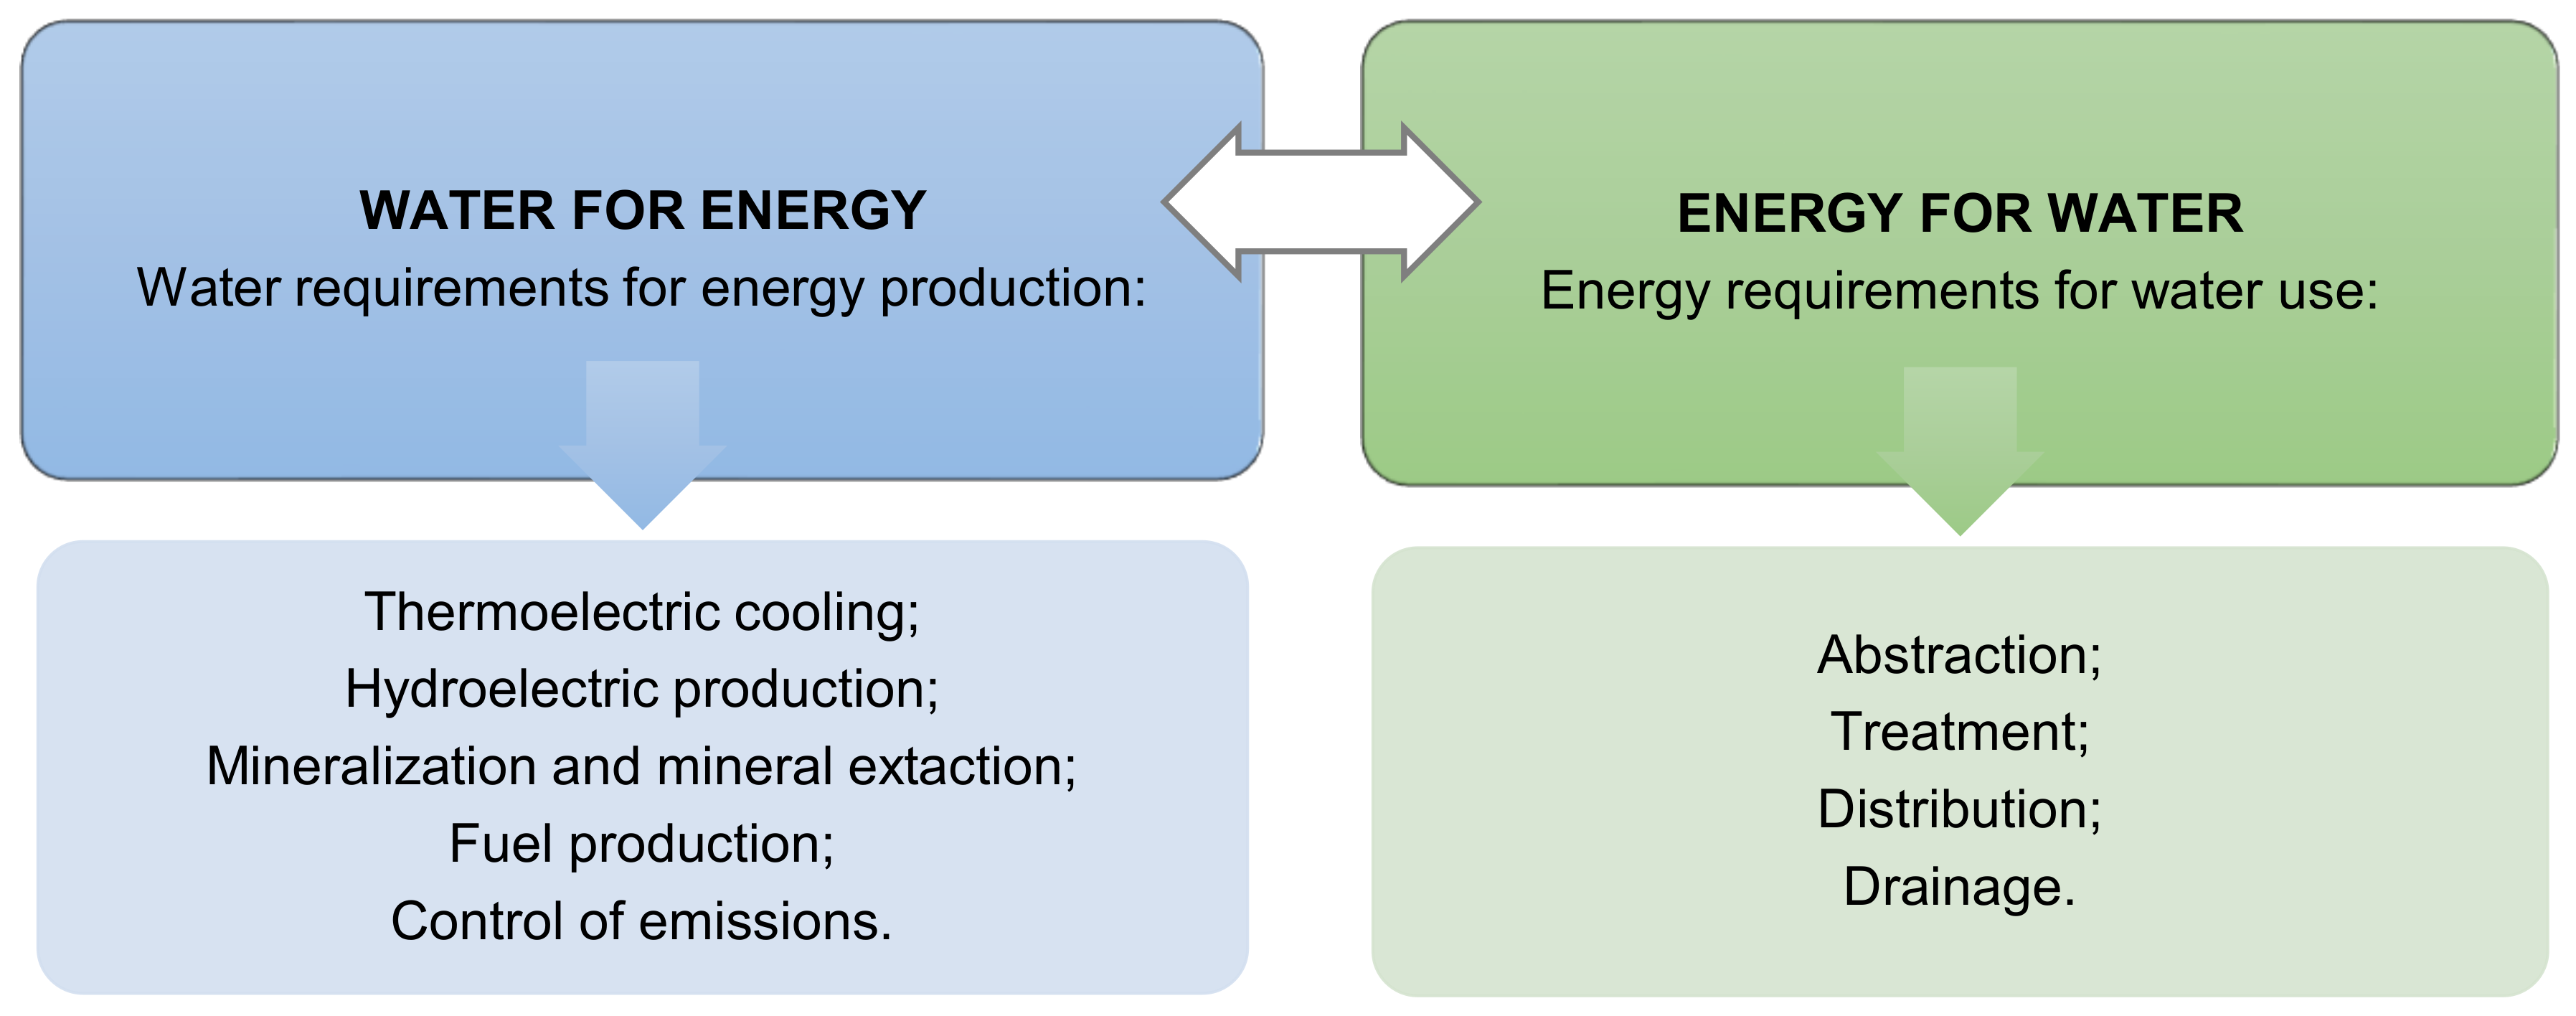
:1. Introduction
2. Methods
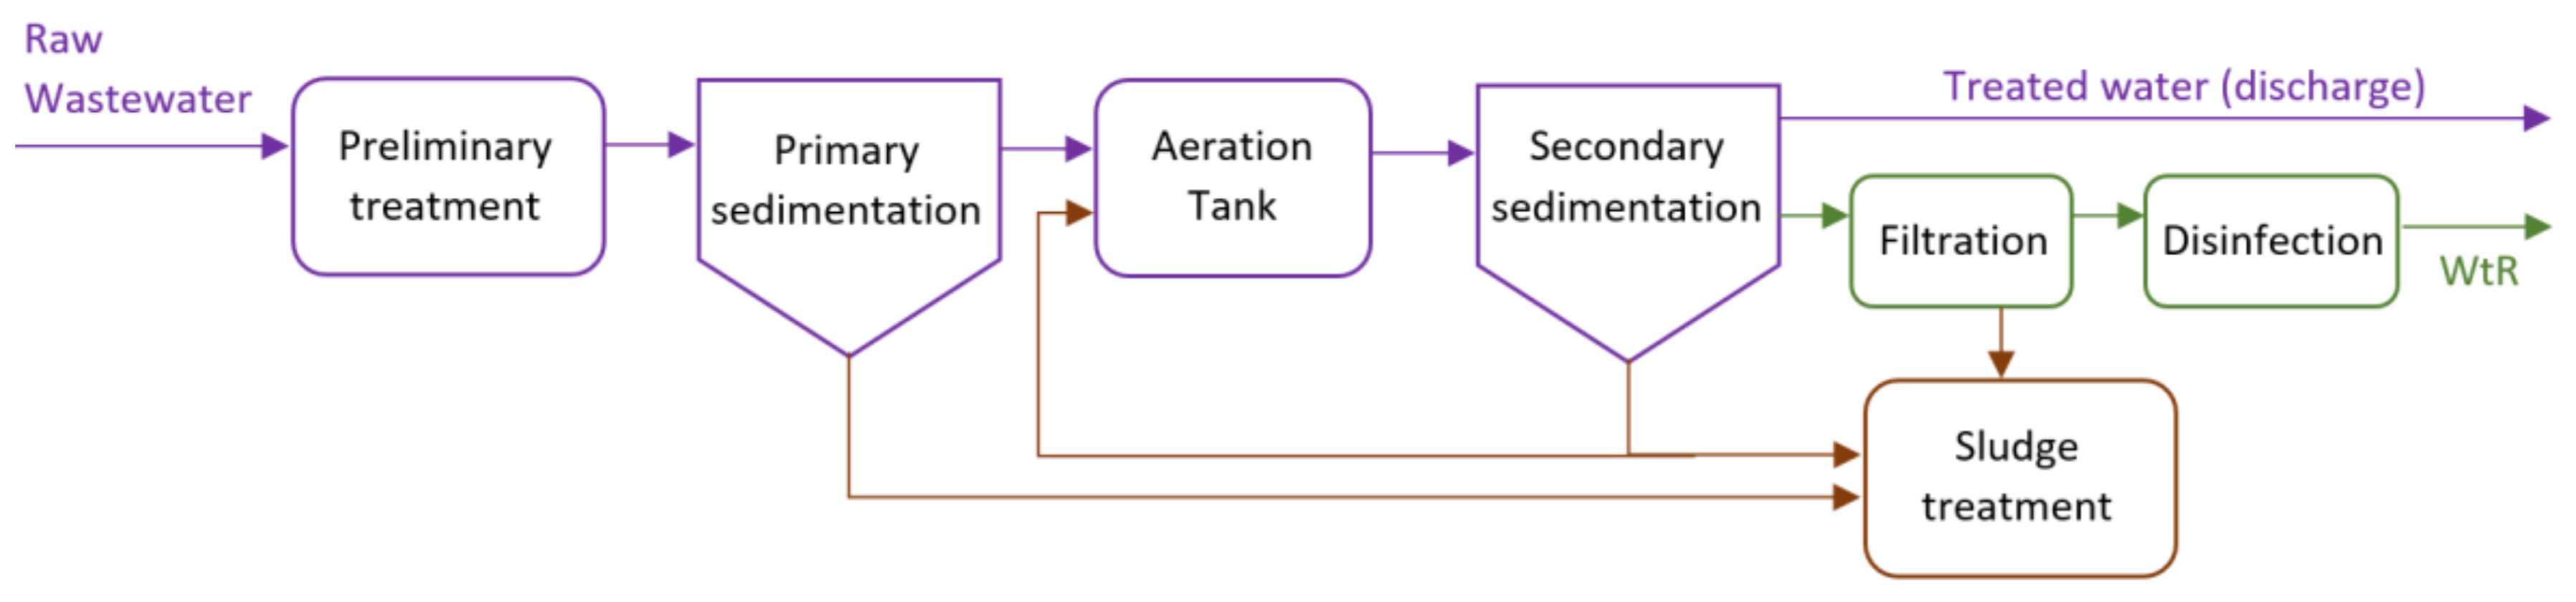
3. Case Study
Description
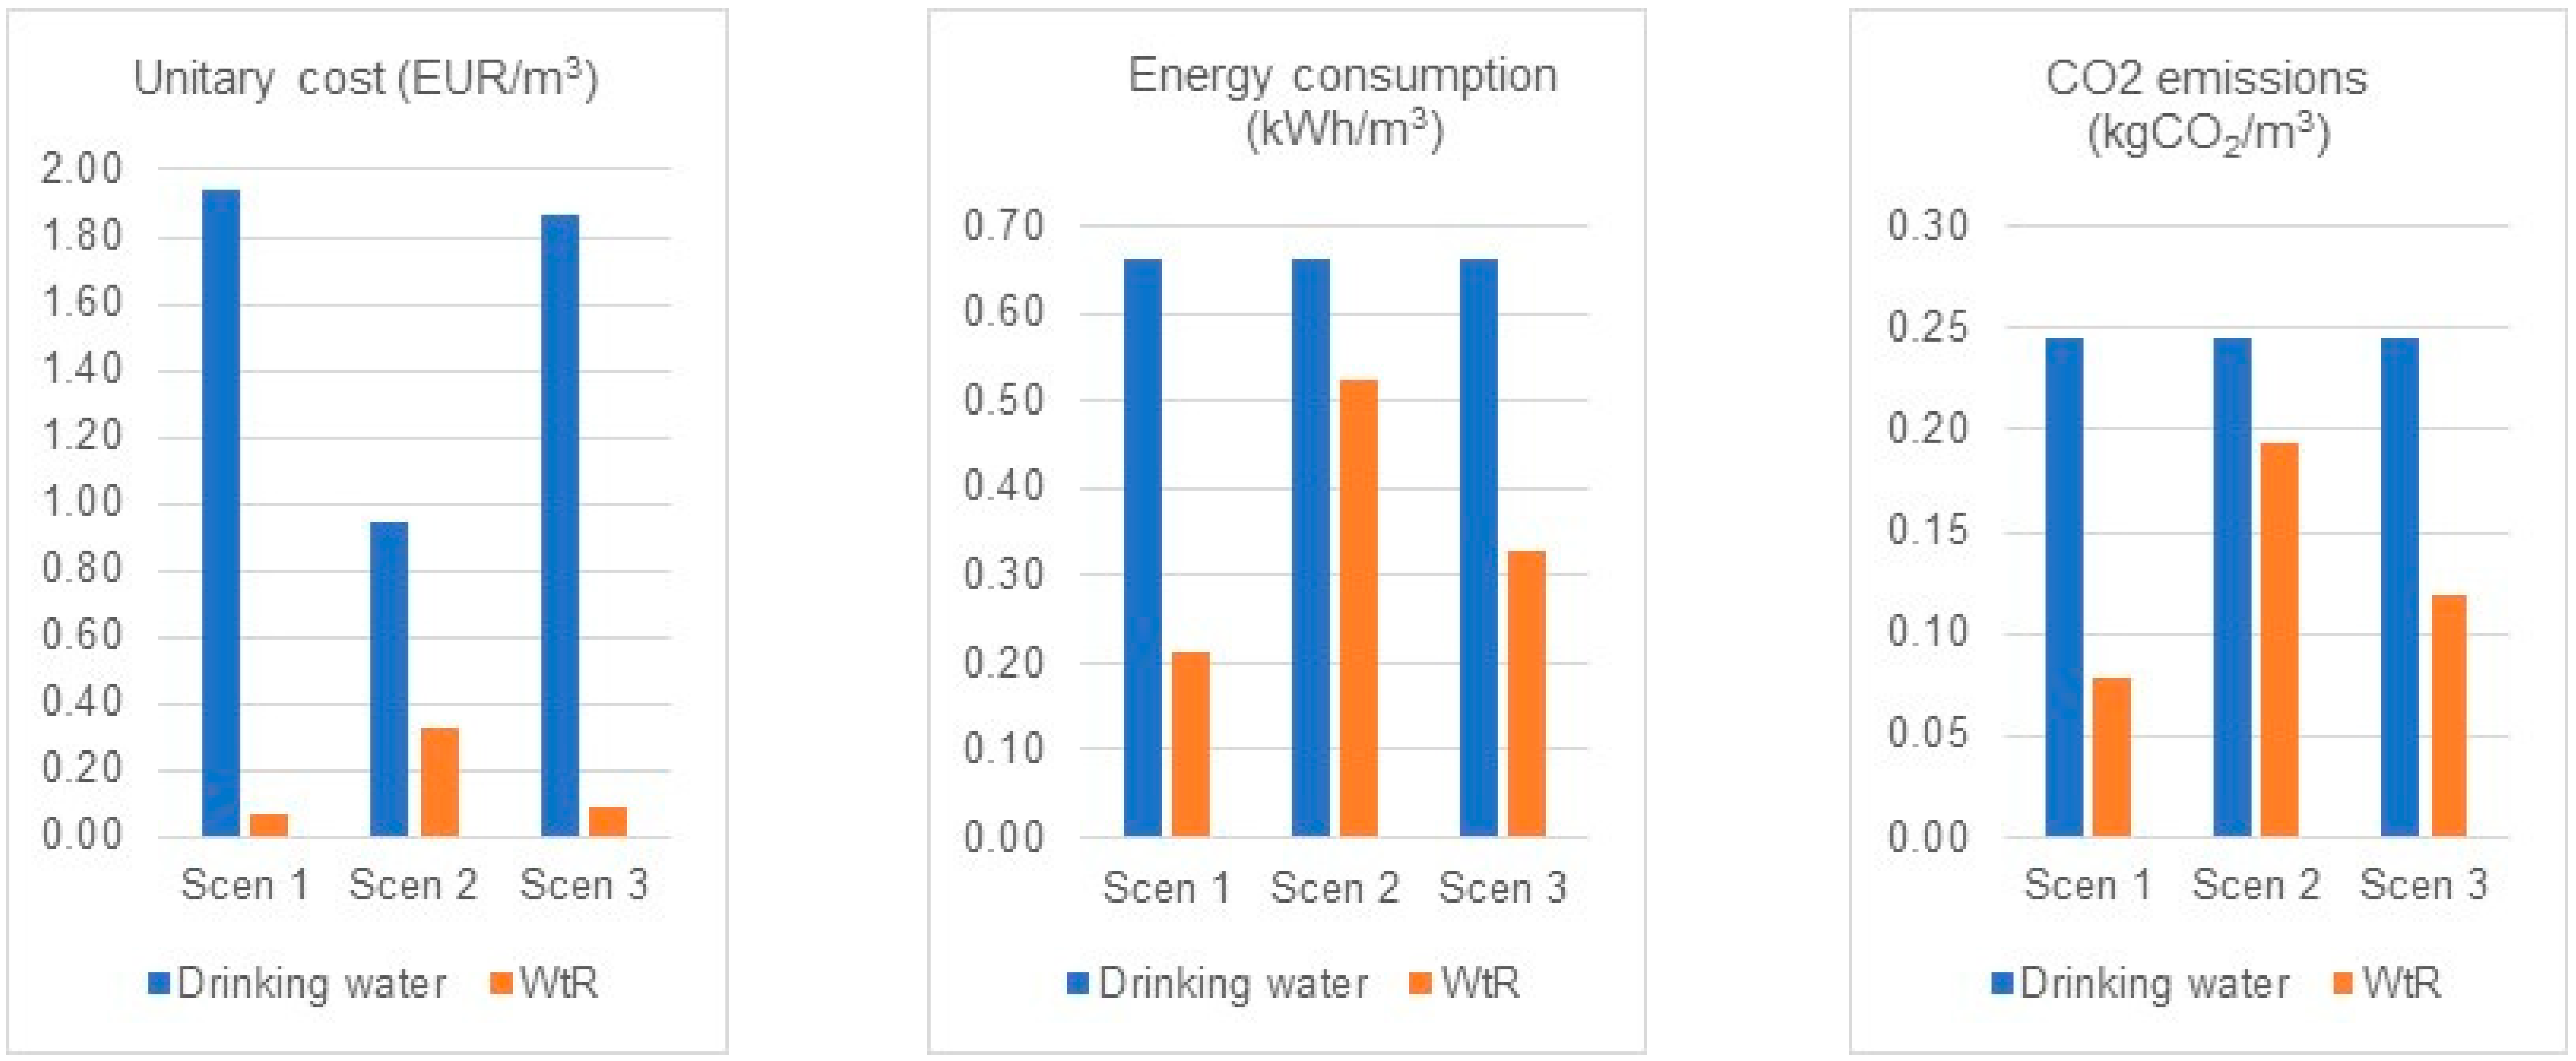
4. Results and Discussion
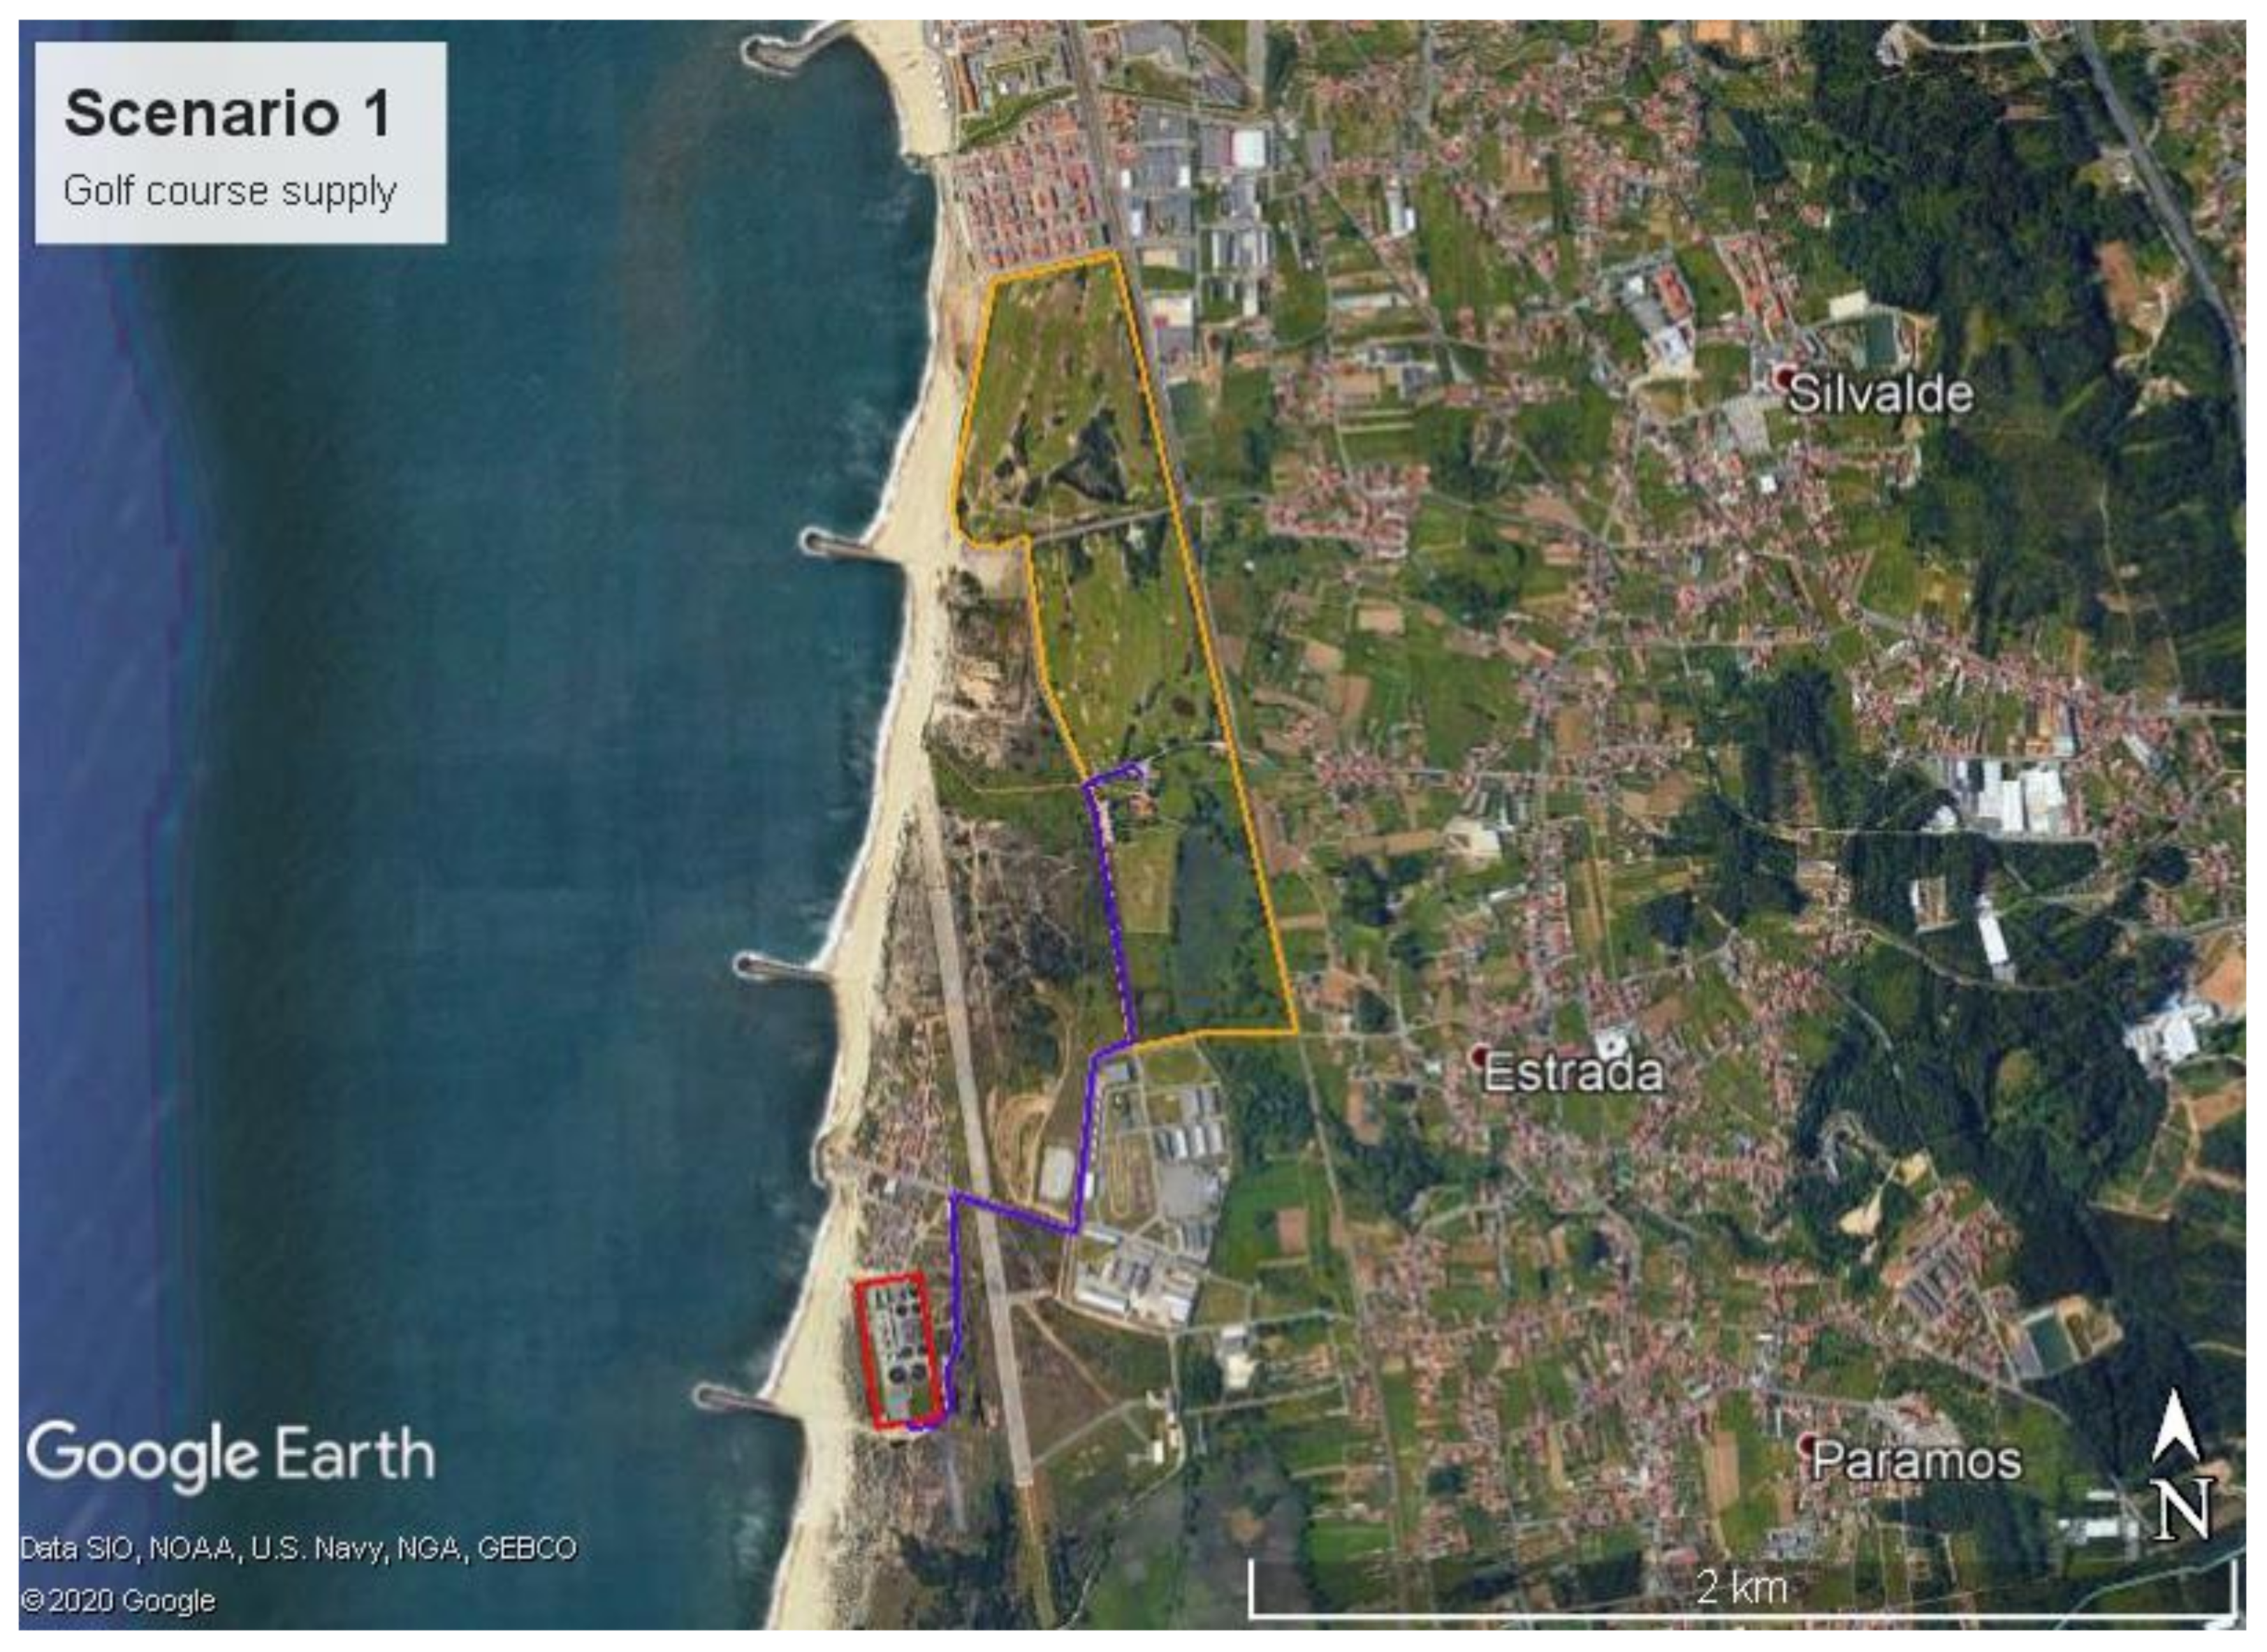
4.1. Scenario 1—Golf Course Supply
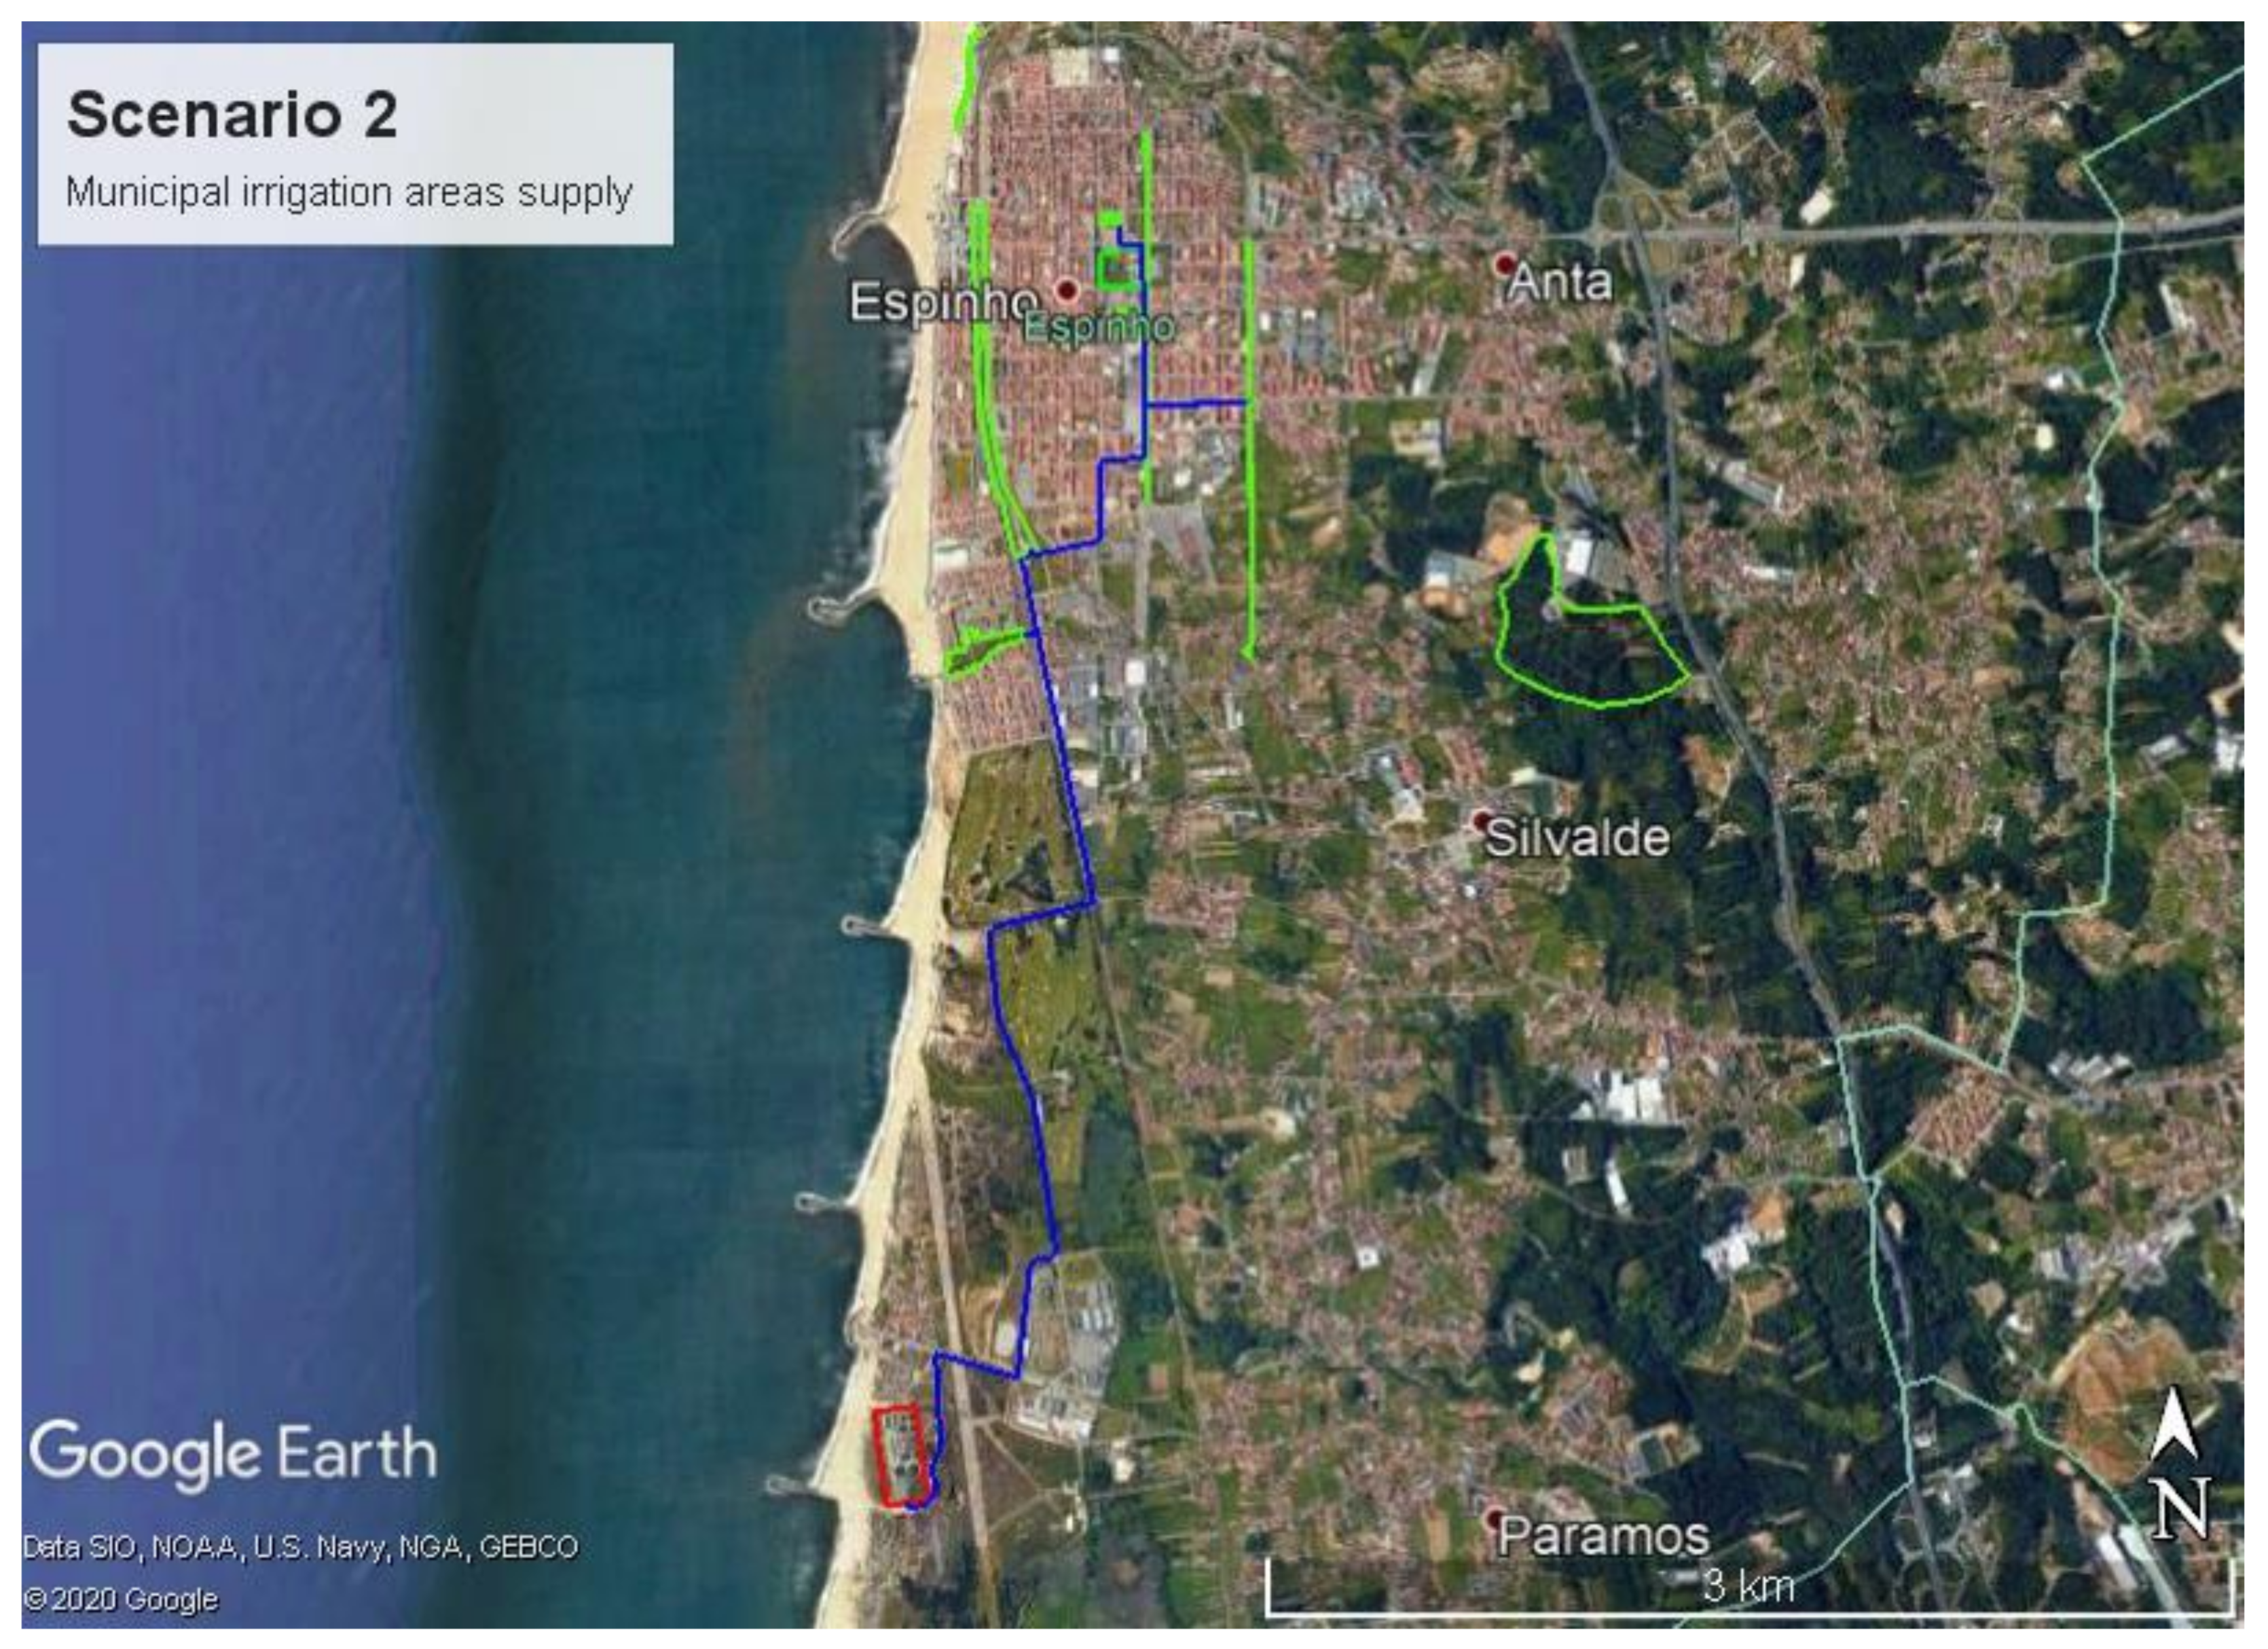
4.2. Scenario 2—Municipal Irrigation Areas Supply
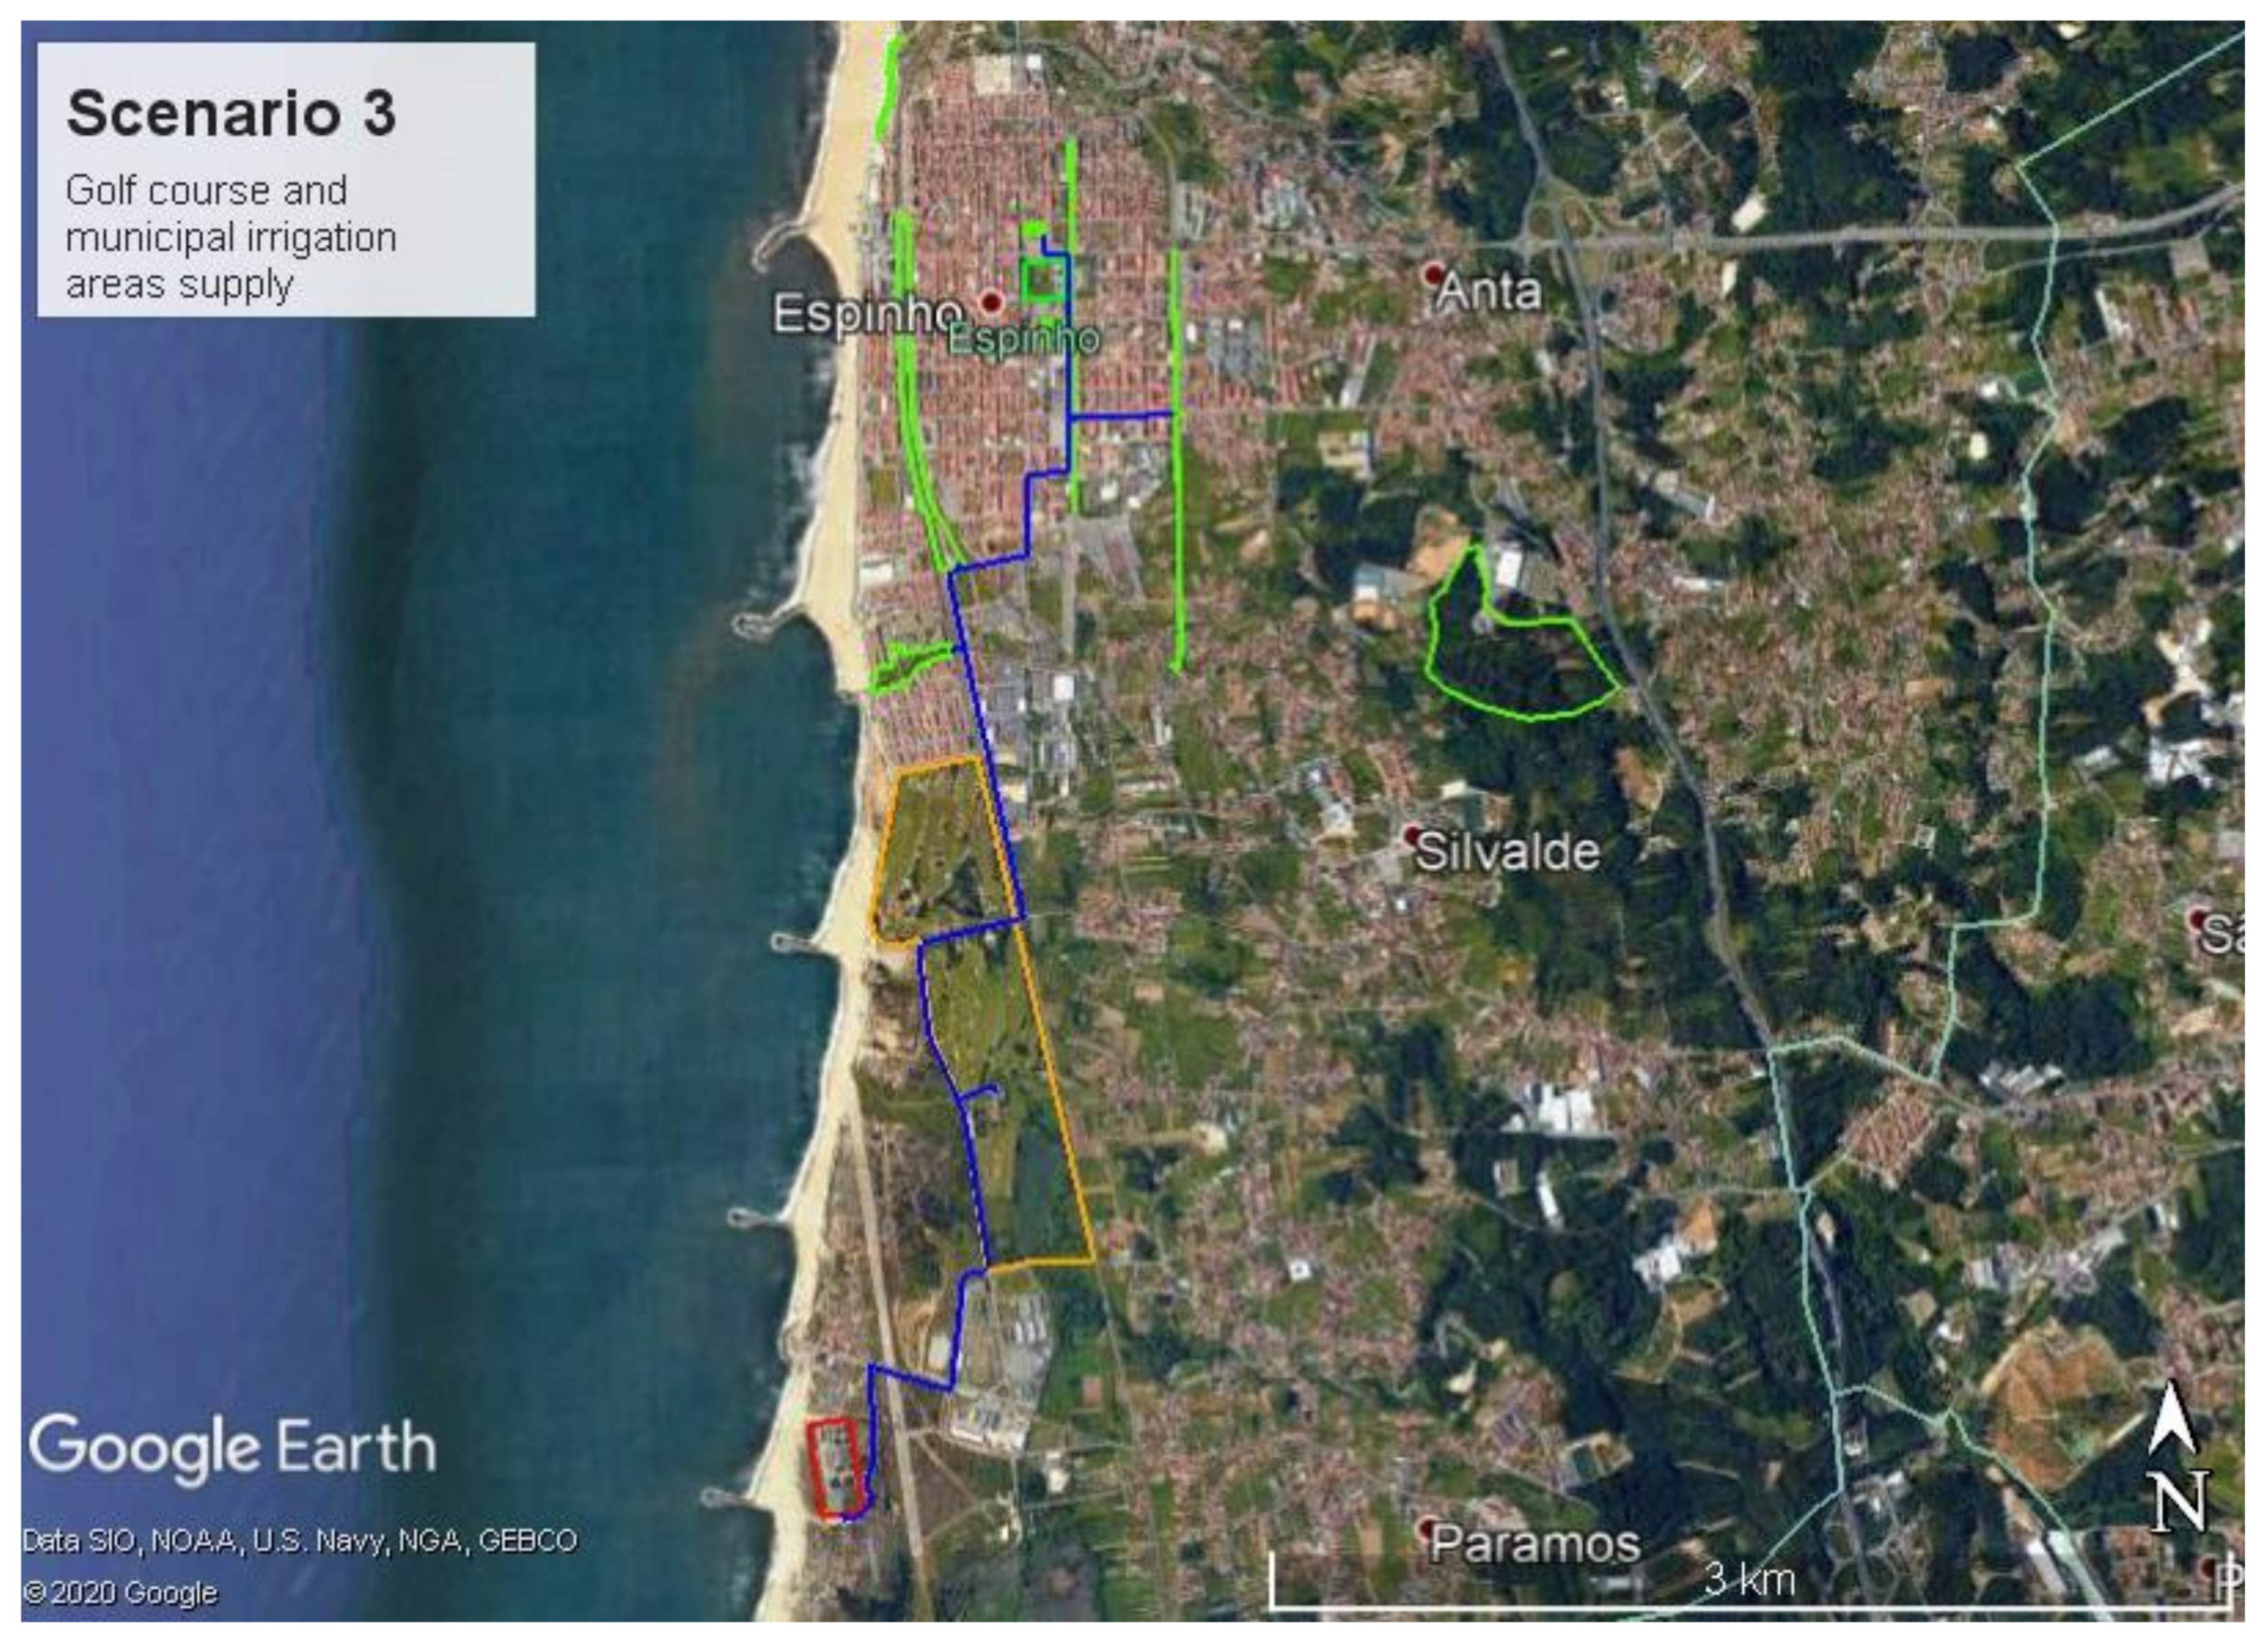
4.3. Scenario 3—Golf Course and Municipal Irrigation Areas Supply
- Pipe 1, from WWTP to golf course—extension of 1920 m, in HDPE SDR17 Ø110 mm and a with a flow of 11.1 L/s, considering both golf and municipal irrigation during 2 h/day. For the other 6 h of supply to the golf course, the considered flow was 8.7 L/s;
- Pipe 2, from golf course to municipal irrigation areas—extension of 4007 m, in HDPE SDR17 Ø63 mm and with a flow of 2.4 L/s.
4.4. Qualitative Analysis
4.5. Discussion
- Is WtR safe for humans, soil, plants and animals? Is it reliable in time? Does it need a specific license? How is the management carried out?
- Is the public opinion favorable to this procedure?
- What are the costs and the savings related to this procedure?
5. Conclusions
Author Contributions
Funding
Institutional Review Board Statement
Informed Consent Statement
Acknowledgments
Conflicts of Interest
References
- EEA. Annual Report from the European Environment Agency: Signals 2018—Water is Life; EEA: Copenhagen, Denmark, 2018; ISBN 978-92-9213-981-0. [Google Scholar] [CrossRef]
- Crutchik, D.; Campos, J. Municipal Wastewater Reuse: Is it a Competitive Alternative to Seawater Desalination? Sustainability 2021, 13, 6815. [Google Scholar] [CrossRef]
- Vergine, P.; Lonigro, A.; Salerno, C.; Rubino, P.; Berardi, G.; Pollice, A. Nutrient recovery and crop yield enhancement in irrigation with reclaimed wastewater: A case study. Urban Water J. 2016, 14, 325–330. [Google Scholar] [CrossRef]
- Lubello, C.; Gori, R.; Nicese, F.P.; Ferrini, F. Municipal-treated wastewater reuse for plant nurseries irrigation. Water Res. 2004, 38, 2939–2947. [Google Scholar] [CrossRef] [PubMed]
- Rezapour, S.; Nouri, A.; Jalil, H.; Hawkins, S.; Lukas, S. Influence of Treated Wastewater Irrigation on Soil Nutritional-Chemical Attributes Using Soil Quality Index. Sustainability 2021, 13, 1952. [Google Scholar] [CrossRef]
- Hagenvoort, J.; Ortega-Reig, M.; Botella, S.; García, C.; De Luis, A.; Palau-Salvador, G. Reusing Treated Waste-Water from a Circular Economy Perspective—The Case of the Real Acequia de Moncada in Valencia (Spain). Water 2019, 11, 1830. [Google Scholar] [CrossRef] [Green Version]
- Busgang, A.; Friedler, E.; Ovadia, O.; Gross, A. Epidemiological study for the assessment of health risks associated with graywater reuse for irrigation in arid regions. Sci. Total Environ. 2015, 538, 230–239. [Google Scholar] [CrossRef] [PubMed]
- Bahri, A.; Basset, C.; Queslati, F.; Brissaud, F. Reuse of reclaimed wastewater for golf course irrigation in Tunisia. Water Sci. Technol. 2001, 43, 117–124. [Google Scholar] [CrossRef] [PubMed]
- Cardoso, V. Avaliação do Potencial de Reutilização de Água Residual Tratada num Município de Aveiro. Master’s Thesis, Environmetal Engineering, University of Aveiro, Aveiro, Portugal, 2014. (In Portuguese). [Google Scholar]
- Decree-Law 119/2019. Diário da República nº 159/2019, Série I de 2019-08-21; Portuguese Republic Government, Council of Ministers: Lisbon, Portugal, 2019. (In Portuguese)
- EU 2020/741. Regulation of the European Parliament and of the Council on minimum requirements for water reuse. Off. J. Eur. Union 2020, L 177/32. Available online: http://extwprlegs1.fao.org/docs/pdf/eur195719.pdf (accessed on 6 July 2021).
- Gabbar, H.A.; Abdelsalam, A.A. Energy—Water Nexus: Integration, Monitoring, KPIs Tools and Research Vision. Energies 2020, 13, 6697. [Google Scholar] [CrossRef]
- Matos, C.; Pereira, S.; Amorim, E.V.; Bentes, I.; Briga-Sá, A. Wastewater and greywater reuse in centralized and decentralized systems—An integrated approach on water quality, energy consumption and CO2 emissions. Sci. Total Environ. 2014, 493, 463–471. [Google Scholar] [CrossRef] [PubMed]
- APA; Portuguese Environmental Agency. National Plan for the Efficiciency of Water Use—Implementation 2012–2020; Agriculture, Sea, Environment and Land Management Ministry: Lisbon, Portugal, 2012.
- Goldstein, R.; Smith, W. Water & Sustainability (Volume 4): U.S. Electricity Consumption for Water Supply & Treatment—The Next half Century; Topical Report 1006787. 2002. Available online: https://www.circleofblue.org/wp-content/uploads/2010/08/EPRI-Volume-4.pdf (accessed on 6 July 2021).
- D&R Int. Ltd. Buildings Energy Data Book; Office of Energy Efficiency and Renewable Energy, US Department of Energy: Washington, DC, USA, 2009.
- Hammer, M.J.; Hammer, M.J., Jr. Water and Waste Water Technology, 7th ed.; Prentice Hall: New York, NY, USA, 2008. [Google Scholar]
- Tripathi, M. Life Cycle Energy and Emissions for Municipal Water and Waste Water Services: Case Studies of Treatment Plants in USA. Master’s Thesis, University of Michigan, Ann Arbor, MI, USA, 2007. [Google Scholar]
- Davis, M.L. Water and Wastewater Engineering: Design Principles and Practices; WEF Press: New York, NY, USA; McGraw-Hill: New York, NY, USA, 2010. [Google Scholar]
- Arpke, A.; Hutzler, N. Domestic Water Use in the United States: A Life-Cycle Approach. J. Ind. Ecol. 2008, 10, 169–184. [Google Scholar] [CrossRef]
- WEF. Energy Conservation in Water and Waste Water Facilities, 1st ed.; WEF Press: New York, NY, USA; McGraw Hill: New York, NY, USA, 2010. [Google Scholar]
- Plappally, A.K.; Lienhard, V.J.H. Energy requirements for water production, treatment, end use, reclamation and disposal. Renew. Sustain. Energy Rev. 2012, 16, 4818–4848. [Google Scholar] [CrossRef]
- Silva-Afonso, A.; Rodrigues, F.; Pimentel-Rodrigues, C. Water efficiency in buildings: Assessment of its impact on energy efficiency and reducing GHG emissions. In Proceedings of the 6th IASME/WSEAS International Conference on Energy and Environment EE’11, Cambridge, UK, 23–25 February 2011. [Google Scholar]
- AdP. Águas de Portugal—Saneamento De Águas Residuais. Available online: https://www.adp.pt/ (accessed on 15 March 2020). (In Portuguese).
- OGC. Oporto Golf Club. Available online: https://www.oportogolfclub.com/pt/ (accessed on 15 March 2020). (In Portuguese).
- ADDP. Águas do Douro e Paiva—Grupo Águas de Portugal. Available online: https://www.addp.pt (accessed on 15 March 2020). (In Portuguese).
- Saraiva, S. Avaliação da Eficiência da Desinfeção de Efluentes Urbanos com Recurso a Cloro. Master’s Thesis, Environmental Engineering, University of Lisbon—Faculty of Science and Technology, Lisbon, Portugal, 2015. (in Portuguese). [Google Scholar]
- UN-WATER. The United Nations World Water Development Report 2017: Wastewater: The Untapped Resource; UNESCO World Water Assessment Programme: Perugia, Italy, 2017. [Google Scholar]


| Energy Consumption (kWh/m3) | |||
|---|---|---|---|
| Min | Max | ||
| Potable water treatment | Pressurized Filtration | 0.014 | |
| Pre-oxidation With Ozone | 0.008 | 0.022 | |
| Coagulation-Flocculation | 0.4 | 0.7 | |
| Multilayer Filtration | 0.005 | 0.014 | |
| Disinfection With Chlorine | 0.00002 | 0.0005 | |
| Transportation | 0.073 | ||
| Additional wastewater treatment | Pressurized Filtration | 0.014 | |
| UV-B or Chlorine | 0 | 0.066 | |
| WWTP Treated Wastewater Production (m3/Month) | |
|---|---|
| Jan | 490,640 |
| Feb | 464,960 |
| Mar | 489,212 |
| Apr | 541,324 |
| May | 445,484 |
| Jun | 369,777 |
| Jul | 410,535 |
| Aug | 390,572 |
| Sep | 357,648 |
| Oct | 377,284 * |
| Nov | 454,306 * |
| Dec | 522,696 * |
| TOTAL | 3,960,152 |
| Consumption (m3) | Supply with Drinking Water (from the Public Network) | Supply with WtR | |||||||||
|---|---|---|---|---|---|---|---|---|---|---|---|
| Cost (EUR) | Energy (Range Interval) (kWh) | CO2 Emissions (Range Interval) (kg) | Cost * (EUR) | Energy (Range Interval) (kWh) | CO2 Emissions (Range Interval) (kg) | ||||||
| Jan–May | 0 | 0 | 0 | 0 | 0 | 0 | 0 | 0 | 0 | 0 | 0 |
| Jun | 4226 | 8222 | 2115 | 3483 | 781 | 1286 | 281 | 793 | 1013 | 293 | 374 |
| Jul | 17,092 | 33,254 | 8542 | 14,067 | 3154 | 5194 | 1138 | 3206 | 4094 | 1184 | 1512 |
| Aug | 4151 | 8076 | 2077 | 3421 | 767 | 1263 | 276 | 779 | 995 | 287 | 367 |
| Sep | 6371 | 12,395 | 3181 | 5238 | 1174 | 1934 | 424 | 1195 | 1526 | 441 | 563 |
| Oct–Dec | 0 | 0 | 0 | 0 | 0 | 0 | 0 | 0 | 0 | 0 | 0 |
| TOTAL | 31,840 | 61,948 | 15,914 | 26,209 | 5876 | 9677 | 2119 | 5972 | 7627 | 2205 | 2816 |
| Consumption (m3) | Supply with Drinking Water (from the Public Network) | Supply with WtR | |||||||||
|---|---|---|---|---|---|---|---|---|---|---|---|
| Cost (EUR) | Energy (Range Interval) (kWh) | CO2 Emissions (Range Interval) (kg) | Cost * (EUR) | Energy (Range Interval) (kWh) | CO2 Emissions (Range Interval) (kg) | ||||||
| Jan | 791 | 337 | 395 | 651 | 146 | 240 | 117 | 393 | 434 | 145 | 160 |
| Feb | 189 | 80 | 95 | 157 | 35 | 58 | 28 | 95 | 105 | 35 | 39 |
| Mar | 189 | 80 | 95 | 156 | 35 | 57 | 28 | 94 | 104 | 35 | 38 |
| Apr | 1275 | 543 | 638 | 1050 | 235 | 388 | 189 | 634 | 701 | 234 | 259 |
| May | 254 | 108 | 127 | 209 | 47 | 77 | 38 | 126 | 140 | 47 | 52 |
| Jun | 1646 | 701 | 824 | 1356 | 304 | 501 | 244 | 819 | 905 | 303 | 334 |
| Jul | 745 | 317 | 372 | 613 | 137 | 226 | 111 | 370 | 409 | 137 | 151 |
| Aug | 280 | 119 | 140 | 230 | 52 | 85 | 42 | 139 | 153 | 51 | 57 |
| Sep | 143 | 61 | 72 | 119 | 27 | 44 | 21 | 72 | 79 | 26 | 29 |
| Oct | 167 | 71 | 84 | 138 | 31 | 51 | 25 | 83 | 92 | 31 | 34 |
| Nov | 143 | 61 | 72 | 119 | 27 | 44 | 21 | 72 | 79 | 26 | 29 |
| Dec | 434 | 185 | 217 | 357 | 80 | 132 | 64 | 216 | 238 | 80 | 88 |
| TOTAL | 2814 | 2664 | 1407 | 2317 | 520 | 856 | 928 | 1400 | 1546 | 517 | 571 |
| Consumption (m3) | Supply with Drinking Water (from the Public Network) | Supply with WtR | |||||||||
|---|---|---|---|---|---|---|---|---|---|---|---|
| Cost (EUR) | Energy (Range Interval) (kWh) | CO2 Emissions (Range Interval) (kg) | Cost * (EUR) | Energy (Range Interval) (kWh) | CO2 Emissions (Range Interval) (kg) | ||||||
| Jan | 791 | 337 | 395 | 651 | 146 | 240 | 435 | 393 | 434 | 145 | 160 |
| Feb | 189 | 80 | 95 | 157 | 35 | 58 | 28 | 95 | 105 | 35 | 39 |
| Mar | 189 | 80 | 95 | 156 | 35 | 57 | 28 | 94 | 104 | 35 | 38 |
| Apr | 1275 | 543 | 638 | 1050 | 235 | 388 | 189 | 634 | 701 | 234 | 259 |
| May | 254 | 108 | 127 | 209 | 47 | 77 | 38 | 126 | 140 | 47 | 52 |
| Jun | 5872 | 8923 | 2936 | 4835 | 1084 | 1785 | 403 | 1717 | 2081 | 634 | 768 |
| Jul | 17,837 | 33,571 | 8919 | 14,689 | 3293 | 5424 | 1126 | 4447 | 5614 | 1642 | 2073 |
| Aug | 4431 | 8195 | 2215 | 3648 | 818 | 1347 | 279 | 1686 | 1975 | 623 | 729 |
| Sep | 6514 | 12,456 | 3257 | 5364 | 1202 | 1980 | 398 | 2368 | 2795 | 874 | 874 |
| Oct | 167 | 71 | 84 | 138 | 31 | 51 | 25 | 83 | 92 | 31 | 34 |
| Nov | 143 | 61 | 72 | 119 | 27 | 44 | 21 | 72 | 79 | 26 | 29 |
| Dec | 434 | 185 | 217 | 357 | 80 | 132 | 64 | 216 | 238 | 80 | 88 |
| TOTAL | 34,654 | 64,612 | 17,327 | 28,536 | 6397 | 10,536 | 3036 | 10,218 | 12,466 | 3773 | 4445 |
| Irrigation: B-Class | Pavement Washing (1) | Quality Records from Espinho WWTP in the Summer of 2019 | ||||||||
|---|---|---|---|---|---|---|---|---|---|---|
| 13 Jun | 25 Jun | 2 Jul | 23 Jul | 13 Aug | 29 Aug | 4 Sep | 17 Sep | |||
| BOD mgO2/L | ≤25 | ≤25 | 15 | 10 | 22 | 21 | 22 | 10 | 19 | 13 |
| QOD mgO2/L | - | - | 123 | 38 | 117 | 112 | 117 | 40 | 77 | 45 |
| TSS mg/L | ≤35 mg/L | - | 10 | 10 | 30 | 20 | 20 | 5 | 15 | <10 |
| pH - | - | 6 to 9 | 7.47 | 7.38 | 7.36 | 7.38 | 7.79 | 7.3 | 7.01 | 7.6 |
| Temp °C | - | - | 18.9 | 19.7 | 19.9 | 21.1 | 21.85 | 21.87 | 21.6 | - |
| E. coli CFU/100 mL | ≤100 | - | - | - | - | - | - | - | - | - |
| Ammoniacal nitrogen (2) mg/L | ≤10 mg/L | - | - | - | - | - | - | - | - | - |
| Total nitrogen (2) mg/L | ≤15 mg/L | - | 17 | 18 | 39 | 13 | 32 | 12 | 24 | 31 |
| Total Phosphorus (2) mg/L | ≤5 mg/L | - | 1.5 | 0.2 | 2.9 | 4.4 | 5.2 | <0.5 | 2.1 | 5.8 |
| Using Drinking Water | Using WtR | Balance | ||
|---|---|---|---|---|
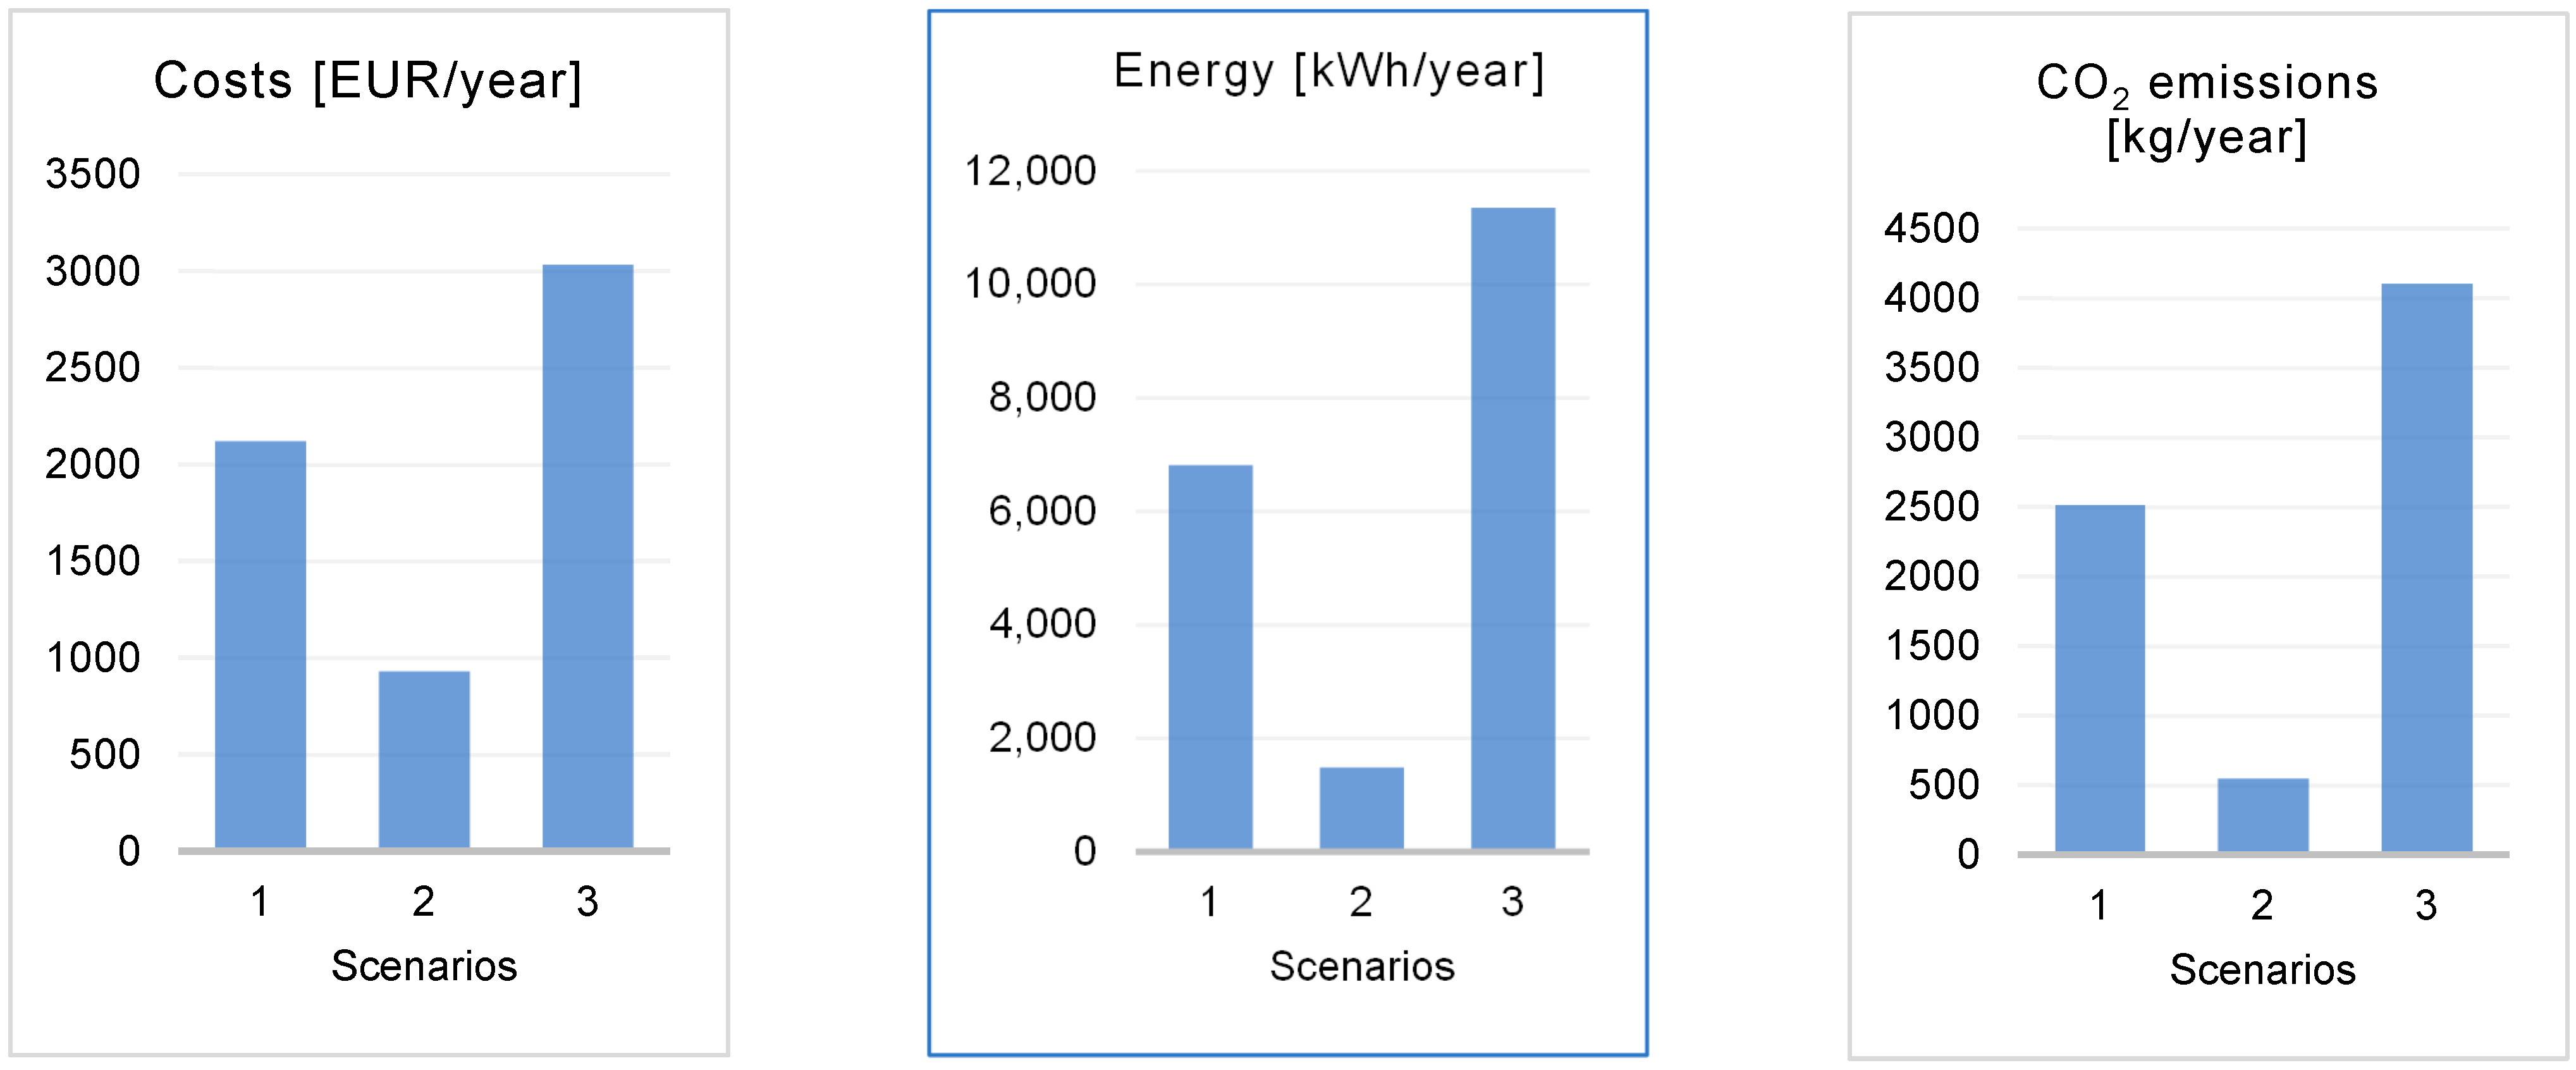
| Scenario 1 | Costs (EUR/year) | 61,948 | 2119 | −59,829 |
| Energy * (kWh/year) | 21,062 | 6576 | −14,485 | |
| CO2 emissions * (kg/year) | 7777 | 2510 | −5266 | |
| Scenario 2 | Costs (EUR/year) | 2664 | 928 | −1736 |
| Energy * (kWh/year) | 1862 | 1473 | −389 | |
| CO2 emissions * (kg/year) | 688 | 544 | −144 | |
| Scenario 3 | Costs (EUR/year) | 64,612 | 3036 | −61,577 |
| Energy * (kWh/year) | 22,931 | 11,342 | −11,589 | |
| CO2 emissions * (kg/year) | 8467 | 4109 | −4358 | |
Publisher’s Note: MDPI stays neutral with regard to jurisdictional claims in published maps and institutional affiliations. |
© 2021 by the authors. Licensee MDPI, Basel, Switzerland. This article is an open access article distributed under the terms and conditions of the Creative Commons Attribution (CC BY) license (https://creativecommons.org/licenses/by/4.0/).
Share and Cite
Santos, C.; Taveira-Pinto, F.; Pereira, D.; Matos, C. Analysis of the Water–Energy Nexus of Treated Wastewater Reuse at a Municipal Scale. Water 2021, 13, 1911. https://doi.org/10.3390/w13141911
Santos C, Taveira-Pinto F, Pereira D, Matos C. Analysis of the Water–Energy Nexus of Treated Wastewater Reuse at a Municipal Scale. Water. 2021; 13(14):1911. https://doi.org/10.3390/w13141911
Chicago/Turabian StyleSantos, Cristina, Francisco Taveira-Pinto, David Pereira, and Cristina Matos. 2021. "Analysis of the Water–Energy Nexus of Treated Wastewater Reuse at a Municipal Scale" Water 13, no. 14: 1911. https://doi.org/10.3390/w13141911