1. Introduction
Monitoring water quantity and quality using data from observation networks is fundamental to water resources study, management, and decision-making. Observations can include different variables related to water quantity, such as precipitation, streamflow, water depth, and those related to water quality such as temperature, turbidity, and the concentration of phosphorous, nitrogen, and other chemical components. There are challenges in accessing and using this information data because of consistency, archiving, and accessibility of the water data stored in various systems [
1].
Data archiving and accessibility are challenging because it is often difficult to locate, obtain, and compare data between different regions, especially when different parties and agencies collect, store, and manage data in different formats. Data accessibility can be a challenge due to political, economic, and cultural barriers among the different data providers, or from the requirements and standards from different organizations. Dissemination of water data is complicated because of the lack of integration and interoperability across various data archives within geosciences. All of these issues make it difficult to find and access water data from various archives [
2,
3].
The use of service-oriented architecture (SOA) design patterns facilitates data archiving and dissemination across multiple users and institutions. Data archiving generally involves storing data in relational databases that can be updated and accessed by different users. Similarly, dissemination of hydrological data from different countries at a transboundary level, or even from different agencies within a country, requires the standardization of various aspects of data storage and dissemination technologies. Discovery and access to data is crucial to provide the hydrological information required for the sustainable development of nationally and internationally shared water resources [
4]. The technology to provide hydrological data sharing between organizations requires a cyberinfrastructure that provides data interoperability between data systems from the different organizations. An appropriate cyberinfrastructure lowers the technical barriers to data sharing and dissemination and provides organizations with the tools necessary to share their data once the other barriers (e.g., political, economic, etc.) have been resolved.
A number of different SOA cyberinfrastructures have been developed to share and store spatial discrete observation data, including, for example, the Consortium of Universities for the Advancement of Hydrologic Science (CUAHSI) Hydrologic Information System (HIS) [
5], the World Meteorological Organization (WMO) Hydrological Observing System (WHOS) [
6], the Critical Zone Observatory Integrated Data Management System (CZOData) [
7], the Integrated Earth Data Applications (IEDA) and EarthChem system [
8,
9,
10], and the Integrated Ocean Observing System (IOOS) [
11]. The architectures of these systems differ in terms of databases, software, and hardware; however, they all are designed to enhance access to water resources observation and model data, and to facilitate the dissemination and sharing of these data.
The CUAHSI HIS project [
12,
13,
14] was an early leader in the area of water resources SOA cyberinfrastructure. CUASHSI established: a system with a relational database schema called the Observations Data Model (ODM) [
15,
16]; data servers called HydroServers [
17,
18,
19]; client tools for accessing data from these servers, including HydroDesktop [
20], WaterML R [
21], and HydroClient [
22]; and a central catalog to find data called HIS Central, which stores searchable metadata and supports data discovery services [
23]. The CUAHSI HIS uses a community-controlled shared vocabulary for hydrologic terms [
24] and defined formal protocols for communication between system components, including WaterOneFlow web services and the WaterML data transfer encoding protocol [
25,
26]. The CUAHSI HIS includes, at present, 97 registered data servers sharing time series data for 1,222,585 sites around the globe and a total of 10,353,663,916 data values [
27]. CUAHSI HIS protocols have been implemented by other data providers and software systems including the WHOS data broker [
28].The CUAHSI HIS project [
5,
12,
13] was an early leader in the area of water resources SOA cyberinfrastructure. CUASHSI established a system with a relational database schema called the Observations Data Model (ODM) [
14,
15]; data servers called HydroServers [
16,
17,
18]; client tools for accessing data from these servers, including HydroDesktop [
19], WaterML R [
20], and HydroClient [
21]; and a central catalog to find data called HIS Central, which stores searchable metadata and supports data discovery services [
22]. The CUAHSI HIS uses a community-controlled shared vocabulary for hydrologic terms [
23] and defined formal protocols for communication between system components, including WaterOneFlow web services and the WaterML data transfer encoding protocol [
24,
25]. The CUAHSI HIS includes, at present, 97 registered data servers sharing time series data for 1,222,585 sites around the globe and a total of 10,353,663,916 data values [
26].CUAHSI HIS protocols have been implemented by other data providers and software systems including the WHOS data broker [
27].
WHOS is a services-oriented framework linking hydrological data and users through an information system that provides data registration, data discovery, and data access [
29,
30]. WHOS supports the publication of customized data subsets using the concept of “views” to provide data capabilities to various organizations and users [
31]. For example, a “basin view” can contain all the data sets that are collected and shared by neighboring countries in a specific basin. Client components built by others can access the WHOS views for data discovery, download and visualization using WaterOneFlow web services.WHOS is a services-oriented framework linking hydrological data and users through an information system that provides data registration, data discovery, and data access [
28,
29] WHOS supports the publication of customized data subsets using the concept of “views” to provide data capabilities to various organizations and users [
30]. For example, a “basin view” can contain all the data sets in a specific basin that are collected and shared by neighboring countries. Client components built by others can access the WHOS views for data discovery, download and visualization using WaterOneFlow web services.
To our knowledge, there is not an open-source client interface tool that can be customized for specific regions and datasets that accesses data from systems using WaterOneFlow web services such as those provide by CUAHSI HIS and WHOS systems. We designed Water Data Explorer (WDE) to be an easy-to-use interface to these distributed open data systems. WDE can be configured for specific regions or datasets, providing users and managers with a focused interface to their region.
One of the challenges encountered when developing an open-source client interface is the heterogeneity between the data responses of the WaterOneFlow web service methods because responses can contain different attributes. To manage this issue, WDE addresses data response heterogeneity by using the standard WaterML 1.0 response attributes, which provide a standard subset of attributes. Our main design goal for the WDE, which is described in this paper, is to serve as a client component for SOA systems using WaterOneFlow web services that can be customized for a region of interest while allowing data discovery, download, and basic analysis. We use both CUAHSI HIS and WHOS systems as examples to demonstrate the WDE development and capabilities. We selected the CUAHSI and WHOS systems because both systems use WaterOneFlow web services, and they are the main systems used globally to archive and distribute hydrology data.
The remainder of this paper is organized as follows:
Section 2 presents the design and architecture of WDE;
Section 3 presents a case study using WDE to access the CUAHSI HIS and WHOS systems; in
Section 4 we discuss the WDE application and present some conclusions regarding the work; and we include
supplementary information about how to access the software source code and data used in the case studies.
2. Software Design and Architecture
2.1. Pywaterml Python Package
We developed Pywaterml, a Python package, as part of this work. Pywaterml is a library that connects to the different WaterOneFlow web services and retrieves time series data from systems that use the WaterML 1.0 standard. Pywaterml provides the core functions of WDE and allows others to access these functions through Application Programming Interfaces (API) for use in other applications. Pywaterml is free and open-source and is available for download and installation in any Python environment using the PyPI (Python Package Index) or Conda package management systems.
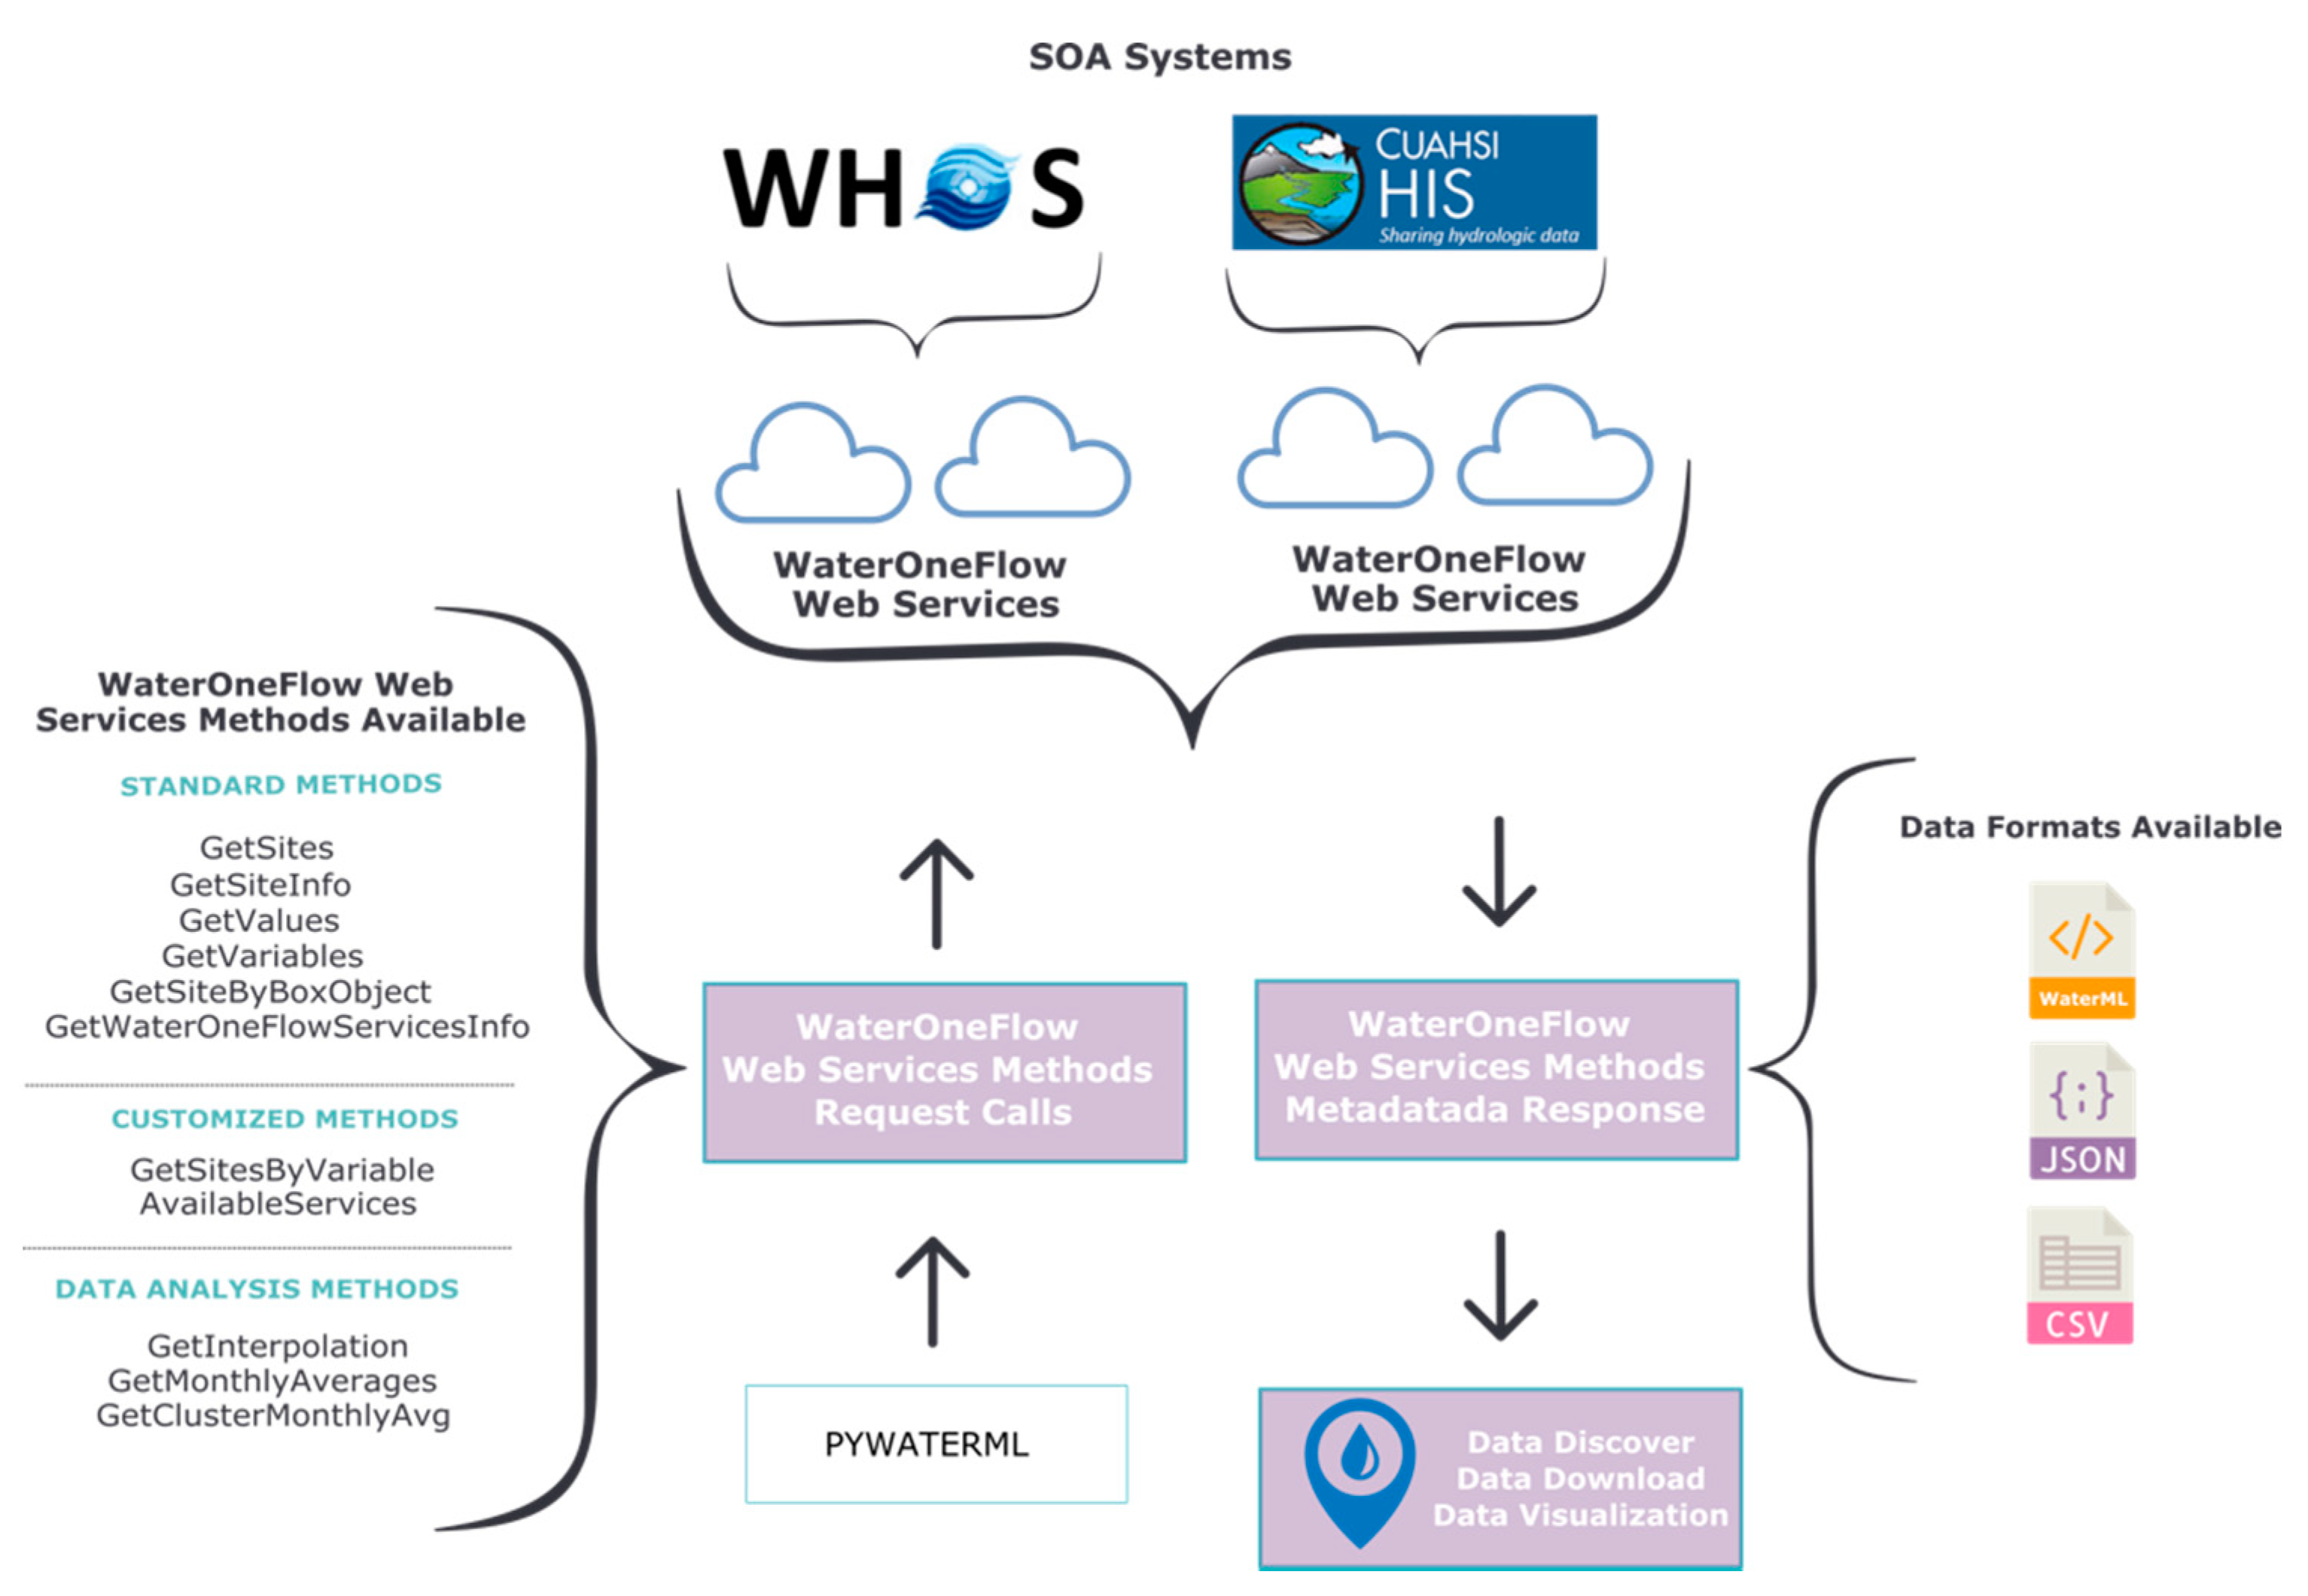
Figure 1 diagrams how Pywaterml executes WaterOneFlow web services methods, receives responses, and formats the data in JavaScript Object Notation (JSON), WaterML 1.0, or comma-separated values (CSV) file formats. First, Pywaterml connects with the selected WaterOneFlow web service using a Simple Object Access Protocol (SOAP)-based web service client. Second, Pywaterml requests and retrieves different data types using the standard WaterOneFlow web service methods. WaterOneFlow has six different methods for different types of data, such as GetSites for obtaining a list of sites with data, and GetSitesInfo for obtaining the metadata, or description, of a site. Pywaterml has five methods to analyze the retrieved data: two customized methods that extend the standard WaterOneFlow methods; and three additional analysis methods. These are described later in the paper. Third, Pywaterml formats the data obtained from the different methods using any of three data format standards (JSON, WaterML 1.0, CSV). Once the data have been retrieved and formatted, they can be used for data discovery, download, or visualization in the client component. WDE has capabilities for these tasks, or someone using the API can use custom tools for these tasks.
2.2. Tethys Application Framework
We developed WDE using the Tethys Platform framework [
32,
33,
34]. The Tethys Platform consists of three major components for developing and deploying web applications for spatial time series data: Tethys Software Suite, Tethys Software Development Kit (SDK), and Tethys Portal. Tethys Software Suite includes file dataset management, user account management, spatial database storage, geoprocessing, mapping and visualization, and distributed computing functions. Tethys SDK provides APIs to access the tools in the software suite. The Tethys SDK provides the tools to customize WDE creating custom settings and persistent storage for a selected area or region. Tethys Portal allows users to install a generic version of WDE and customize it through the web user interface. The SDK allows more customization, but is more complex to use, while Tethys Portal allows WDE to be easily modified to focus on a specific region or data sources.
WDE can be modified to customize the name of the application displayed in the user interface, to add a Web Mapping Service (WMS) vector layer representing a regional boundary in which the observation sites will lie, and to assign a database to download and store data retrieved from the SOA systems. This allows users to create a version of WDE for their area with a specific name and boundary or mapping information. This means that the WDE instance appears as a unique data interface. For example, administrator users can customize the WDE user interface for a national organization by providing the organization name, a WMS layer that serves as a polygon boundary that defines the area of interest containing the observation sites, and a database to store the metadata from the different WaterOneFlow web services
2.3. WDE Organization
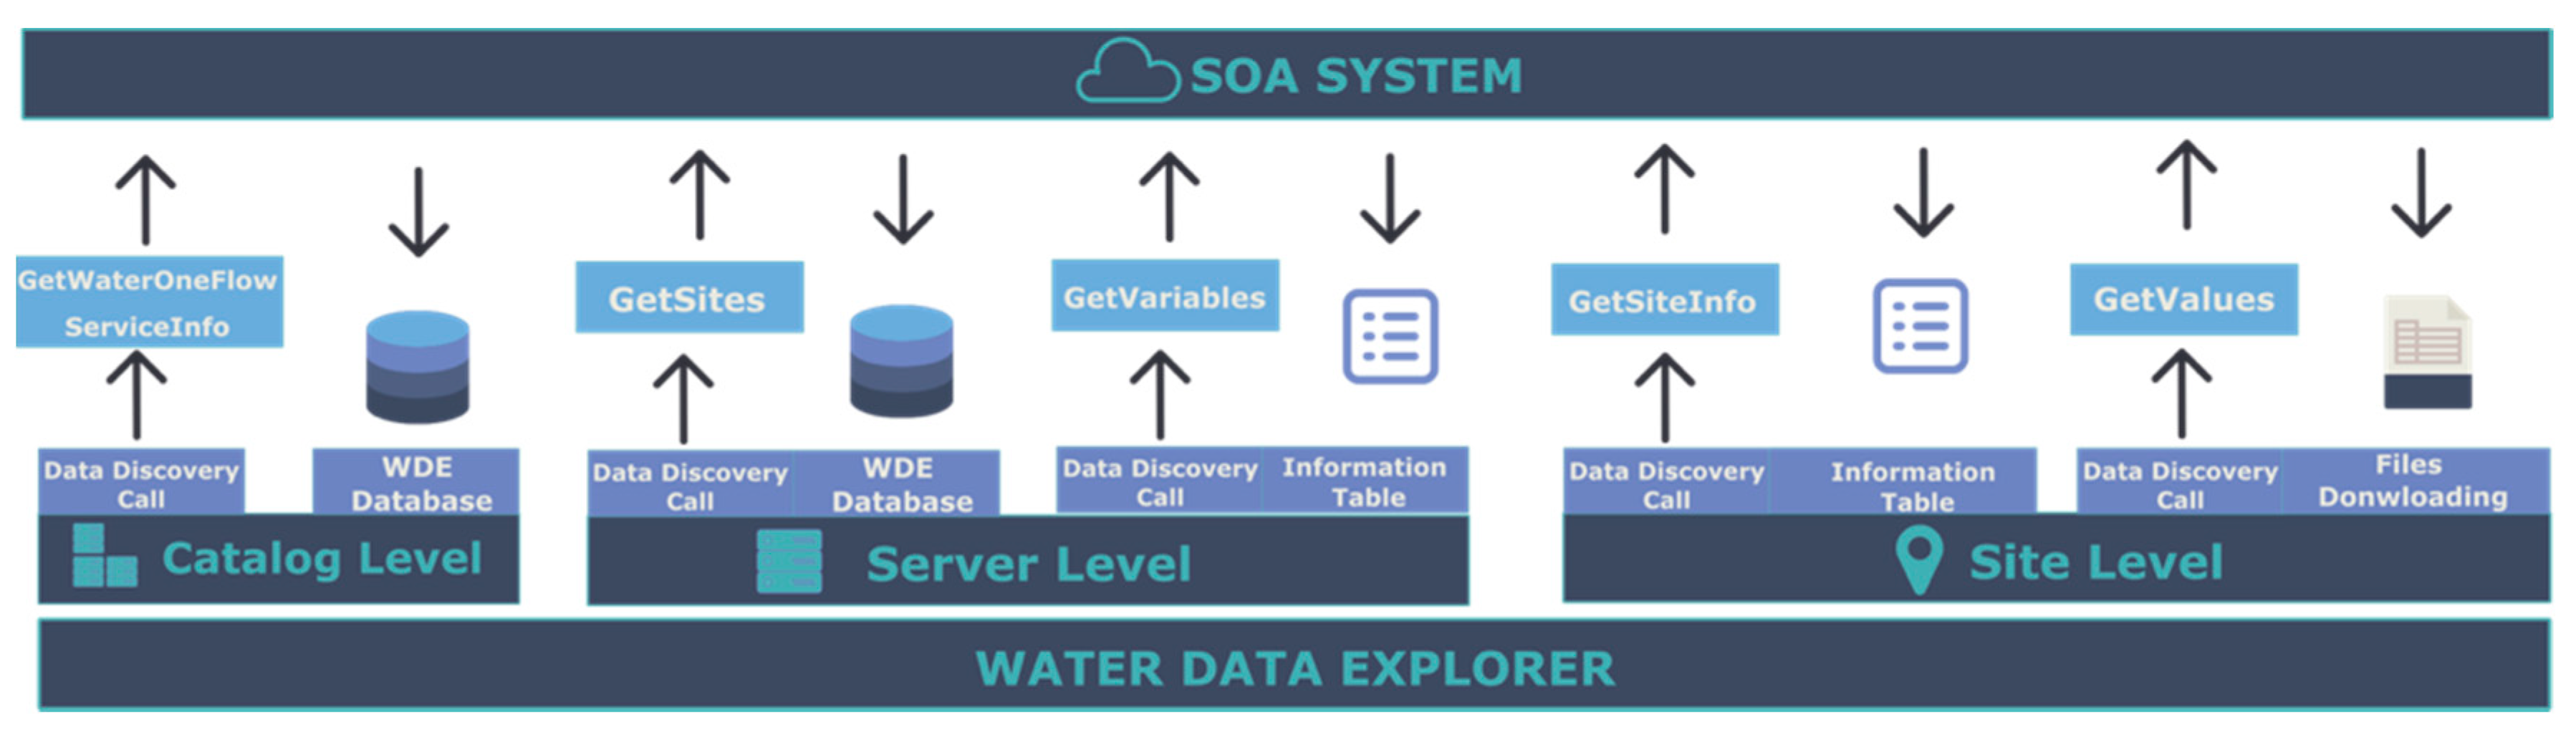
WDE uses catalogs to organize and manage the different WaterOneFlow web services. WDE can create catalogs from existing WaterOneFlow web services. WaterOneFlow web services can contain other WaterOneFlow web services that are catalogs of other WaterOneFlow web services, describing a network of WaterOneFlow servers. These WaterOneFlow catalogs provide metadata for other services, such as the HIS Central Registry, or a WHOS view. Not all WaterOneFlow web services provide web service catalog functionality. WaterOneFlow web services can provide either a catalog of different data servers or the data server itself. We designed the WDE structure to manage three different levels: catalogs, servers, and sites. The bottom level is the site, which is a representation of an observation site which contains both metadata describing the site and observation data. At the next level, a server represents a collection of sites, and at the top level a catalog represents a collection of servers.
WDE uses different WaterOneFlow web services methods to retrieve metadata for the different levels.
Figure 2 depicts the different WaterOneFlow web services methods used to retrieve data at each WDE level and shows the databases WDE uses to store the downloaded metadata from the responses of these methods.
WDE uses Pywaterml to access the web services methods at each level with Pywaterml methods with the same name as the WaterOneFlow method.
The catalog level retrieves information using the GetWaterOneFlowServiceInfo WaterOneFlow method, then stores the metadata it receives in the WDE local database catalog table.
The server level uses the methods GetSites and GetVariables to retrieve data and to store the metadata it receives in the server table in the WDE local database.
The site level retrieves metadata using two methods: GetSiteInfo and GetValues, but it does not store the retrieved metadata in the local database. Instead, it downloads the content it receives to local storage.
WDE stores the catalog and WaterOneFlow server level responses to avoid multiple network requests that would be required to load the metadata at WDE startup. For example, geospatial visualization of the different sites requires calling the GetSites method for each WaterOneFlow service contained in each catalog of the application. However, having the response saved in the local WDE database reduces the loading time and removes the need to request remote data every time WDE starts. By contrast, WDE does not store metadata at the site level because it would require downloading metadata for each site. Generally, queries are made for a relatively small number of sites and variables and do not require storing the entire database locally. Consequently, every time there is a request for metadata related to a specific site or time series observation values, WDE makes a new request using Pywaterml to download the data.
2.4. Data Discovery
2.4.1. Data Discovery Overview
WDE uses two types of data discovery: 1) across all the WaterOneFlow web services that have been registered to any WaterOneFlow catalog such as HIS Central, or 2) within a single WaterOneFlow web service that has not been registered to a WaterOneFlow catalog. The first data discovery type is managed at the WDE catalog level. It provides a complete discovery of the catalog metadata and can access any of the WaterOneFlow web services methods associated with the catalog. The second data discovery type is managed at the WDE server level and makes discovery calls to WaterOneFlow web services that do not act as a catalog. For the CUAHSI HIS system, both types of discovery are available and allow WDE to access datasets that are documented at the HIS Central catalog, or it can access databases that are stored in individual or regional HydroServers. The WHOS system also supports both types of discovery and allows WDE to access customized datasets (“views”) from the WHOS broker.
2.4.2. Catalog-Level Data Discovery
Data discovery at the WDE catalog level can be performed two different ways: (1) general discovery, and (2) country-based discovery. General discovery at the catalog level accesses web services that are registered in a WaterOneFlow web services catalog. Country-based discovery restricts the discovery to the web services within a selected region. The country-based discovery uses latitude/longitude polygons that define the selected countries or region. During discovery, each site is filtered by to determine if the site lies within the polygons. WDE performs country-based discovery on the local WDE database, which is different to general discovery, which uses Pywaterml to access the WaterOneFlow web services methods on the SOA systems.
2.4.3. Server-Level Data Discovery
The WDE Server level has two different methods: (1) general discovery, and (2) variable discovery for the WaterOneFlow web services represented as servers. The general discovery method uses Pywaterml to discover new WaterOneFlow web services in SOA systems that can either be part of a catalog or separate, making it possible to expand the number of servers in the catalog. Variable data discovery uses Pywaterml to operate on different WaterOneFlow servers. The general discovery procedure at the server level is similar to the catalog-level discovery. It requests information using WaterOneFlow web services methods and stores the retrieved metadata in the local WDE database. Variable data discovery does not save the retrieved metadata in the WDE database, but instead presents the data as an information table in WDE.
2.4.4. Site-Level Data Discovery
WDE site-level discovery has two different methods: (1) general, and (2) time series discovery for each site on the WaterOneFlow servers. General discovery retrieves the metadata for a site, such as: site name, supervising organization, and observed variables using the GetSitesInfo method. The general discovery procedure at the site level is different to the one performed at the catalog and server levels because it does not store the metadata in the local WDE database, but provides the data as a file download containing the site metadata.
2.4.5. Metadata Harvesting for Caching Purposes
WDE uses a PostgreSQL database that is part of Tethys to store the metadata received from general data discovery at the WDE catalog and server levels. Data from the variable data discovery at the server level and the general and time series data discovery at the site level are not stored locally but are presented in WDE or are available for download.
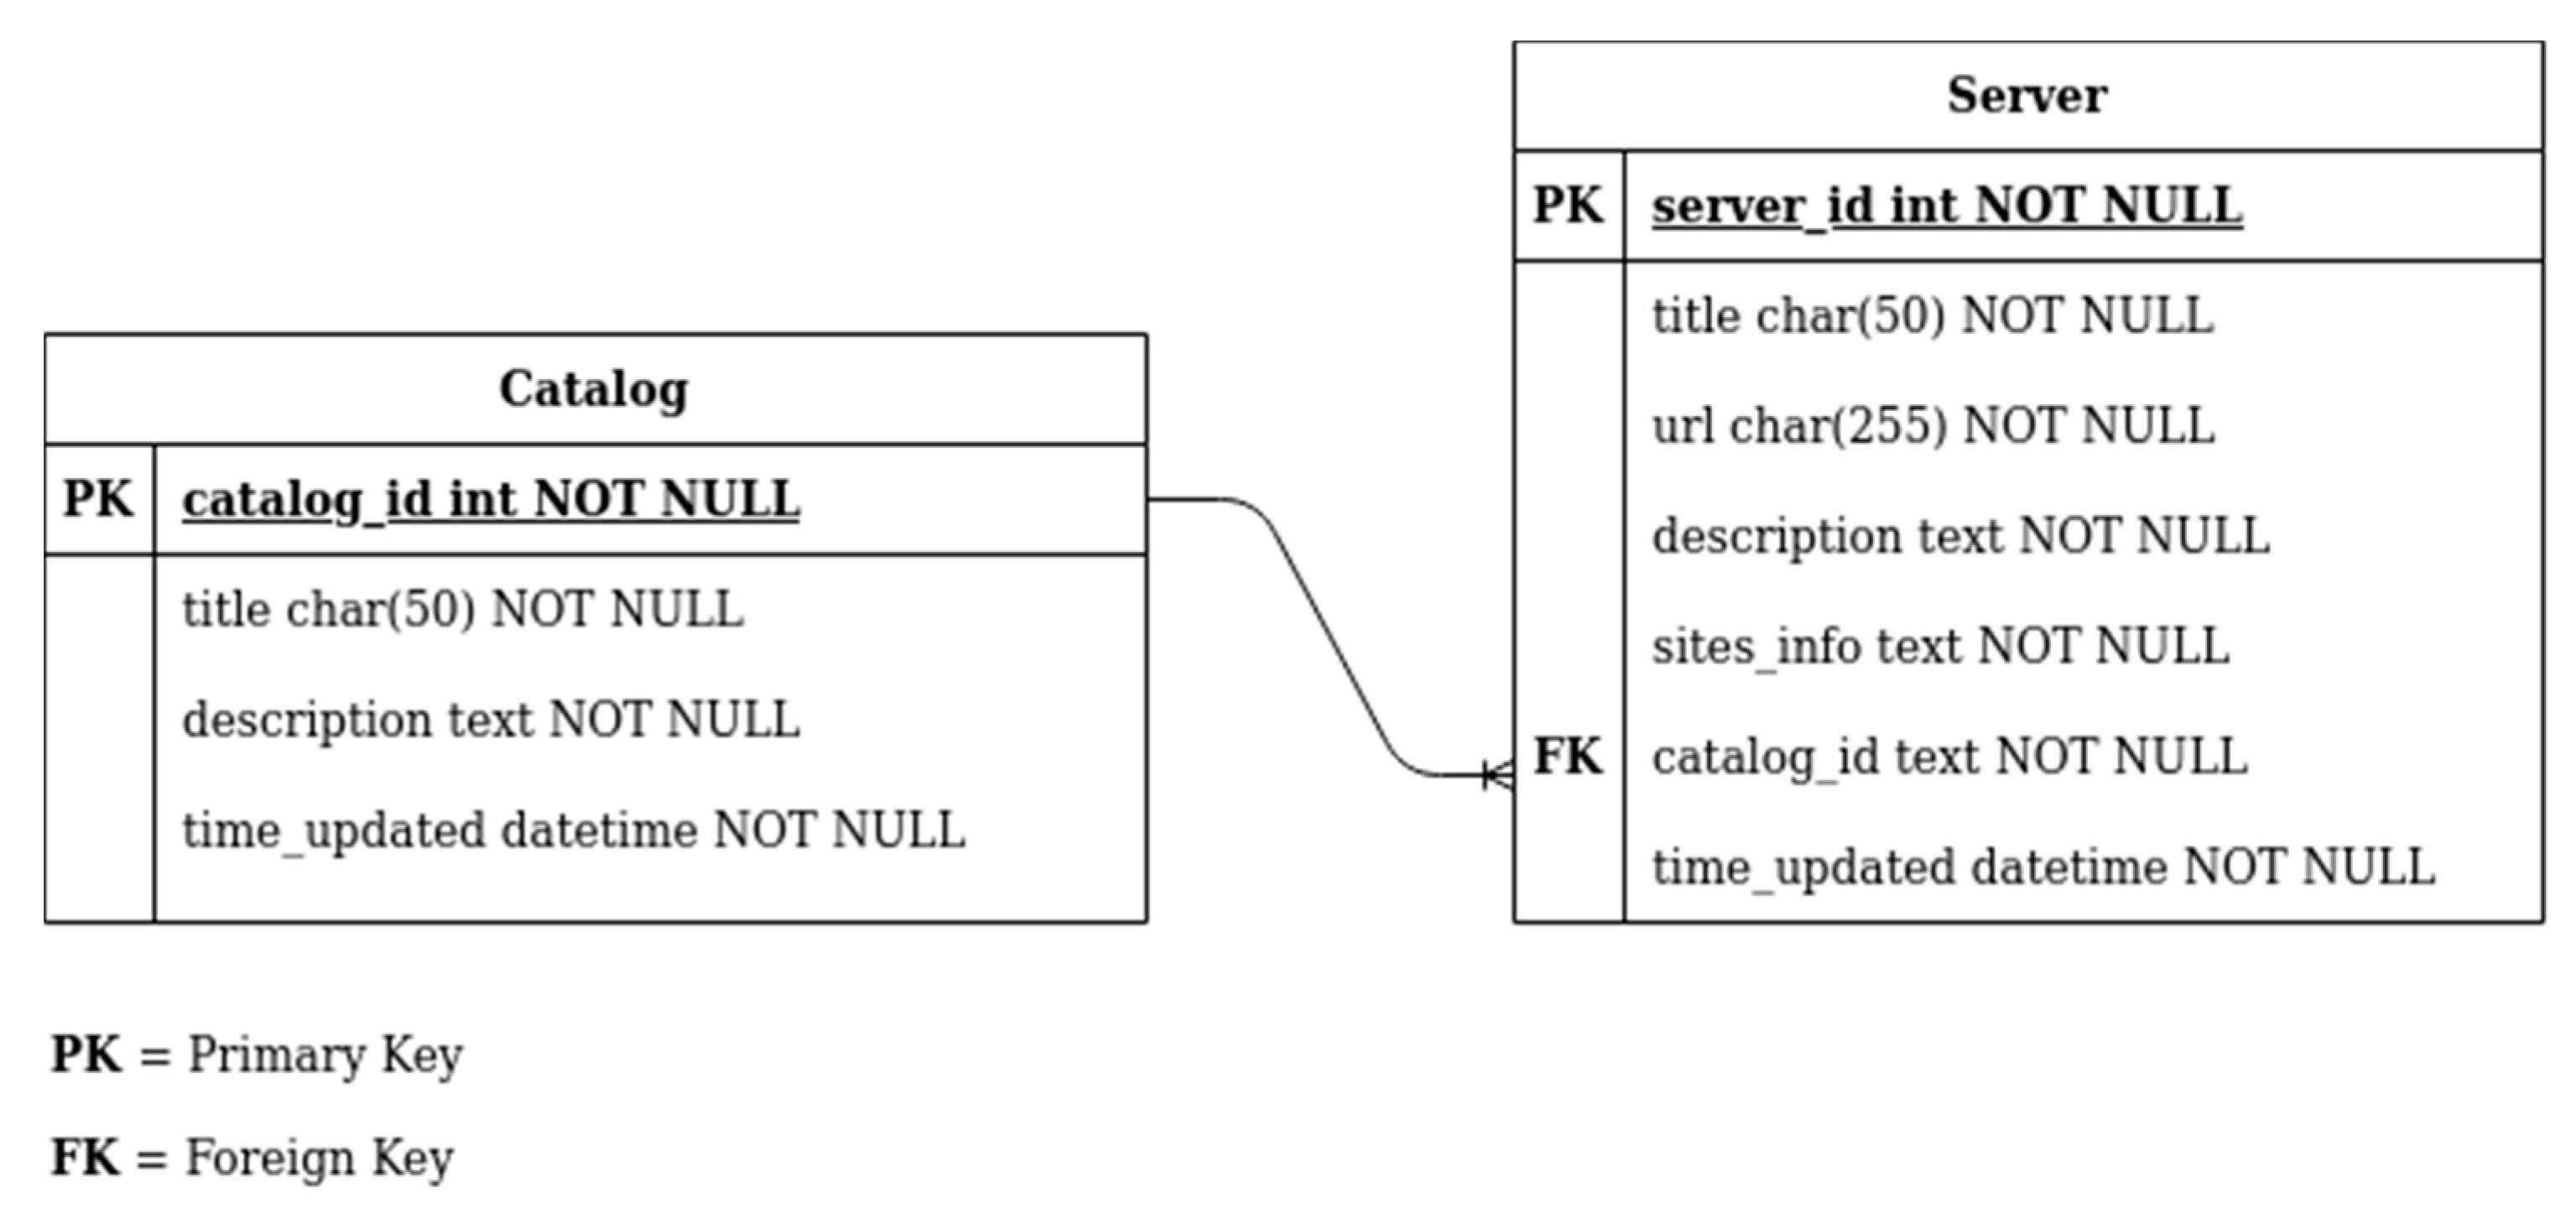
General discovery at the WDE Catalog level stores the following metadata: (i) name, (ii) description, and (iii) URL of the WaterOneFlow web services. The metadata stored from the general discovery consists of: (i) site names, (ii) site codes, (iii) site geospatial locations, and (iv) site network. WDE stores a local copy of these metadata in the Tethys PostgreSQL database. These data are stored in one database using two tables: one for different WDE catalogs, and the other for servers, as shown in
Figure 3. Storing data in the local database allows WDE to quickly access and present data that have already been discovered so that discovery does not occur each time WDE is run, which can be time consuming and place undue loads on the servers. For example, for the CUAHSI HIS system, the Server table contains all the metadata for each site on the server which is retrieved using the GetSites method. For the WHOS system, the Server table contains the metadata for each site associated with any from the different WHOS custom views. Similarly, the Catalog table contains metadata for each catalog retrieved using the GetWaterOneFlowServicesInfo method to a HIS Central catalog (CUAHSI HIS) or a WHOS customized view.
2.5. Data Download
Time series data discovery finds and retrieves observations of the different variables for a selected site using the GetValues method. Similar to the general discovery at the site level, the time series observation values are not stored in the local WDE database but can be downloaded to a file in one of three formats: CSV, NetCDF, or XML (WaterML 1.0. and WaterML 2.0.). CSV and WaterML 1.0. formats are provided by the Pywaterml package because they are common formats for data exportation. WaterML 2.0. and NetCDF formats are supported because they are standardized data file formats used for water data. These formats are used internally by WDE. WDE does use data in JSON format internally, but this format it is fully supported by Pywaterml for data exportation.
2.6. Data Visualization
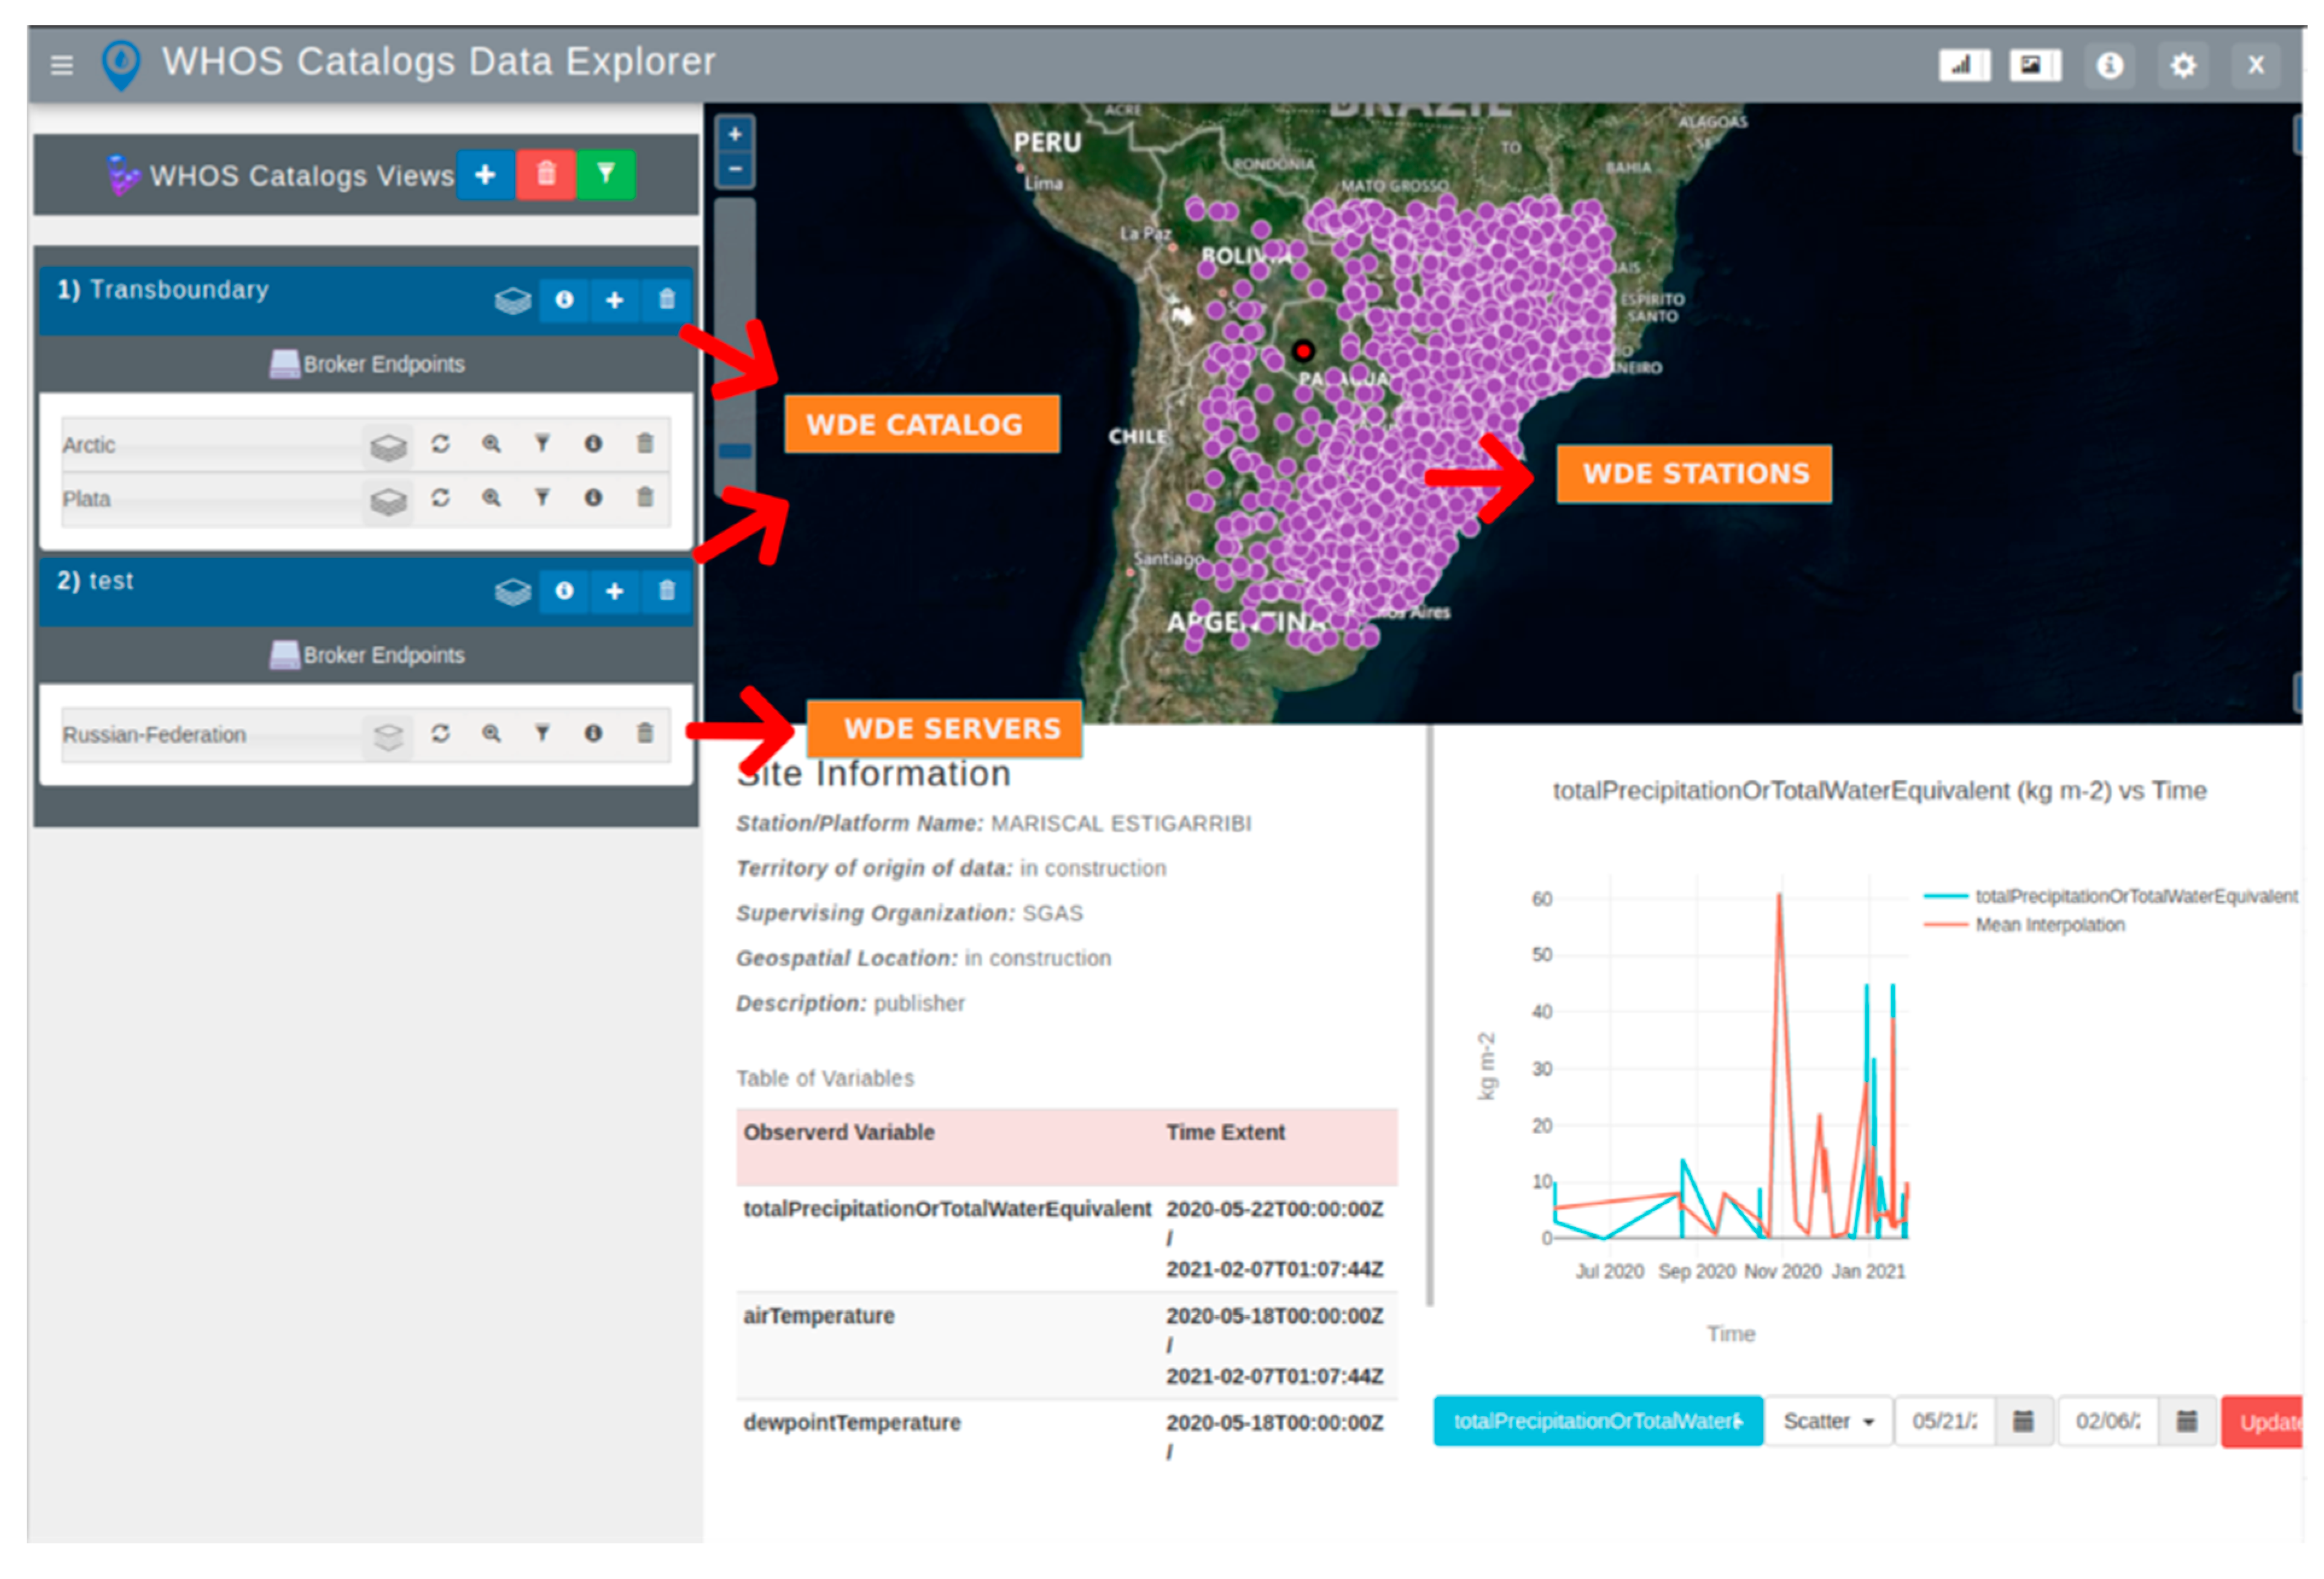
WDE includes tools for visualizing geospatial site information and time series data. The WDE User Interface (UI), shown in
Figure 4, includes a map on the right-hand side which displays the discovered sites. The site information and time series data visualization for a selected site are displayed in the lower portion of the map. This includes both the metadata to describe the site and the data and time series plots for exploration.
The WDE map view provides visualizations for the following information: (i) site name, (ii) territory of origin, (iii) supervising organization, and (iv) geospatial location (latitude and longitude). WDE presents a table with the following fields: (i) observed variables, (ii) units, and (iii) temporal extent. The site information is displayed as soon as the metadata are retrieved. In the data view, WDE displays a time series plot after the user chooses the variable of interest and selects a site. After the site and variable are selected, WDE requests the data and, after receiving it using the GetValues method, produces the time series data. WDE uses the Plotly JavaScript library [
34] to implement the time series data visualization with options for both time-series and box-and-whisker plots.
3. Results
3.1. Case Studies
This section presents WDE instances customized for specific regions. As part of this demonstration, we show data from both the WHOS and CUAHSI HIS systems. To demonstrate these capabilities, we created two different WDE regional customizations, one to demonstrate access to the HIS Central catalog and one to demonstrate access to WHOS customized dataset views. In both case studies, the goal was to show how WDE could be customized for a specific region, then discover, download, and visualize data from different WaterOneFlow web services at both the WDE catalog and server levels. As part of this demonstration, we show the ability to generate geospatial visualization and data plots. We demonstrate time series data retrieval and storage in a local file using XML (WaterML 1.0, WaterML 2.0) and CSV file formats. We show visualizations from a number of different sites. All the data shown in these demonstrations were retrieved using Pywaterml methods from within WDE to access WaterOneFlow web services.
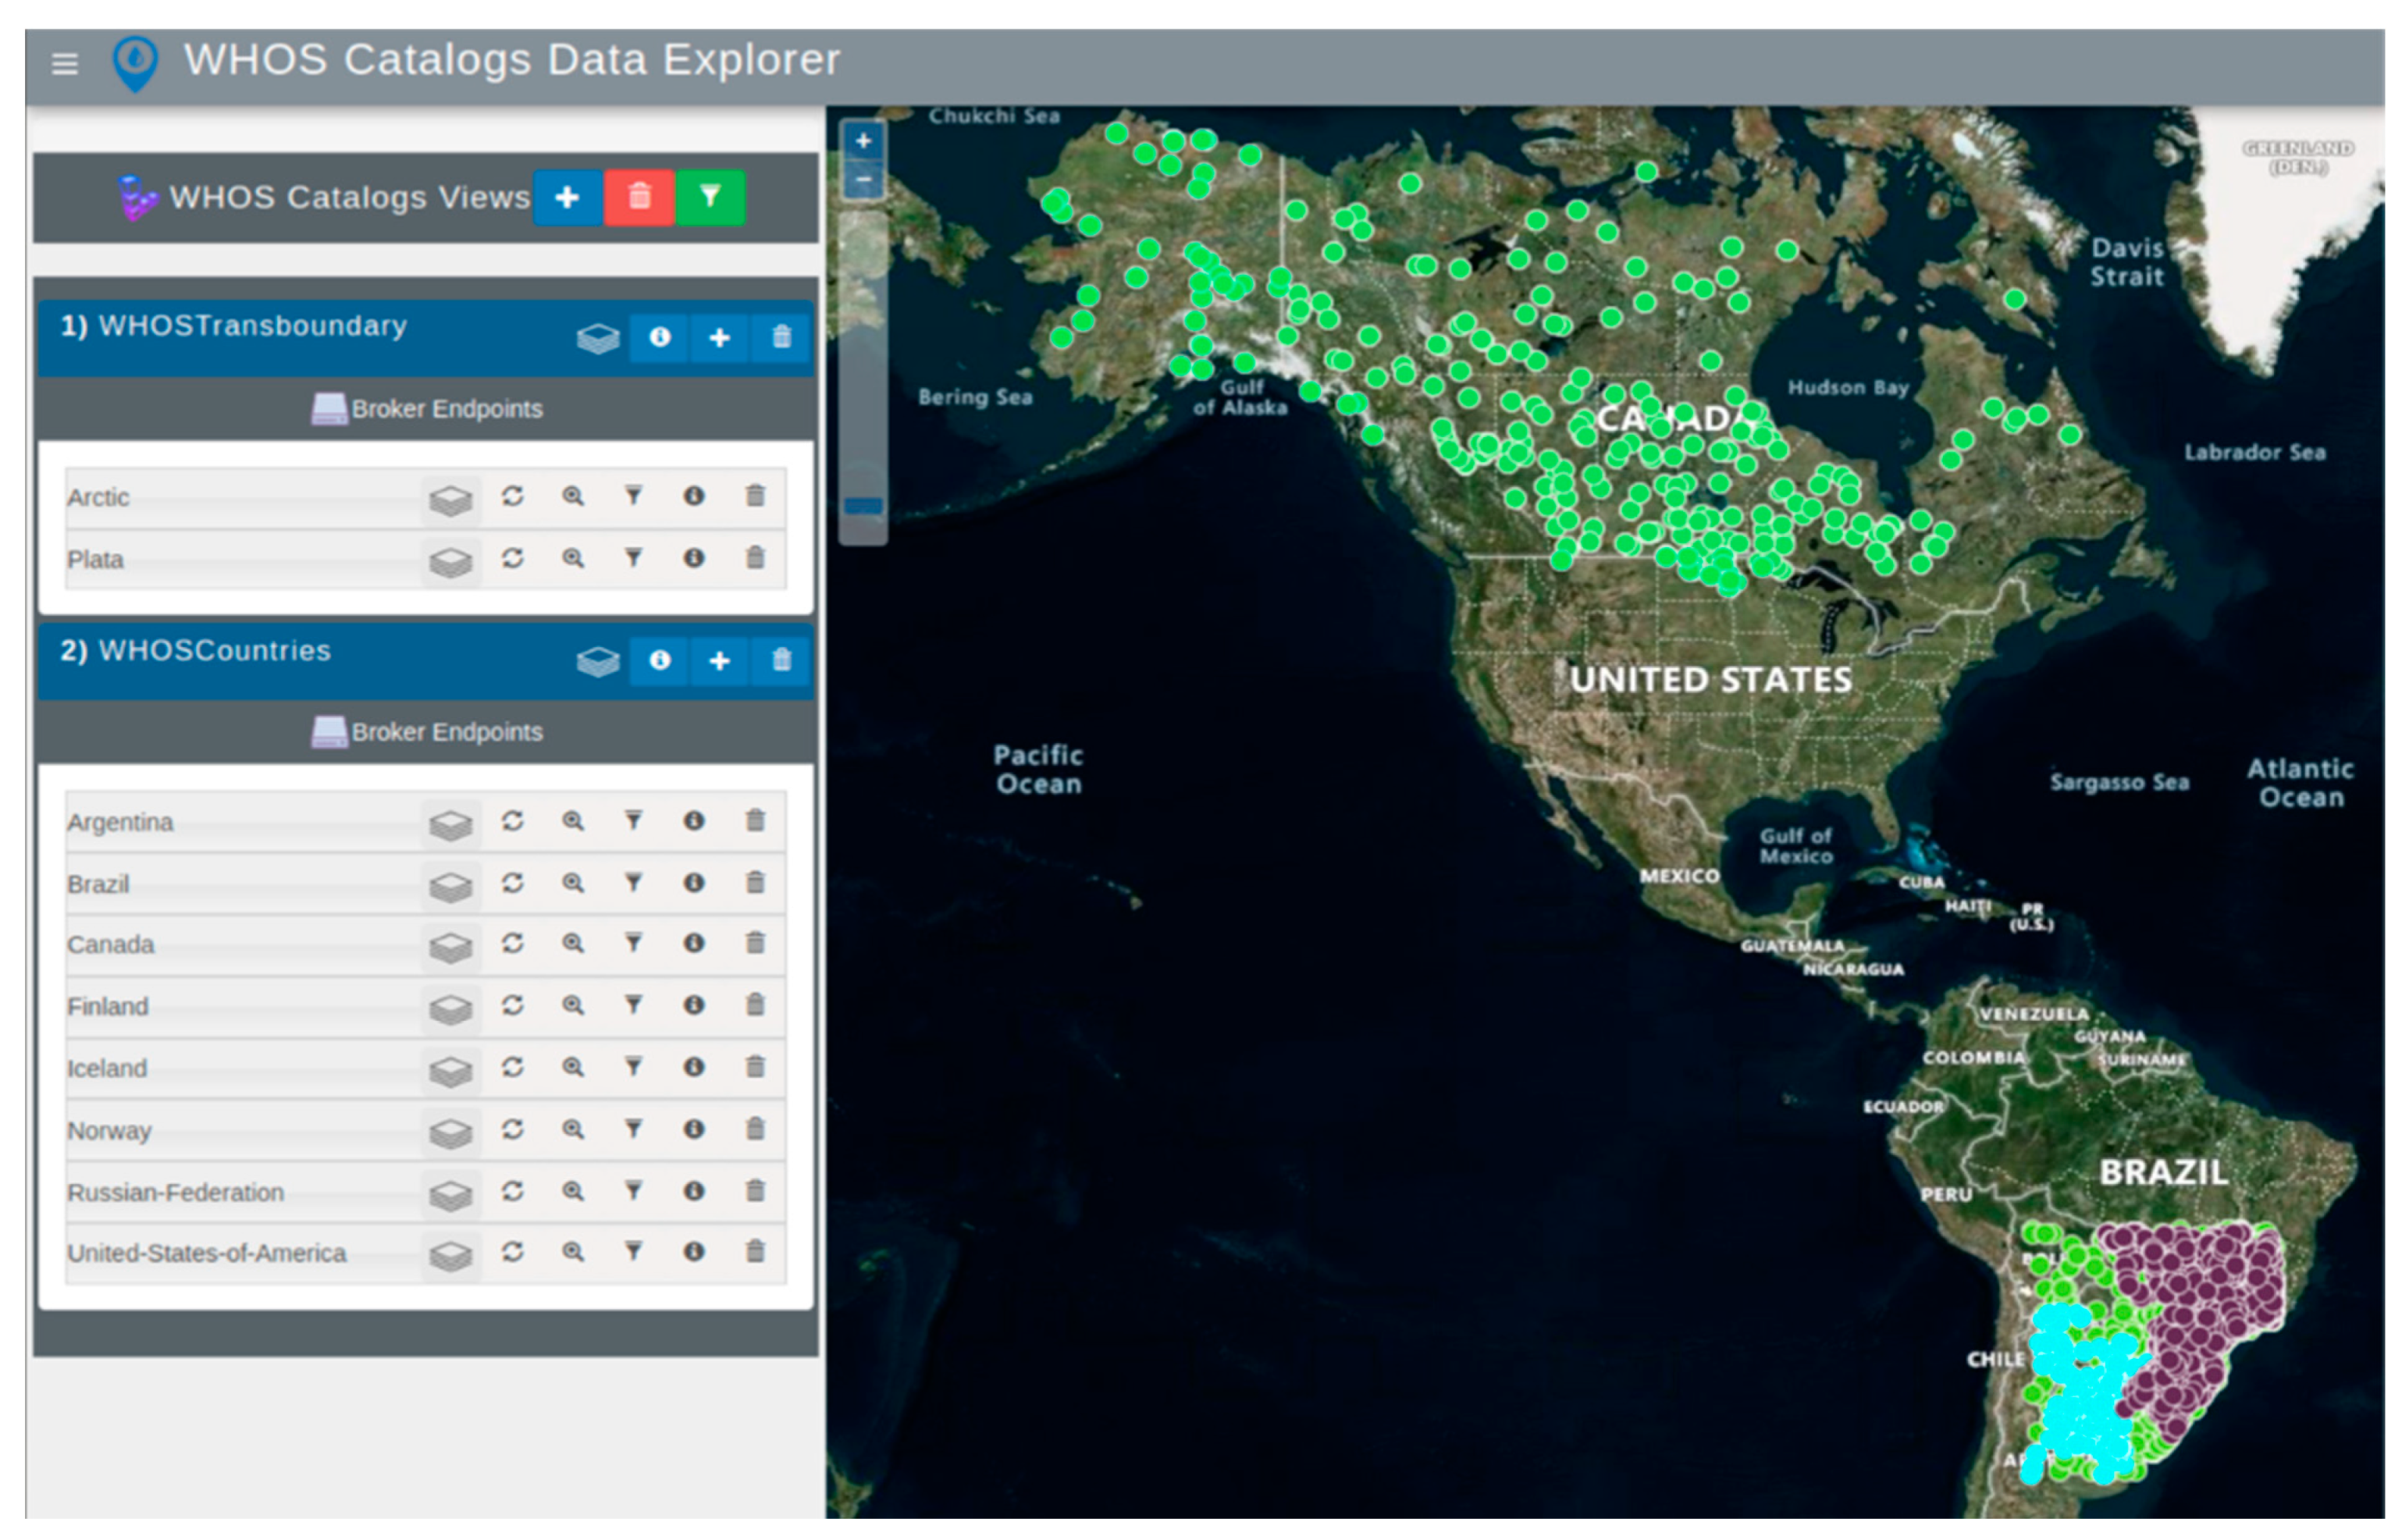
We call the first WDE case study “WHOS Views”. It demonstrates access to WHOS customized dataset views for the La Plata Basin in South America and for an Arctic region. This case study presents: (1) a catalog of transboundary regions of the La Plata Basin in South America and the Arctic region, and (2) a catalog of all the countries currently providing data for these regions using WHOS (
Figure 5).
We called the second WDE case study “HIS Central”. We demonstrate access to HIS Central catalog WaterOneFlow web services for the same regions. The only difference between the two case studies is the different WaterOneFlow web services used. Both applications have the same data discovery, download, and visualization capabilities.
3.2. Regional Customization
WDE can be customized to display different titles in the upper-left corner and to use the Web Mapping Service (WMS) layer to create a boundary that represents an area of interest. For each of the two case studies, WHOS Views and HIS Central, we created customized views, but we did not include a WMS layer for the boundary containing the observation sites. We did not add a WMS boundary layer because the geographic extent of the area of interest covers multiple countries on different continents, and the different colors representing the set of observation sites also makes data retrieved from the different servers distinguishable. If a boundary is added, it is generally either a watershed, region, or country outline.
3.3. Data Discovery
The WDE homepage presents a base map without any sites. This view allows the user to turn off or on the display of the different sites found using the WDE Catalog and server-level discovery methods. For the HIS Central case study, WDE performed general data discovery in the HIS Central catalog for any sites in the selected regions. In the WHOS Catalogs case study, it performed general data discovery in both the transboundary regions and the data provider countries catalog. For both case studies, the general discovery created a WDE catalog in the WDE database. After general data discovery, WDE displayed the retrieved data in the WDE catalog list.
In the WHOS Views case study, WDE discovered the transboundary and countries WaterOneFlow web services and their available web services, as shown in
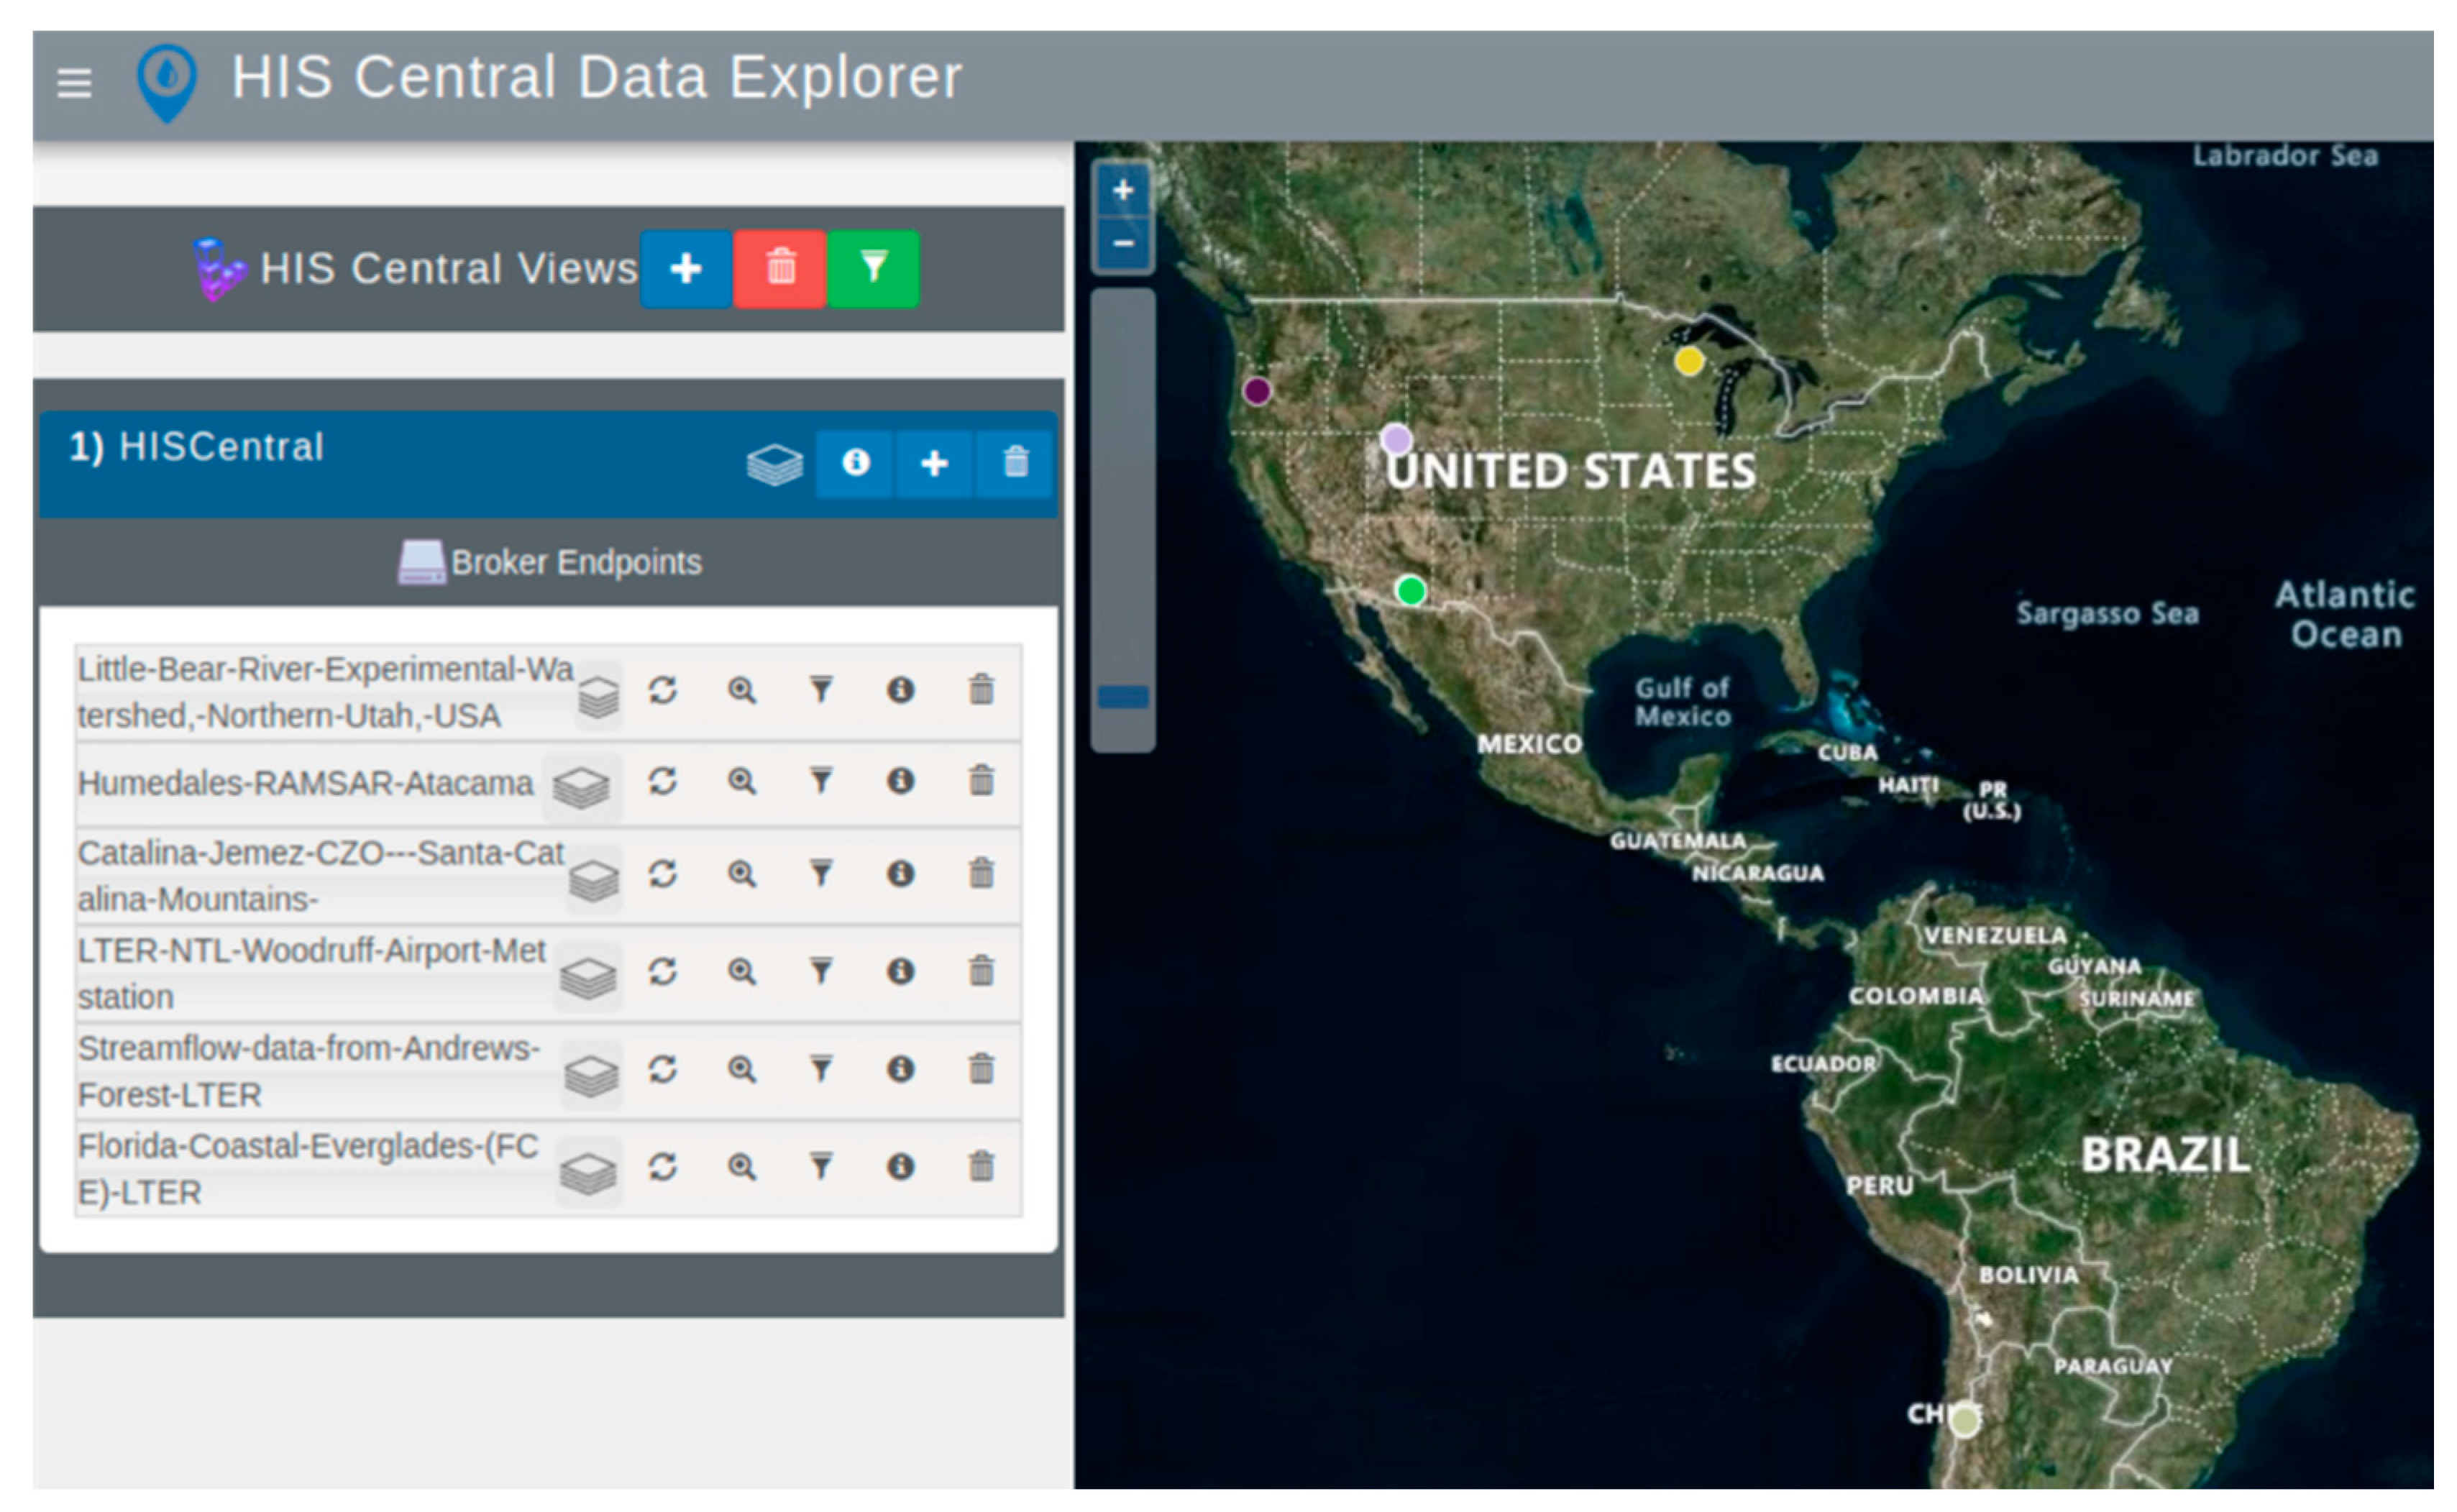
Figure 5. In the HIS Central case study, WDE did not discover all the WaterOneFlow web services from the HIS Central catalog because some contain large amounts of data, such as with the NWIS daily values. NWIS Unit values are available through WaterOneFlow web services from the U.S. Geological Survey (USGS) that slow down performance because of their size. Therefore, we designed the HIS Central customized WDE to only discover six WaterOneFlow web services without a specific selection criterion, as depicted in
Figure 6.
We tested country-based discovery in both case studies. WDE provides a country-based discovery menu after selecting the green button in the toolbar to the right of the view names, shown in both
Figure 5 and
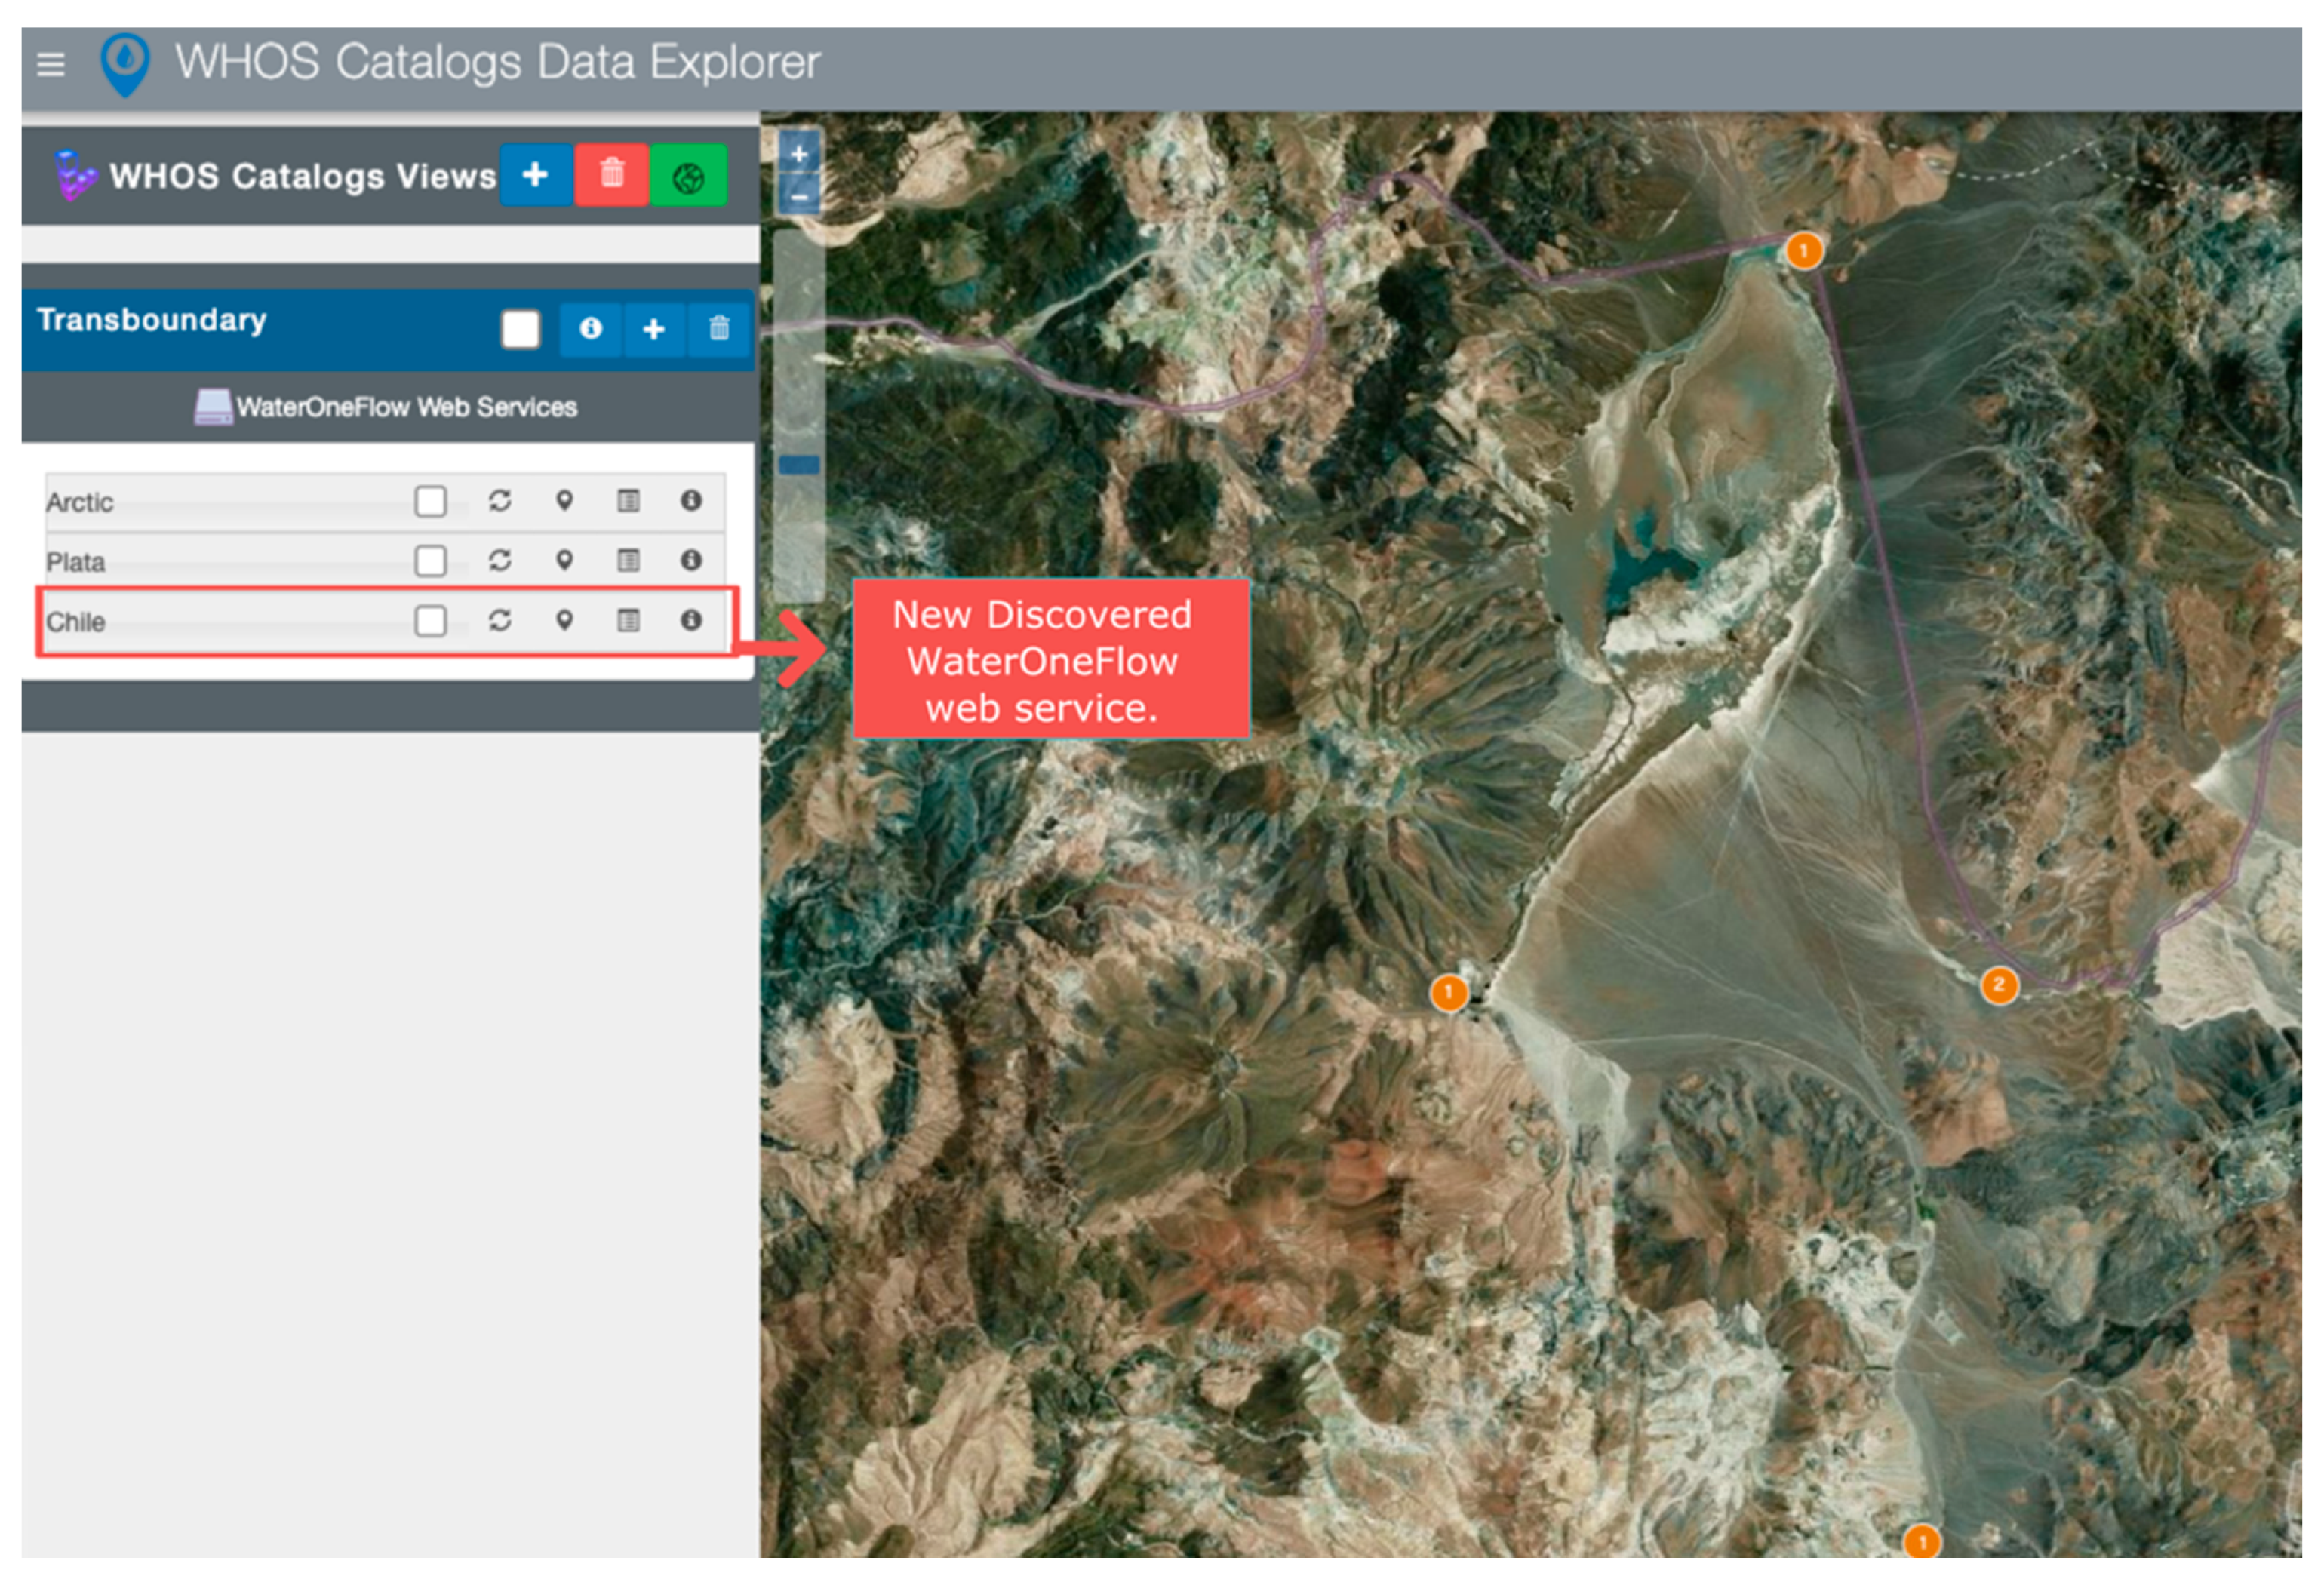
Figure 6. This button allows the user to select a country if the customized WDE contains services from multiple countries. The menu lists the different countries in which WDE discovered WaterOneFlow web services. For the WHOS Views case study, the countries with available data were Canada, Iceland, Brazil, Russia, Argentina, Bolivia, Paraguay, Finland, Uruguay, Norway, and the United States of America. In the HIS Central case study, the only two countries with available data were Chile and the United States of America.
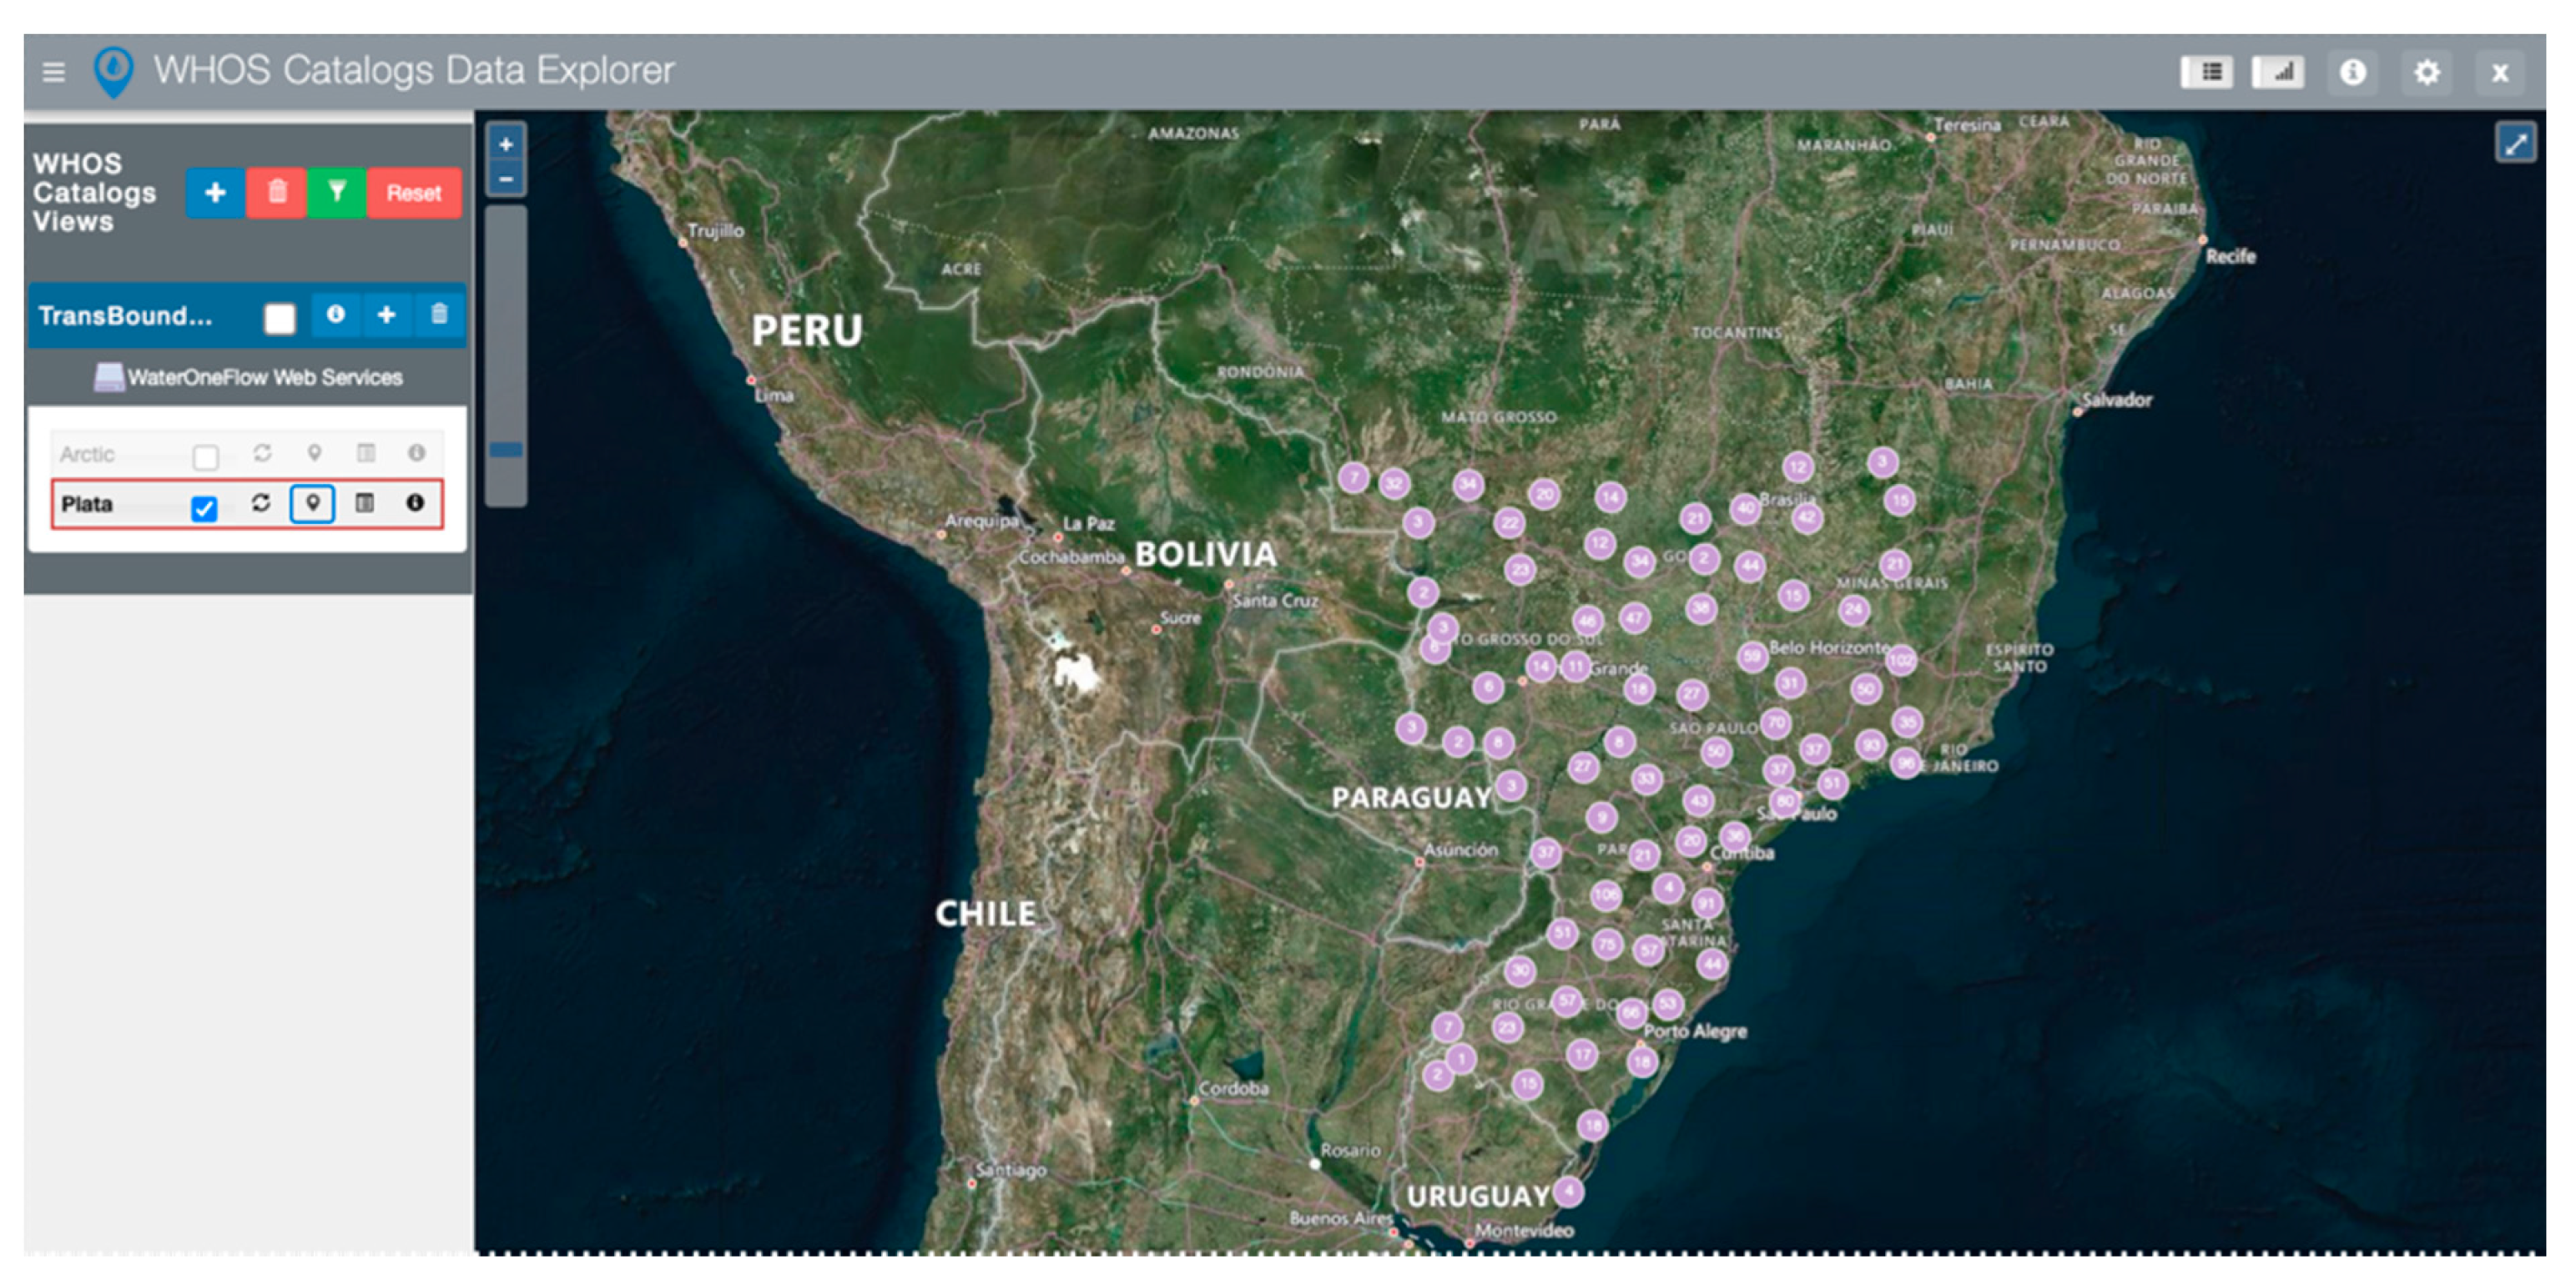
For discussion purposes, in the WHOS Views case study, we selected Brazil for the country-based discovery because it is part of the “Plata” server.
Figure 7 shows the results of the country-based discovery for the WaterOneFlow web services that have data within Brazil. It reports that “Plata” is the only WDE server that contains sites inside Brazil.
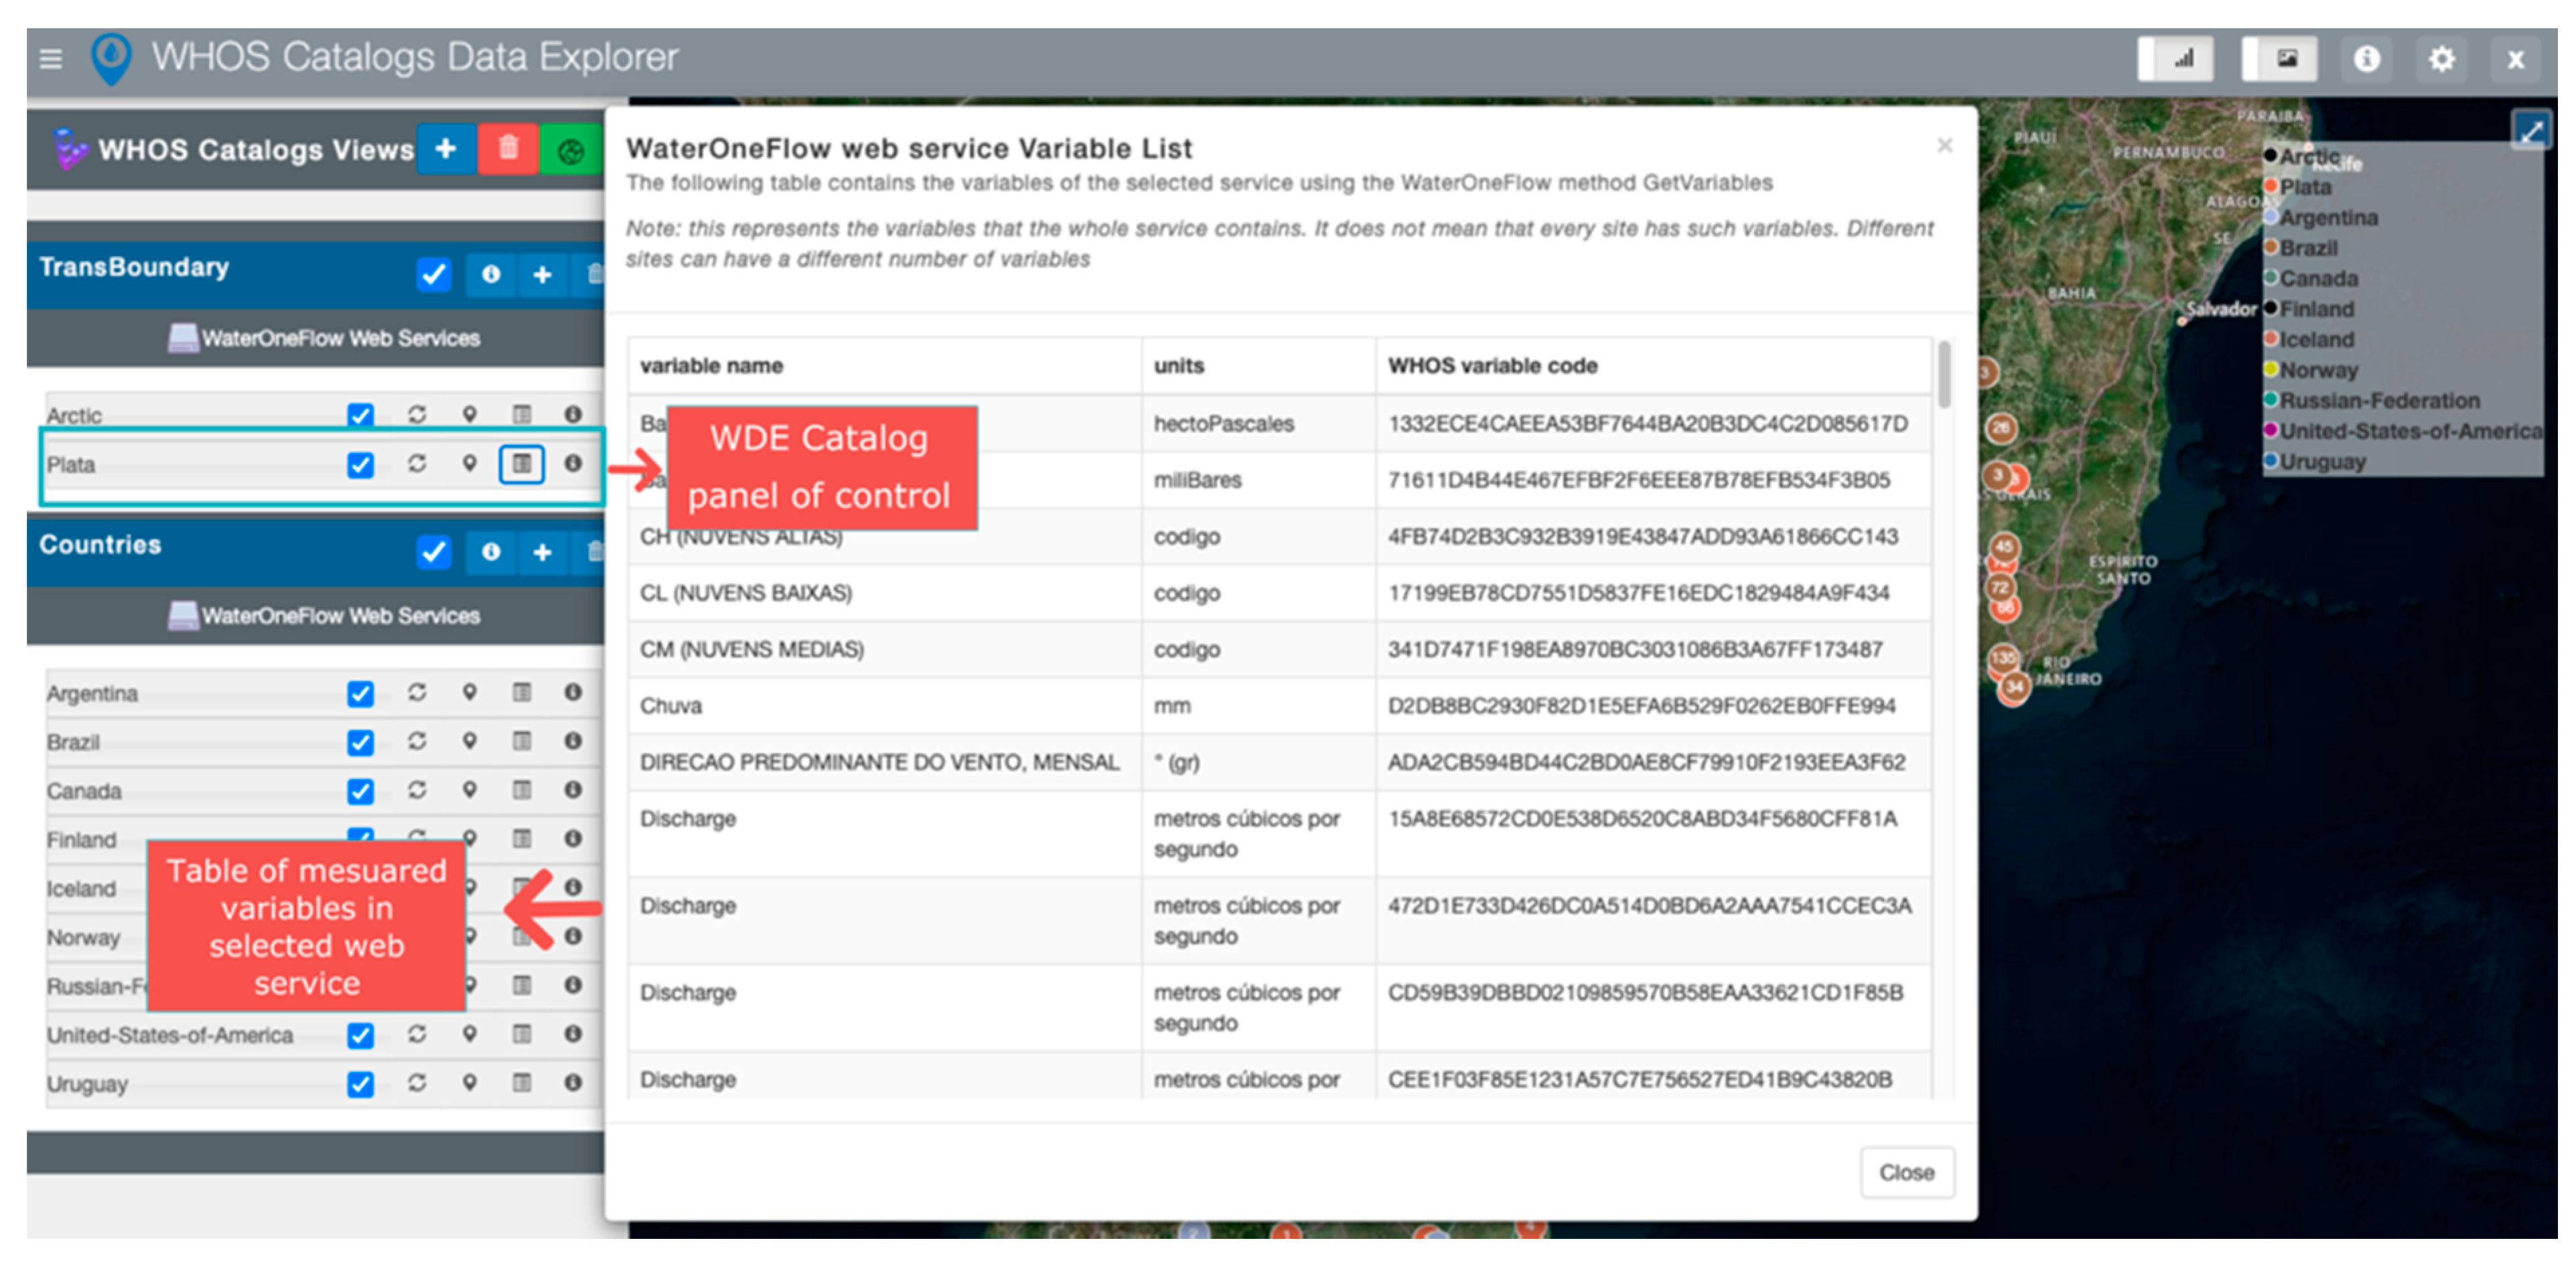
To demonstrate general discovery at the server level, for the WHOS Catalogs case study we used the Humedales Ramsar Atacama WaterOneFlow web service registered at CUAHSI HIS Central.
Figure 8 shows the results of the server general discovery. For the WHOS Catalog case study, WDE conducted variable discovery for the WaterOneFlow web service at the “Plata” server in the Transboundary catalog, with the results shown in
Figure 9. The metadata from the different variables belonging to the La Plata WaterOneFlow web service are displayed in a table containing variable name, measurements units, and WHOS variable code.
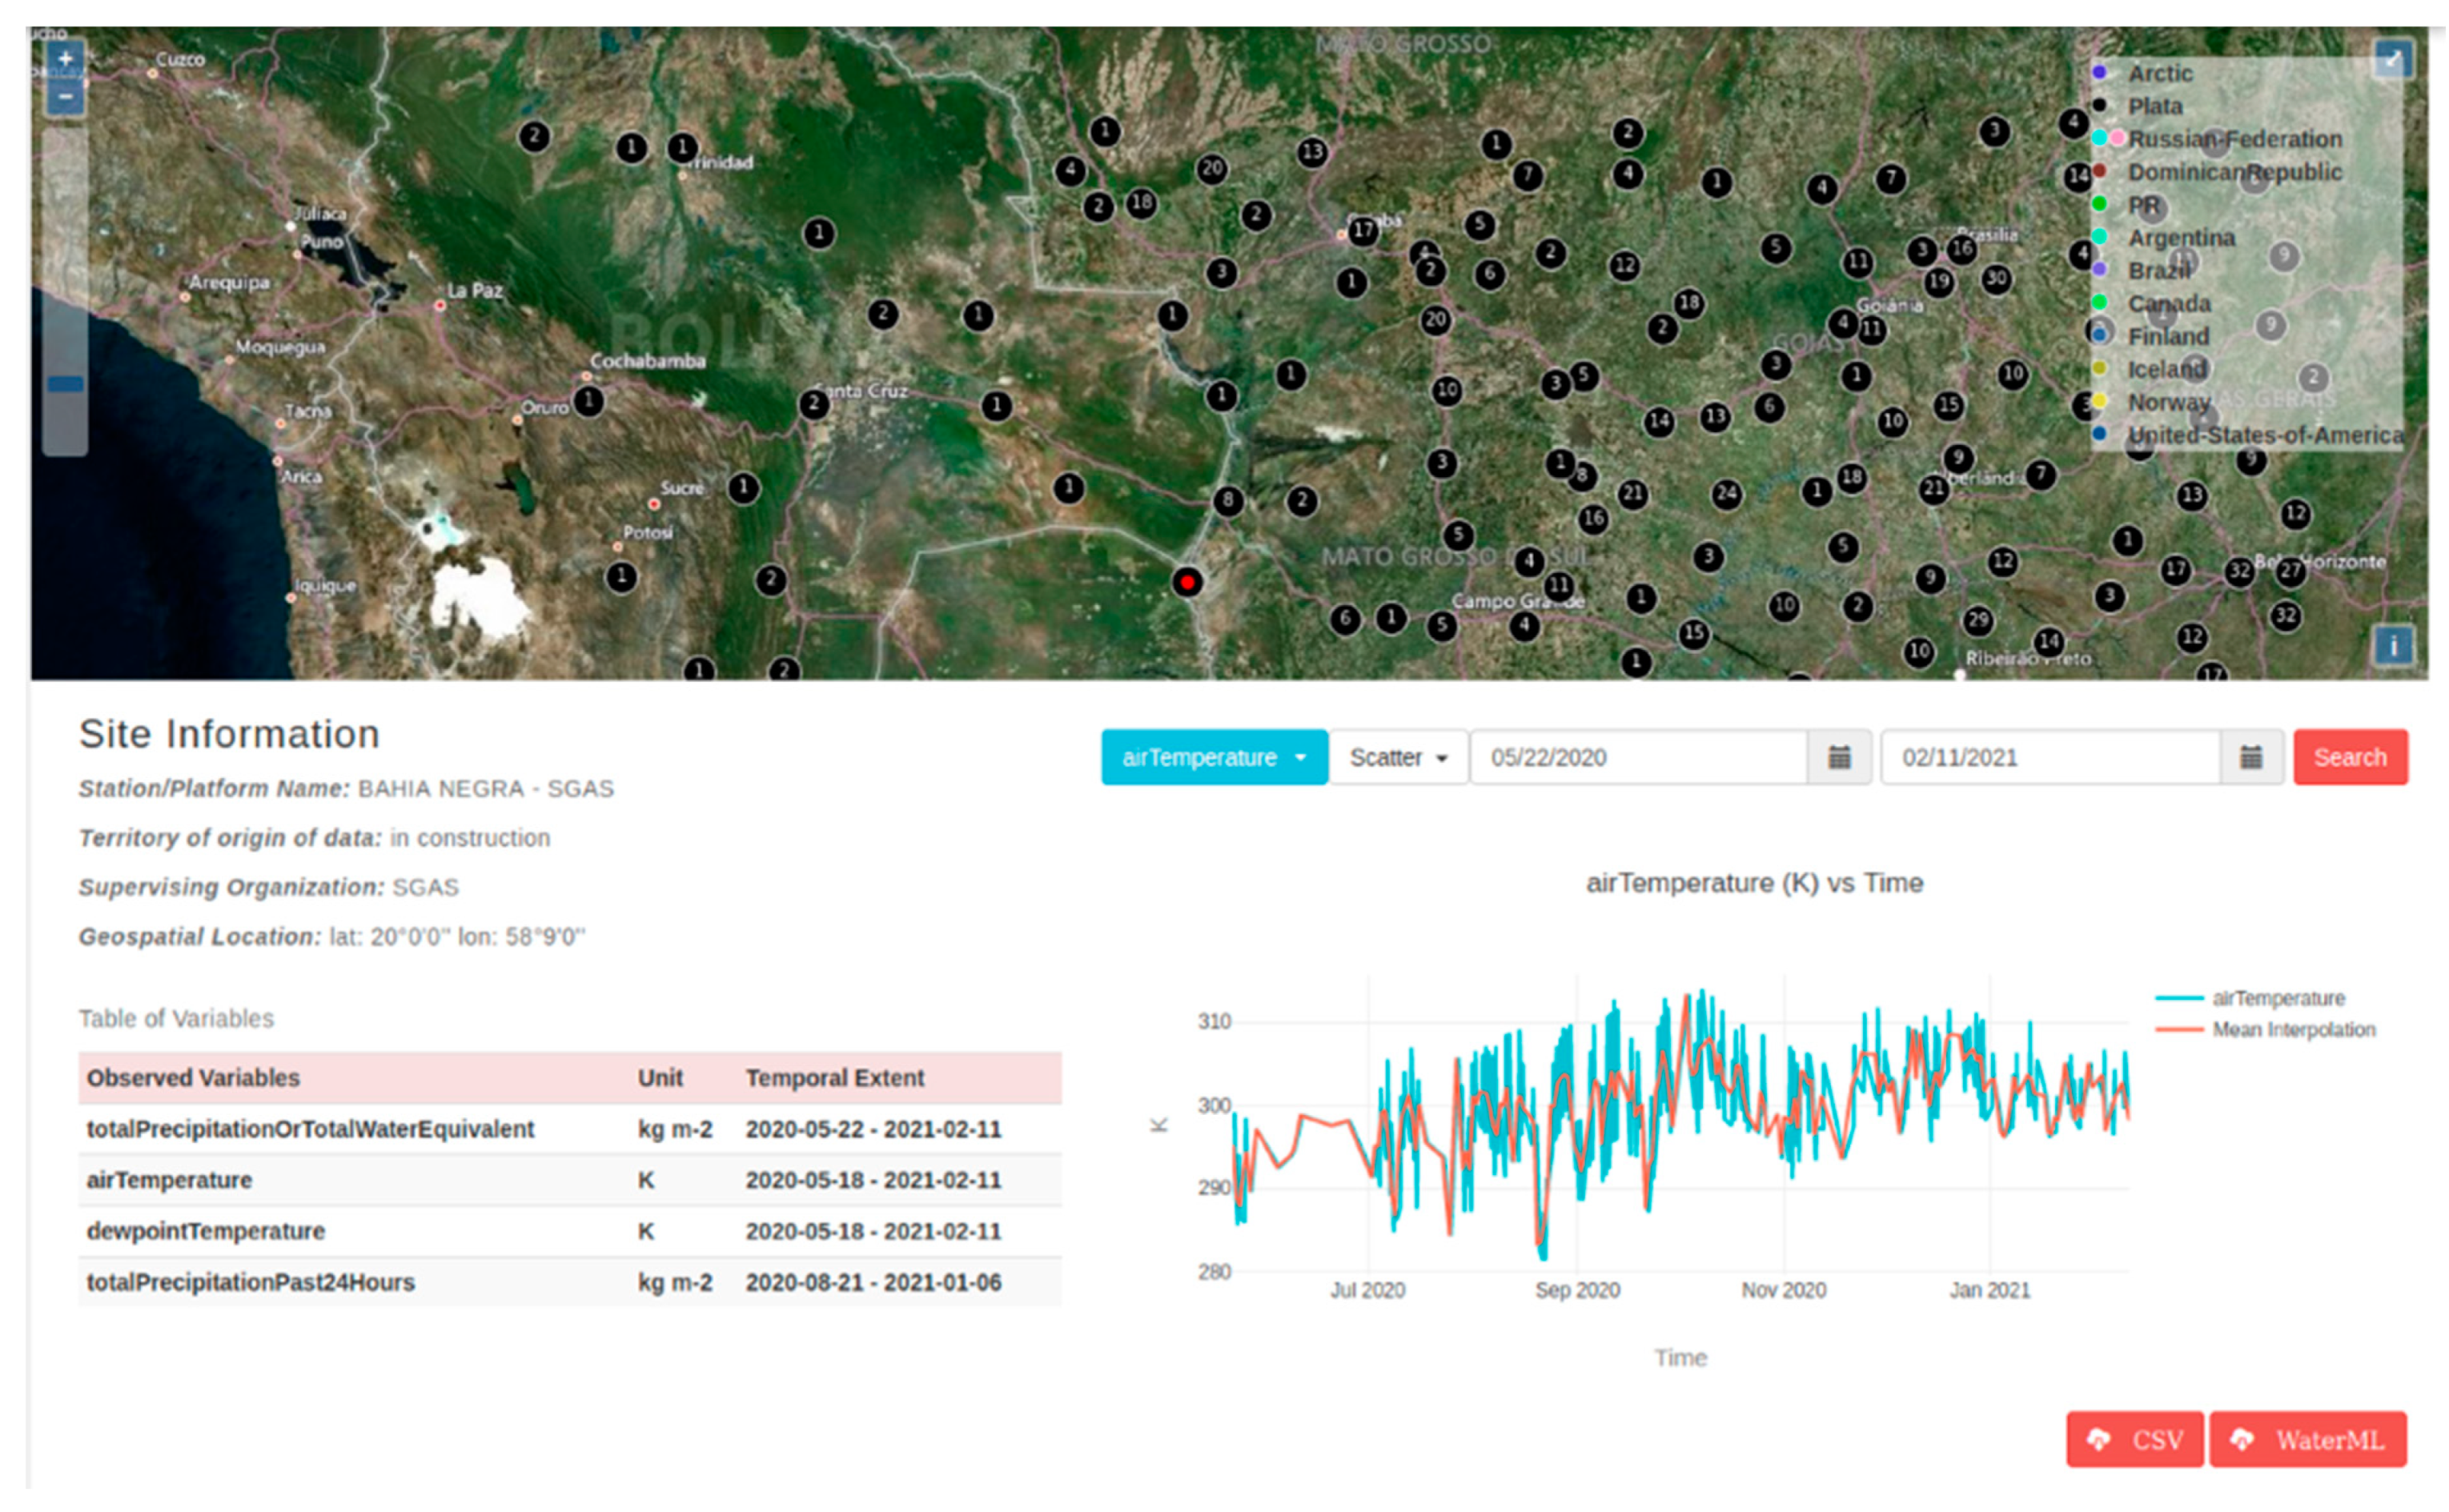
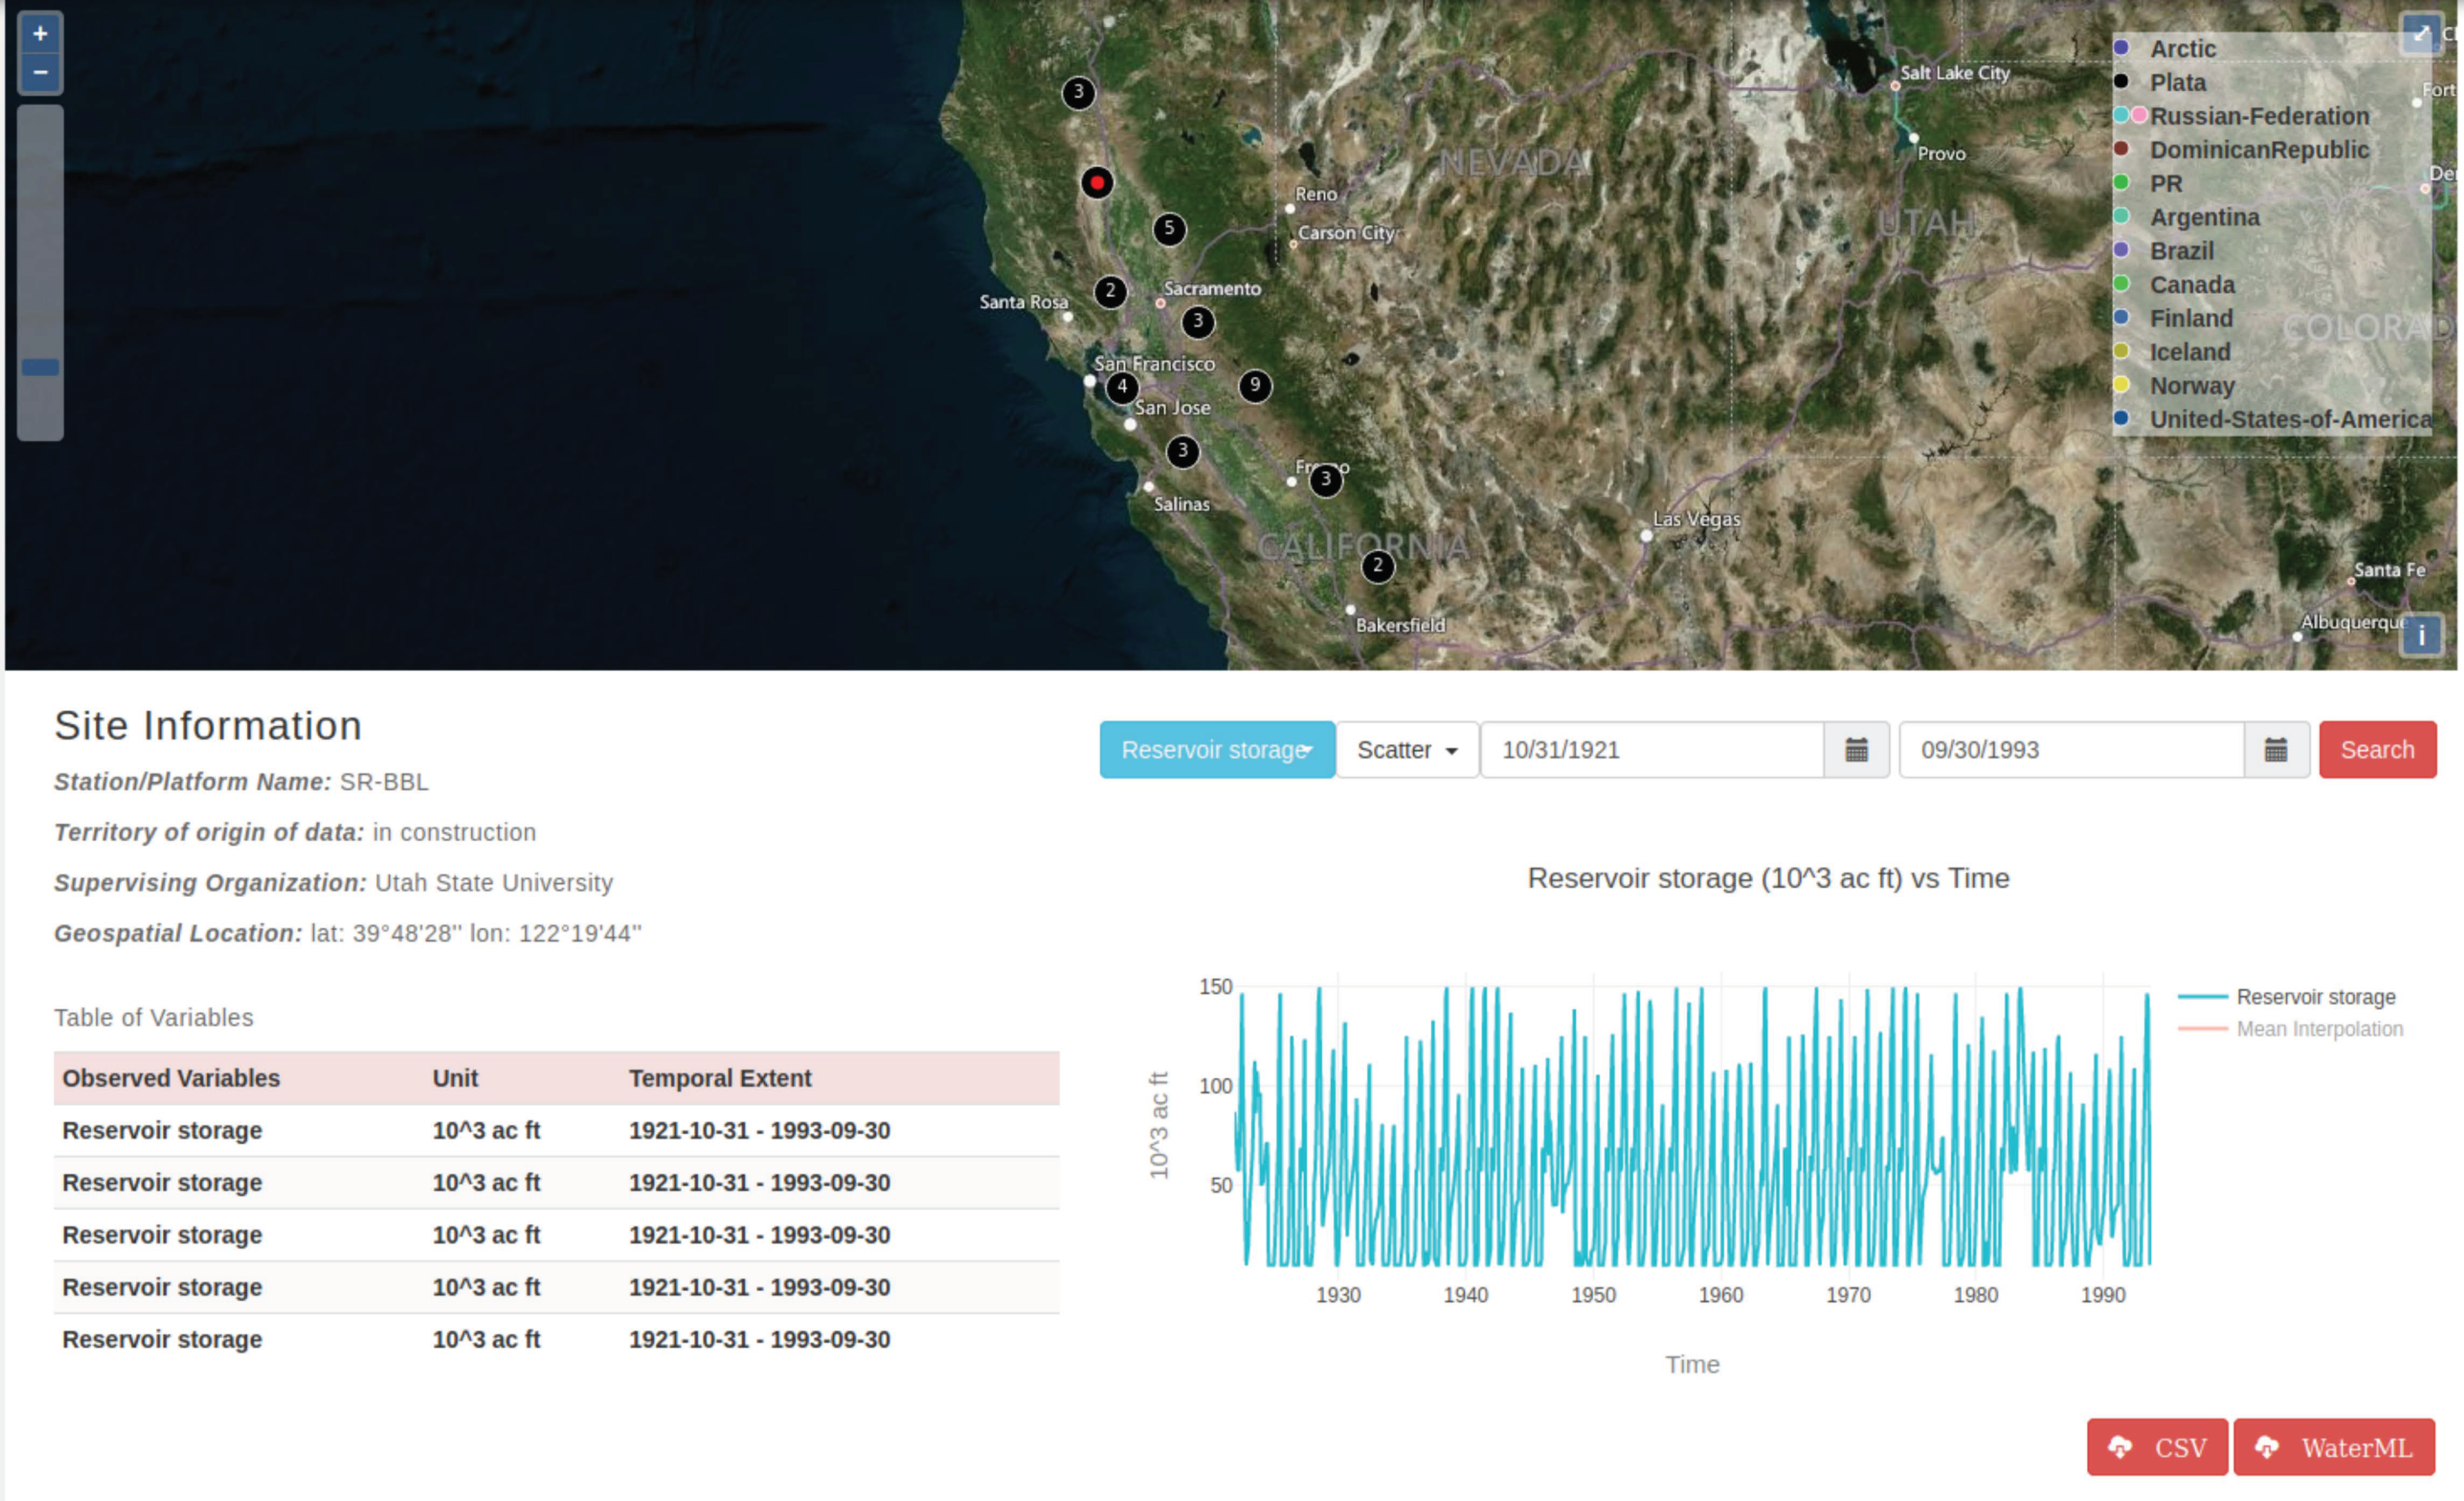
3.4. Visualizing Data
We demonstrated data visualization for both case studies. Data visualization uses two different displays: one in the Site Information panel for time series visualization, and the other in the map for geospatial visualization. To generate a time series plot, we select sites and a variable of interest.
Figure 10 depicts time series visualization for the air temperature variable in the WHOS Catalogs case study for Plata WaterOneFlow web service.
Figure 11 shows a time series visualization for the reservoir storage variable in the HIS Central case study for the CALVIN_HHS WaterOneFlow web service.
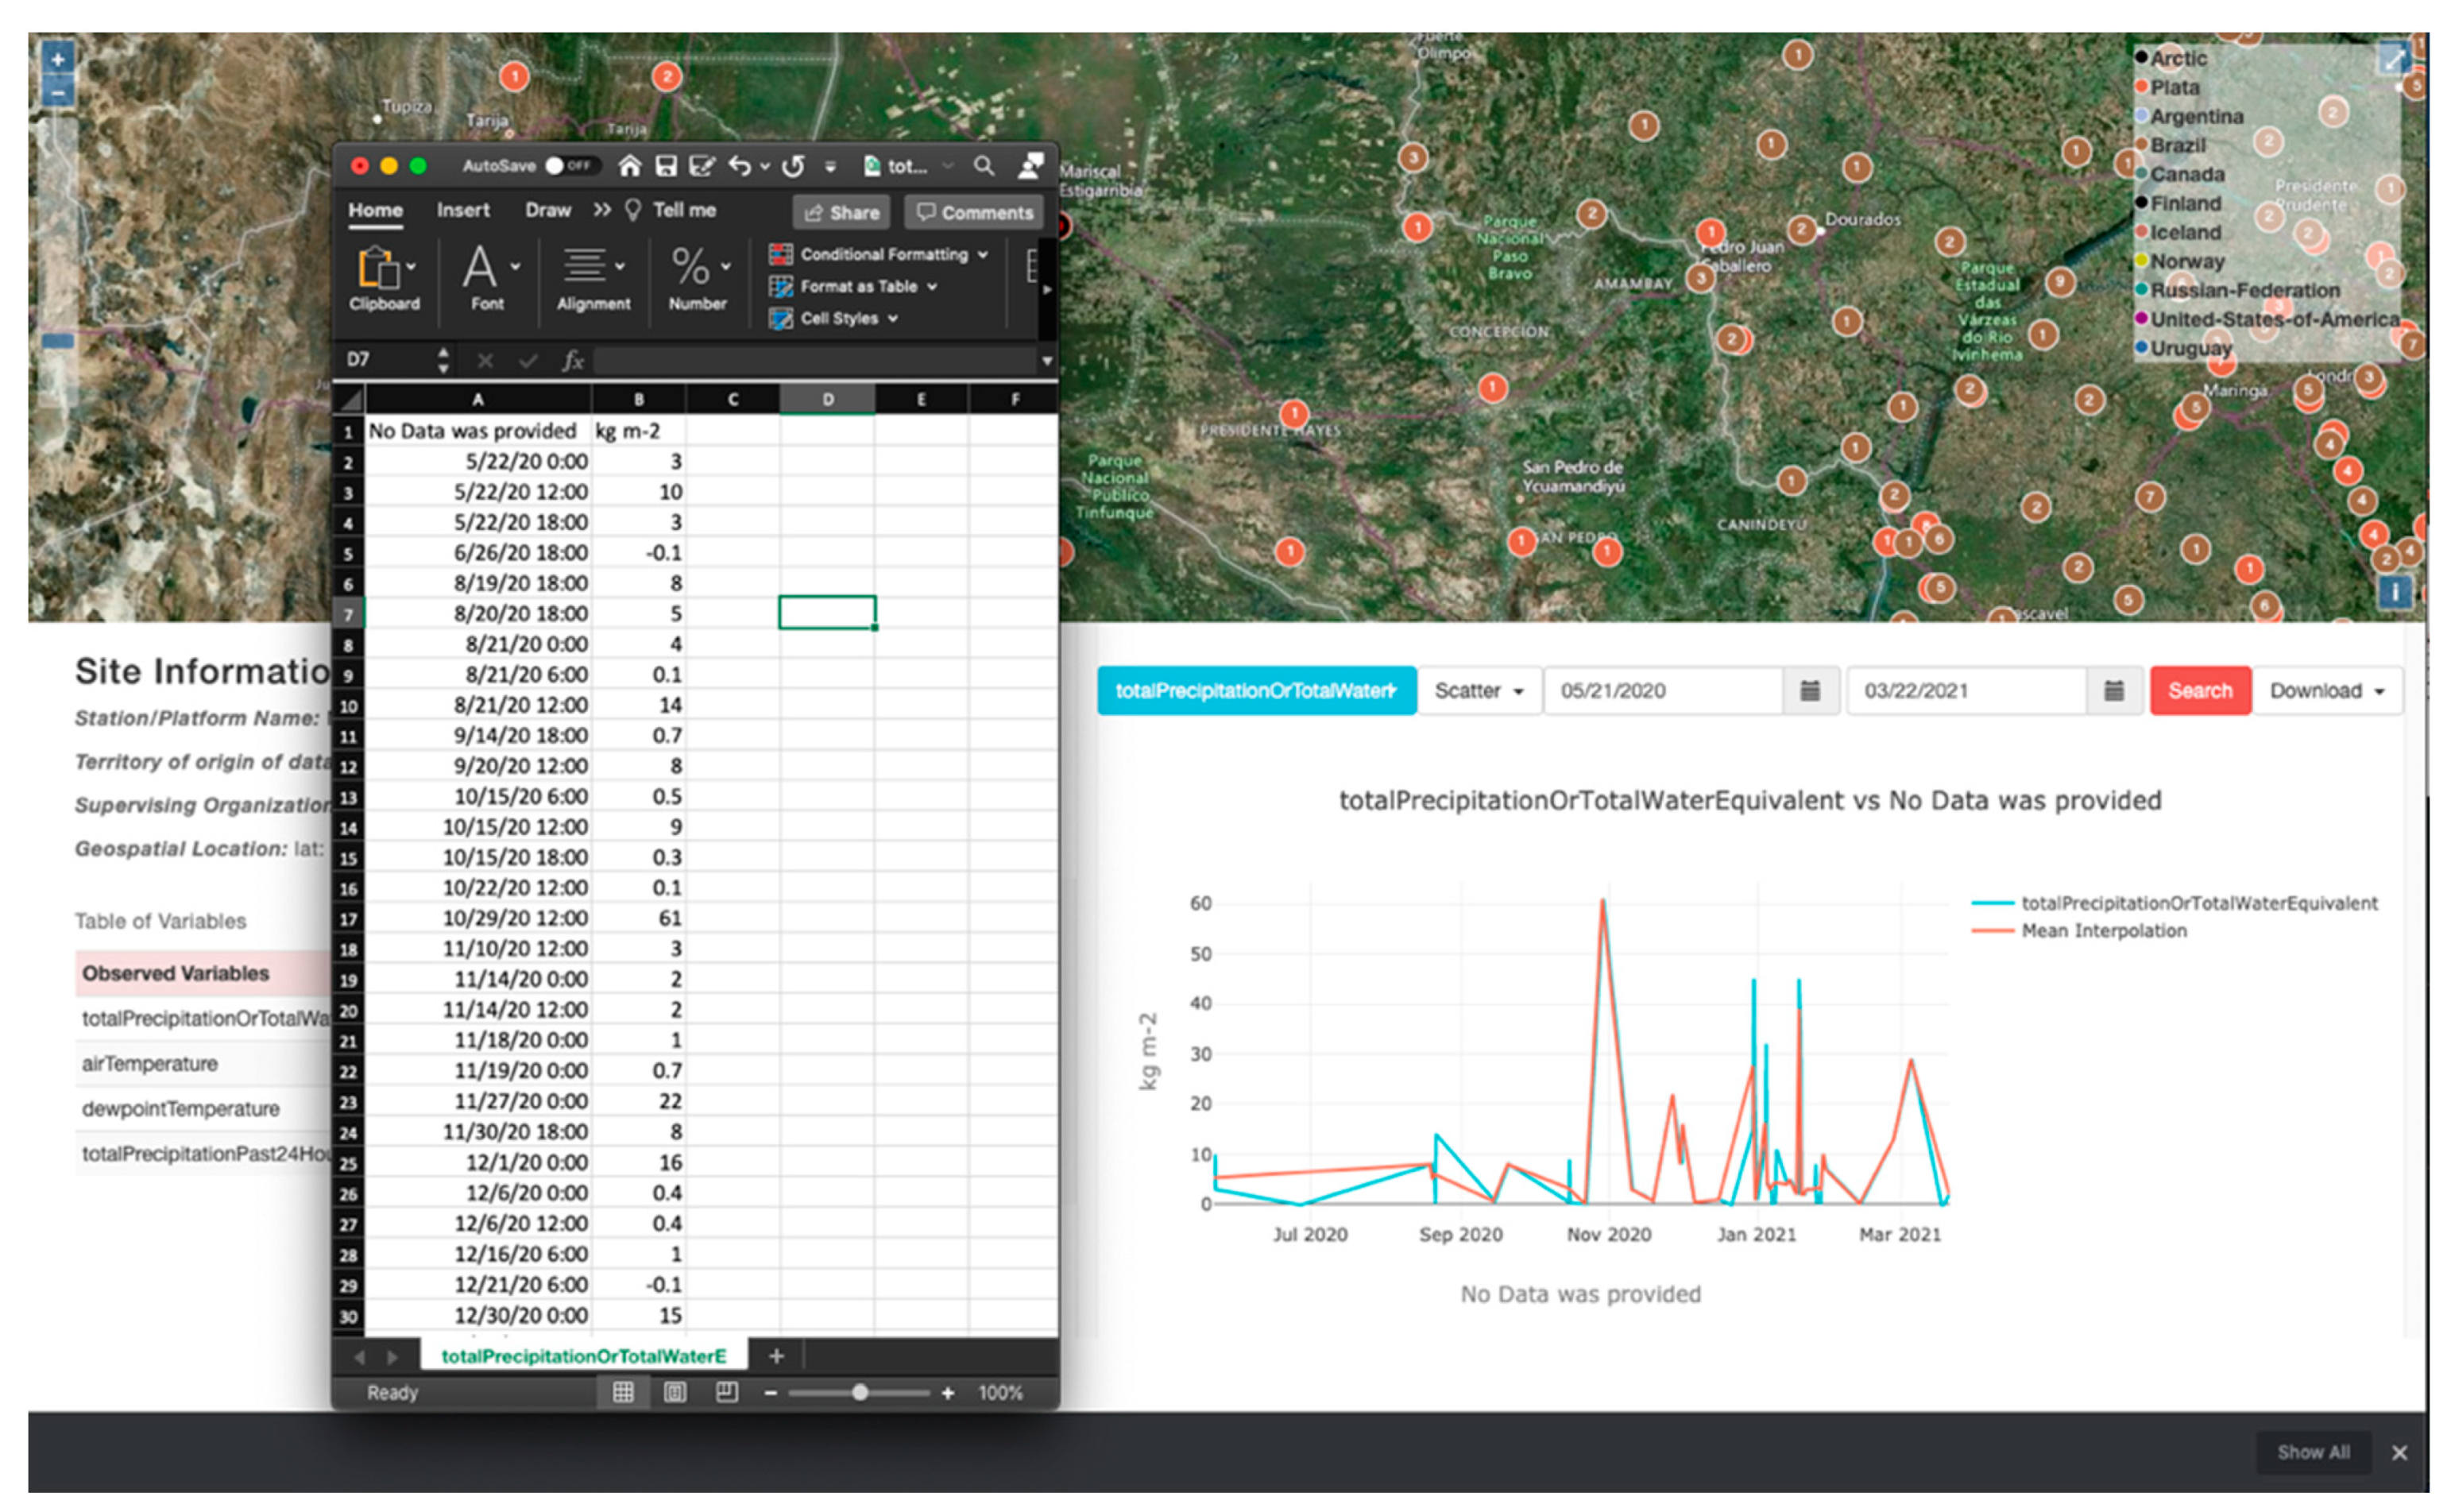
3.5. Data Donwloading
We demonstrate WDE data downloading in both case studies for two different instances, the first demonstrating data downloading to the local data base, and the second demonstrating the visualization of retrieved data that are not copied into the local database but are used internally in WDE. For these data we also demonstrate saving them to a local file.
In the first instance, we demonstrated the first data downloaded using the discovered data from the HIS Central case study, and from the country and transboundary dataset of customized views for the WHOS Catalogs case study. We downloaded metadata for the WaterOneFlow services to the WDE PostgreSQL database.
In the second instance, we demonstrated time series data visualization.
Figure 12 shows the download of a CSV file associated with the Plata server from the WHOS Catalog case study. A plot of the data can be seen in the WDE screenshot. For this demonstration, we downloaded the total precipitation data for the Mariscal Estigarribia site. We saved the data in a CSV format; the WaterML format is also available but was not used here.
4. Discussion and Conclusions
In the WHOS Catalogs case study, WDE used the transboundary and country region catalogs and discovered two and nine WaterOneFlow services, respectively. In the HIS Central case study, WDE discovered six different WaterOneFlow web services. In discovering the different WaterOneFlow web services, we encountered that the data retrieved using the WaterOneFlow methods provided data with different WaterML structured responses in both systems. As a result, the Pywaterml was designed to use a common WaterML response structure as the baseline for the WDE data discovery in both case studies. Depending on the SOA system WaterOneFlow web services responses, Pywaterml might need further customization to suit different WaterML response structures.
Another important challenge of working with the WaterOneFlow web services responses was the time of the data retrieval, which limited the different data discoveries at each WDE level. For example, data discovery for given variables at the server and catalog levels is not possible without making an API request to each site in the WaterOneFlow web service. For this reason, data discovery for given variables was not included as a data discovery method due to the amount of time taken for execution.
As a web application developed in the Tethys Platform framework, WDE provides users the ability to customize the application for different regions and for different WaterOneFlow web services. This can provide important “branding” and lead to greater acceptance of the WDE and associated regional water data services.
In the process of developing WDE, we found that there was not a single Python library that connects to WaterOneFlow web services and executes the multiple methods they expose through their API. We developed the Pywaterml library to act as the core of WDE, and also as a stand-alone Python package that can connect to the different WaterOneFlow web services and execute their different methods to discover and download data. Since Pywaterml is a standalone library, it can be included in other applications with general or specific needs for accessing observational time series data from WaterOneFlow servers. The Pywaterml library provides modularity of the data discovery and data downloading functionalities as a client component.
Together, WDE and Pywaterml provide a complete open-source SOA client interface tool that can be customized for specific regions and datasets accessible from multiple WaterOneFlow web services. WDE provides end users with the ability to create a regional tool to provide data discovery, download, and analysis. Pywaterml provides extensibility to other applications to replicate and enhance WDE functionality.


 ,
, 

