4. Review of IoT-WQMS for Domestic Water
This section provides a review of contemporary work on IoT-WQMS for domestic water. The research methodology was as follows: First, authors downloaded a set of 140 articles using the Google chrome search engine, individual journals’ websites, IEEE Xplore, and other sources. In this concern, different phrases and keywords were used for searching purpose, e.g., IoT-based water monitoring, IoT-based water quality monitoring systems, water quality review, water leakage survey, water leakage review, water quality survey, smart water monitoring systems, Internet-of-Things based water quality monitoring systems, Internet-of-Things based domestic water quality monitoring, etc.
Next, the authors manually inspected these articles on a one-by-one basis. It was observed that 9 articles were developed on general reports, 11 on pipes leakage detection, 10 on water-management (e.g., auto-reading of meters, bills generation, and water-grid monitoring), 5 on flood-level monitoring, 18 on water level monitoring in tanks, 15 on the agriculture and aquaculture, 14 on the auto-controlling water pump, 17 on water control in smart cities, 10 review/survey articles on water quality and leakage detection, and the rest were focused on quality monitoring of domestic water.
As detailed in Introduction section, authors have had acquired a set of 10 survey/review papers on the water monitoring, but almost all of these were not focused on smart monitoring of domestic water quality. Moreover, the papers being published on domestic water quality control were further filtered to pinpoint only those articles that were cited by contemporary works continuously. In this regard, some lower ranked conference and journal papers were excluded from this survey. Finally, authors decided to consider only 20 articles (3 conference papers and 17 journal articles) in this study.
As highlighted in
Section 2.2.2, WHO/USEPA suggested three types of water quality indices, i.e., DWQI, AWQI, and HWQI. In general, these indices contain many parameters related to water quality. In traditional laboratory-based methods, generally many such parameters are used while monitoring water quality. However, it may not be feasible for IoT-WQMS, because currently so many WQM sensors are not available. As highlighted in
Table 2, many WQM parameters have high correlation among themselves. Therefore, to benefit from this fact, most researchers [
32,
35,
48,
68] agreed upon on using most prominent WQM parameters in IoT-WQMS for domestic water. These parameters are as follows:
Some relevant WQM parameters could also be inferred based on measured values of these five parameters using ML schemes. For example, ORP has strong correlation with the sanitizing power of free chlorine or any other reducing/oxidizing chemicals [
85]. Measuring ORP is empirical, precise, and does not need any user interpretation. In addition, concentration of free chlorine can be inferred based on measured values of pH, T, and ORP [
48]. Similarly, the amount of dissolved oxygen in water can be inferred from its correlation property with T [
86]. Likewise, total suspended solids (TSS) and total dissolved solids in water could be inferred form measured value of turbidity [
35]. Similarly, EC could be utilized to infer estimate of alkalinity, hardness, and some solids dissolved in water. Based on WQM parameters and analytical tools (e.g., ML techniques), authors propose the following empirical rubric:
where
represents the overall rating of a contemporary IoT-WQMS. The symbols
,
,
,
,
, and
represent pH, Turb, ORP, T, EC, and ML tools, respectively. These are binary variables, i.e., a variable value is set to one if corresponding parameter is involved in IoT-WQMS or else zero. Since current literature reveals no Thump-rule to ratify contemporary IoT-WQMS with, therefore the authors assigned weights to variables used in Equation (1) empirically, which is entirely based on their importance. It seems expedient because all WQM parameters do not contribute equally when computing water quality. For example, turbidity (or TSS/TDS) and pH could be felt while looking at water appearance through a glass and/or drinking. We also assigned a higher weight to ORP, because it could not be felt when humans drink water containing pathogenic microorganism. Compared with T and EC, we assigned higher weight to because ML techniques are capable to infer other important parameters (e.g., DO, coliform bacteria, and salinity) based on measured values of few WQM parameters. No doubt, further improvement/modification in this rubric is possible, which we are planning to probe into in future work. The following text presents a comprehensive survey of contemporary work being published on IoT-WQMS for domestic water.
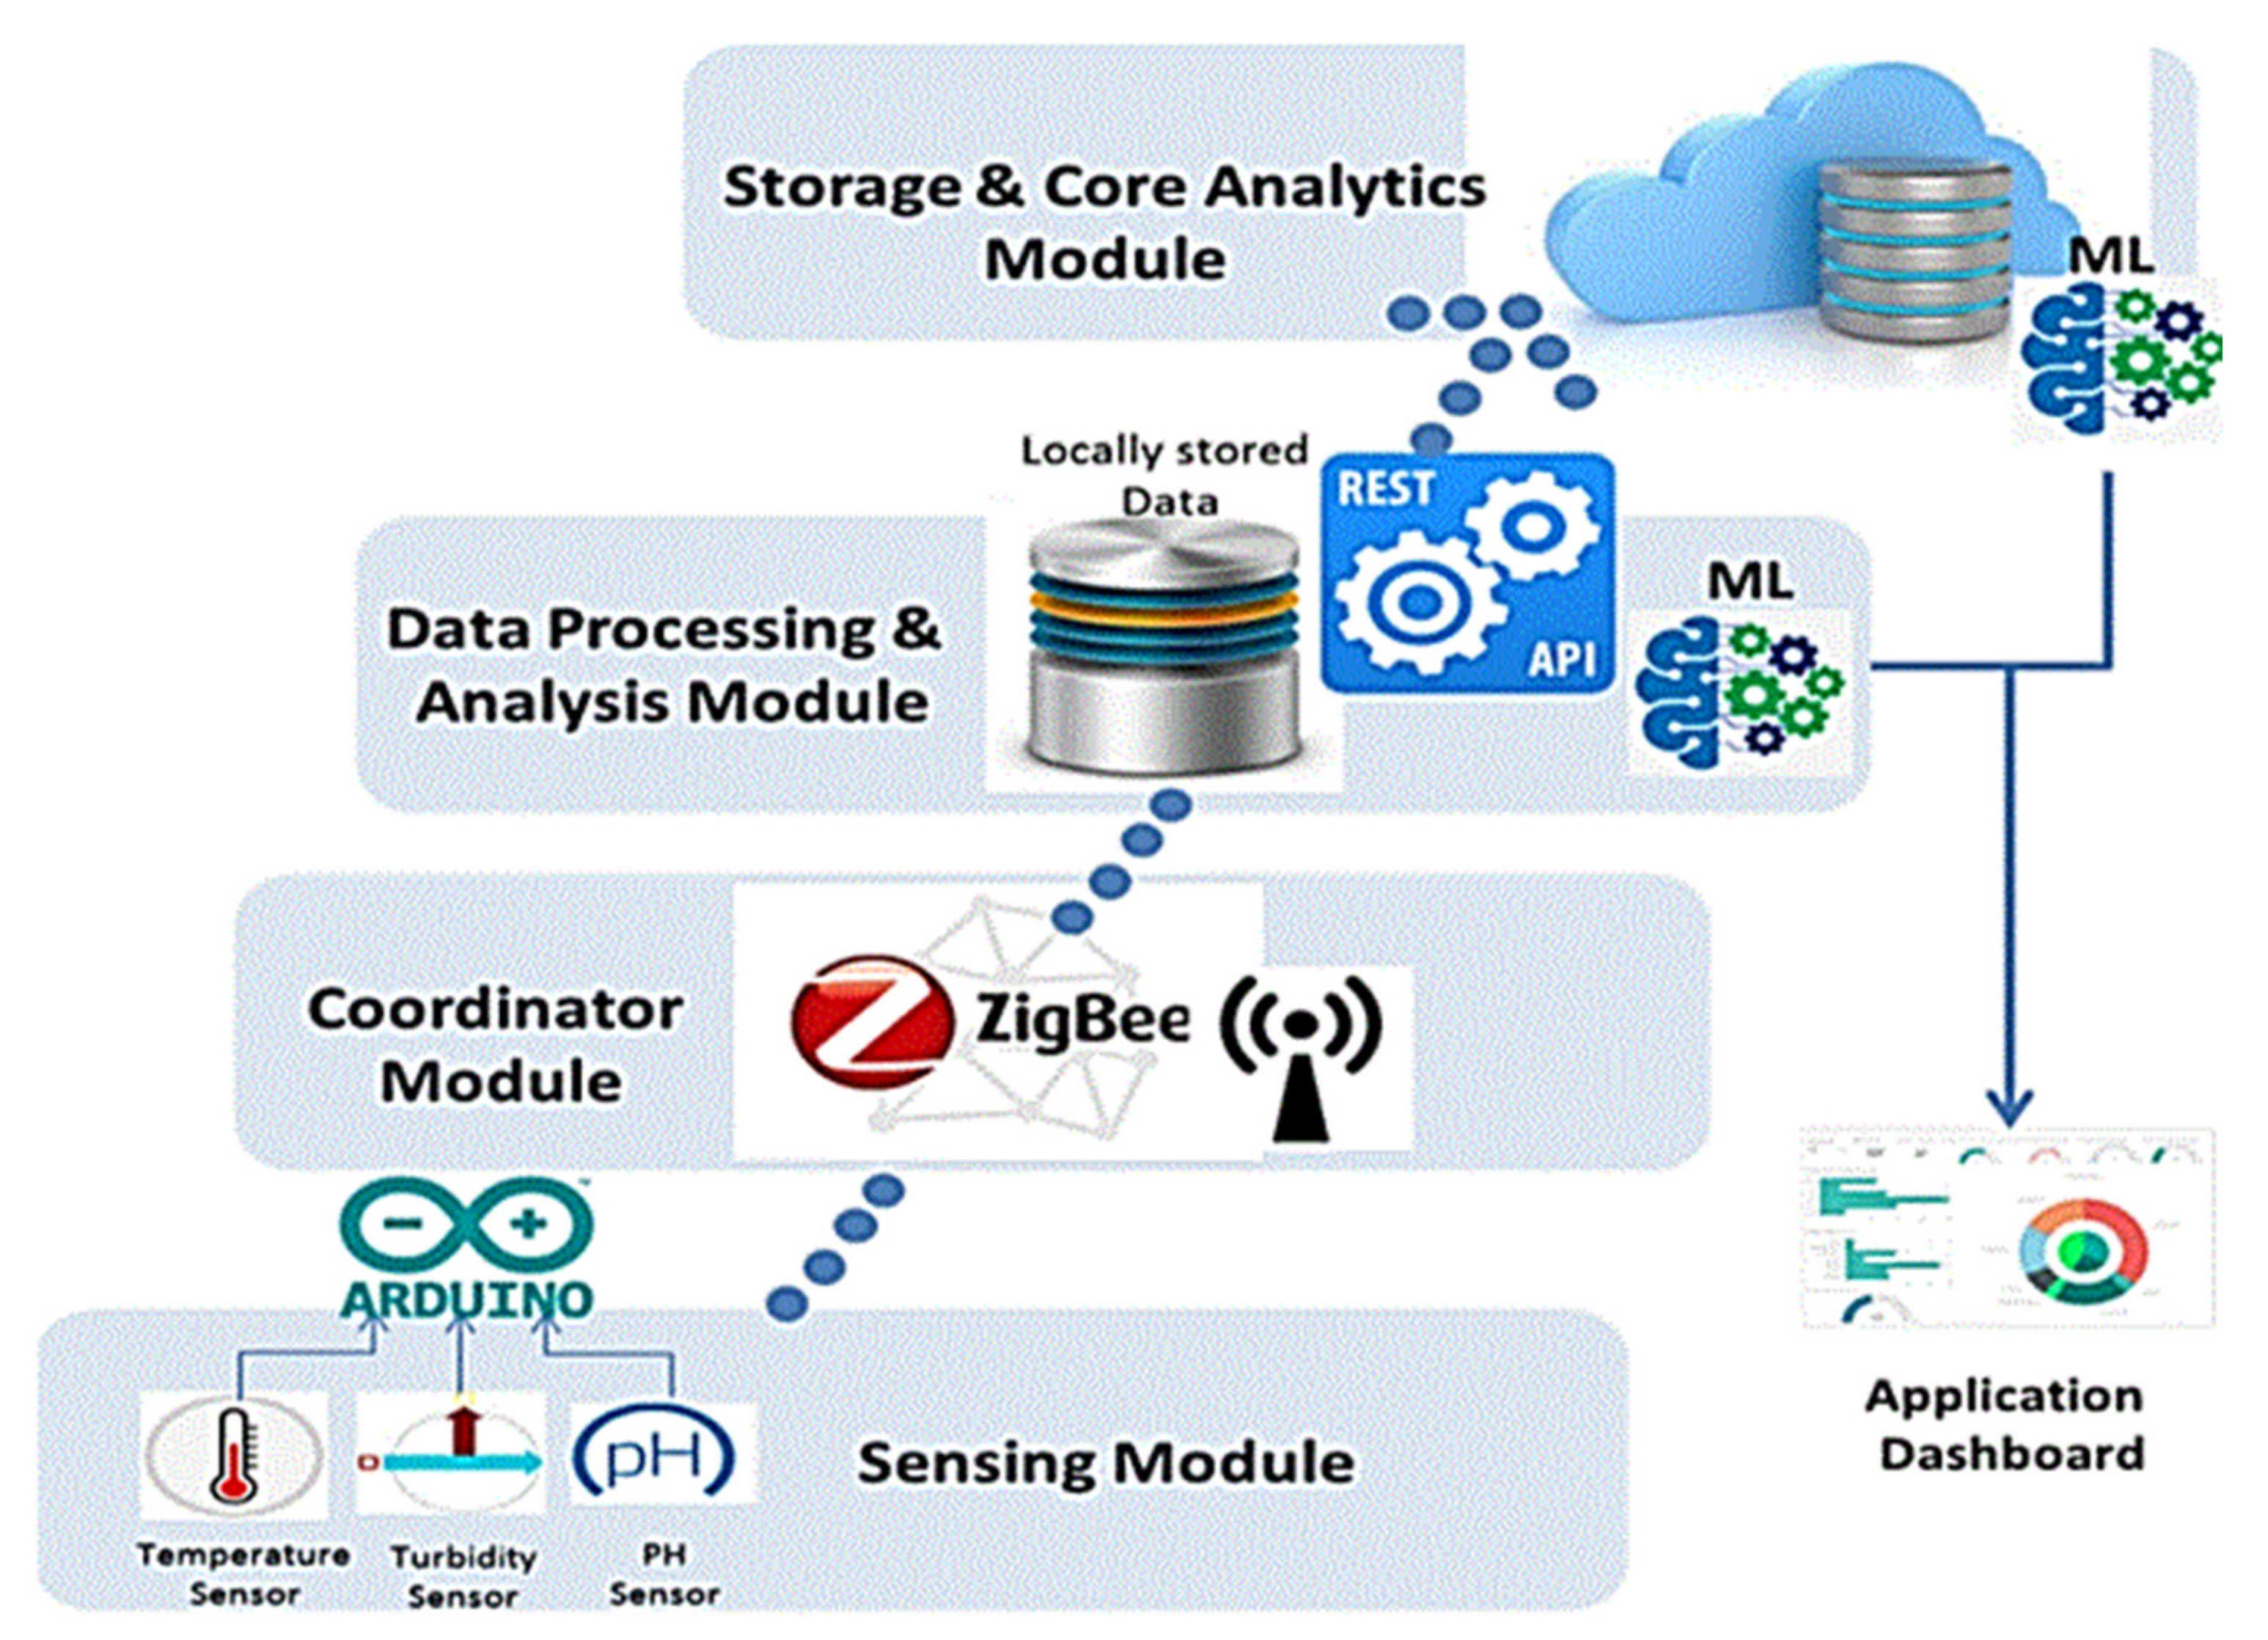
Ahmed et al. [
19] published their work on water monitoring. In the first part, the authors present a comprehensive review on traditional laboratory and WSN-based water quality monitoring schemes. However, its second part proposed an IoT-WQMS for domestic water. This system comprises four basic modules: (i) sensing, (ii) coordinator, (iii) data processing and analysis, and (iv) storage and core analytics. The authors claimed for the usage of four sensors (
Figure 3), but the sensing module shows only pH, turbidity, and temperature, and the sensor for TSS is thus missing from diagram. In the coordinator module, an Arduino kit collects data from sensors and transfers it to an on-site PC via a ZigBee device. For both modules, authors did not provide any hardware specifications (e.g., model). The third module takes in data from coordinator module and stores it locally into MySql-database.
Due to large data availability, data filtering and analysis were done to extract useful information and explore hidden trends. Finally, the fourth module preprocesses received data and transfers useful data to a cloud server vis REST web-services. This module applies various ML schemes (e.g., ANN and K-means clustering) to analyze data and determine a suitable application of water, e.g., drinking. They also claimed for an Application dashboard being developed in cloud. End users can view water quality via a desktop PC and/or smart phone. To summarize, its first part is much informative and has contribution, but the second one is just compiled at abstract level. For example, the proposed system has not been validated experimentally. In addition, they did not provide any technical details about sensors (e.g., model, range, and vendor). Due to these deficiencies, the second part may not be helpful to relevant community.
Table 5 shows a summary of this approach.
Figure 3.
IoT-WQMS proposed in [
19].
Figure 3.
IoT-WQMS proposed in [
19].
Geetha and Gouthami [
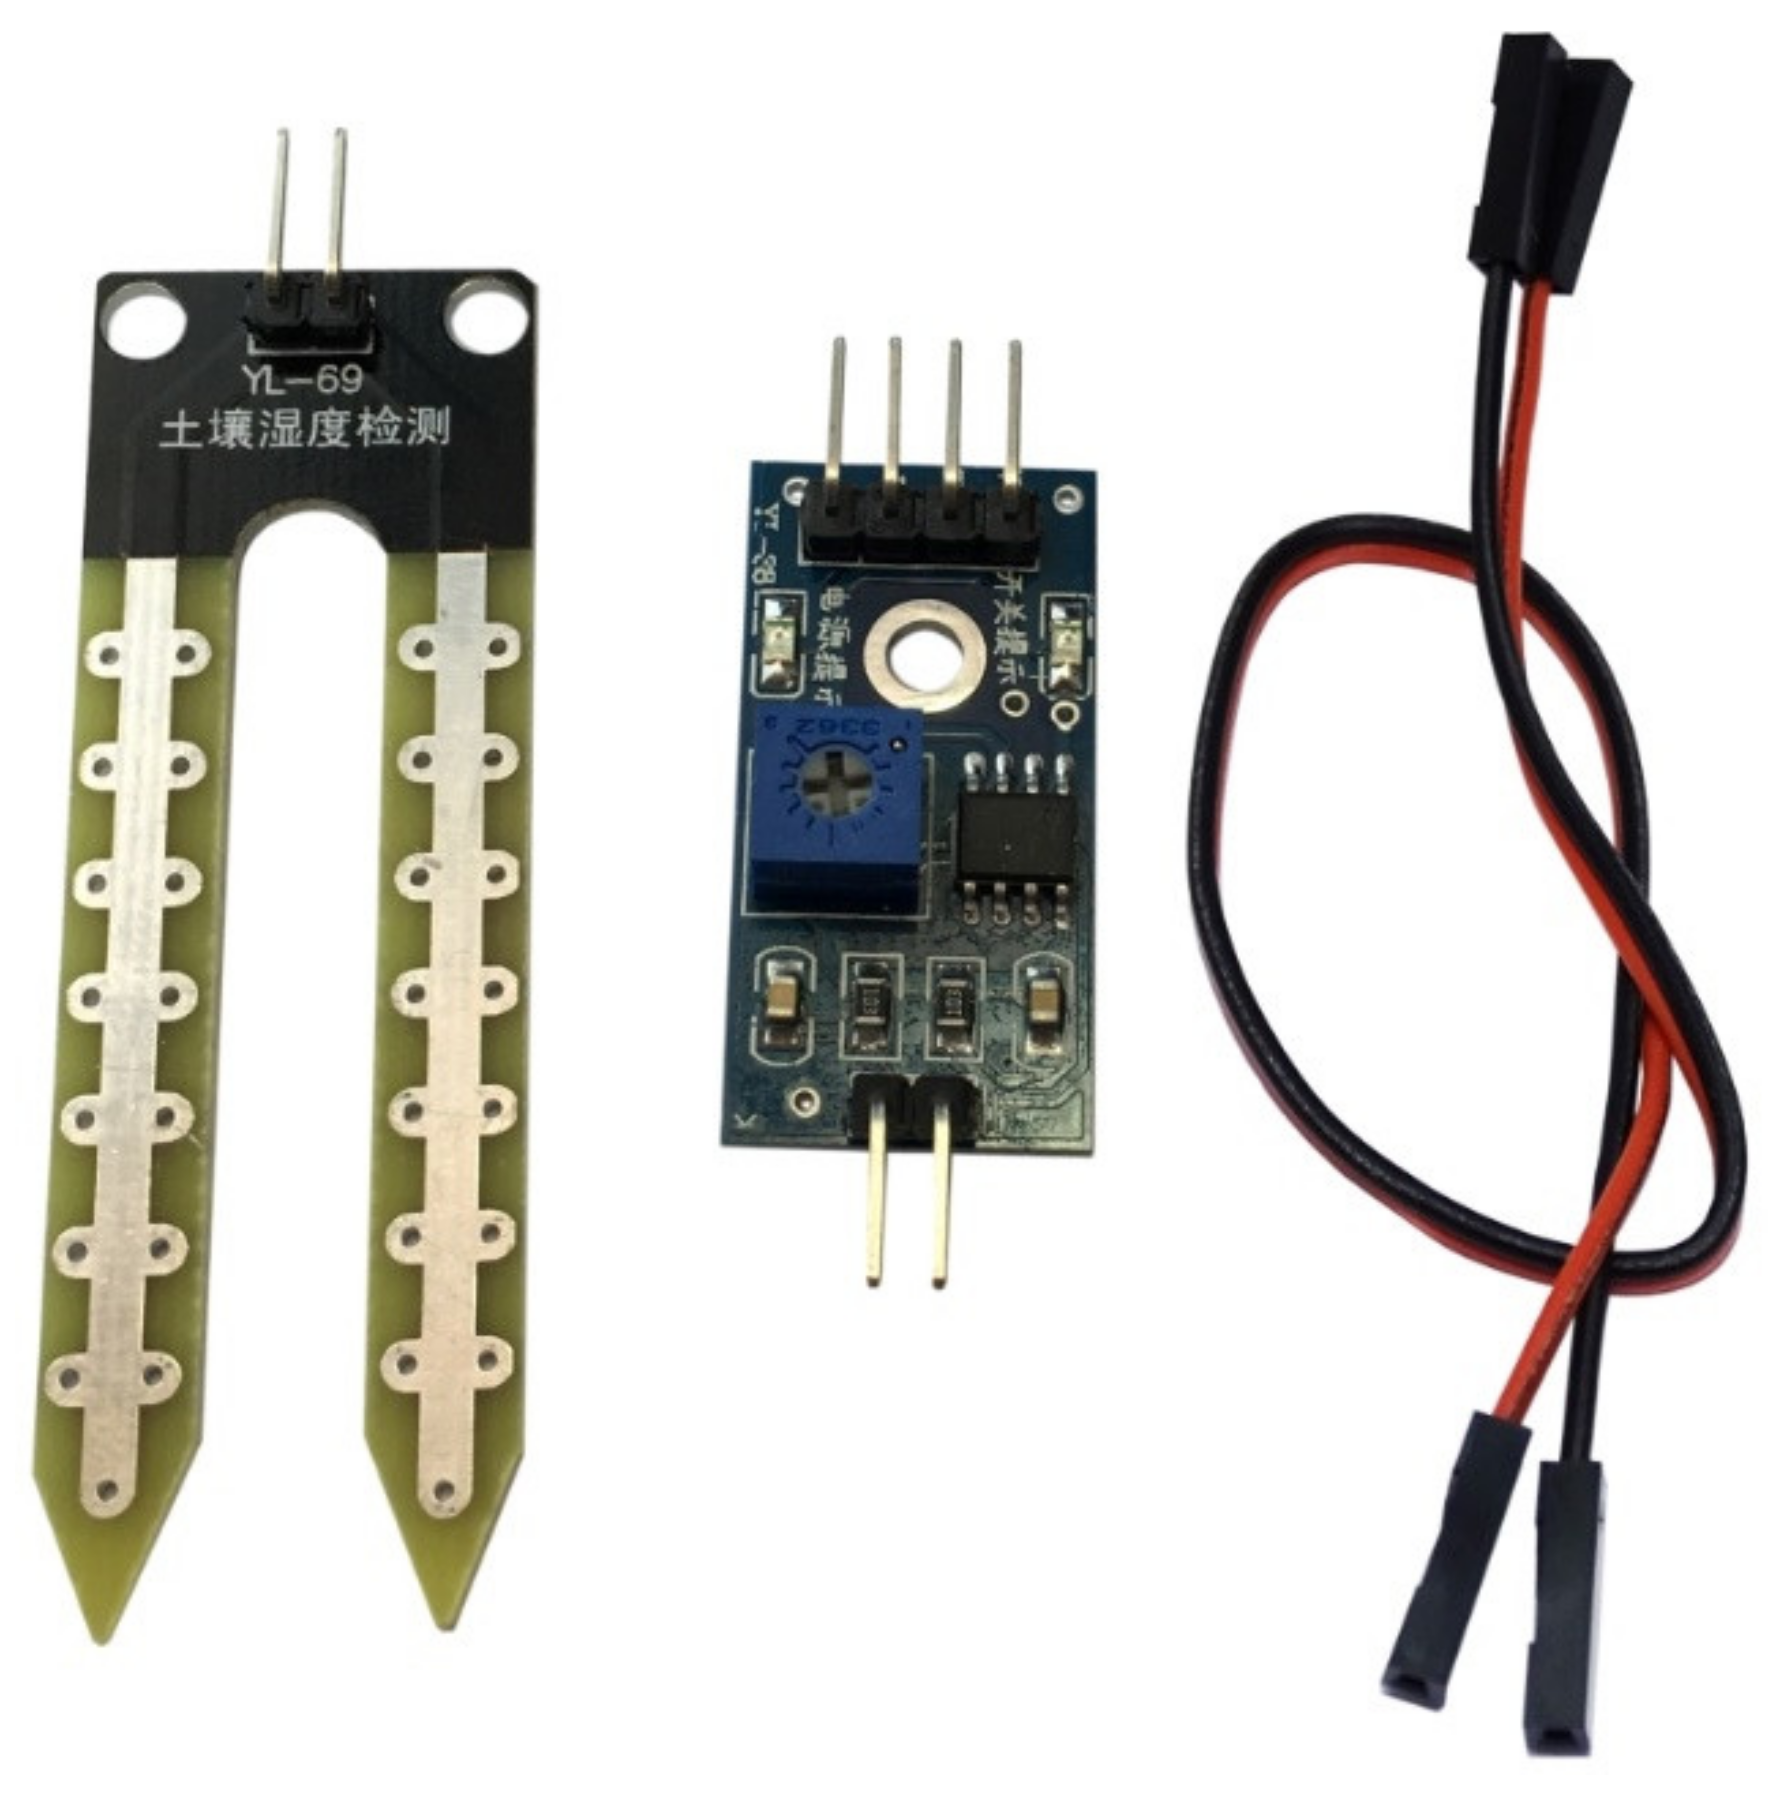
32] published their work on real-time smart water quality monitoring. In the first part, they offered a review of IoT-based water monitoring schemes. In the second part, they proposed an IoT-WQMS to monitor quality of in-pipe domestic water. This system is focused on monitoring pH, temperature, turbidity, and electrical conductivity. In addition, they also monitored water level in a water tank. For pH, they used a three-in-one pH meter (no technical detailed provided). For conductivity, the sensor used was YL-69. The models for other sensors are not specified. Notably, authors did not use any ML techniques to improve predictability of water quality. Decisions are purely based on preset threshold values of these parameter in accordance with WHO standards.
In brief, this system functions as follows: First, the TI CC3200 Wi-Fi Launchpad reads sensors via its 12-bit ADC module. This card is based on a 32-bit powerful MCU (i.e., ARM Cortex M4 core) with a built-in Wi-Fi module. It is a suitable choice for analog signal conditioning, processing, logging, and transferring data to cloud. Its programming is done in the ENERGIA IDE. Next, it processes data and updates a local LCD. Then, it sends data to a local Wi-Fi router through its built-in Wi-Fi module. Finally, a local Wi-Fi router transfers data to Ubidots IoT-platform [
87], where the authors had developed a dashboard. Ubidots is an excellent service, but it offers limited resources for free of cost and developers need to pay fee for commercial activities [
82]. In Ubidots server, sensors data is compared with preset threshold values. If any WQM parameter has deviated from its nominal range, then an SMS is sent to the phone of the end-user.
This system is validated on water samples polluted manually with salt and soil. Experimental results are discussed. Though using few WQM parameters without machine learning techniques are not enough to properly predict water quality, it is still a better option, because it may avoid drinking of water containing high level of dirt, acidity, alkalinity, salinity, etc. A main drawback of this system lies in its conductivity sensor, i.e., YL-69 (
Figure 4). The bared metallic strips of this sensor have direct connection with water while measuring conductivity. It is fine for a short time, but these metals may get corroded if they remain submerged for longer. A similar issue also exists in Ref. [
88].
Damor and Sharma [
24] published an article on IoT-based water monitoring system. Its first part offers a review, but the second part proposes an IoT-WQMS. Only pH and turbidity were considered. In addition, the authors also used an Ultrasonic senor (HCSR04) to monitor water level in an overhead tank and control the water pump automatically. Using two WQM parameters does not fulfill the minimum requirement of WHO/USEPA standards of drinking water [
19,
21]. No machine learning techniques were utilized to infer other WQM parameters and make the overall decision relatively better.
Authors have used the Arduino Uno kit as a front-end interface. This card is centered around ATmega328 (8-bit MCU), which is relatively rich in peripherals (e.g., ADC, memory, digital I/O, I2C, and SPI) generally required for analog signal conditioning, processing, and logging. First, this gadget reads sensors via its 10-bit ADC module. Data is processed locally to extract useful information. Next, it serially shifts data to a NodeMCU. This card is based on ESP8266 SoC, which is produced by the Espressif Systems. ESP8266 is a low-cost Wi-Fi microchip, which has full TCP/IP stack and a powerful 32-bit MCU. Then, NodeMCU transfers data to the ThingSpeak IoT-Platform via a local Wi-Fi router. ThingSpeak service is cost free for limited resources only and developers have to pay if commercial activities are required [
82]. In ThingSpeak, authors had developed a dashboard for the visual presentation of sensors data and water level in target tank. End users can check water quality and its level in respective tanks via the ThingSpeak app.
To summarize, the authors presented this article quite poorly. They provide no technical specifications about sensors (e.g., model). Experimental results were not discussed. A main drawback of this system is the usage of Arduino Uno and NodeMCU together. Since NodeMCU is based on ESP8266 SoC, which has all peripherals (e.g., ADC unit, digital I/O, timers/counters, memory, 32-bit CPU, and Wi-Fi module), therefore it alone is enough for analog signal conditioning, processing, logging, and transferring data to cloud server. Though NodeMCU has only one ADC module, but the designers could use a simple digital multiplexing chip to utilize this module for many analog inputs.
Simitha and Subodh [
86] published their work on IoT/WSN-based water quality monitoring system for smart cities. As shown in
Table 5, this system considered pH, turbidity, temperature, and dissolved oxygen. Instead of using a sensor to compute dissolved oxygen, authors utilized a table showing temperature correlation with dissolved oxygen. Authors utilized DS18B20 to measure water temperature. It is a waterproof temperature sensor with 12-bit built-in ADC module and one-wire digital communication interface. For pH, they used a complete module (Model: E201-C-9). This kit has a BNC connector, pH probe, and the requisite circuitry for signal conditioning of pH. The output of such sensors is generally sensitive to changes in temperature. The kit automatically rectifies this issue using output of DS18B20. Technical details (e.g., model) are not provided for the turbidity sensor. The circuit’s simulation was done in Proteus IDE. Final testing and simulation of system were performed in Arduino IDE.
Briefly, the system functions as follows: First, Arduino Uno kit reads data from sensors, conditions it if not already, processes data, updates a local LCD for end-users, and transfers data to a LoRa transmitter (i.e., SX1278 Ra-02 LoRa) via its serial peripheral interface (SPI). Next, the LoRa transmitter transfers data wirelessly to a LoRa receiver being interfaced with an ESP32 Wi-Fi kit. The LoRa module is based on LoRaWAN protocol, which is a low-power wide area network (LPWAN) wireless communication technology. Due to LoRa technology, distance between sensors and communication modules can be 3~8 km (for urban to rural area, respectively), which is much better than ZigBee, WiMAX, Wi-Fi, Bluetooth, etc. The same LoRa chip can be used as both transmitter and receiver. All received data parameters are updated in Serial-monitor console of Arduino IDE. Then, ESP32 kit access a local Wi-Fi router to transfer data to ThingSpeak IoT-platform for visual purposes. The ThingSpeak has communication with a Raspberry Pi card equipped with a local display. It seems the Raspberry Pi card and local display have been used for the control room, but the authors did not mention anything about this mystery. Users can check water quality via their smart phones. To summarize, overall presentation of article is fair. Its performance can be improved if ML techniques are also incorporated.
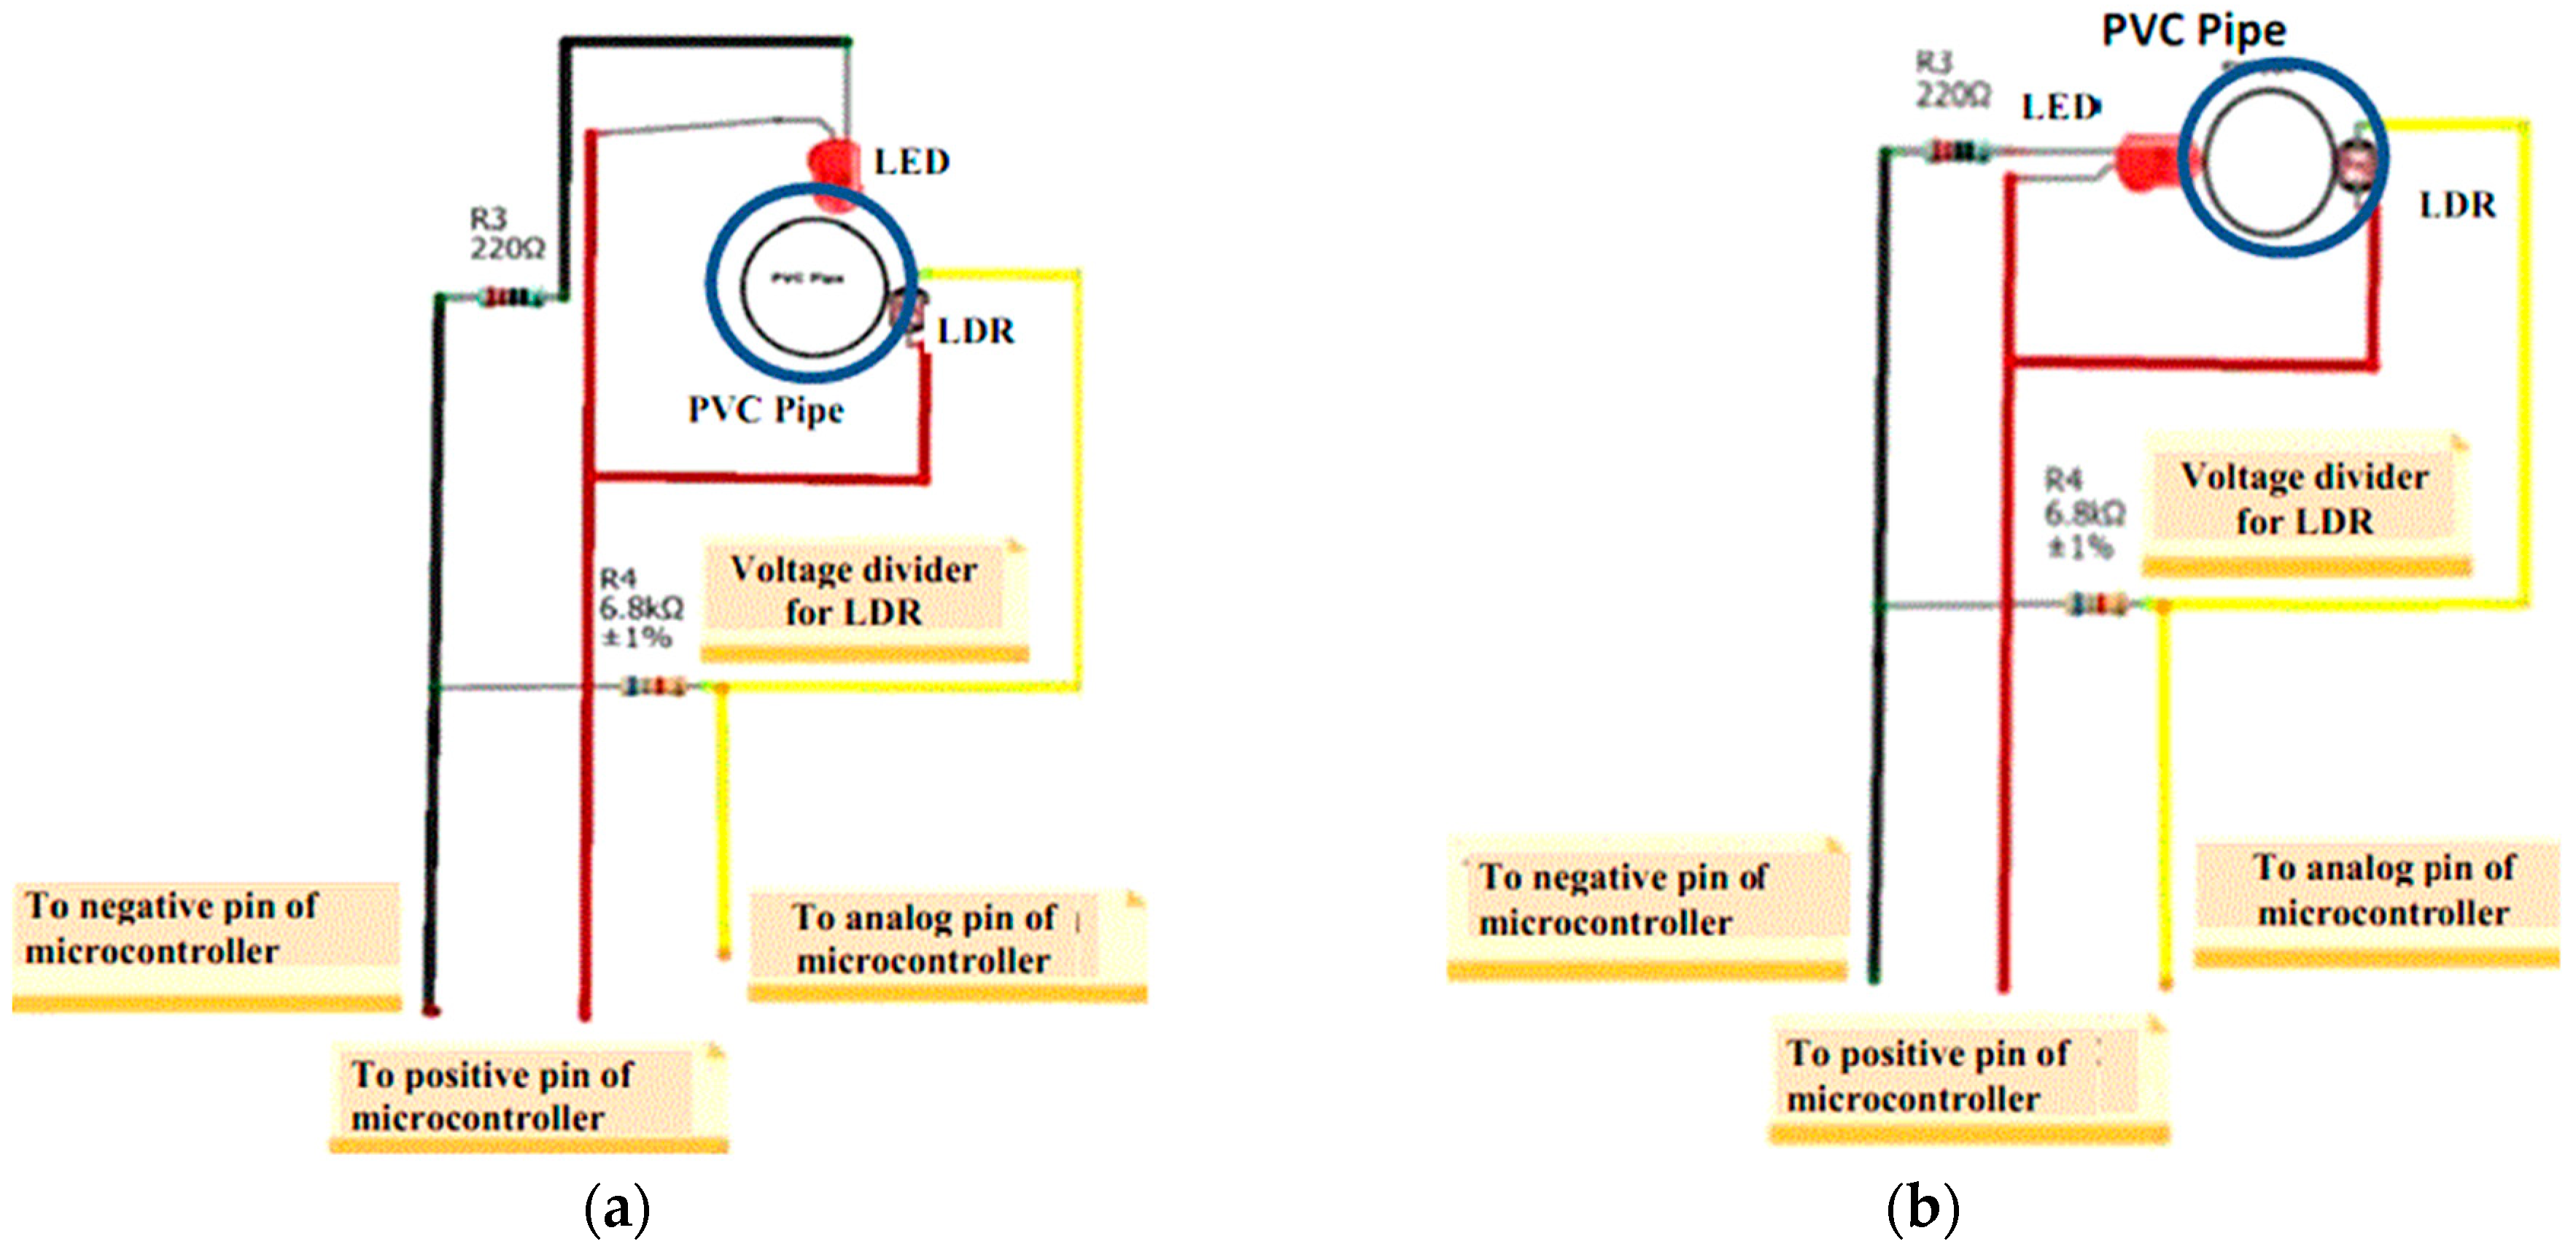
Ibrahim et al. [
89] published a low-cost IoT-based solution to measure turbidity of domestic water in tanks equipped with water filters. In this study, authors developed an indigenous light detection unit to measure turbidity. For experimentations, they used a combination of an LDR (i.e., light dependent resistor) and an LED (i.e., light emitting diode) fixed inside a PVC (polyvinyl chloride) pipe. They recorded turbidity readings for two unique positions: 180° and 90° between LDR and LED. The measured output signal (voltage) from designed circuit versus TSS in target water-sample was analyzed and graphed in two setups: (i) in total darkness and (ii) in presence of ambient light. In addition, the authors also performed comparative analysis for the designed sensing-unit submerged into still-water and water flowing in pipe.
The complete IoT-based turbidity monitoring systems works as follows: The sensor is read by Arduino Intel Galileo Gen 2 board, which is based on a 32-bit MCU. Next, it sends data to an ESP826 Wi-Fi transceiver module plugged in a mini-PCI slot of a Galileo board, which transfers data to ThingSpeak IoT-Platform via a local Wi-Fi router. ESP826 Wi-Fi transceiver has an integrated TCP/IP protocols, which is customized for Wi-Fi networking solutions with two general purpose digital I/O pins only. Data in the cloud is recorded and all visual displays are updated. If turbidity is found higher than a preset threshold value, then motor is turned ON to flow out water from the concerned tank to a connected filter unit for the rectification purpose. Water from filter unit then flows back into same tank and turbidity sensors are read again. If turbidity is still high, then motor is kept ON. Otherwise, motor is turned OFF automatically. This way, the water tank is cleaned automatically.
Programing and simulations of this system were performed in Arduino IDE. Results are detailed explicitly. On average, this is a good notion for automatic monitoring of turbidity in water tanks equipped with a filter unit. However, some limitations of this system include its poor protection against conducting leads of LDR/LED (
Figure 5) or wiring not protected from environmental effects, e.g., alkaline water can corrode metals when contacted directly. Due to this fact, efficiency of sensors may be degraded if submerged in water or exposed to moisture for longer. In addition, LDR/LED surface could also be polluted with contamination in water because light emission/acceptance capabilities of these components could be affected. Lastly, the turbidity sensor unit needs a stable power supply, otherwise any fluctuation in supply voltage may affect efficiency of this unit.
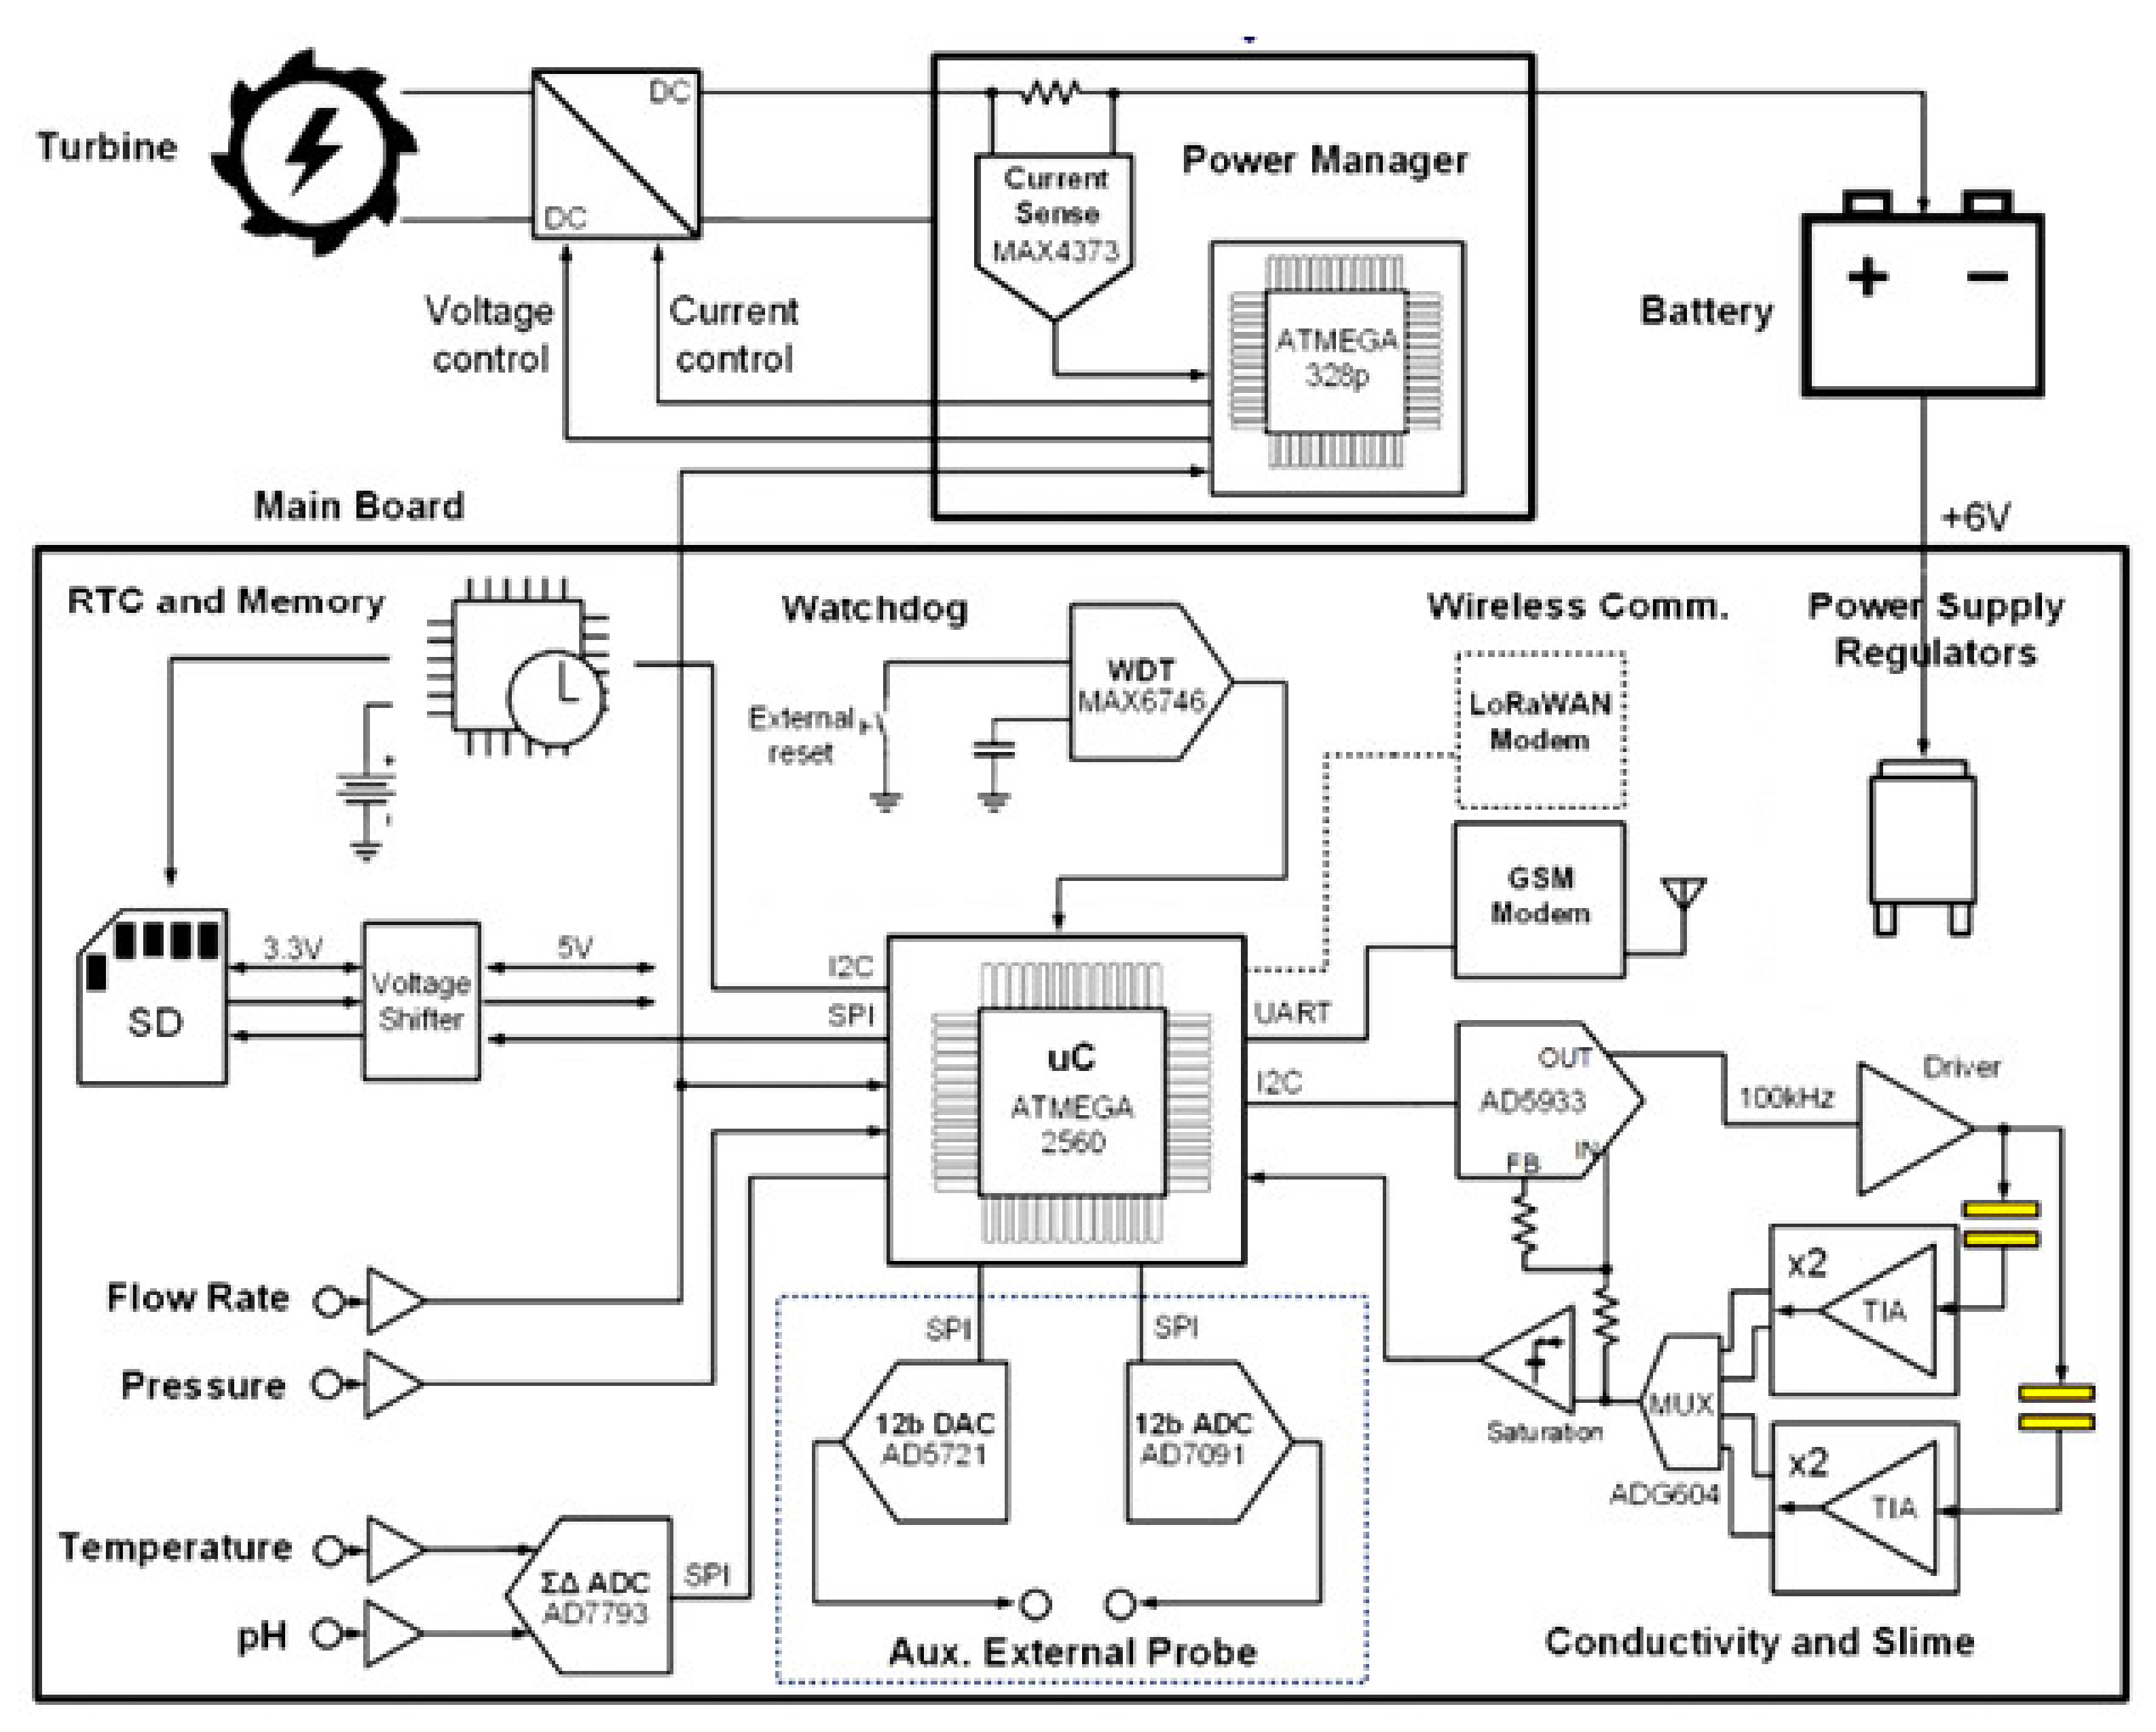
Carminati et al. [
90] published an IoT-based solution to monitor chemical and biological stability in water supply systems (
Figure 6). In addition to measuring pH, temperature, pressure (PR), electrical conductivity, and flow rate (FR) (
Table 5) the authors emphasized monitoring slime deposits on the inner surface of pipes. Slime (correlated with turbidity) can deteriorate water quality and result in the sensors biofouling. In this study, they developed a sensing unit made up of some conventional sensors and a custom designed sensor (based on impedance) to monitor the inner-surface fouling of pipes. In addition, it is also capable to estimate the slime thickness and find its corresponding origin.
All sensors are technically detailed, along with calibration methods. Notably, authors explained all circuits, electronic components, communication devices, power generation via a turbine unit, and computing devices in explicit details. Editing and simulation of this system were done in Arduino IDE. In short, the whole system architecture is as follows: To energize entire circuitry, energy is generated from water flowing in pipe using turbine technology; the main components of this part are sealed lead-acid battery (6 V, 1200 mAh), ATmega328 (8-bit MCU), a current sensing chip (MAX4373), LCD, and a buck-boost Direct-current/Direct-current (DC/DC) convertor.
Sensors are read by main board centered around ATmega2560 (8-bit MCU). For communication between different modules and/or units, they utilized LoRaWAN device (mDot by the Multitech) and GSM modem (M10 by the Quectel). Data through GSM modem is transferred to ThingSpeak IoT-Platform for analysis, detecting anomalies and generating alert messages to end-users if any fault is detected. Note, a GSM modem generally accepts a SIM card and functions like an ordinary cellphone for providing a data link to a remote network. For end-users, they use ThingSpeak app installed on a smart phone. The system was tested and validated in the laboratory and field. Though this system does not fulfil the minimum requirements of WHO standards of drinking water, it have other significant achievements. For example, it proposed an effective sensing unit to monitor slime deposits on inner surface of water supply pipes. In addition, it also highlighted a workable notion of utilizing a turbine to yield electrical energy.
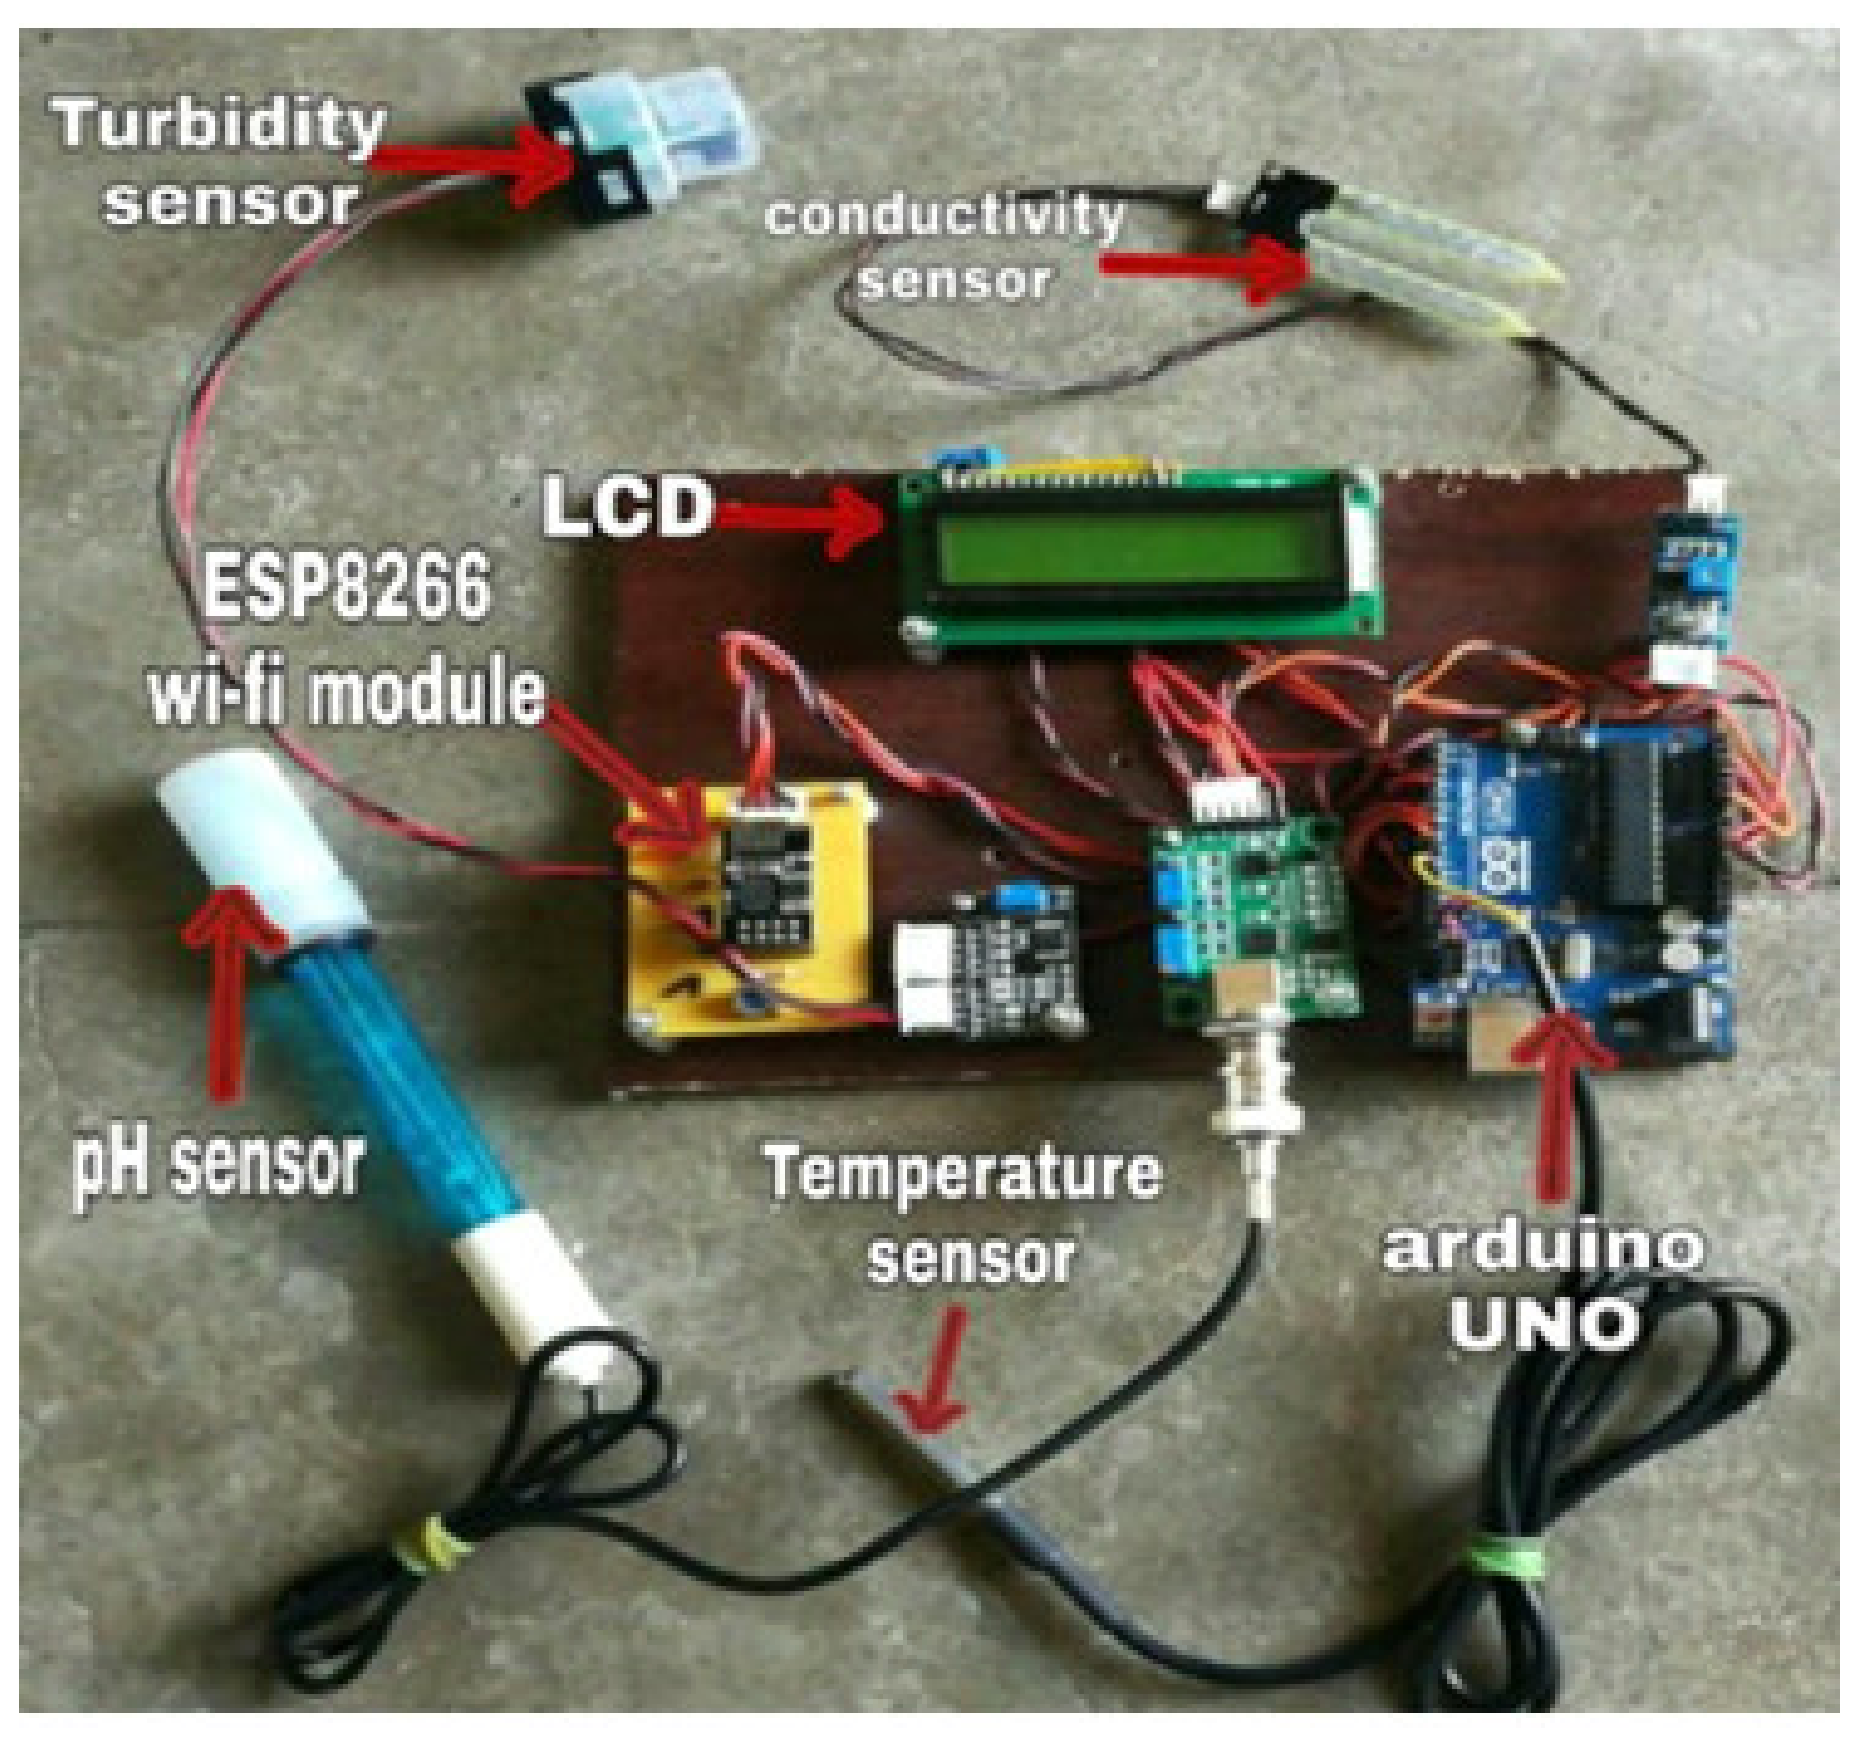
Manoharan et al. [
35] presented a water quality-analyzer system based on IoT technology. In this study, they tried to monitor pH, turbidity, temperature, and electrical conductivity. Sensors were not technically specified, except the temperature sensor (DS18B20). As shown in
Figure 7, except DS18B20, which is interfaced with Arduino Uno, all other sensors are accompanied by their own signal conditioning kits. Programming was done in C-language, probably in Arduino IDE. The overall system functions as follows: First, Arduino Uno reads data from sensors, processes it, and updates results on a local LCD for users. Next, it transfers data to ESP8266 Wi-Fi transceiver through its serial communication interface. After that, ESP8266 transfers data to ThingSpeak IoT-Platform through a local Wi-Fi hotspot. In a cloud server, data is stored and graphs are updated.
In case any anomaly is detected, it sends an alert to the relevant authority. This system has been validated on water samples collected from rivers, lakes, and ponds. This article is also presented at an abstract level and no in-depth details are provided about the experimental setup. In addition, no machine learning algorithms are deployed to enhance system efficiency. A major limitation of this system lies in its electrical conductivity sensor whose metal layers (
Figure 4) are not protected against corrosion due to contaminated water.
Figure 7.
Image of system proposed in [
35].
Figure 7.
Image of system proposed in [
35].
Chowdury et al. [
57] presented an IoT-based solution to monitor water quality. This study was intended to continuously monitor the quality of river water using a hybrid of WSN and IoT technology, with low-power consumption and minimum expenditures. They considered pH, turbidity, temperature, and oxidation reduction potential in experimentation. Except the temperature sensor (DS18B20), other sensors are not specified technically. In addition, authors did not specify IDE being used for coding, testing, and simulation. Big data analytics techniques were utilized to improve predictably of water quality and reveal future trends. Though this article is composed poorly, its main flow can be inferred from its diagrams, text and/or images.
The system is comprised of multiple nodes being installed at different locations alongside a river. For each node, Arduino Mega2560 reads sensors data, processes it, and updates a local LCD. Next, data is serially shifted to ESP8266 Wi-Fi module. This module transfers it to a remote PC through a local Wi-Fi router. In the remote PC, collected data is displayed in a visual format using the spark streaming-analysis through Spark MLlib, belief rule-based (BRB) system and deep learning neural-network models. In addition, data is also compared with recommended WHO standards. If any anomaly is detected, then an SMS alert is forwarded to the concerned authority. To summarize, this article has attempted to utilize artificial intelligence (AI) to enhance system decision about water quality. However, this article may not be of good use to readers due to its poor presentation.
Rao et al. [
91] presented an IoT-based solution to monitor water level and quality in overhead tanks. Its main aim was to automatically refill tanks in remote areas and continuously check water quality. If water is dirty, then corresponding authority should be informed via a smart phone to clean tanks; location information is accessed via Google Maps. For measuring water quality, authors considered only pH and turbidity. Water level in tank is monitored through HC-SR04. The turbidity and pH sensors models are not specified, but their technical specifications are tabulated properly.
In brief, this system works as follows: First, a Raspberry Pi kit reads data from sensors. As stated before, Raspberry Pi kits are powerful minicomputers enriched in peripherals (e.g., ADC/DAC, memory, I/O ports, Wi-Fi, and timers/counters). Next, it processes sensors data and transfers it to a local Wi-Fi router for uploading to ThingSpeak IoT-Platform. In the cloud, data is recorded, graphs are updated, and water level and quality are checked according to preset threshold values. If water level is found above or below a specific threshold, then an alert is sent to clients who can control motor switching status through their smart phone. In addition, if turbidity is found above a preset threshold, then it means the water in tank got dirty because of mud, dry leaves, etc. To clean the tank, the concerned authority is also sent tank’s location via Google Maps. This article is not well documented, e.g., missing of technical data, language, and IDE not specified. On average, this system can be used safely for tank cleaning purpose only, but for water quality two parameters are not considered enough according to WHO standards for drinking water.
Imran et al. [
92] presented an IoT-based solution to monitor water level and quality in overhead tanks, in particular for offices and homes. In this study, authors monitored pH of water only, which is not enough to predict overall water quality. In addition, they also tried to monitor water level in tank and leakage of Liquified Petroleum Gas (LPG), if any. Authors did not provide any technical specifications about the sensors, except the LPG sensor (Model: MQ-6). In addition, authors did not detail their experimental setup. This system functions as follows: First, an electronic kit centered on an 8-bit MCU (PIC16F877 developed by the Microchip Inc.) reads data from sensors. After processing data and updating a local LCD, it utilizes its accompanying SIM900 GPRS modem to transfer data to a cloud server. End-users can use smart phones to monitor their water tanks. The overall paper presentation is poor. For example, in the abstract, the authors also claim for monitoring turbidity and dissolved oxygen, but in the results and diagram, only pH and MQ-6 are shown. Due to smaller number of WQM parameters, this system does not fulfil the minimum WHO standards (
Table 5).
Gowthamy et al. [
64] presented a low cost IoT-based solution to monitor quality, level, and quantity of water in overhead tanks. Only pH and turbidity were considered to monitor water quality. In addition, they also used a combination of ultrasonic sensor and a flow sensor to control water level and quantity in tanks, respectively. Technical specifications of sensors are not provided. The entire system is based on an Arduino Uno and ESP8266 Wi-Fi transceiver. Programming, testing, and simulation of this system were performed in Arduino IDE. No machine learning methods were utilized for better decision making. In short, this system works as follows: The Arduino Uno reads sensors, does some local processing, and shifts data to a cloud sever (not specified) via ESP8266 and a local Wi-Fi router. The cloud server is used to store data, visualize sensors data, and send an alert to end users via a smart phone in case any anomaly is detected. To summarize, this system is not well mature and should be consulted if auto-filling of tank and/or cleaning is desired only. For measuring drinking water quality, it is not suitable.
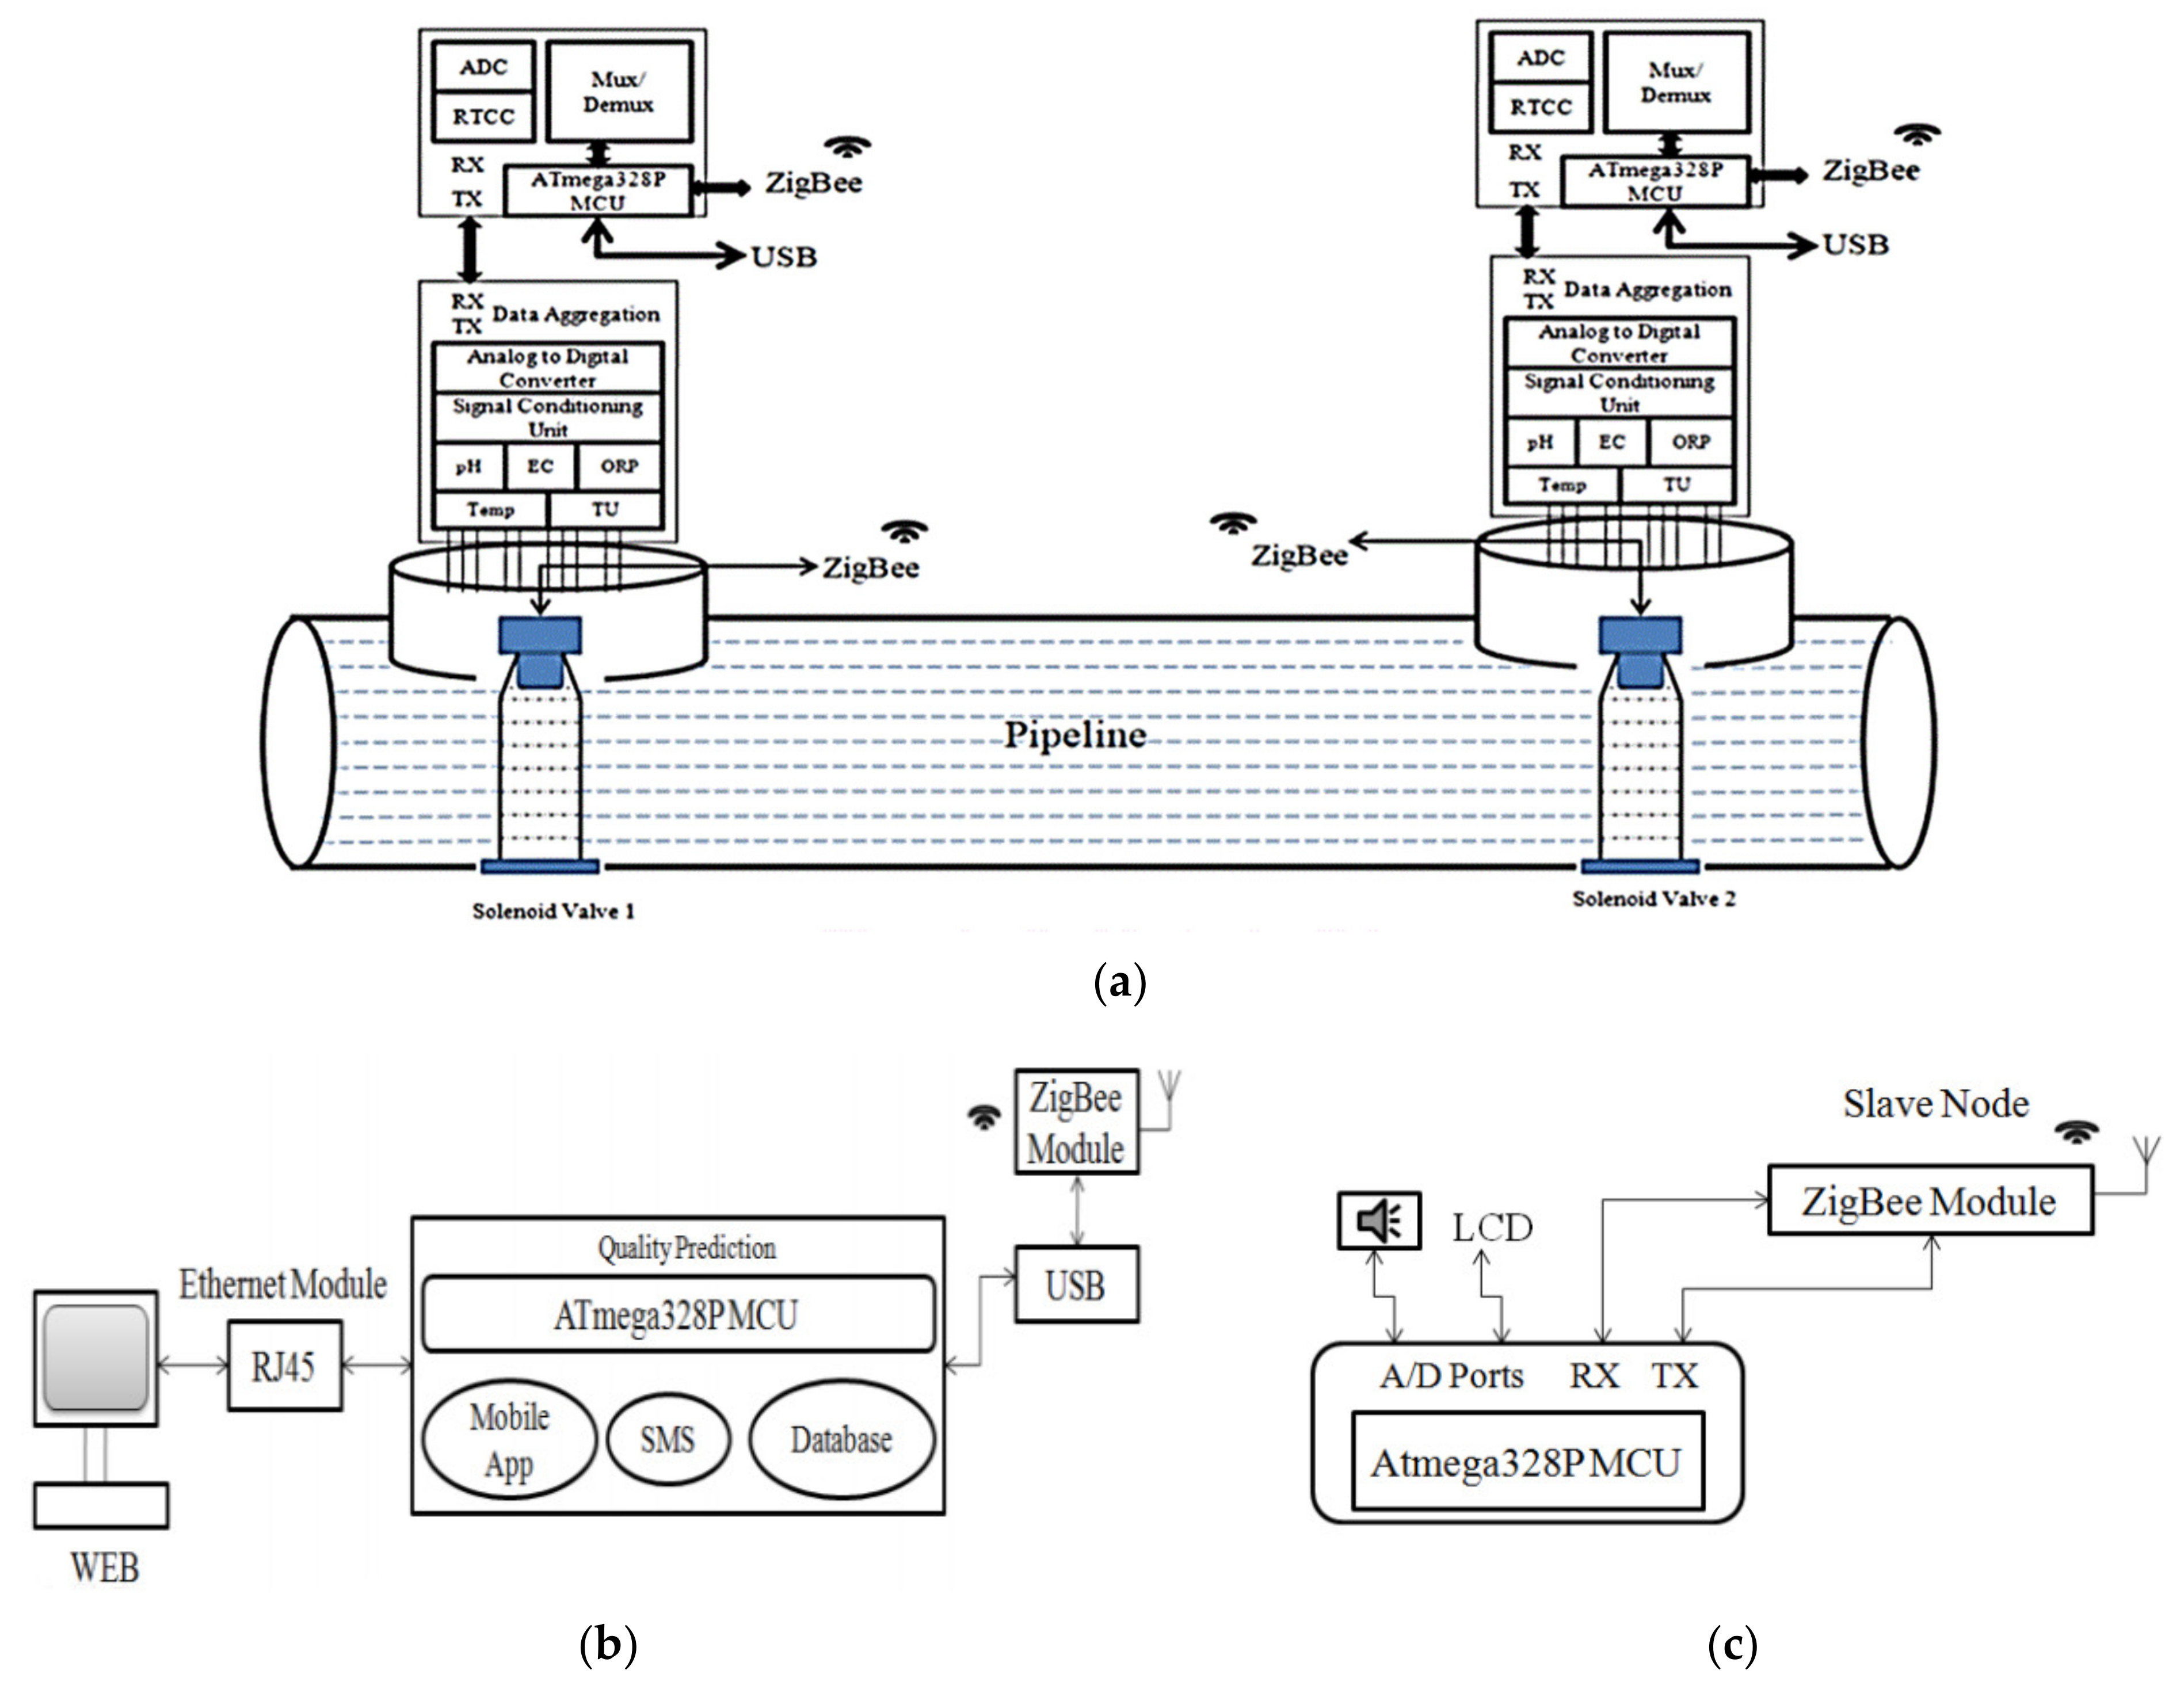
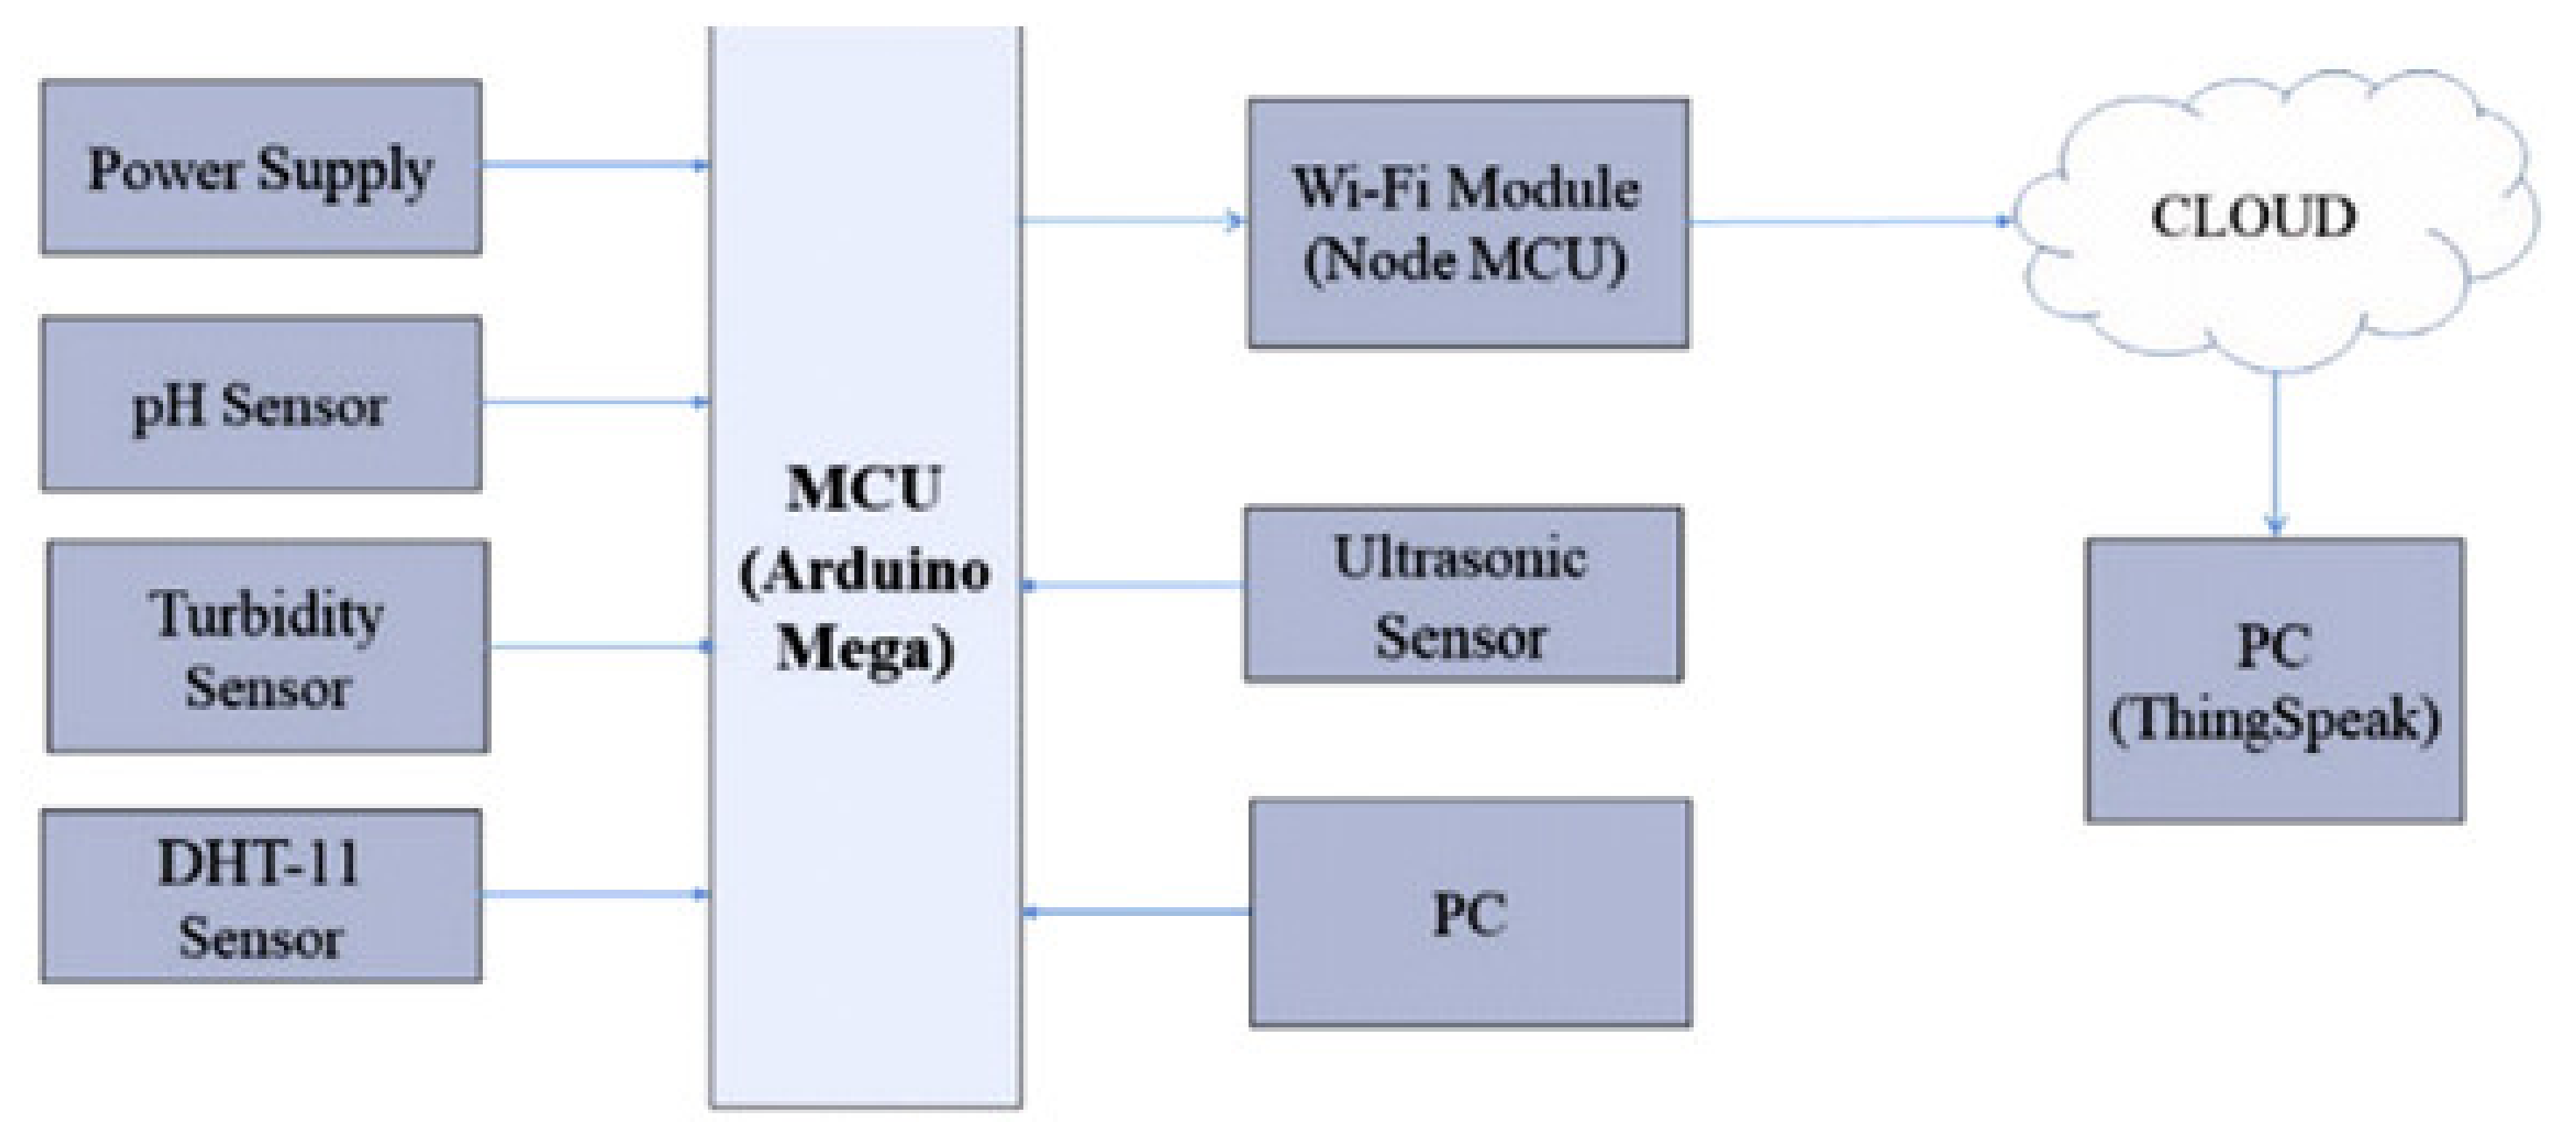
Priya et al. [
68] published a real-time system to monitor water quality and detect contaminations in water distribution system, which is used to supply water from a main tank to consumers. In this concern, authors considered pH, turbidity, temperature, oxidation reduction potential, and electrical conductivity. Sensors’ specifications are detailed thoroughly, but not models. The main architecture of this system (
Figure 8) has three major parts: (i) water quality monitoring unit, (ii) central processing unit, and (iii) notification unit for administration office.
In brief, this system functions as follows: Water from the main tank is controlled via an automatic solenoid valve, which is supervised by a cloud server. Once the valve is open, water flows concurrently in all pipes towards customers houses. The sensors modules are embedded in each street pipe. For every street, data from relevant sensors is read by an Atmega328 MCU-based board. All nodes of the same street could share data with each other. Data to central processing unit (server) is transferred via a ZigBee device. Note, ZigBee device is based on the IEEE 802.15.4. This device is generally utilized for two-way communication between a control system and a sensor. Like Wi-Fi/Bluetooth, ZigBee has short-range of communication with connectivity up to 100 m (meters). The server then processes sensors data using Fuzzy logic to classify it as acceptable, rejected, or desirable. In case an anomaly is detected, the concerned street’s water-supply is then blocked through a solenoid valve, and end-users and authority are informed about this act. The sever is interfaced with internet through an ethernet module. This unit also sends alerts to notification unit for administrative usage. End-users and/or the concerned authority can also check water quality via smart phones. Water quality report is sent/shown to end-users with their home number as well. Though this paper is highly focused on WSN concept and utilizes internet for smart phone applications only, it is a best kick-off for IoT-WQMS.
Thiyagarajan et al. [
93] presented an IoT-based solution to monitor water quality in residential tanks. This system involved pH and TDS. Sensors’ specifications are not provided. In brief, this system functions as follows: First, Arduino Uno reads data from sensors. It transfers data serially to Raspberry Pi3 card. This card deploys K-means clustering algorithm to classify target water as lemonish, salty, muddy, tap, or drinking water. These different classes were used to train a stated algorithm. Raspberry Pi3 transfers data to a desktop PC, which transfers it to a cloud server through an ethernet port. End-users can access the cloud via a smart phone to check water quality.
Notably, this paper is not well documented, e.g., authors did not specify IDE and languages being used in experimentation. In addition, it does not fulfill the minimum requirements of WHO drinking water; the authors deployed ML techniques to compensate this deficiency to some extent. However, a major limitation of this system is involvement of two processing devices. Arduino Uno is based on 8-bit ATmega328 MCU, whereas Raspberry Pi3 card is centered around a powerful 64-bit CPU. ATmega328 has built-in ADC module, whereas Raspberry Pi3 card is deprived of this feature. However, for cost minimization, a cheap ADC module can be interfaced easily with Raspberry Pi3.
Daigavane and Gaikwad [
94] presented an IoT-based solution to monitor water quality and flow. In this study, authors considered temperature, turbidity, and pH. Authors briefed all sensors, but they did not provide their model numbers, except DS18B20. The turbidity and pH sensor are accompanied with their signal conditioning circuitries. The ATmega328 MCU, LCD, power supply circuitry, etc., are mounted on a single printed circuit board (PCB). All coding, testing, and simulations were done in Arduino IDE. The system was not validated in field. In brief, this system functions as follows: First, Arduino Uno based card reads data from sensors, processes it, updates a local LCD, and shifts data to ESP8266 Wi-Fi transceiver. The ESP8266, via a local Wi-Fi router, updates dashboard developed in Blynk IoT-Platform. Authorized end-users can check water quality via smart phones. The paper offers no in-depth details about technical specifications. In addition, the authors also did not involve any machine learning algorithm to enhance decision-making phase about water quality. Due to smaller number of WQM parameters, this system does not fulfill the minimum requirements set by WHO for drinking water (
Table 5).
Prasad et al. [
65] published a smart water quality monitoring system. Though, this system was intended primarily for oceans, but it has also been tested on tap water. This project is based on Libelium IoT-products [
95]. Libelium products are reliable and effective solution for smart water monitoring around globe, e.g., in the Gulf of Kachchh. In this project, authors considered pH, temperature, electrical conductivity, and oxidation reduction potential. The system from Libelium contains all necessary items such as sensors, GSM module, MCU, etc. These products are highly optimized for low power operations. Both the cloud and a local PC are utilized for analytic analysis of data. To better predict water quality, ML schemes are also deployed. This system was tested on surface water, seawater, polluted creek-water, and tap water. In experimentations, the proposed system acquired readings from water samples at rate of one-hour (h) intervals, for a period of 12 h.
In brief, the entire system functions as follows: Sensors are first read by Waspmote MCU board through its built-in ADC module. Next, data is sent to both local PC and a cloud server via GSM module. This system has also ability to locally store data on a Secure digital card. Analysis was performed on a local machine and cloud services. To summarize, this work shows an exposure to Waspmote products, but it does not offer any detailed explanations of how data is analyzed using the machine-learning algorithms. Besides, technical specifications (e.g., CPU/MCU type) of Libelium products used herein are missing.
Pasika and Gandla [
96] presented a low-cost IoT-WQMS. In this system, authors involved only pH and turbidity. In addition, they also monitored water level in an overhead tank and temperature and humidity of the atmosphere via a DHT-11 sensor. The system was tested and simulated in Arduino IDE. All components of system are well detailed, but models for some sensors (e.g., turbidity) were not mentioned. In brief, it works as follows: The sensors are first read by Arduino Mega2560. After processing sensors data, it sends processed data serially to NodeMCU, which forwards this data to ThingSpeak IoT-Platform via a local Wi-Fi router. Data is then processed, analyzed, and visualized in ThingSpeak, which is accessible by authorized end-users via smart phones. No machine learning schemes were used herein.
To summarize, this article is prepared well. Experimental results with snapshots were discussed explicitly. Due to two WQM parameters, this system may not be well suited according to WHO minimum criterion of drinking water. As shown in
Figure 9, a major drawback of this system is over exploitation of hardware resources. For example, both Arduino Mega2560 and NodeMCU (8266) have MCU, ADC, memory, digital I/O pins, ADC modules, etc.
Srivastava et al. [
97] published a smart-phone-based system to monitor water quality with accesses to location information via the Google Maps app. In this study, authors involved pH, TDS, and temperature. Other important WQM parameters such as ORP, EC, and salinity were inferred from measured values of these parameters using statistical modeling techniques. The learning models (e.g., Artificial Neural Network) were trained on pH and TDS datasets and others measured parameters just mentioned. Instead of relying on the readymade commercial electronic kits, authors developed a front-end interface unit from standard parts such as a pH sensor (LMP01200), HC-05 Bluetooth module, EEPROM memory chips, and a dedicated 8-bit MCU. This module is responsible for reading sensors, local processing, and logging data. Interface between the Google-Firebase IoT-platform and front-end unit is a smart phone. In this concern, authors developed a dedicated application to carry out analysis in cloud.
Based on machine learning techniques, the measured and inferred WQM parameters were converted to a single WQI number, which is easy to interpret for understanding. In addition, the developed smart phone application is also capable to auto-calibrate sensitive parts for on-site application. End-users can get SMS, WhatsApp messages, and emails. The overall results of this system are satisfactory in comparison with contemporary work. However, one big bottleneck of this system may be the product cost if it must be installed at many points, e.g., in smart city. However, the overall system cost could be minimized if a SIM900 GSM/GPRS modem is utilized, instead of smart phones, for data transmission between cloud server and sensors module (
Figure 10).
Bahgat et al. [
98] presented an IoT-based solution to monitor water quality. In this study, authors monitored pH, turbidity, temperature, and Carbon-dioxide (CO
2) gas. All sensors were detailed briefly. The model of CO
2 sensor is MQ135, but models for other sensors are not specified. MQ135 is capable to detect gasses such as NH3, benzene, alcohol, smoke, and CO
2 on water surface. The system is centered around Arduino Pro Mini card, which is centered around ATmega328 (8-bit MCU) with numerous On-chip peripherals such as ADC, PWM, memory, I2C, SPI, etc. Though it is compatible with Arduino Uno, it has been customized for small size products.
For communication with cloud, they used ESP8266 Wi-Fi transceiver. For cloud services, they utilized Thinger.io, which is an open source IoT-platform offering a lifetime freemium account to customers for no cost. With this account, customers with few limitations can start learning and prototyping their projects. For commercial activities, premium server with full capacities could be utilized but it is not cost free. Authors simulated and tested entire system in Arduino IDE. For system validation, mud was gradually added into samples. For end-users, this system provides an LCD, PC, and smart phone interface. To brief, it functions as follows: First, Arduino Pro Mini reads data from sensors. After some local processing, it updates results on a local LCD. After that, it transfers data to ESP8266 Wi-Fi transceiver, which uploads data to Thinger.io via a local Wi-Fi router. Sensors’ data is then processed, recorded, and visual aids are updated. The article is well-written but monitoring three WQM parameters without machine learning is not enough to predict water quality precisely.
Lambrou et al. [
48] developed a low-cost real time solution to monitor contamination in distribution system of drinking water. No doubt, maintaining water quality in such systems is currently a big issue for most water control authorities (e.g., municipal) in developing countries. It is mainly because of availability of less funds, lack of manpower, aged infrastructure, etc. Authors tried to use commercial sensors, which are relatively cheap, reliable, long lasting, and resistant to biofouling issues to some extent. Main parameters included are pH, temperature, turbidity, electrical conductivity, and oxidation reduction potential (ORP). For pH and ORP, conventional glass-electrode type sensors were used. For turbidity, electrical conductivity, and temperature, they utilized solid state technology. Authors also devised some useful algorithms to fuse sensors data and infer results about overall water quality. These algorithms are tested with different concentration of E-Coli bacteria and heavy metals such as Arsenic (which is fatal for humans).
Experimental results are satisfactory while detecting these high impact impurities. For risk assessment and generating early warning alerts, authors developed two algorithms: (i) vector distance algorithm (VDA) and (ii) polygon area algorithm (PAA). Moreover, this system is capable of publishing results on a cloud server and informing end-users via an SMS, email, etc. The overall system comprises of a (i) central measurement node (PIC32 MCU based kit), (ii) control node (Raspberry Pi board), and (iii) notification node (PIC MCU based kit). The central measurement node collects data from sensors submerged in a water pipe.
Sensors are equipped with their own electronic kits for signal amplification, conditioning, etc. This unit assesses water quality using some specialized algorithms and transfers data to other nodes via USB and ZigBee modules. The control node stores data being received from central measurement node into a local database. It transfers data to a local Wi-Fi router through its ethernet module. The Wi-Fi routers transfers data to a web cloud service (Pachube open source) for analytic analysis and visualization. In addition, it sends emails and SMS alerts in case any anomaly is detected. Finally, notification node, which receives information from central measurement node, provides alerts to consumer via LEDs, LCD, and a buzzer about nearby tap water. Major contributions of this article are development of an effective turbidity sensor and analog signal conditioning circuitries for other sensors. To summarize, this article is well articulated in terms of technical details, experimental results, and discussion (
Table 5).
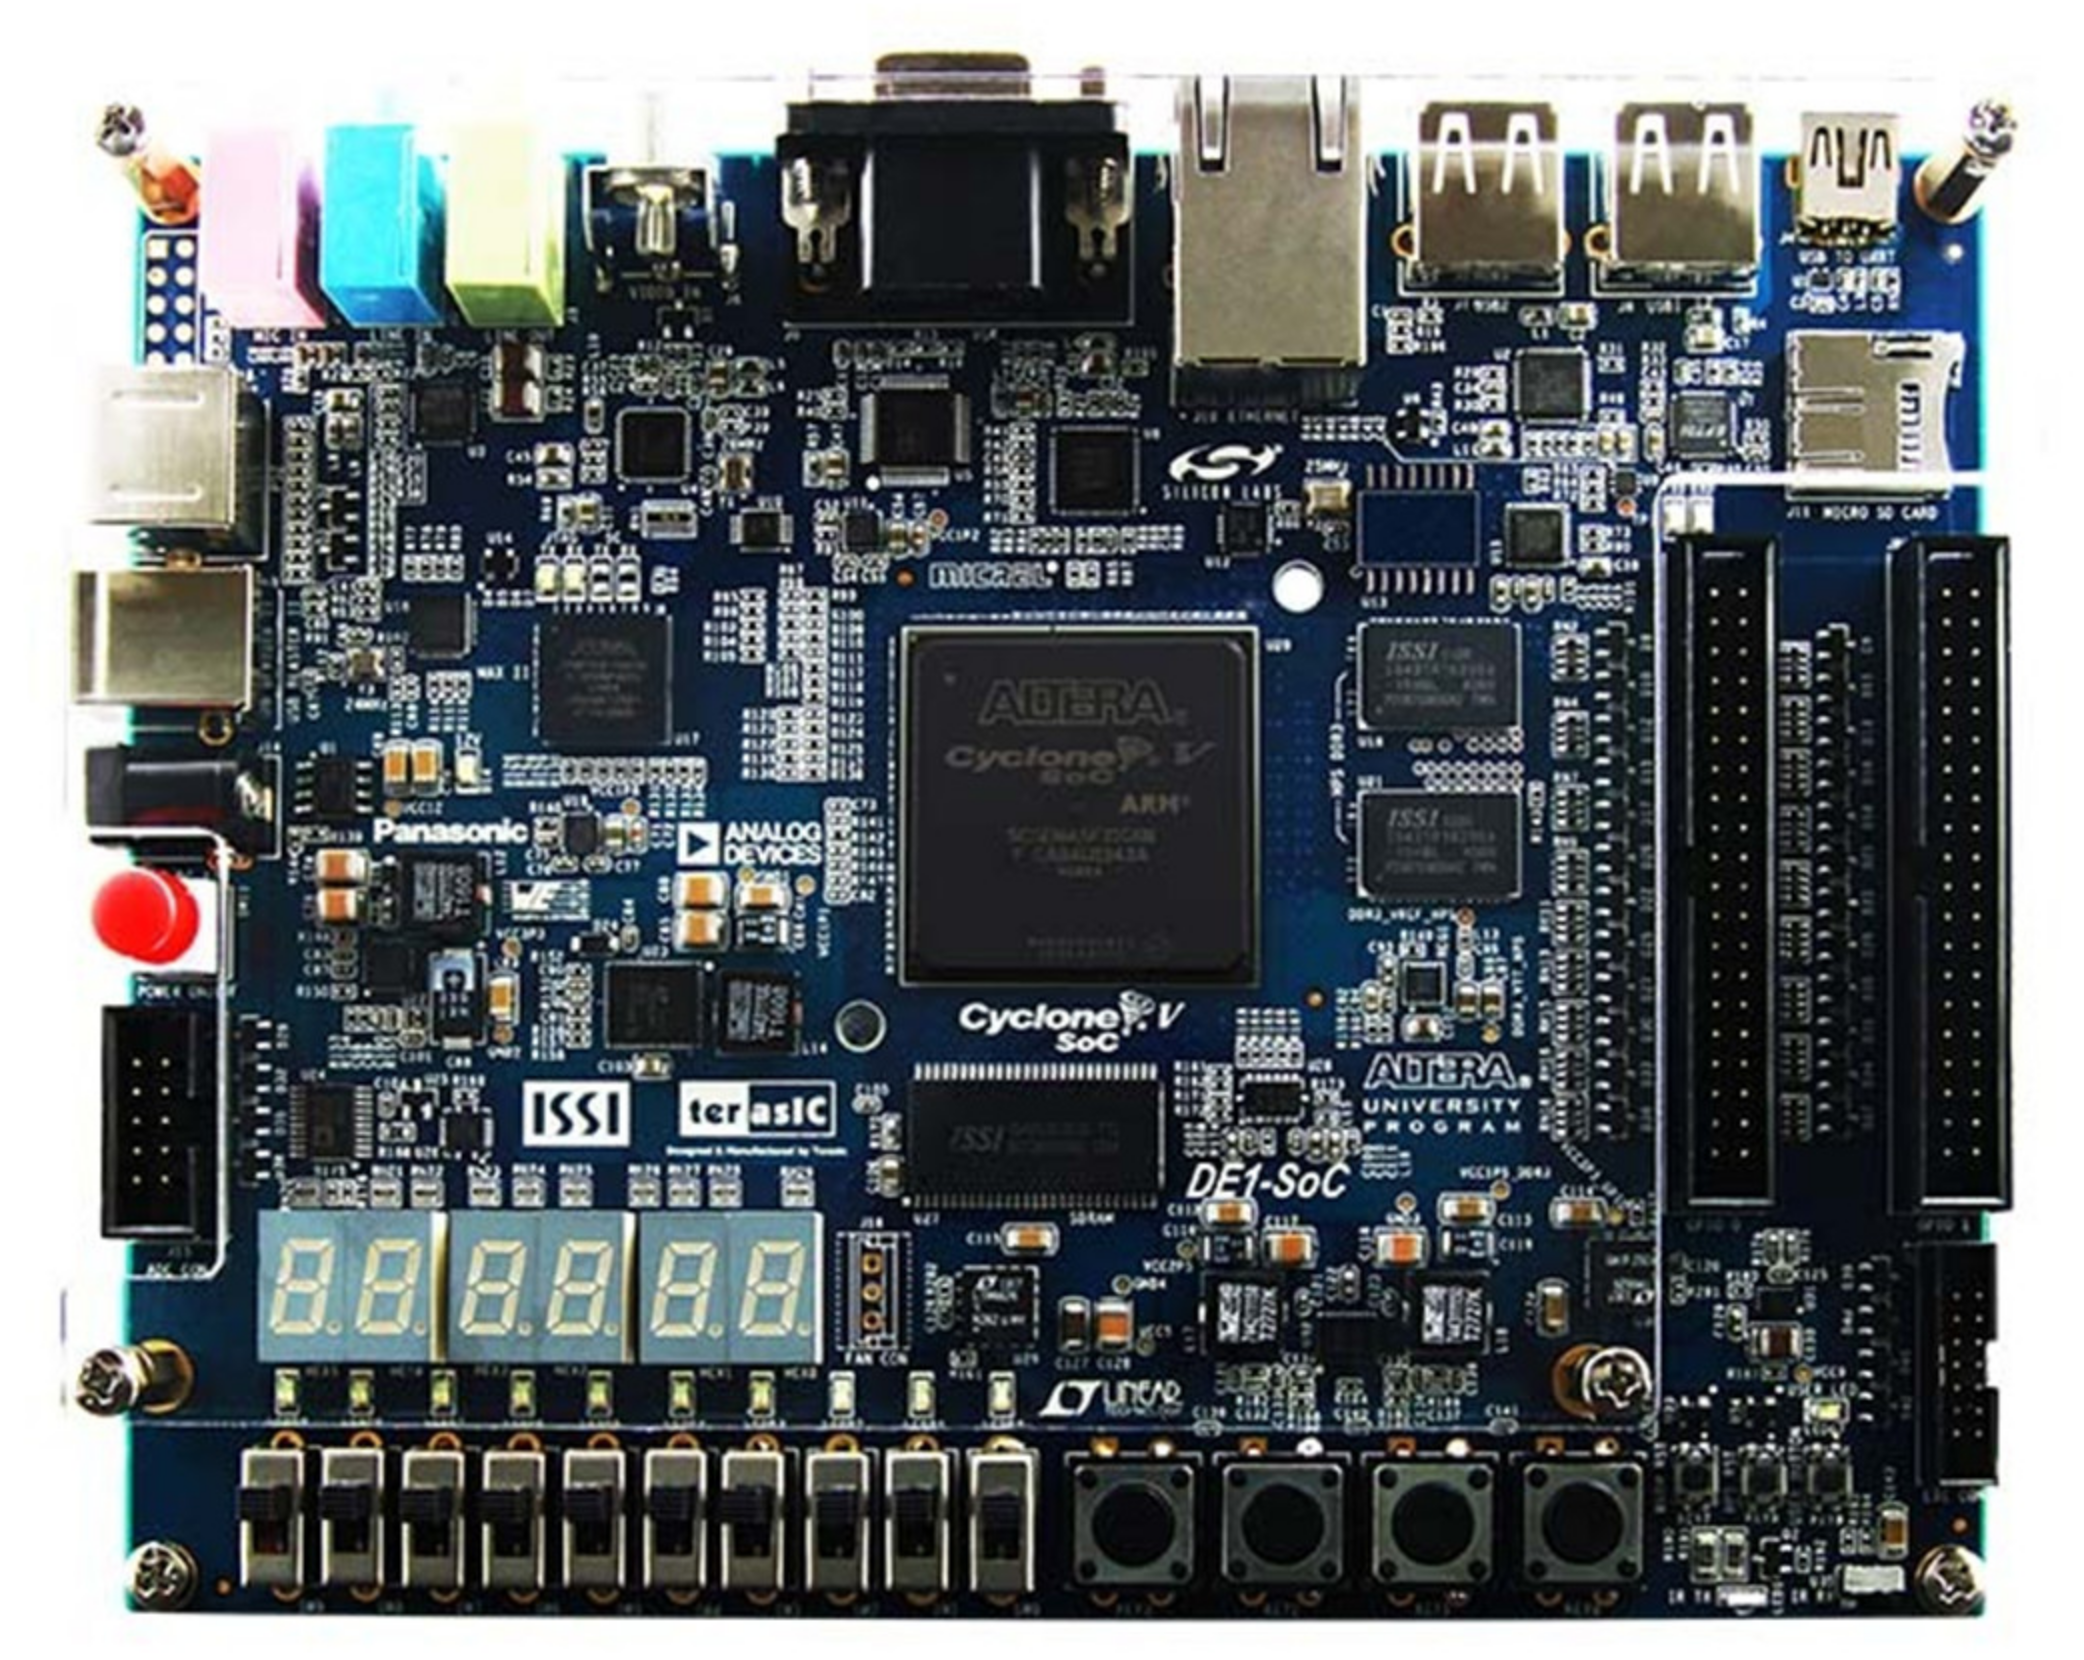
Cho-Zin et al. [
99] presented an IoT-based solution for water quality monitoring. The authors involved temperature, pH, turbidity, and CO
2. In addition, they also monitored water level via an LV-MAXSONAR-EZ1 sensor; it is a Sonar. For temperature, CO
2, and turbidity, authors used DS18B20, SKU: SEN0219, and SKE: SEN0189 sensors, respectively. However, the model for pH is not specified. The entire system is deployed on DE1-SoC FPGA Development Kit (
Figure 11). This board offers a flexible hardware design-platform built around an Altera System-on-Chip (SoC) FPGA. Briefly, this SoC integrates a hard processor system (i.e., dual-core ARM cortex-A9 microprocessor, with 800 MHz clocking frequency), memory, and peripherals interfaces knotted with FPGA module through a high-bandwidth interconnect backbone. For coding and simulations, authors used Altera Quartus-II IDE. The control unit to read sensors and communicate with ZigBee transceiver was implemented in FPGA fabric using the Nios-II soft-core processor available in the Quartus-II Qsys Tools. The C-code running over the Nios-II CPU and VHDL codes were utilized to run control unit. Code to process WQM parameters and commands of the wireless transceiver modules were programmed in Nios-II Eclipse through C and VHDL languages. For data visualization, authors installed Grafana package on a desktop PC, with Linux operating system. Moreover, pin connections for all sensors and devices are detailed explicitly. For analog signal conditioning, an onboard ADC module is utilized. For wireless communication between a remote PC and this board, authors utilized ZigBee PRO S1 module. This is a radiofrequency module, which can provide robust communication in the peer-to-peer, point-to-point, and multipoint/star configurations.
After powering this system, it was installed on the bank of a lake to monitor water quality, where data was collected over a period of 15 days. Data was transferred by FPGA board to a remote PC equipped with a ZigBee receiver module and located 86 m away from lake. Data was processed, stored, and analyzed to visualize probable trends in water quality. Authors did not discuss using ML schemes to enhance decision-making phase. Experimental results being illustrated on LiCliplse console-windows are satisfactory. To summarize, this system does not qualify the minimum WHO standards of drinking water. A major limitation of this design is overall cost of using an expensive DE1-SoC FPGA board. This card is utilized to read sensors and transfer data to a remote PC via an external ZigBee kit only. No doubt, this is not a big task to which such a powerful SoC should be assigned. This wastage of technical resources and the overall system cost could be optimized as follows: Firstly, developers should buy a simple FPGA chip and burn target bitstream file into its fabric via a chip-programmer. After that, it can be mounted onto a customized PCB along with supporting electronic circuitry. Secondly, a NodeMCU (EPS8266) module or Arduino Nano 33 IoT card should be utilized to better perform this task.


