Article

Temporal and Spatial Variation Characteristics of Precipitation in the Haihe River Basin under the Influence of Climate Change

1
School of Water Conservancy and Hydroelectric Power, Hebei University of Engineering, Handan 056021, China
2
Hebei Key Laboratory of Intelligent Water Conservancy, Handan 056001, China
3
School of Earth Science and Engineering, Hebei University of Engineering, Handan 056021, China
4
Environmental Publicity and Education Center of Handan, Handan 056002, China
*
Authors to whom correspondence should be addressed.
Water 2021, 13(12), 1664; https://doi.org/10.3390/w13121664
Submission received: 22 May 2021 / Revised: 10 June 2021 / Accepted: 10 June 2021 / Published: 15 June 2021
(This article belongs to the Section Hydrology)

Abstract

:
The impact of global climate change on the temporal and spatial variations of precipitation is significant. In this study, daily temperature and precipitation data from 258 meteorological stations in the Haihe River Basin, for the period 1960–2020, were used to determine the trend and significance of temperature and precipitation changes at interannual and interseasonal scales. The Mann–Kendall test and Spearman’s correlation analysis were employed, and significant change trends and correlations were determined. At more than 90% of the selected stations, the results showed a significant increase in temperature, at both interannual and interseasonal scales, and the increasing trend was more significant in spring than in other seasons. Precipitation predominantly showed a decreasing trend at an interannual scale; however, the change trend was not significant. In terms of the interseasonal scale, the precipitation changes in spring and autumn showed an overall increasing trend, those in summer showed a 1:1 distribution ratio of increasing and decreasing trends, and those in winter showed an overall decreasing trend. Furthermore, the Spearman’s correlation analysis showed a negative correlation between temperature and precipitation in the entire Haihe River Basin, at both interannual and interseasonal scales; however, most of the correlations were weak.

1. Introduction

Globally, climate change has become one of the major environmental problems of the 21st century, and it has attracted increasing attention from the international community as well as the governments of various countries [1]. According to the Fifth Report of the Intergovernmental Panel on Climate Change, the average global temperature increased by 0.85 °C between 1988 and 2012, at an average rate of 0.064 °C per decade [2]; such an increase in global temperature would influence regional hydrological cycles, including changes in the spatial and temporal distribution of precipitation. Some earlier studies have suggested that global warming may exacerbate the uneven distribution of precipitation, resulting in more precipitation in wet areas and less precipitation in dry areas [3,4,5,6]. However, recent studies have shown that the “arid areas becoming drier and humid areas becoming wetter” notion does not apply to all regions. According to Greve et al. [7], since 1948, only approximately 11% of global precipitation over land has become "drier and wetter," and it has also been reported that extreme precipitation events are likely to become more intense and frequent in some parts of the mid-latitudes and humid tropics [2].
China is located east of the Eurasian continent and along the west coast of the Pacific Ocean. Owing to its vastness, the natural climatic conditions in its northern, southern, eastern, and western regions are different, and because of the global increase in temperature, the precipitation changes in China have become very complicated [8]. Although there has been a general increase in precipitation over China, some scholars believe that some regions in the country are experiencing a decreasing trend, indicating that regional differences in precipitation also exist. Additionally, it has been reported that precipitation in the west and south of China show an increasing trend, while that in the east and north show a decreasing trend [9,10,11,12]. Kai [13] also reported that longitude and latitude directions showed different precipitation characteristics. Specifically, in the longitude direction, there was an increasing trend from west to east, and in the latitude direction, there was an increasing trend from north to south. Dongsheng [14] also pointed out the existence of a significant increasing trend in precipitation in the northwest and southeast of China and a significant decreasing trend from the northeast to the southwest in the middle region of the country. From the perspective of basin regionalization, some scholars have reported that precipitation in China has mainly been concentrated in the Pearl River Basin, Southeast River Basin, and Yangtze River Basin, with the Northwest River Basin experiencing the least precipitation [15,16,17,18,19].
In addition to being an important industrial and agricultural production area, the Haihe River Basin is also a cultural and political center in China [20]. The per capita and per mu water resources in this river basin are one-seventh and one-ninth of the national average, respectively, which indicates that this a serious water resource-scarce area in China [21]. Presently, several experts and scholars are studying precipitation in this river basin in order to provide theoretical support for alleviating the problem of insufficient water resources. Wang [22] analyzed the 1960–2010 daily precipitation data for the Haihe River Basin and observed that precipitation in this river basin showed a general decreasing trend. Additionally, Hao [23] analyzed precipitation over different landforms in this river basin and reported that precipitation in plain areas was greater than that in mountainous and hilly areas. Liu [24] collected and analyzed precipitation data from 47 weather stations in this river basin and reported that the entire river basin region was experiencing a drought trend owing to decreased precipitation. In this river basin, it has also been observed that, in the dry and wet seasons, there is an increased probability of greater precipitation intensity on the first day after a drought. Furthermore, Yan et al. [25] divided the Haihe River Basin into six subregions, and they reported a downward precipitation trend. Recently, Yu [26] summarized relevant research results on precipitation evolution and change trends in this river basin and reported a gradual decrease from east to west and south to north. In addition, using 1959–2016 precipitation data from 57 stations in this river basin, Sun et al. [27] analyzed precipitation trend characteristics. Their results showed that over the past 60 years, precipitation in the Haihe River Basin showed a general decreasing trend that indicated a decrease in precipitation from the central and northern plains to the northwest and southeast regions. In summary, based on the results of these previous studies, it can be highlighted that most of the precipitation changes were evaluated from a perspective of multiple factors and processes given that precipitation, which has complex characteristics, is a product of the comprehensive action of several factors. However, the results of these studies are limited owing to the drawbacks associated with the use of time series data. Additionally, in these studies, only specific stations were selected, leading to non-representativeness of the results, implying that the results cannot be generalized to represent the situation in the Haihe River Basin.
Therefore, for this study, considering the Haihe River Basin as the research area, we took into account several parameters, including the spatial and temporal distribution and variation characteristics of precipitation, the influence of temperature changes, the time series of data, and site selection, to further explored the spatial and temporal distribution characteristics of precipitation in the Haihe River Basin under the influence of climate change.

2. Data and Methods

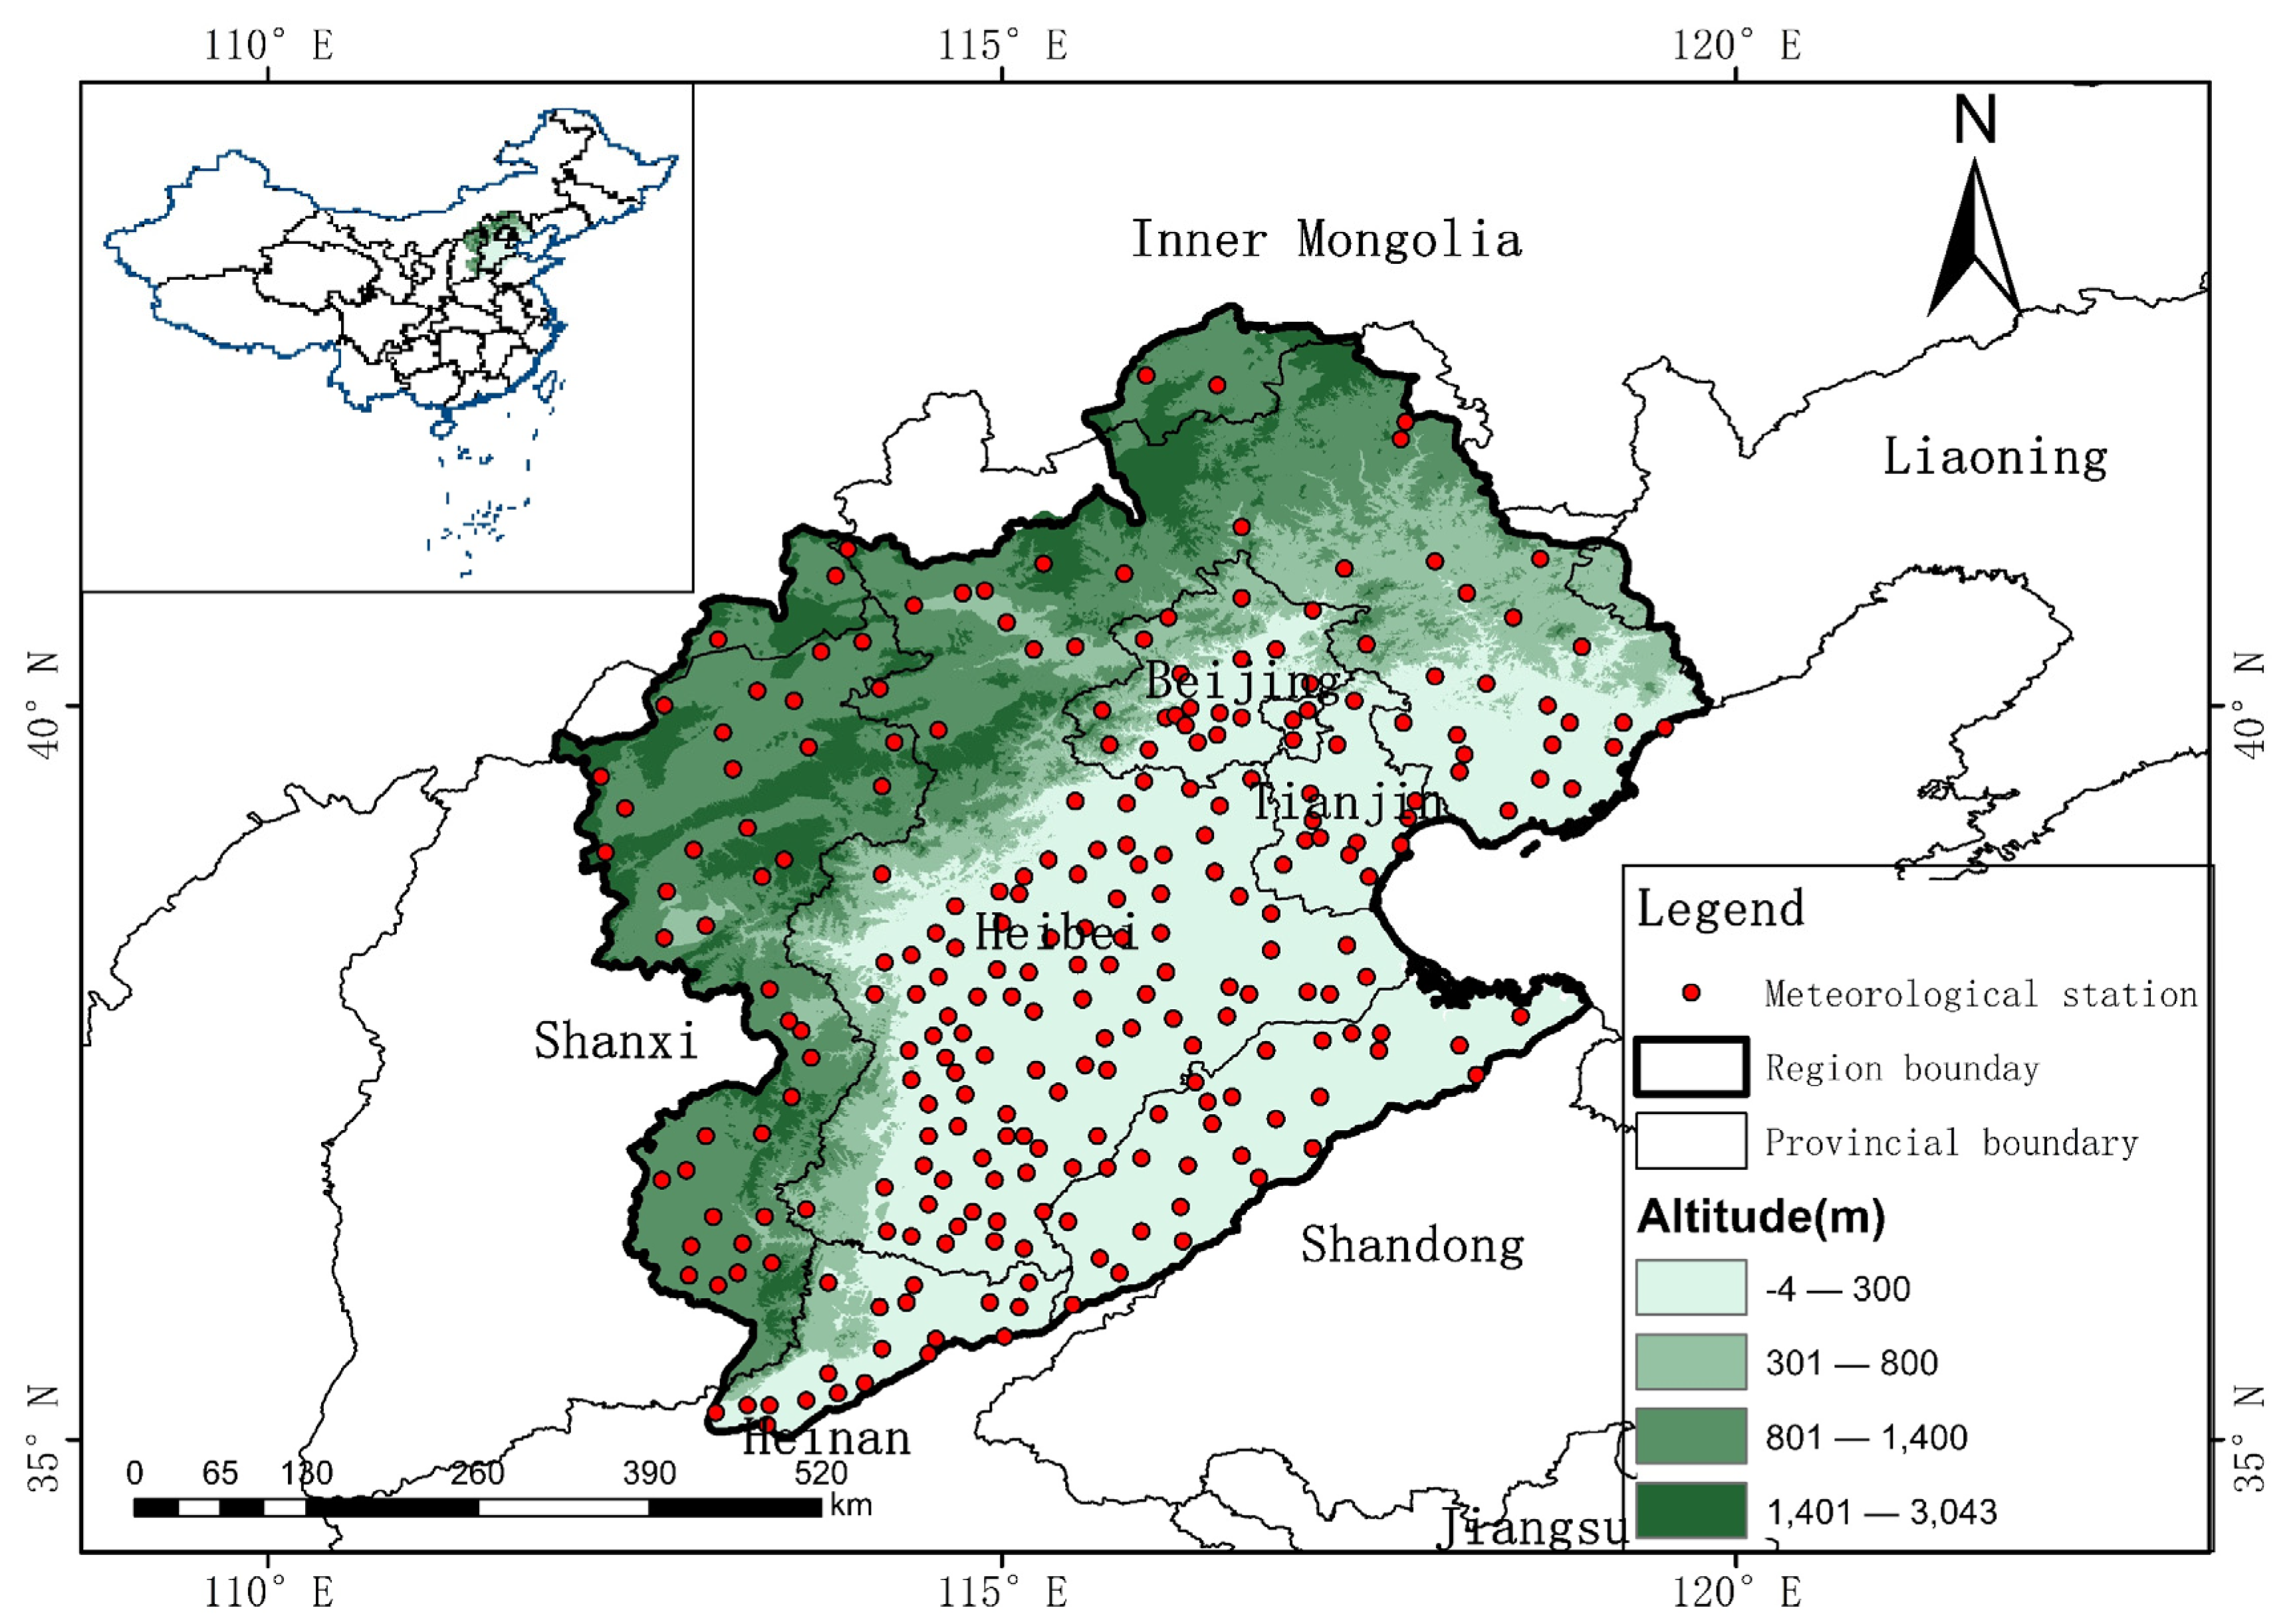
2.1. Overview of the Study Area

The Haihe River Basin occupies a total area of 318,000 km2 and is located at 35°–43° N and 112°–120° E. The basin includes Beijing, Tianjin, 91% of Hebei Province, 38% of Shanxi Province, 20% of Shandong Province, and 9.2% of Henan Province, as well as 13,600 km2 of the Inner Mongolia Autonomous Region and 17,700 km2 of Liaoning Province [28]. It is located adjacent to the Bohai Sea in the east, the Taihang Mountains in the west, the Yellow River in the south, and the Mongolian Plateau in the north. The topography of the entire basin is higher in the northwest than in the southeast [29], and it consists of the following seven major river systems: the Luanhe, Beisanhe, Yongding, Daqing, Ziya, Zhangwei, and Tuhaimajiahe river systems [30]. The Haihe River Basin is located in the transitional zone of the arid and humid climates in China, and its annual average temperature ranges from 0 to 14.5 °C. Additionally, the spatial and temporal distribution of precipitation in this basin, with average annual precipitation equal to 535.5 mm, shows obvious zonal, seasonal, and interannual differences [31,32]. Figure 1 shows the specific geographical location of this river basin.

2.2. Data Sources

The data used in this study were provided by the National Meteorological Information Center of the China Meteorological Administration and had been obtained from 258 meteorological stations. The data series included daily precipitation and average daily temperature data for the period 1960–2020. Figure 2 shows specific information corresponding to the selected stations for this study. To compensate for some missing site data, interpolation and extension were performed after comparison with data from adjacent sites as well as historical data for several years from corresponding sites.
The annual and seasonal precipitation data at the stations were accumulated based on daily data. February–April, May–July, August–October, and November–December/January corresponded to spring, summer, autumn, and winter, respectively.

2.3. Research Methods

In this study, the Mann–Kendall test was used to determine the precipitation trend in the Haihe River Basin as well as its significance, while the Spearman’s correlation analysis was used to determine correlations between the meteorological elements and precipitation. The spatial distribution maps of significant changes in temperature and precipitation as well as those of the correlations between temperature and precipitation in the Haihe River Basin were drawn using the Kriging interpolation method.

2.3.1. The Mann–Kendall Test

The Mann–Kendall test [33,34,35,36,37,38,39] is a widely used nonparametric statistical analysis method. Its characteristic advantage is that the data samples do not need to obey any specific distribution pattern and are not disturbed by a few outliers, and it has a high quantification degree. Furthermore, this test is commonly used to predict long-term trends in hydrometeorological time series data, such as temperature, precipitation, runoff, and water quality [40,41,42].
The Mann–Kendall test assumes that the null hypothesis, H0, is the time series data, (X1, X2, ..., Xn), with n representing the number of independent samples of identically distributed random variables, while the alternative hypothesis, H1, is a bilateral test. For all k values, j ≤ n, and k ≠ j, and the distributions of Xk and Xj are different. The test statistic, S, is defined as:
S = i = 1 n 1 j = i + 1 n S g n ( X i X j )
where S g n ( ) represents the symbolic function:
S g n ( X i X j ) = { 1 0 1   X i X j > 0 X i X j = 0 X i X j < 0 }
When n 8 , S is approximately normally distributed with a mean of 0 and a variance given by:
V a r ( S ) = n ( n 1 ) ( 2 n + 5 ) i = 1 m t i ( t i 1 ) ( 2 t i + 5 ) 18
where m is the number of ties and t i is the number of occurrences in each tie.
Furthermore, the formulas for the determination of the M–K statistic, Z, under the conditions, S > 0, S = 0, and S < 0, are:
Z = { ( S 1 ) / V a r ( S ) 0 ( S + 1 ) / V a r ( S ) S > 0 S = 0 S < 0 }
Thus, the Mann–Kendall test was used for sequence mutation analysis, and the order column was constructed as follows:
S k = i = 1 k j i 1 a i j         k = 2 , 3 , 4 , , n  
where
a i j = { 1   x i > x j 0   x i < x j       1 j i
Additionally, the formula for the calculation of statistical variables was given by:
U F k = | S k E ( S k ) | var ( S k )         k = 1 , 2 , 3 , , n
where E ( S k ) and Var ( S k ) , which are defined according to Equations (2)–(8), are the mean and variance of S k , respectively.
E ( S k ) = k ( k + 1 ) 4 Var ( S k ) = k ( k 1 ) ( 2 k + 5 ) 72
According to the time series data, Xn, Xn-1, ..., X1 is arranged in reverse order, and as described above:
{ U B k = U F k k = m + 1 k         k = 1 , 2 , 3 , , n
By analyzing the statistical sequences of the UF and UB curves, the change trend of sequence X could be further analyzed; thus, the mutation time and mutation area could be identified [43]. Under the premise of a significance level, α = 0.05 (the critical value being ± 1.96), there are four possible results, i.e., significant increase, significant decrease, no significant increase, and no significant decrease.

2.3.2. Spearman’s Correlation Analysis

The Spearman’s correlation coefficient [44,45], expressed as p, is a nonparametric index that is used to measure the dependence between two variables. This method, which does not require data distribution information and can better reflect the correlation between precipitation and temperature, uses a monotone equation to evaluate the correlation between two statistical variables. It is calculated as [46,47,48,49]:
ρ s = 1 6 d i 2 n ( n 2 1 )
where d i = the difference between the ranks of corresponding variables, and n = the number of observations.
Therefore, the degree of correlation between the two variables was determined using the ρ-values ( ρ [ 1 , 1 ] ), with degree classification standards as shown in Table 1 [22,50].

3. Results and Discussion

3.1. Temperature Trend Analysis and Significance

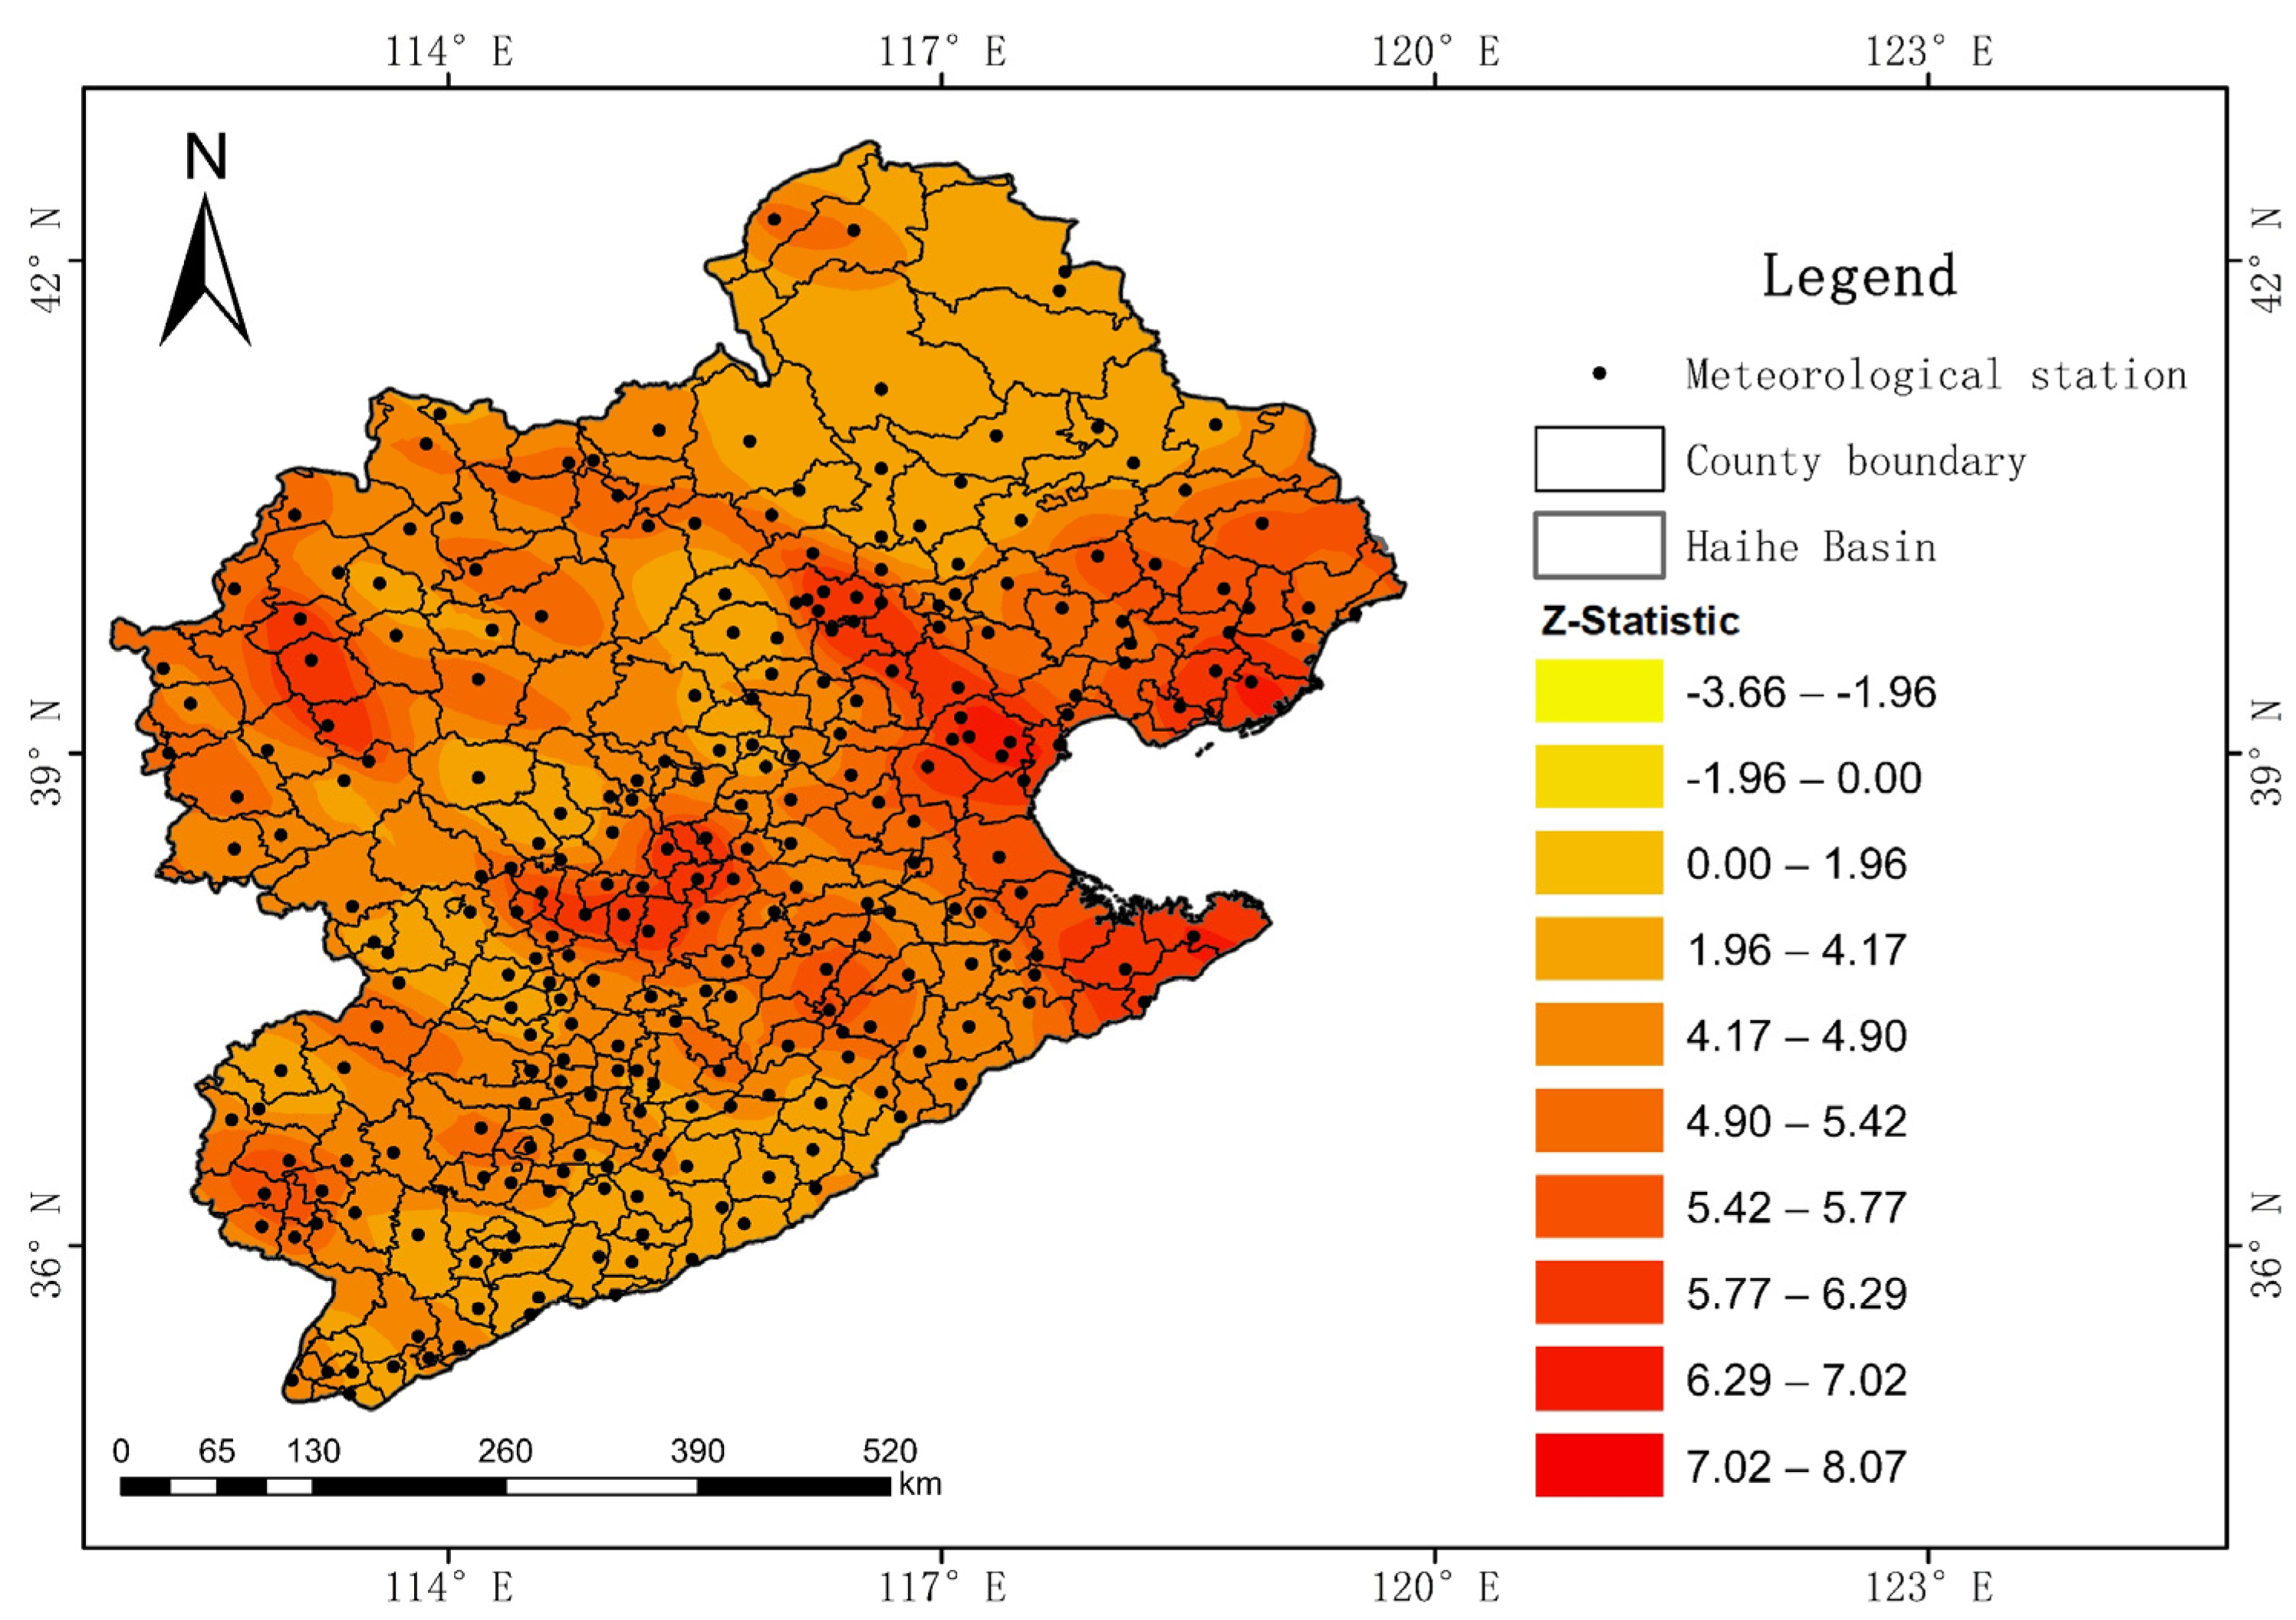
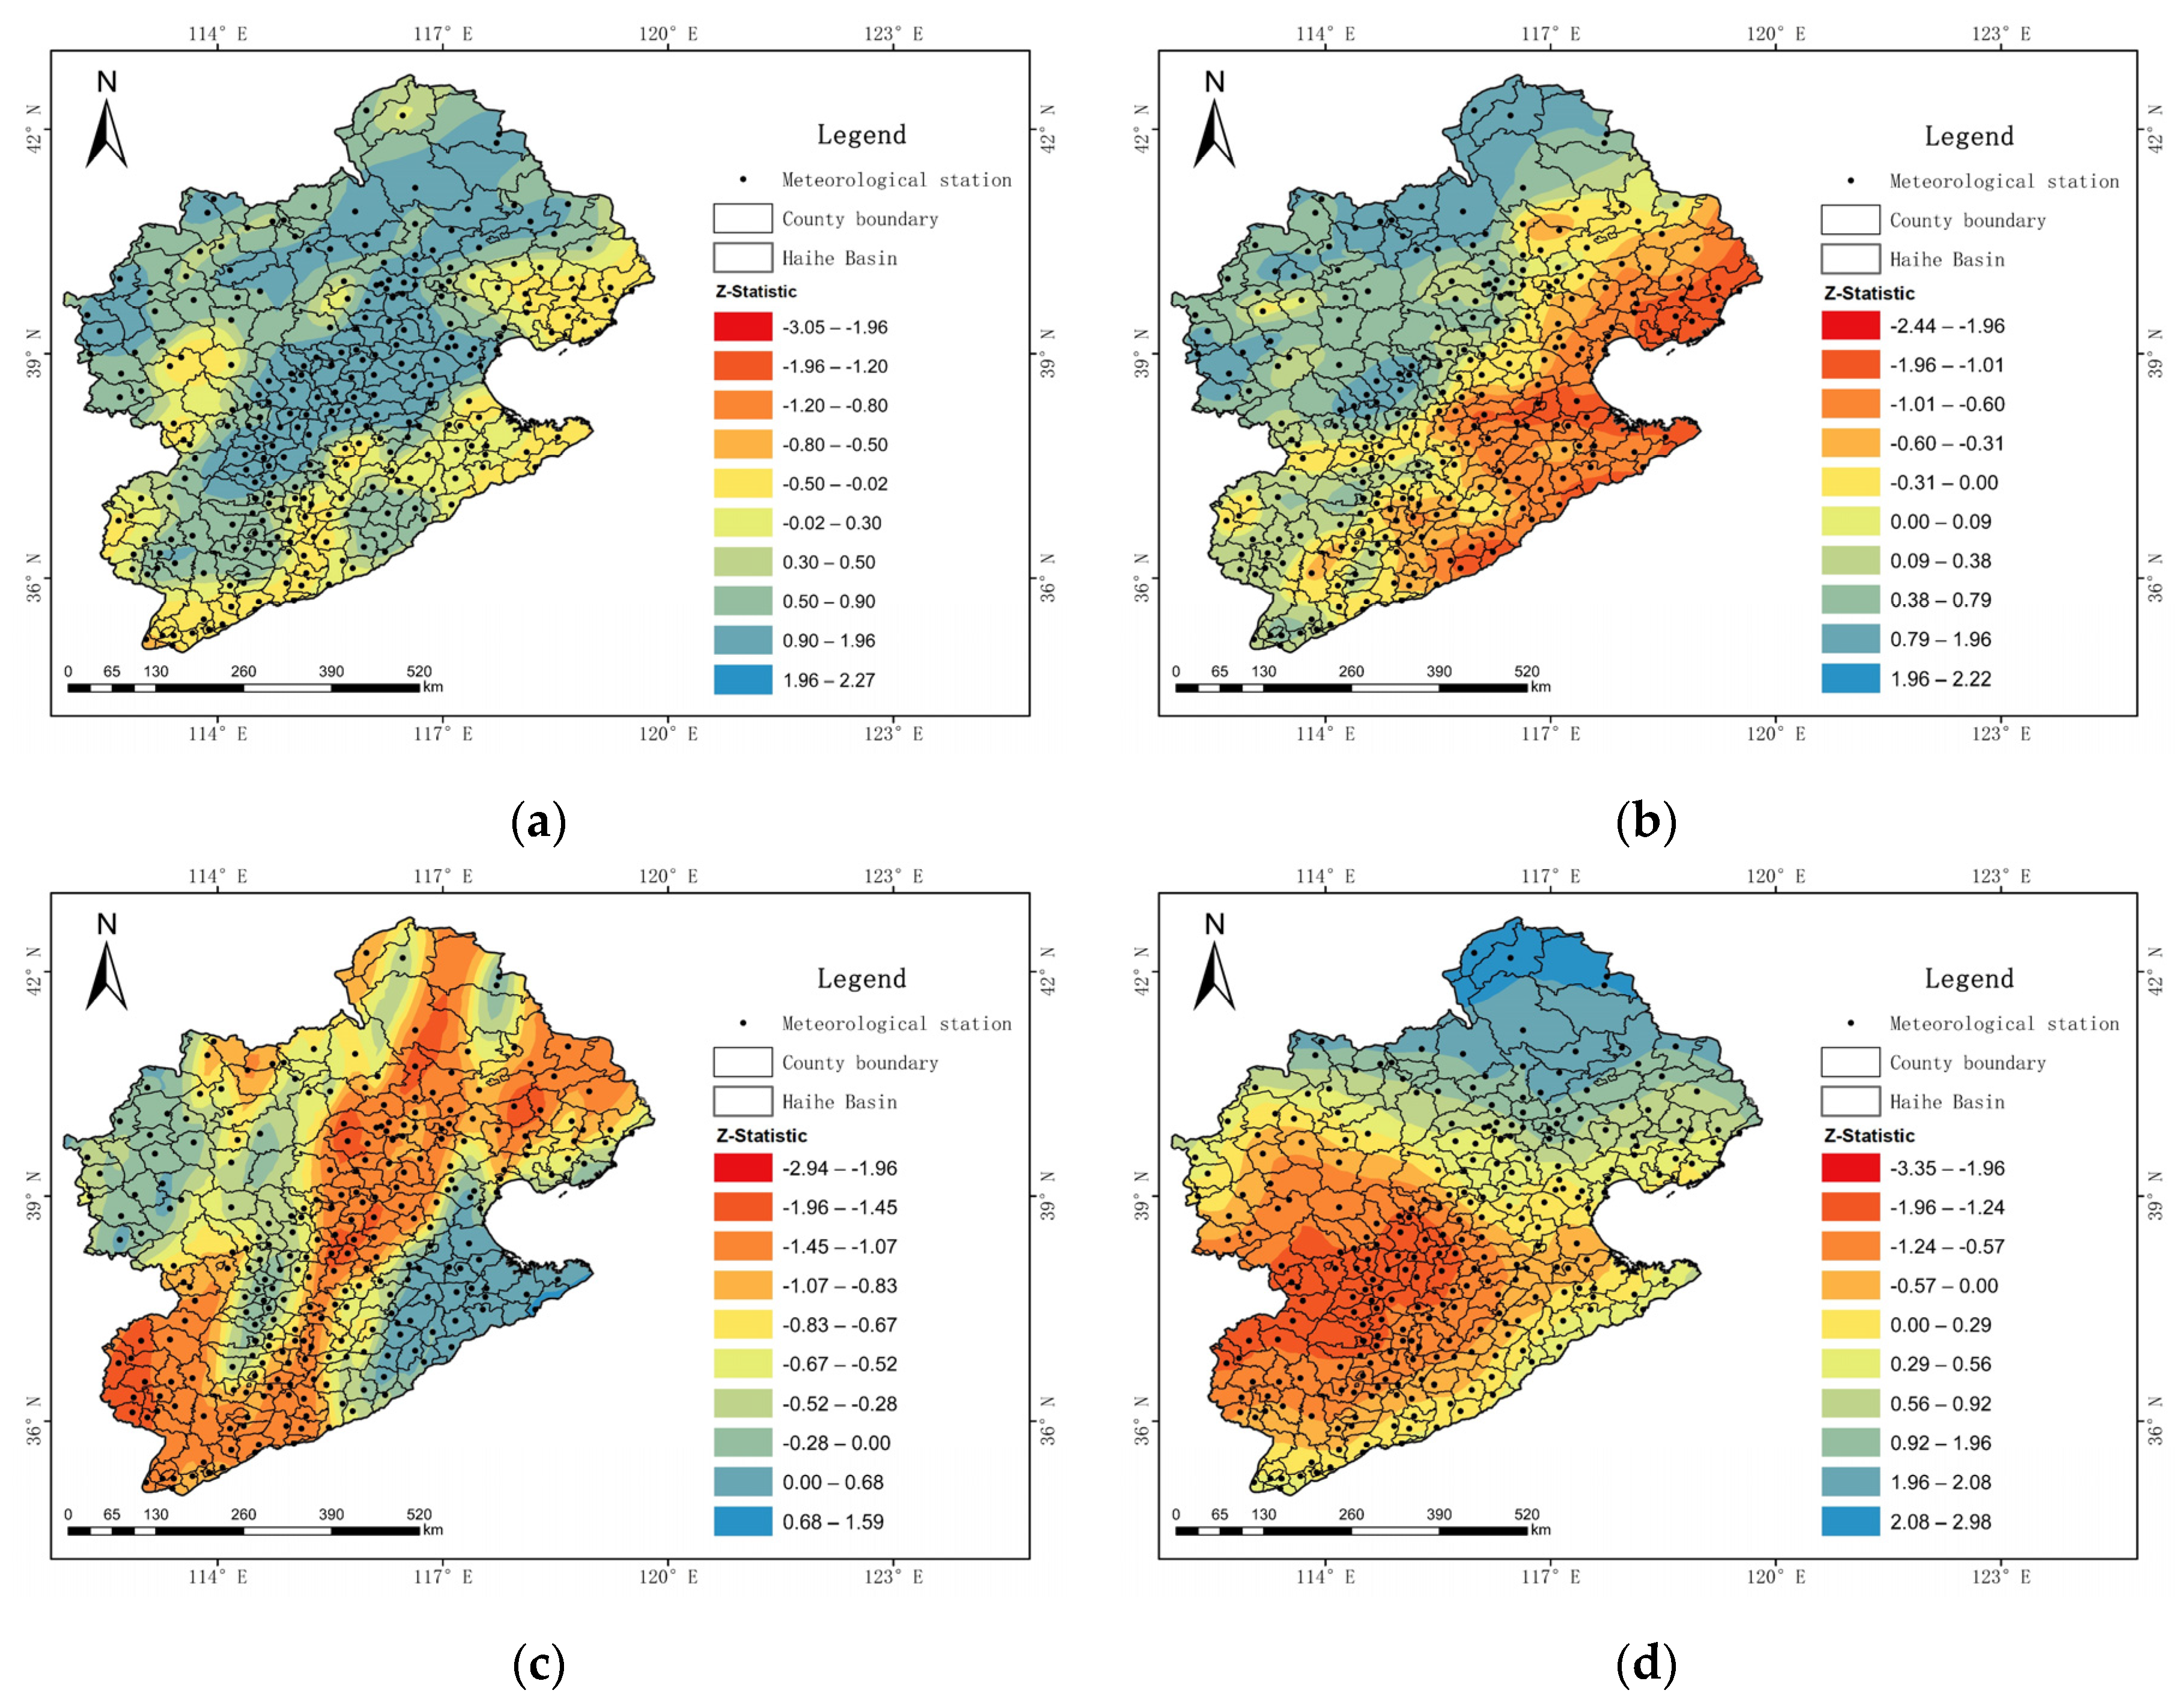
3.1.1. Analysis of Annual Mean Temperature Changes

According to the results of the Mann–Kendall test involving annual mean temperature data for the 1960–2020 period, the annual mean temperature at 254 stations (i.e., 98.4% of the total number of stations) showed an increasing trend, with the increasing trend being significant at 246 stations. Conversely, four stations (1.6% of the total number of stations) showed a decreasing trend, with the decreasing trend being significant only at two stations.
Considering the spatial distribution chart that shows the significance of annual mean temperature as well (Figure 3), it can be observed that the annual mean temperature in the Haihe River Basin shows an overall increasing trend. Specifically, the highest increase in temperature is observed in the eastern coastal areas. However, in the central, western, and southwestern regions of the river basin, the increase in temperature is significant only in some areas.

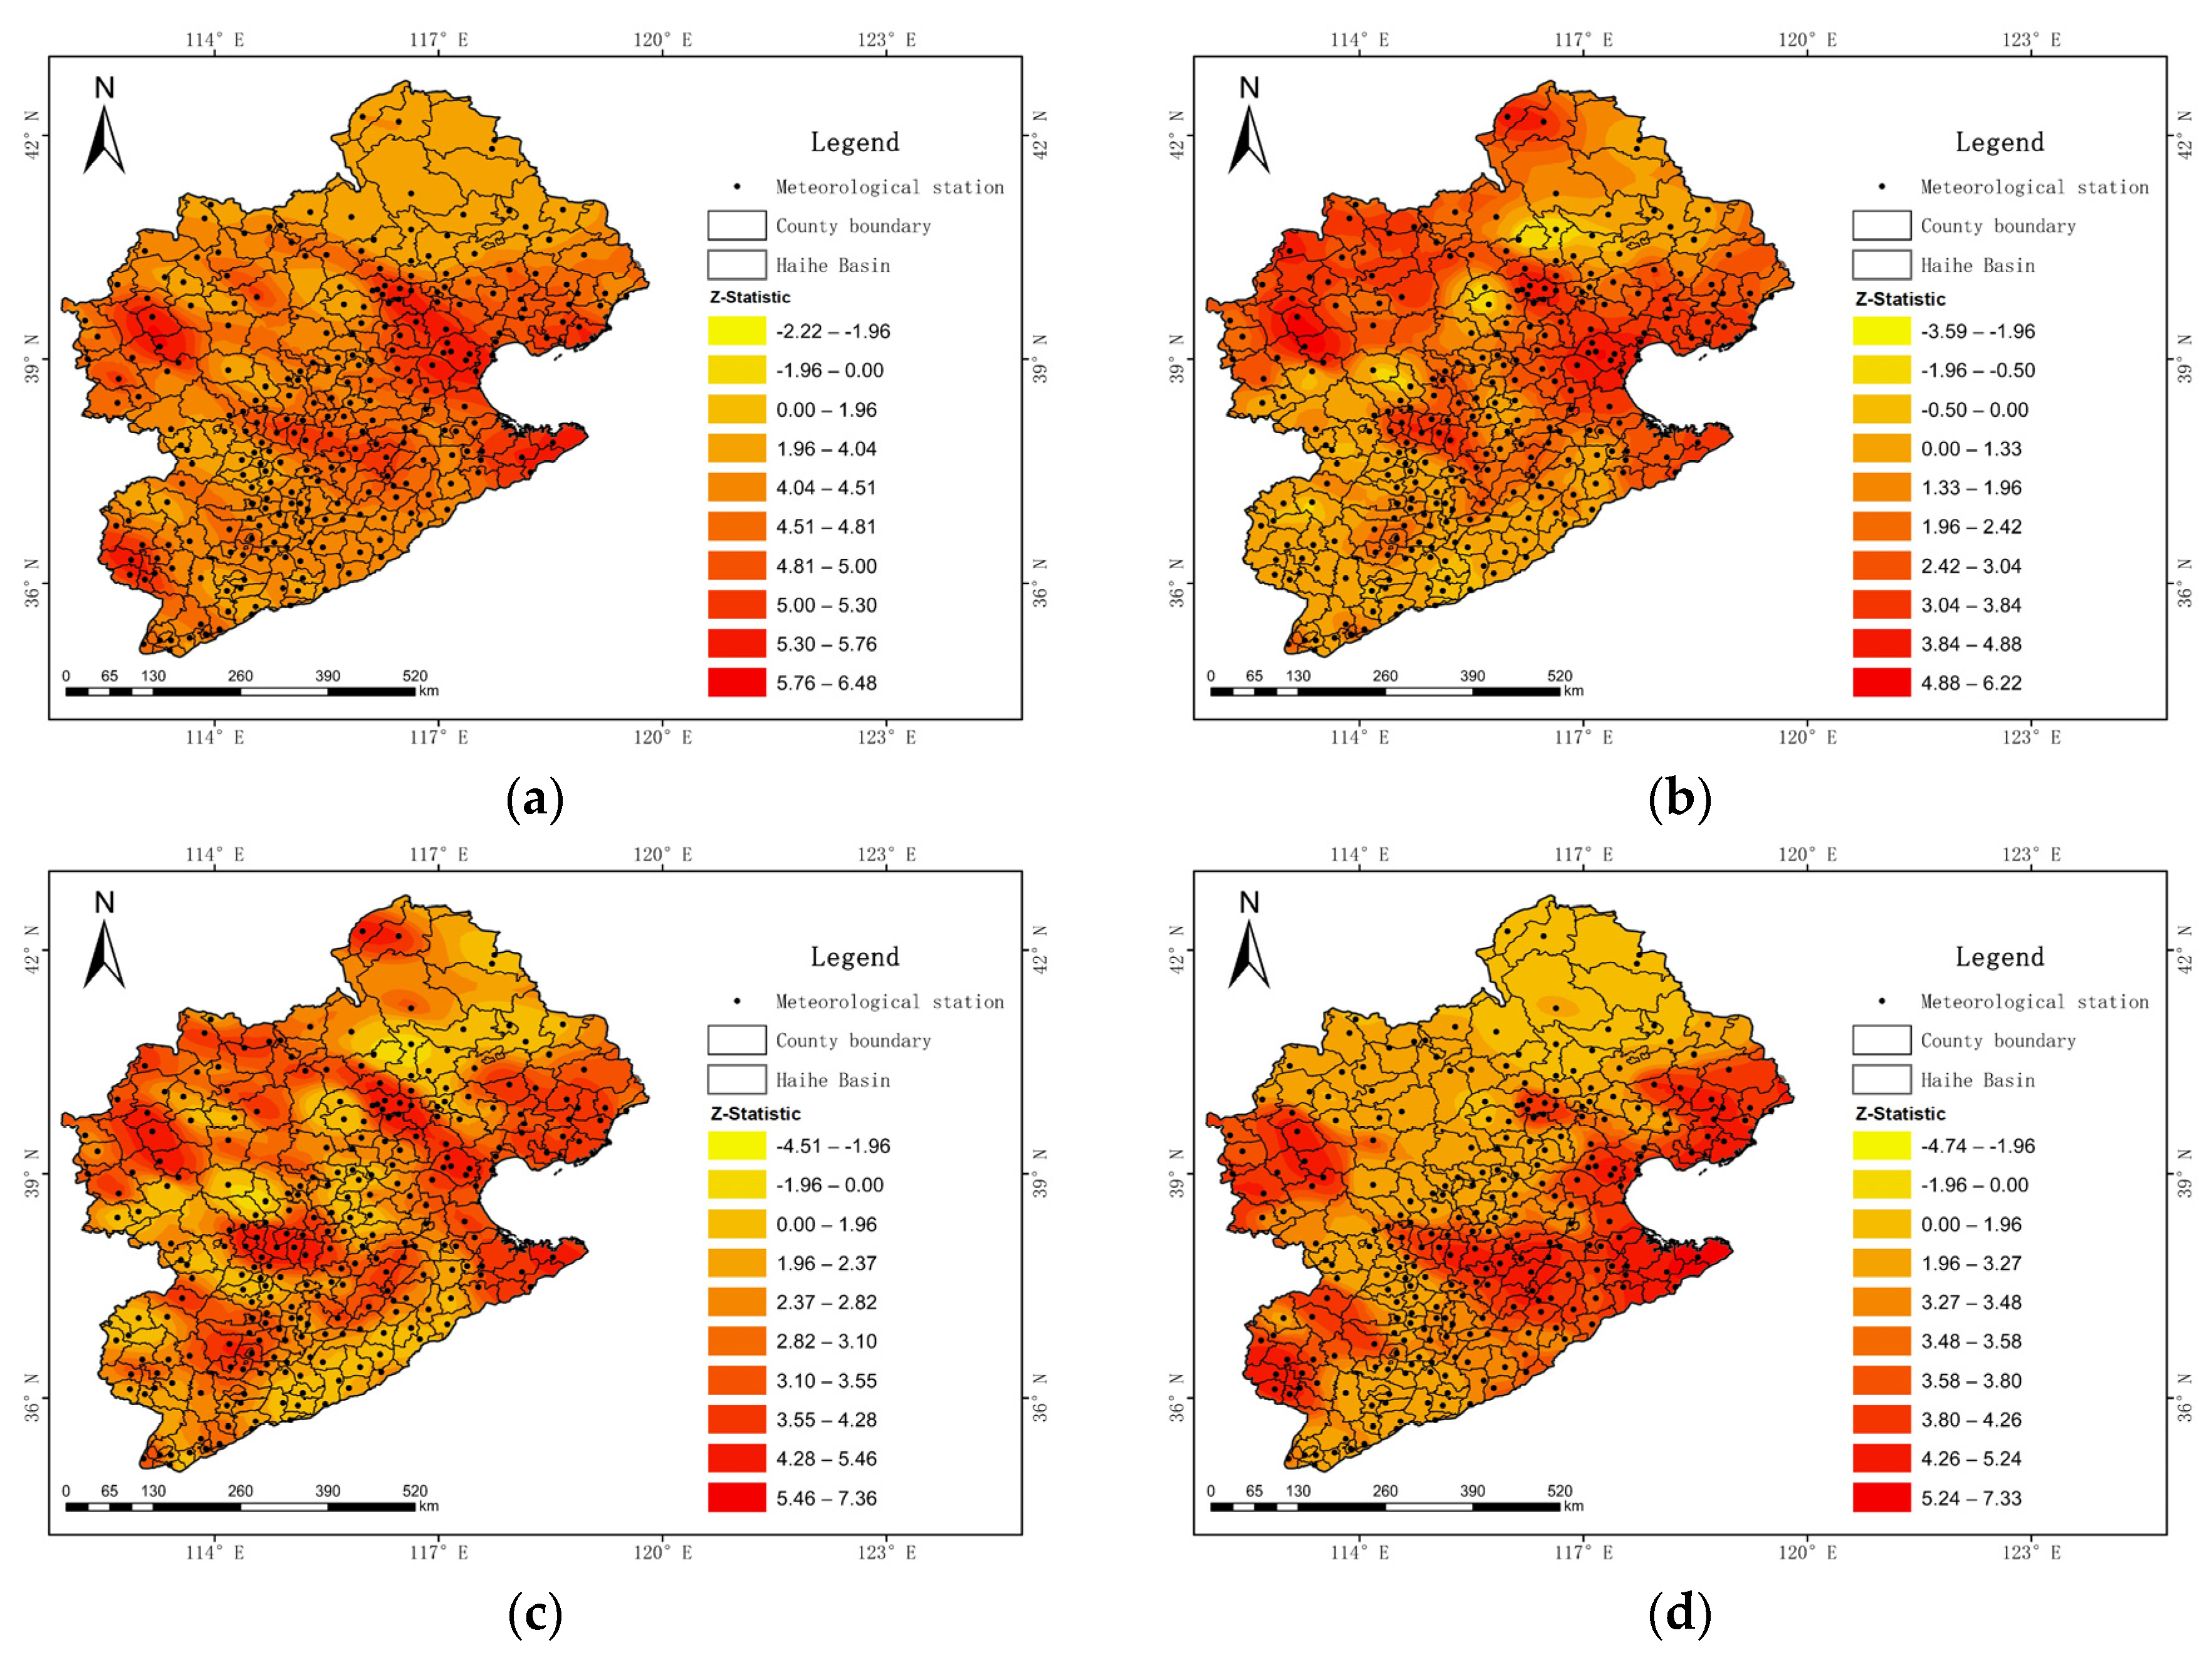
3.1.2. Analysis of Average Temperature Changes for Different Seasons

The Mann–Kendall test results showed that the average spring temperature of the different regions in the Haihe River Basin over the 1960–2020 period showed an increasing trend at 256 stations (i.e., 99.2% of all the selected stations). Among these, the increasing trend was significant at 252 stations; only two stations showed a decreasing temperature trend, with the trend being significant.
The average summer temperature at 231 stations (i.e., 89.5% of all the selected stations) showed an increasing trend. Among these, the increasing trend, characterized by dramatic changes, was significant at 130 stations, while 27 stations (10.5% of all the selected stations) showed a decreasing trend. Among these, the decreasing trend was significant at six stations.
The average autumn temperature at 245 stations (95% of all the selected stations) showed an increasing trend. Among these, the increasing trend, which was characterized by drastic changes, was significant at 173 stations. Conversely, 13 stations (5% of all the selected stations) showed a decreasing trend, with the trend being significant at only three stations.
For the average winter temperature, 247 stations (95.7% of all the selected stations) showed an increasing trend, with the trend, characterized by drastic changes, being significant at 211 stations. Conversely, 11 stations (4.3% of all the selected stations) showed a decreasing trend, with the trend showing significance at four stations.
Considering Figure 4, which shows the spatial distribution of the significance of the mean temperature for different seasons, the average temperature for different seasons in the Haihe River Basin presented an overall significant increasing trend; however, differences also existed among the different regions of this river basin. Specifically, the temperature in the eastern and western regions of this river basin showed significant increasing seasonal change trends.
In particular, in spring, the changes in the eastern, central, western, and southwestern regions of the Haihe River Basin were the most dramatic and showed consistency with the annual mean temperature variation trend. In summer, the changes in the northern high latitude areas, as well as eastern, central, and northwestern regions of the Haihe River Basin were identified as the most intense, while those in the southern region were slightly gentle. In autumn, the temperature changes were scattered, while those in the eastern, western, central, and northwestern regions were the most dramatic. Furthermore, the most obvious increase in temperature in the Haihe River Basin was observed in winter, and the changes were most dramatic in the eastern, central, western, and southwest regions of the river basin.
Therefore, in general, the temperature in the Haihe River Basin is increasing; spatial and temporal differences in the degree of increase also exist. In the eastern region, the changes show a significant increasing trend, whereas, in the northern high latitude areas, a significant increasing trend occurs in summer and autumn. However, the increase in temperature in autumn was chaotic, while that in winter was the most obvious. Tian et al. [51] reported that, before the 1990s, there was a general increase in the temperature of the Haihe River Basin, which thereafter, showed a more obvious fluctuating trend. In each season, the northeast, north, and west regions of the basin showed a significant increasing trend, while the southeast, mid, and southwest regions of the basin showed a decreasing trend in summer, and in other seasons, increasing trends were observed. The results reported by Hao et al. [52] also revealed that the temperature in the Haihe River Basin presented an increasing trend, with drastic changes especially in spring and winter. Basically, the analysis results obtained in this study are consistent with previously reported results.

3.2. Precipitation Trend Analysis and Significance

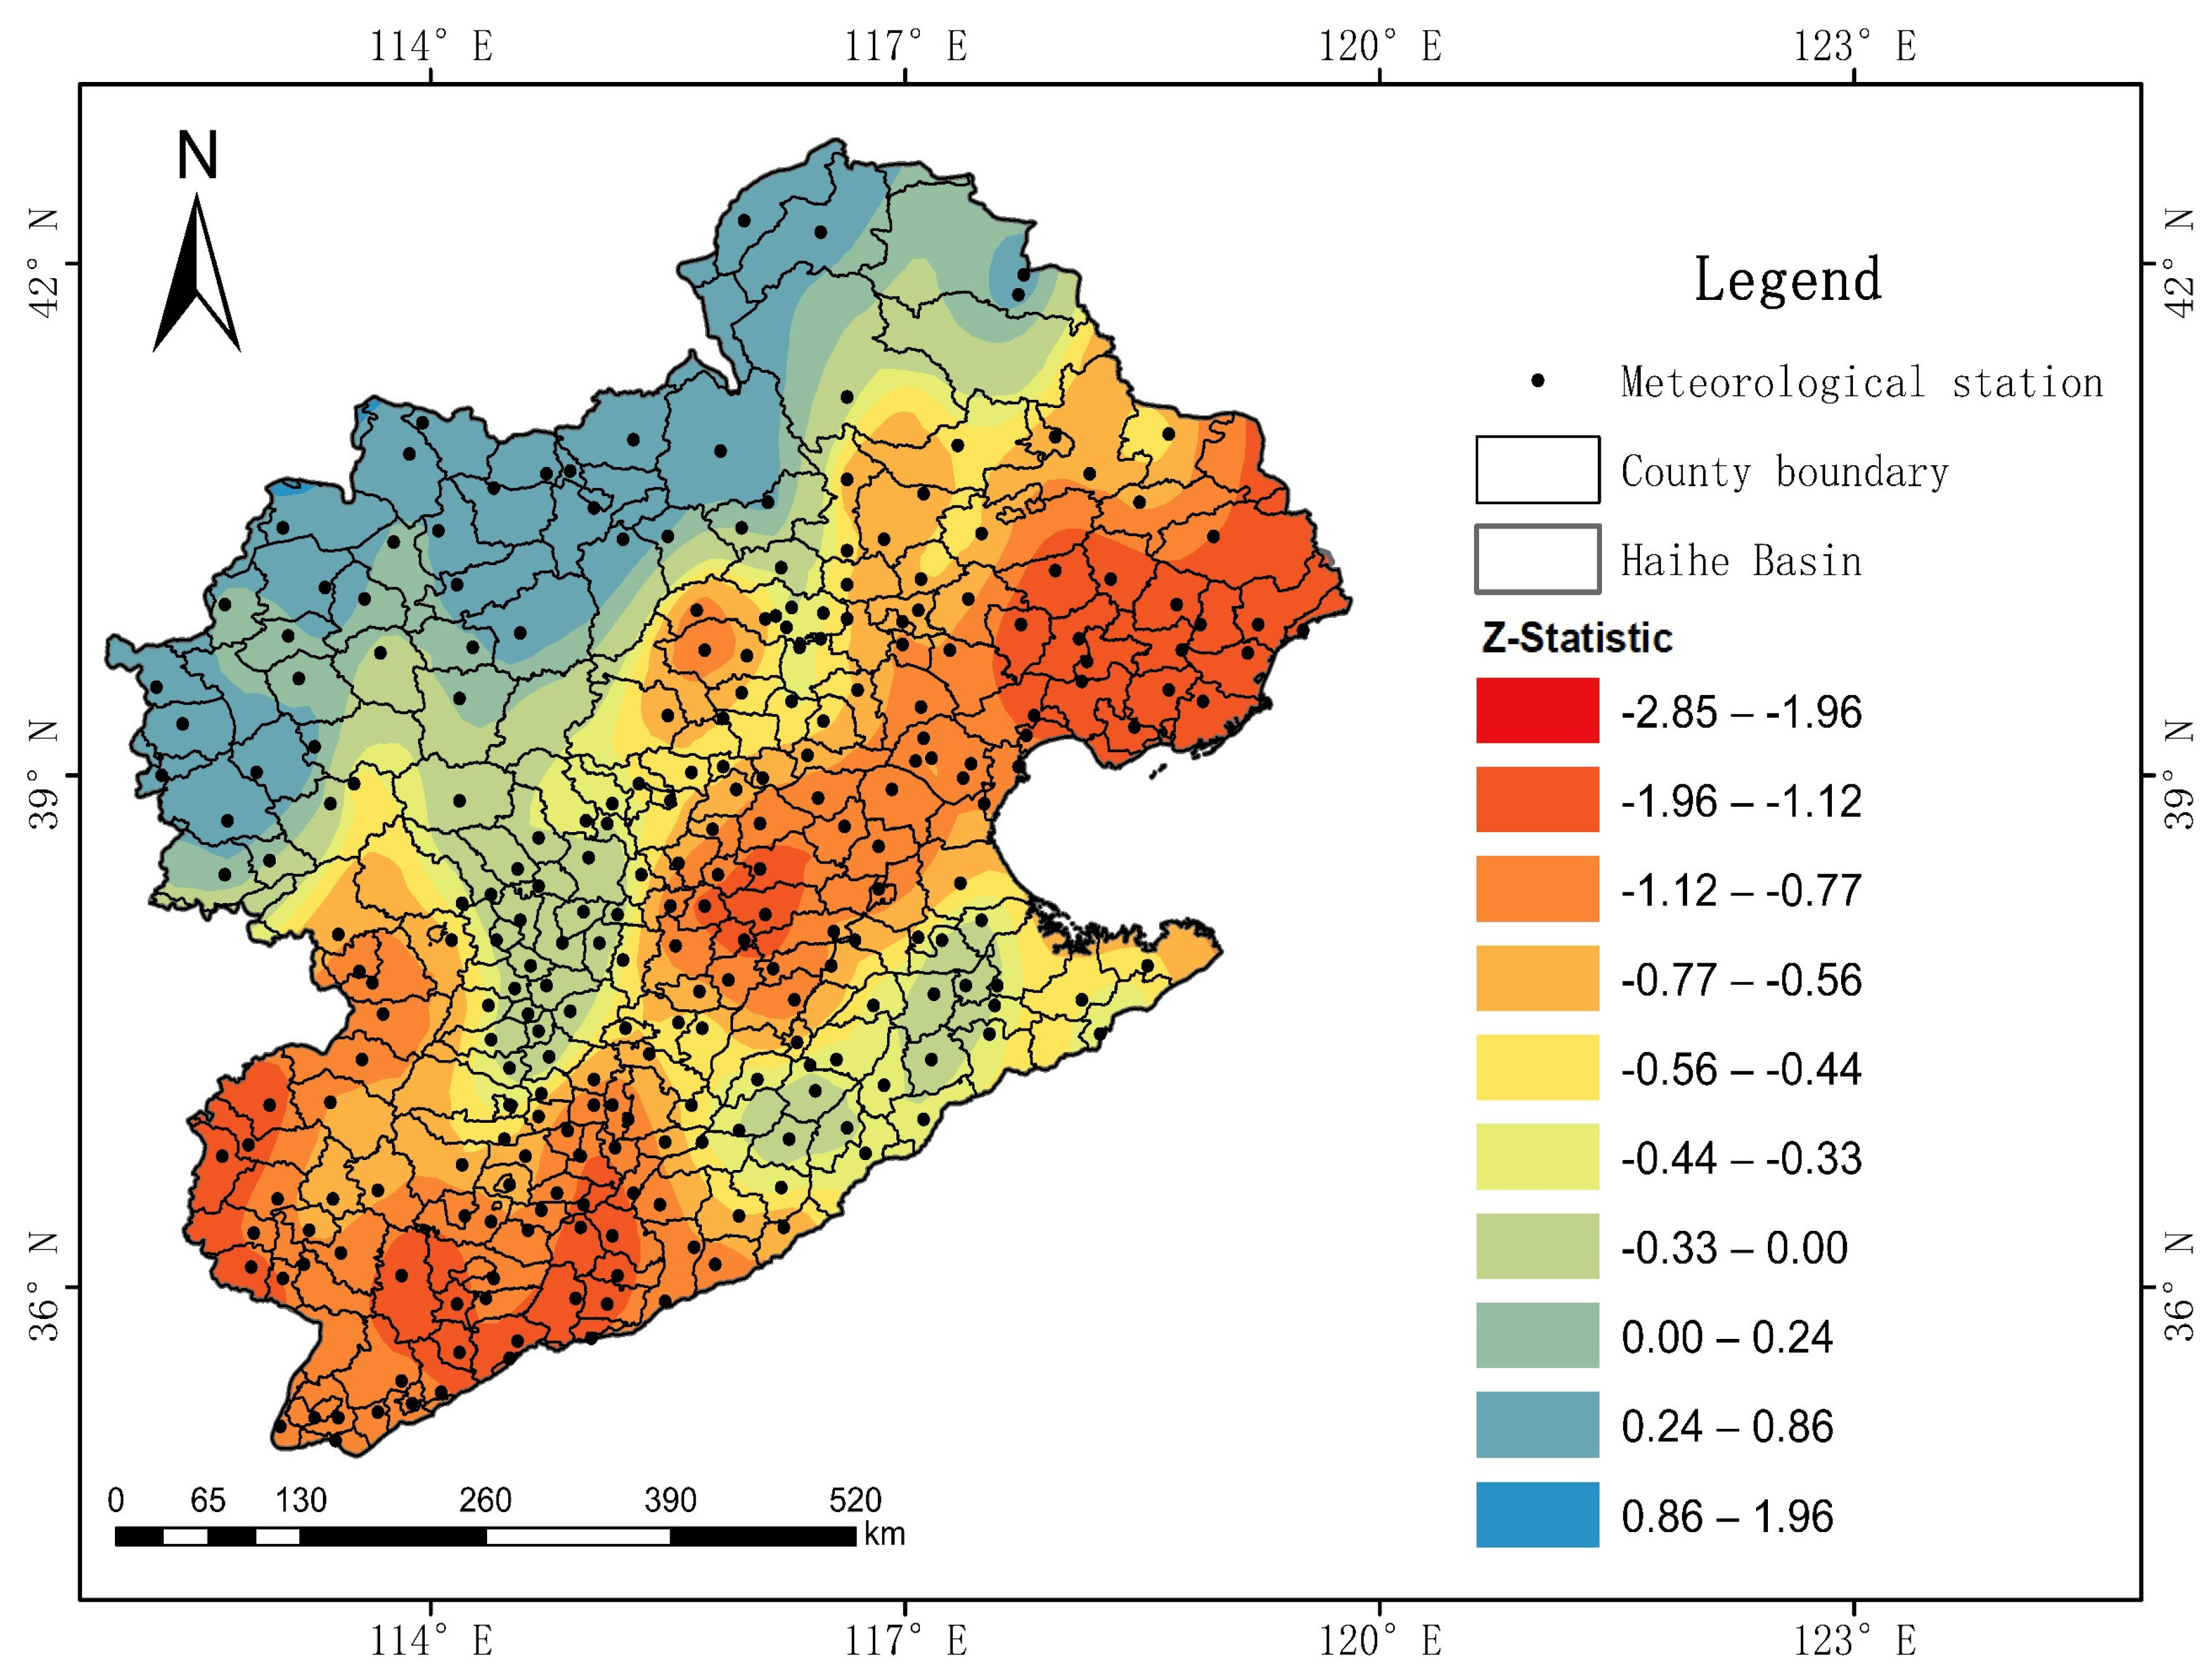
3.2.1. Analysis of Annual Precipitation Changes

According to the Mann–Kendall test results on the annual precipitation changes for the 1960–2020 period, 223 stations (i.e., 86.4% of all the selected stations) showed a decreasing trend in annual precipitation, with the decreasing trend showing significance only at 12 stations. Conversely, 35 stations (13.6% of all the selected stations) showed an increasing trend, with the increase showing significance at only one of the stations.
Generally, the annual precipitation in the Haihe River Basin showed a decreasing trend. However, an increasing trend was observed only in the north and northwest regions of the basin. The overall change in annual precipitation was relatively gentle, showing a significant downward trend only in some parts of the northeast and southwest regions of the basin (Figure 5).

3.2.2. Analysis of Precipitation Changes for Different Seasons

The Mann–Kendall test was performed to determine the precipitation trends for different seasons in the Haihe River Basin over the 1960–2020 period. Thus, it was observed that the precipitation in spring showed an overall increasing trend, while that in autumn showed an overall decreasing trend. Further, the regions with increasing and decreasing trends in summer and winter were similar. Table 2 shows the variations of precipitation trends for different seasons in the Haihe River Basin.
Spring precipitation in the Haihe River Basin showed an increasing trend in the northern, northwestern, central, and southern regions of the river basin, but the change trends were not significant. In some parts of the east, southwest, and south regions, precipitation showed a decreasing trend; however, the change trend was not significant (Figure 6a).
Furthermore, summer precipitation in the Haihe River Basin showed an increasing trend in the north, northwest, part of the west, and part of the southwest regions of the river basin; however, the change trend was not significant. Conversely, a decreasing trend was observed in the eastern, southeastern, and southern regions of the river basin, and similarly, the change trend was not significant (Figure 6b).
Autumn precipitation showed an increasing trend in parts of the central, northern, western, and southeastern regions of the river basin; however, the change trend was not significant. In some parts of the central, southwest, eastern, and northern regions of the river basin, a decreasing precipitation trend was also observed, with the change being significant in some parts of the southwest region of the basin (Figure 6c).
The north and south regions of the Haihe River Basin showed significant differences in winter precipitation. Specifically, in part of the northeast and northwest regions, and northern high latitude areas of the river basin, the increasing trend was not significant. Additionally, in the western, southeast, and part of the southwest regions of the river basin, a decreasing trend was observed. However, the change trend was not significant (Figure 6d).
Therefore, precipitation in the Haihe River Basin showed an overall decreasing trend; however, an increasing trend was observed in the northern high latitude areas. In spring, there was an overall increasing trend, even though some parts of the east, southwest, and south regions of the basin showed only a decreasing trend. In summer, there was a significant difference between the eastern and western regions, which showed decreasing and increasing trends, respectively. In autumn, there was a decreasing trend in the northeast and southwest regions of the basin, similar to the annual mean precipitation trend, and in winter, the difference between the north and south regions of the basin was obvious, and the northern high latitude areas showed a predominantly increasing trend. Lei Zou et al. [53] reported that annual precipitation in the Haihe River Basin showed a decreasing trend over the 1961–2018 period, with the spatial differences in seasonal precipitation trends being significant; the spatial variation of summer precipitation was similar to that of the annual precipitation, while the spatial distributions of spring and autumn precipitation were similar. Furthermore, He et al. [54] pointed out that the spatial variation of summer precipitation varied in a clockwise manner from the northeast to the east and south, and then to the east and middle regions of the basin. Meizheng Shu et al. [55] analyzed 51-year (1960–2010) precipitation data for the Haihe River Basin and observed a decreasing trend, as well as an uneven distribution of the annual precipitation with obvious seasonality, which gradually decreased spatially from south to north. These findings are consistent with the above research results.

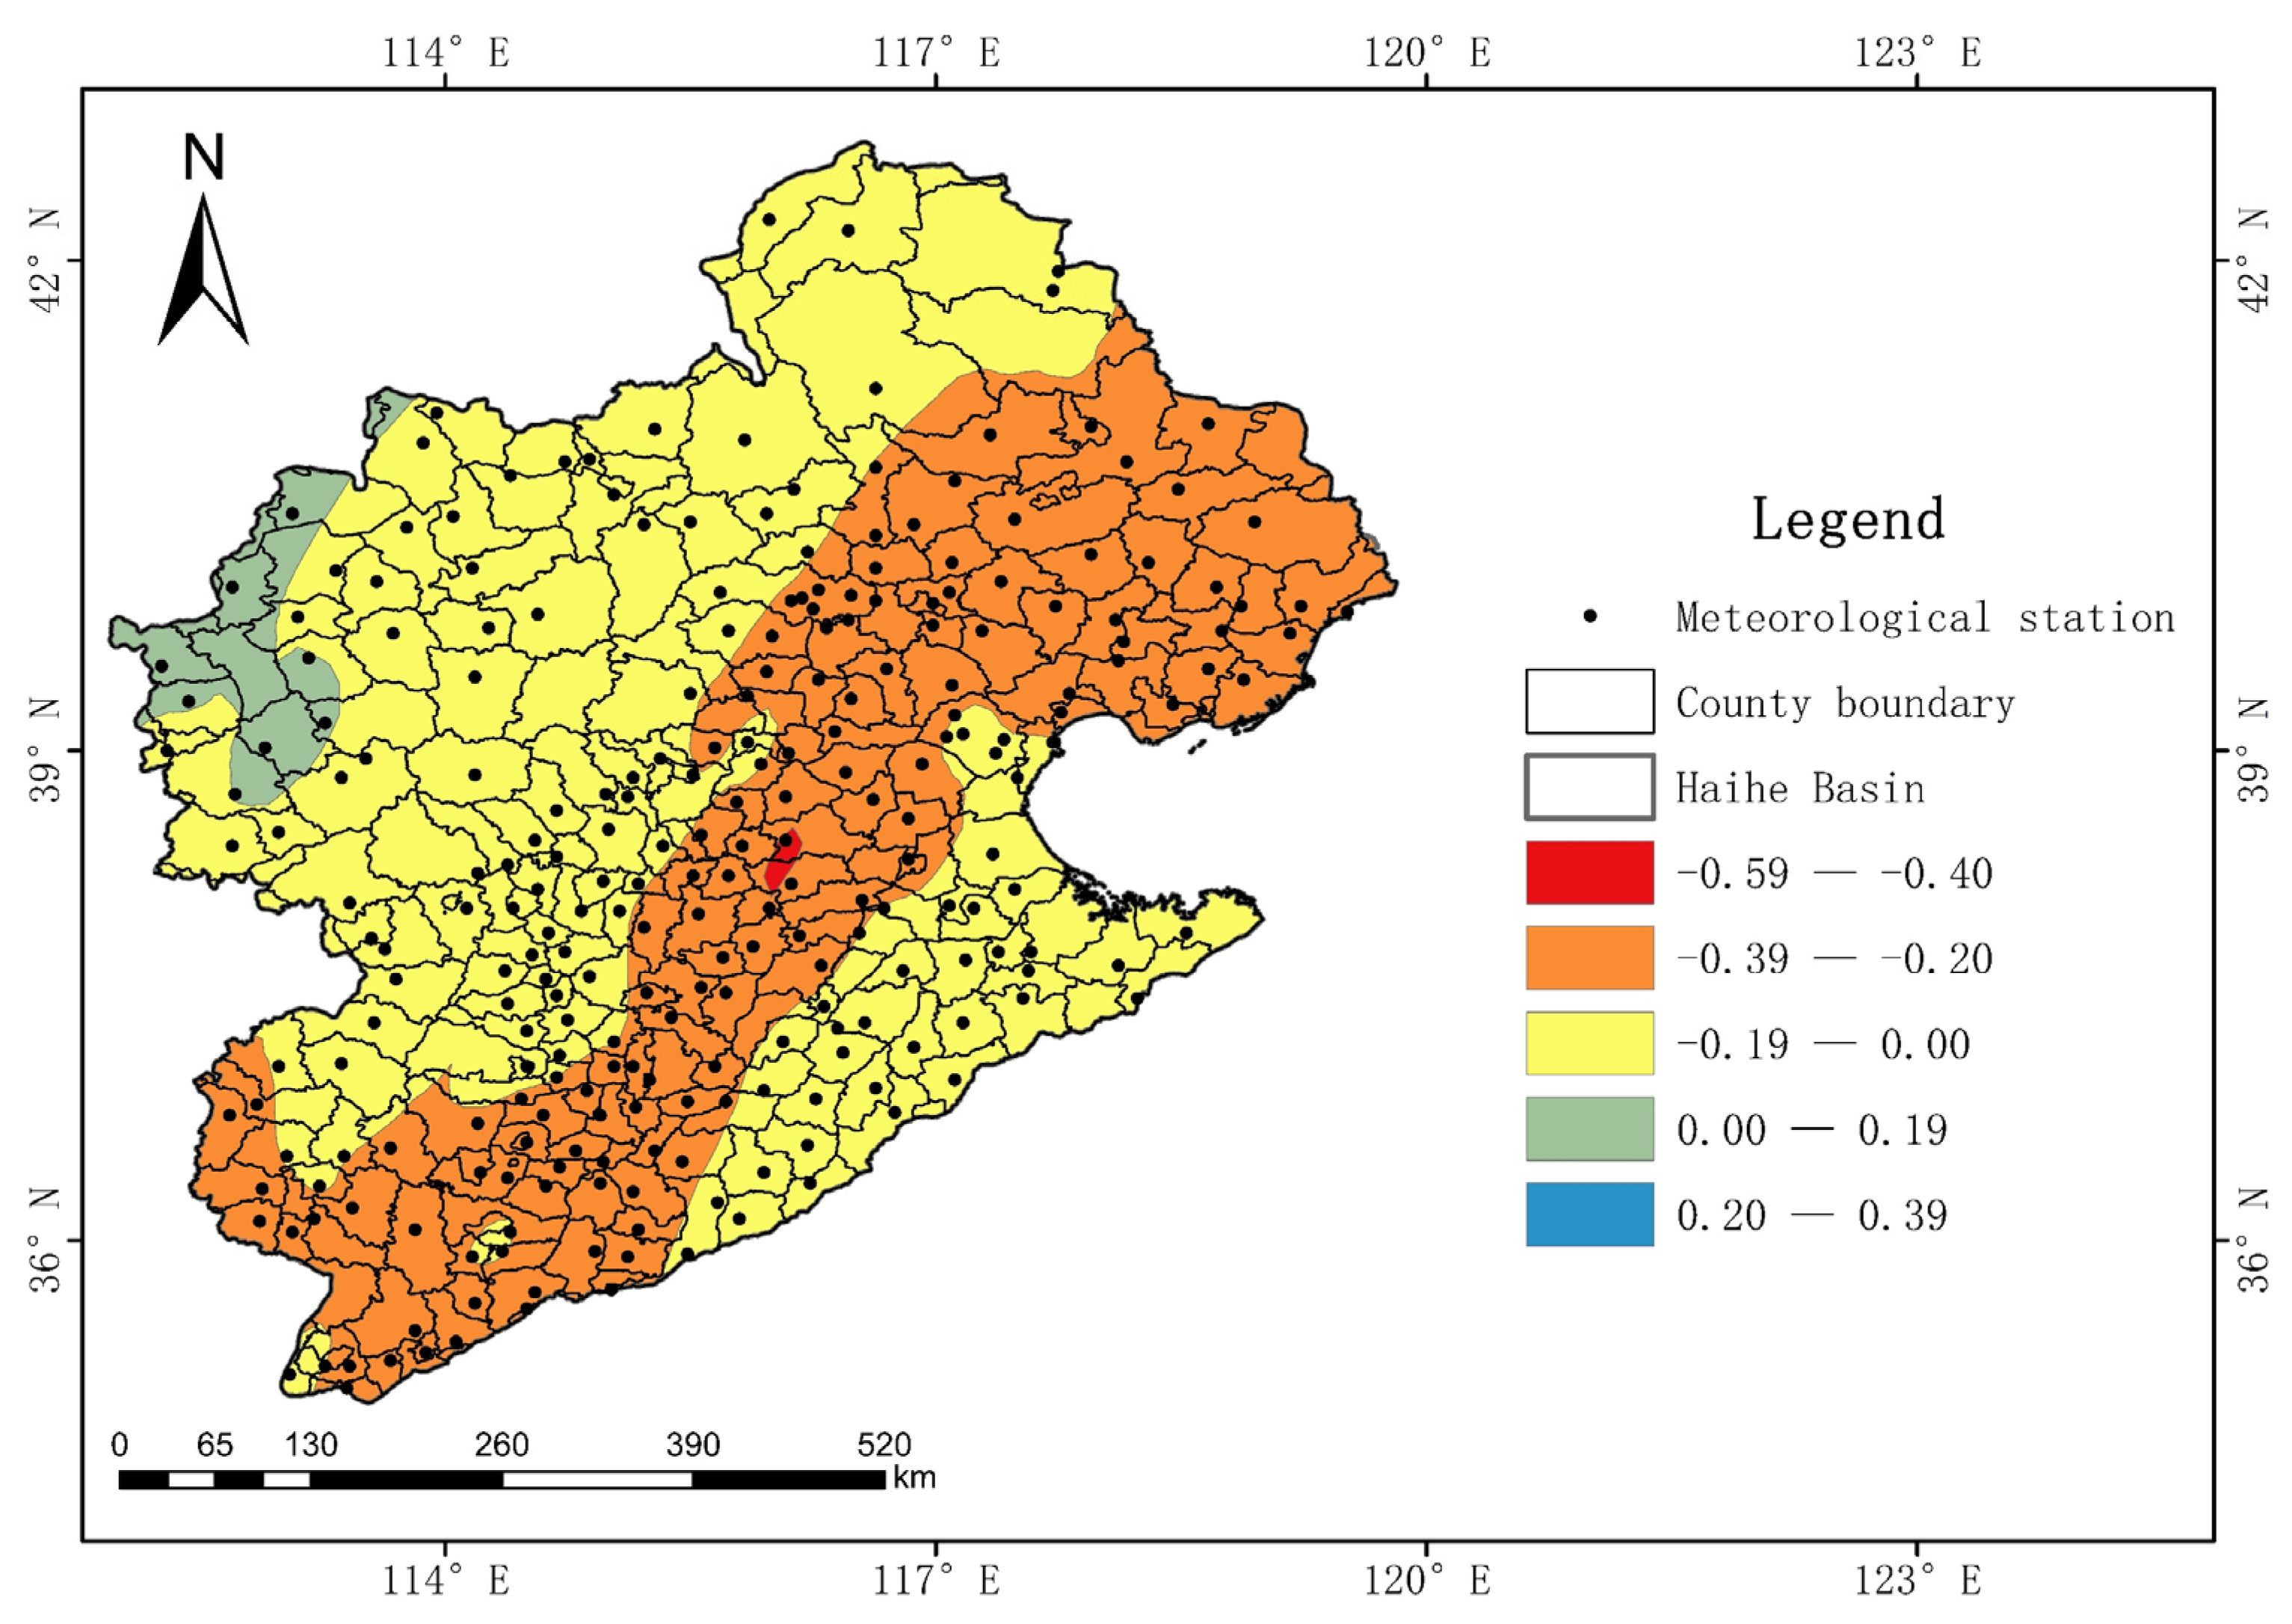
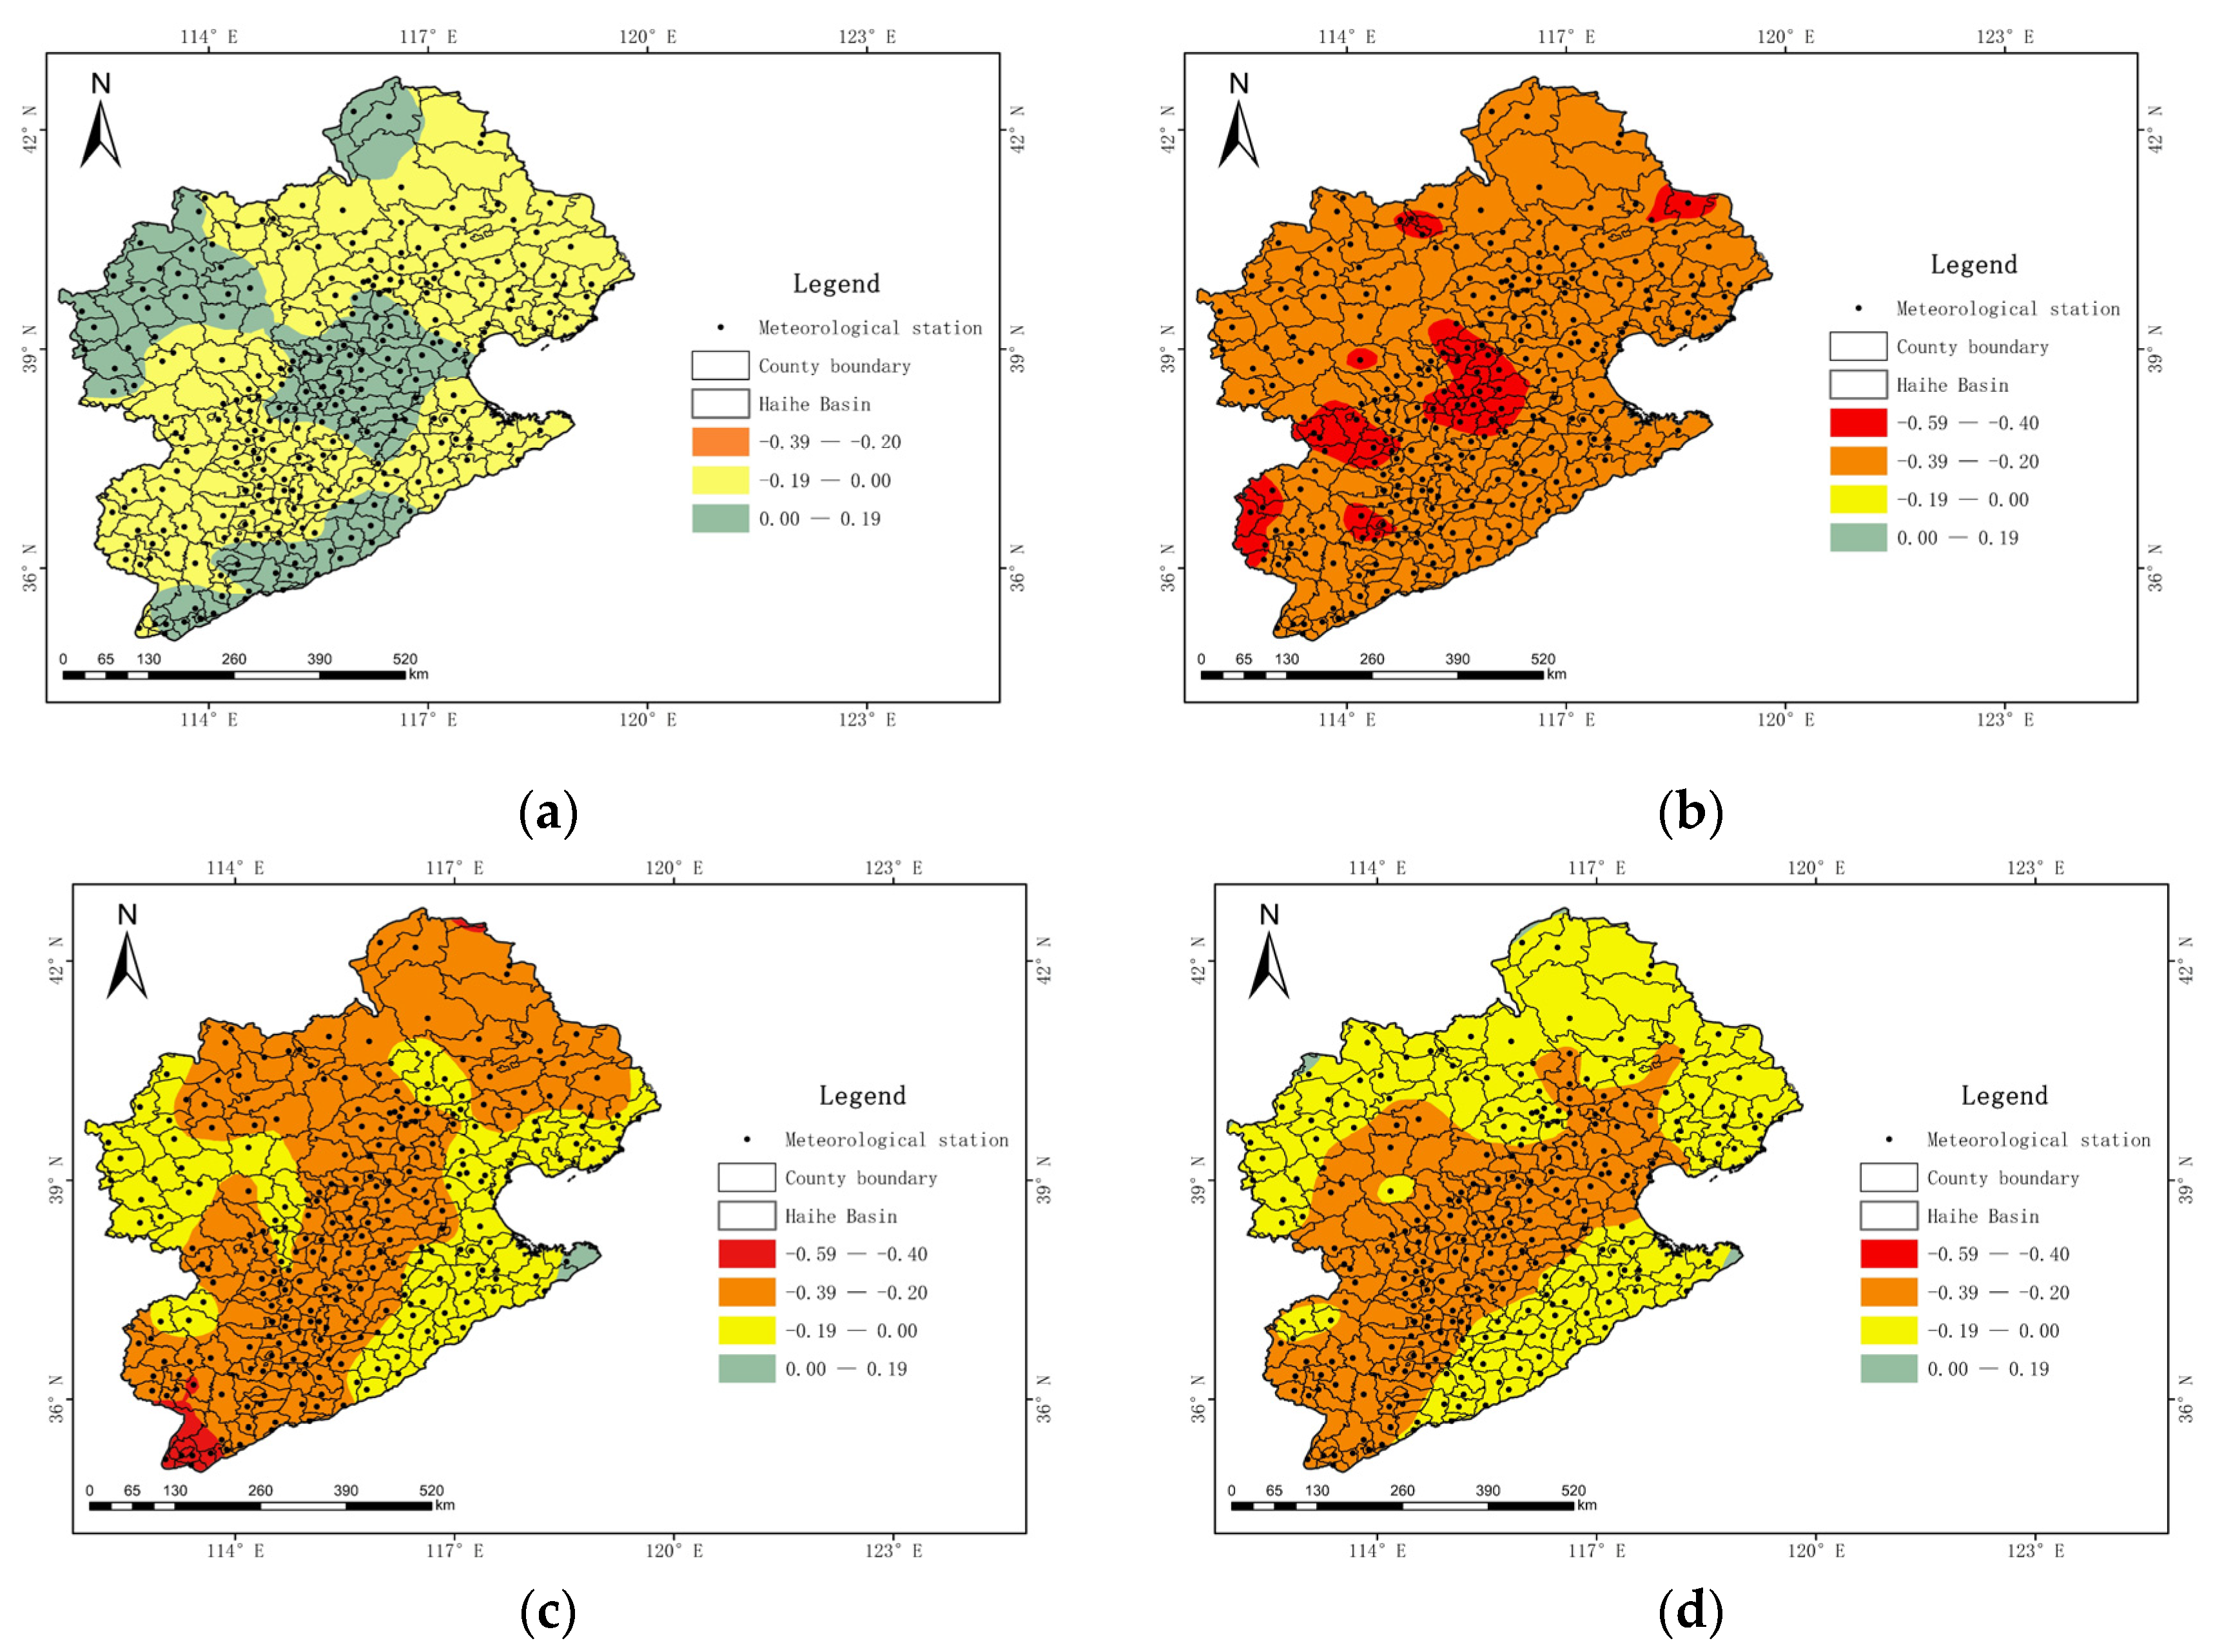
3.3. Spearman’s Correlation Analysis Results

By analyzing and calculating the p-values corresponding to each station, it was possible to clearly determine the level of correlation between precipitation and temperature at both interannual and interseasonal scales. After determination, the correlation coefficients were subjected to grade analysis; the results obtained are shown in Table 3.

3.3.1. Analysis of the Correlation between Annual Mean Temperature and Annual Precipitation

From Table 3, it is evident that 228 stations in the Haihe River Basin (i.e., 92.2% of all the selected stations) showed negative correlations between annual mean temperature and annual precipitation, with 111, 117, and 10 stations showing weak, low, and moderate negative correlations, respectively. Seventeen stations (6.6% of all the selected stations) showed positive correlations, with 16 stations exhibiting weak positive correlation and one station exhibiting low positive correlation. Additionally, only three stations (1.2% of the total number of stations) showed no correlations. In general, the correlation between annual mean temperature and annual precipitation in the Haihe River Basin was negative.
According to the spatial distribution of the Spearman’s correlation coefficients at an interannual scale shown in Figure 7, the distribution of the correlations between annual mean temperature and annual precipitation in the Haihe River Basin was relatively concentrated. A low negative correlation was observed in the continuous zone from the northeast to the southwest regions of the basin, a weak negative correlation was observed in the southeast, west, and northwest regions of the basin, and a weak positive correlation appeared only in some parts of the west region of the basin.

3.3.2. Analysis of the Correlation between Mean Temperature and Precipitation for Different Seasons

A negative correlation was observed between mean temperature and precipitation in the Haihe River Basin for the spring, summer, autumn, and winter seasons (Figure 8). Specifically, in spring, 156 stations (i.e., 60.4% of the total number of stations) showed negative correlations, with 145 and 11 stations showing weak and low negative correlations, respectively. Conversely, it was observed that 90 stations (34.9% of the total number of stations) showed weak positive correlations and 12 stations (4.7% of the total number of stations) showed unrelated correlation between temperature and precipitation. In summer, negative correlations were observed at 257 stations (i.e., 99.6% of the total number of stations), with 15, 167, and 75 stations showing weak, low, and moderate negative correlations, respectively. In this season, only one station (i.e., 0.4% of the total number of stations) showed a positive correlation, i.e., a weak positive correlation. Additionally, in autumn, 11 stations (i.e., 4.3% of the total number of stations) showed positive correlations, all of which were weak positive correlations. Conversely, negative correlations were observed at 246 stations (i.e., 95.3% of the total number of stations), with 84, 141, and 21 stations showing weak, low, and moderate negative correlations, respectively. There was only one station (i.e., 0.4% of the total number of stations) that showed no correlation in this season. In winter, negative correlations were observed at 254 stations (i.e., 98.4% of the total number of stations), with 116, 132, and 6 stations showing weak, low, and moderate negative correlations, respectively. Three stations (i.e., 1.2% of the total number of stations) showed positive correlation, all of which were weak positive correlations. There was only one station (i.e., 0.4% of the total number of stations) that showed no correlation in this season.
In terms of spatial distribution, although generally a negative correlation was observed between average temperature and precipitation for different seasons in the Haihe River Basin, the Spearman’s correlation coefficients corresponding to these different seasons were significantly different. Specifically, in spring, a weak negative correlation was observed in the north, central south, and east regions of the Haihe River Basin, while a weak positive correlation was observed in other regions; in summer, the entire Haihe River Basin showed a low negative correlation and a moderate negative correlation was observed only in the central, southwest, and northeast regions; in autumn, the zonal distribution region from northeast to southwest showed a low negative correlation, the eastern and western regions showed a weak negative correlation, and the southwest region showed a moderate negative correlation; in winter, the middle and southwest contiguous areas of the river basin showed a low degree of negative correlation, while the other areas showed a weak negative correlation. Areas showing weak positive correlations were sporadically distributed.

4. Conclusions

In this study, the Mann–Kendall test was used to analyze the trends of temperature and precipitation variation at interannual and interseasonal scales as well as their significance in the Haihe River Basin. In addition, the Spearman’s correlation analysis was used to determine the degree of correlation between these two climate parameters. The following conclusions were drawn:
(1) Annual and seasonal mean temperatures in the Haihe River Basin showed an increasing trend, with over 90% of the selected stations showing a significant increasing trend, which was more significant in spring than in other seasons. However, the degree of temperature change was affected by the geographical location, i.e., the spatial differences in temperature variation were significant, with the temperature changes in the eastern and western regions of the Haihe River Basin showing high consistency with the interannual and interseasonal variations, with a significant increasing trend. Although other regions showed slightly different results for different seasons, an overall increasing trend was still evident.
(2) Basically, annual precipitation in the Haihe River Basin showed a decreasing trend and also showed an increasing trend in some areas. Specifically, the stations showing increasing trends were predominantly concentrated in the northern region of the river basin, and the spatial changes in precipitation corresponding to different seasons were more complex, with the overall precipitation changes in spring and autumn showing an increasing trend. The ratio of increasing and decreasing trends in summer was approximately 1:1, and the overall precipitation changes in winter showed a decreasing trend.
(3) The Spearman’s correlation analysis was used to determine the degree of correlation between mean temperature and precipitation at both interannual and interseasonal scales. Except for a few positive correlations or non-correlation areas that were sporadically distributed, in general, in the Haihe River Basin, temperature and precipitation showed a negative correlation at both interannual and interseasonal scales; however, the correlation was weak. There were only approximately 30% of the area that showed a strong correlation in summer.

Author Contributions

Conceptualization, Y.H. and B.L.; methodology, Y.H., D.X. and S.L.; validation, Y.C., Y.H., Z.X., B.S., J.S. and S.L.; data curation, C.Y., Y.X., Y.H., Z.X., J.S. and S.L.; writing—original draft preparation, Y.H.; writing—review and editing, B.L. and D.X. All authors have read and agreed to the published version of the manuscript.

Funding

This research was funded by the National Water Pollution Control and Management Science and Technology Major Project of China, grant number 2014ZX07203-008.

Institutional Review Board Statement

Not applicable.

Informed Consent Statement

Not applicable.

Data Availability Statement

All data used during the study are proprietary or confidential and may only be provided with restrictions.

Acknowledgments

The authors are also thankful for support from the Hebei University of Engineering, and Editage (www.editage.cn) for English language editing.

Conflicts of Interest

The authors declare no conflict of interest.

References

  1. Zhang, L.; Chen, X.; Zhao, Z.; Hu, Z. Progress in Study Change Impacts on Hydrology and Water Resources. Prog. Geogr. 2008, 3, 60–67. [Google Scholar]
  2. IPCC. The Physical Science Basis.Contribution of Working Group I to the Fifth Assessment Report of the Intergovernmental Panel on Climate Change; Cambridge University Press: Cambridge, UK; New York, NY, USA, 2013. [Google Scholar]
  3. Held, I.M.; Soden, B.J. Robust Responses of the Hydrological Cycle to Global Warming. J. Clim. 2006, 19, 5686–5699. [Google Scholar] [CrossRef]
  4. Allen, M.R.; Ingram, W.J. Constraints on Future Changes in Climate and the Hydrologic Cycle. Nature 2002, 419, 224–232. [Google Scholar] [CrossRef]
  5. Dore, M.H.I. Climate Change and Changes in Global Precipitation Patterns: What Do We Know? Environ. Int. 2005, 31, 1167–1181. [Google Scholar] [CrossRef]
  6. Hsu, P.C.; Li, T.; Wang, B. Trends in Global Monsoon Area and Precipitation over the Past 30 Years. Geophys. Res. Lett. 2011, 38. [Google Scholar] [CrossRef] [Green Version]
  7. Greve, P.; Orlowsky, B.; Mueller, B.; Sheffield, J.; Reichstein, M.; Seneviratne, S.I. Global Assessment of Trends in Wetting and Drying over Land. Nat. Geosci. 2014, 7, 716–721. [Google Scholar] [CrossRef]
  8. Xu, D.; Li, J.; Zhou, Z.; Liu, J.; Yan, Z.; Wang, D. Study on the Spatial and Temporal Distribution of Precipitation Characteristics in China from 1956 to 2018. Water Resour. Hydropower Eng. 2020, 51, 20–27. [Google Scholar]
  9. Chen, J.; Liu, Y.; Pan, T.; Wu, S.; Tan, Q.; Ge, Q.; Liu, Y. Spatiotemporal Variation of Precipitation in China and Its Impact on Surface Dry-Wet Conditions During 1961–2010. J. Nat. Resour. 2019, 34, 2440–2453. [Google Scholar]
  10. Xu, X.; Zhang, X.; Dai, E.; Song, W. Research of Trend Variability of Precipitation Intensity and Their Contribution to Precipitation in China from 1961 to 2010. Geogr. Res. 2014, 33, 1335–1347. [Google Scholar]
  11. Wu, Y.; Wu, S.; Wen, J.; Xu, M.; Tan, J. Changing Characteristics of Precipitation in China During 1960–2012. Int. J. Climatol. 2016, 36, 1387–1402. [Google Scholar] [CrossRef]
  12. Wang, F.; Yang, S.; Wayne, H.; Li, Q.; Zuo, Z. Long-Term Changes in Total and Extreme Precipitation over China and the United States and Their Links to Oceanic–Atmospheric Features. Int. J. Climatol. 2014, 34, 286–302. [Google Scholar] [CrossRef]
  13. Liu, K.; Nie, G.; Zhang, S. Study on the Spatiotemporal Evolution of Temperature and Precipitation in China from 1951 to 2018. Adv. Earth Sci. 2020, 35, 1113–1126. [Google Scholar]
  14. Zhao, D.; Gao, X.; Wu, S.; Zheng, D. Trend of Climate Variation in China 1960 to 2018 Based on Natural Regionalization. Adv. Earth Sci. 2020, 35, 750–760. [Google Scholar]
  15. Fischer, T.; Gemmer, M.; Lüliu, L.; Buda, S. Temperature and Precipitation Trends and Dryness/Wetness Pattern in the Zhujiang River Basin, South China, 1961–2007. Quat. Int. 2011, 244, 138–148. [Google Scholar] [CrossRef]
  16. Chen, T.; Ao, T.; Li, X. Temporal and Spatial Variation of Air Water Resources in the Yangtze River Basin in Recent Seventy Years. China Rural Water Hydropower 2019, 5, 6–11. [Google Scholar]
  17. Li, J.; He, X.; Hu, S. Multi-Time Scale Stochastic Characteristics and Regionalization of Monthly Precipitation in the Yangtze River Basin. Resour. Environ. Yangtze Basin 2021, 30, 111–121. [Google Scholar]
  18. Tan, Y.; Qiu, X.; Zeng, Y.; Shi, G. Variation Trend of Precipitation in Different River Basins in Recent 50 Years. J. Meteorol. Sci. 2016, 36, 494–501. [Google Scholar]
  19. Wang, K.; Qian, M.; Xu, S.; Liang, S.; Chen, H.; Hu, Y.; Su, C.; Zhao, M.; Li, W.; Wang, J. Impacts of Climate Change on Water Resources in the Huaihe River Basin. MATEC Web Conf. 2018, 246, 01090. [Google Scholar]
  20. Yu, Z.; Song, Y.; Wei, J.; Hu, S.; Xux, Q. The 70 Years’ Governance Process of Haihe River [J/OL]. Res. Environ. Sci. Res. 2021, 1–16. [Google Scholar] [CrossRef]
  21. Ren, X.; Hu, Z.; Cao, Y.; He, S. Evaluation of Water Resources in the Haihe River Basin; China Water & Power Press: Beijing, China, 2004; pp. 21–35. (In Chinese) [Google Scholar]
  22. Wang, L.; Zhu, H.; Lu, F.; He, L. Characteristics of Temporal and Spatial Variation of Precipitation in Haihe River Basin during Recent 50 Years. Agric. Res. Arid Areas 2012, 30, 242–246. [Google Scholar]
  23. Hao, Z.; Yan, L.; Ju, Q.; Dun, Z. Spatiotemporal Characteristics of Climate Variation in Different Kinds of Landforms of Haihe River Basin. Res. Soil Water Conserv. 2014, 21, 56–60. [Google Scholar]
  24. Liu, B.; Yan, Z.; Sha, J.; Li, S. Drought Evolution Due to Climate Change and Links to Precipitation Intensity in the Haihe River Basin. Water 2017, 9, 878. [Google Scholar] [CrossRef] [Green Version]
  25. Yan, Z.; Wang, S.; Ma, D.; Liu, B.; Lin, H.; Li, S. Meteorological Factors Affecting Pan Evaporation in the Haihe River Basin, China. Water 2019, 11, 317. [Google Scholar] [CrossRef] [Green Version]
  26. Yu, Y.; Yang, Z.; Liu, Y.; Din, D.; Liu, J. Review of Study on Precipitation of Haihe River Basin under Changing Environment. J. China Hydrol. 2010, 30, 32–35. [Google Scholar]
  27. Sun, Y.; Liu, Q.; Li, Q.; Yuan, X. Temporal Variation of Precipitation Characteristics in Haihe Basin during Recent 60 Years. Water Resour. Res. 2019, 8, 117–124. [Google Scholar] [CrossRef]
  28. Yu, L.; Yang, J.; Xu, L.; Hu, G.; Hu, H.; Zhang, T.; Gao, M.; Li, Z. Trend and Drying Characteristics of Haihe River Basin under the Background of Climate Change. J. Jilin Univ. (Earth Sci. Ed.) 2014, 44, 1615–1624. [Google Scholar]
  29. Zhang, J.; Qiao, Q. Influence Mechanism Analysis of Climate Changes on Precipitation of the Haihe River Basin. S. North. Water Transf. Water Sci. Technol. 2009, 7, 77–80. [Google Scholar]
  30. Yan, X.; Zhang, J.; Bao, Z.; Wang, G.; Guan, T. Evolution of Drought and Flood in the Haihe River Basin for the Last 500 Years. Hydro-Sci. Eng. 2020, 4, 17–23. [Google Scholar]
  31. Shao, Y.; Liu, L.; Liu, J.; Wu, J. Frequency Analysis and Its Spatiotemporal Characteristics of Precipitation Extremes in the Haihe River Basin During 1951–2010. Trans. Atmos. Sci. 2020, 43, 381–391. [Google Scholar]
  32. Bao, Z.; Zhang, J.; Yan, X.; Wang, G.; He, R.; Guan, T.; Liu, Y. Quantitative Assessment of the Attribution of Runoff Change Caused by Four Factors in the Haihe River Basin [J/OL]. Adv. Water Sci. 2021, pp. 1–11. Available online: http://kns.cnki.net/kcms/detail/32.1309.P.20201216.1651.004.html (accessed on 16 April 2021).
  33. Jian, H.; Luo, Y.; Xie, D. Precipitation Variation Feature Research Based on Mann-Kendall and Wavelei Analysis—Taking the Shapingba in Chongqing as an Example. J. Southwest China Norm. Univ. (Nat. Sci. Ed.) 2011, 36, 217–222. [Google Scholar]
  34. Kang, S.; Zhang, B.; Liu, J.; Yang, M. Analysis of the Spatiotemporal Distribution of Precipitation in Zhangye City Using Mann-Kendall Method. Resour. Sci. 2009, 31, 501. [Google Scholar]
  35. Kendall, M.G. Rank Correlation Measures; Charles Griffin: London, UK, 1975. [Google Scholar]
  36. Kottegoda, N.T. Stochastic Water Resources Technology; Wiley: New York, NY, USA, 1980; ISBN 978-1-349-03467-3. [Google Scholar]
  37. Burn, D.H.; Hag Elnur, M.A. Detection of Hydrologic Trends and Variability. J. Hydrol. 2002, 255, 107–122. [Google Scholar] [CrossRef]
  38. Abdul Aziz, O.I.; Burn, D.H. Trends and Variability in the Hydrological Regime of the Mackenzie River Basin. J. Hydrol. 2006, 319, 282–294. [Google Scholar] [CrossRef]
  39. Mishra, A.K.; Singh, V.P. Changes in Extreme Precipitation in Texas. J. Geophys. Res. 2010, 115, D14. [Google Scholar] [CrossRef]
  40. Mann, H.B. Non-Parametric Tests against Trend. Econometrica 1945, 13, 245–259. [Google Scholar] [CrossRef]
  41. Liu, Z.; Xu, D.; Wei, X.; Wang, X.; Liang, Z.; Jiang, X. Variation Characteristics of the Precipitation Structure during the Rainy Season in the Beijiang River Basin, China. Trop. Geogr. 2020, 40, 145–153. [Google Scholar]
  42. Dong, Z.; Peng, T.; Dong, X.; Liu, J.; Chang, W.; Lin, Q. Spatiotemporal Variation Characteristics of Extreme Precipitation Events in the Three Gorges Reservoir Area During 1960–2016. J. Water Resour. Water Eng. 2020, 31, 93–101. [Google Scholar]
  43. Fei, L.; Deng, G.; Zhang, H.; Guo, X.; Wang, X. Spatiotemporal Patterns of Precipitation and Drought and Flood Using Z-Index in Democratic People’s Republic of Korea. J. Nat. Resour. 2020, 35, 3051–3063. [Google Scholar]
  44. Tu, Q. Probability Statistics Is Applied to Meteorology; Meteorological Press: Beijing, China, 1984; pp. 222–229. [Google Scholar]
  45. Myers, J.J.; Well, A.D. Research Design and Statistical. Analysis; Lawrence Erlbaum: Abingdon, UK, 2003. [Google Scholar]
  46. Maritz, J.S. Distribution-Free Statistical Methods, 1st ed.; Chapman & Hall: New York, NY, USA, 1981; ISBN 978-0-412-15940-4. [Google Scholar]
  47. Xie, W. Variable Screening Based on Spearman Correlation. Master’s Thesis, Beijing University of Technology, Beijing, China, 2015. [Google Scholar]
  48. Wang, Q.; Feng, S. The Demonstration and Application about Calculating Formula of Spearman Coefficient. J. Shanxi Agric. Univ. (Soc. Sci. Ed.) 1993, 1, 30–33. [Google Scholar]
  49. Tian, T. Analysis of Water Quality Trend of Shuimo River Based on Spearman Rank Coefficient Method. Energy Conserv. Environ. Prot. 2019, 9, 52–53. [Google Scholar]
  50. Spearman’s correlation. Available online: http://www.statstutor.ac.uk/resources/uploaded/spearmans.pdf (accessed on 20 January 2019).
  51. Tian, W. Analysis of Drought and Flood Events Caused by Climate Change in Haihe River Basin. Master’s Thesis, Hebei University of Engineering, HanDan, China, 2018. [Google Scholar]
  52. Hao, C.; Jia, Y.; Gong, J.; Peng, H. Analysis on Characteristics and Rules of Climate Change of Haihe River Basin in Recent 50 Years. J. China Inst. Water Resour. Hydropower Res. 2010, 8, 39–43. [Google Scholar]
  53. Zou, L.; Xia, J.; Zhang, Y.; Qiao, Y. Spatial-Temporal Change Characteristics and Driving Forces of Precipitation in the Haihe River Basin. Water Resour. Prot. 2021, 37, 53–60. [Google Scholar]
  54. He, L.; Cheng, S.; Ma, N.; Guo, J. Intraseasonal Evolution of the Key Areas of Precipitation in the Haihe River Basin and Quantitative Analysis of Its Associated Atmospheric Circulation during Summer. Acta Geogr. Sin. 2020, 75, 41–52. [Google Scholar]
  55. Shu, M.; Liu, L. Spatial and Temporal Variations of Precipitation in Haihe River Basin in Recent 51 Years. S. North. Water Transf. Water Sci. Technol. 2015, 13, 1065–1068. [Google Scholar]
Figure 1. Geographical location map of the Haihe River Basin.
Water 13 01664 g001
Figure 2. Schematic diagram showing selected stations.
Water 13 01664 g002
Figure 3. Spatial distribution of the significance level of annual mean temperature.
Water 13 01664 g003
Figure 4. Spatial distribution of the significance of mean temperatures for different seasons. (a) Spring; (b) summer; (c) autumn; (d) winter.
Water 13 01664 g004
Figure 5. Spatial distribution of the significance of annual precipitation.
Water 13 01664 g005
Figure 6. Spatial distribution of precipitation significance for different seasons. (a) Spring; (b) summer; (c) autumn; (d) winter.
Water 13 01664 g006
Figure 7. Spatial distribution of Spearman correlation coefficients at an interannual scale.
Water 13 01664 g007
Figure 8. Spatial distribution of Spearman’s correlation coefficients for different seasons. (a) Spring; (b) summer; (c) autumn, and; (d) winter.
Water 13 01664 g008
Table 1. Spearman’s correlation degree classification table.
Correlation Coefficient ValueDegree of Correlation
| ρ | = 0Completely uncorrelated
0.01 ≤ | ρ | ≤ 0.19Weak correlation
0.20 ≤ | ρ | ≤ 0.39Low correlation
0.40 ≤ | ρ | ≤ 0.59Moderate correlation
0.60 ≤ | ρ | ≤ 0.79Significant correlation
0.80 ≤ | ρ | ≤ 0.99High correlation
| ρ | = 1Strong correlation
Table 2. Precipitation trends for different seasons in the Haihe River Basin.
SeasonIncreasing TrendDecreasing Trend
Number
of Stations
Percentage (%)Number of Significant ChangesNumber
of Stations
Percentage (%)Number of Significant Changes
Spring17668.228231.81
Summer12448.1213451.91
Autumn3513.6022386.410
Winter14154.7411745.31
Table 3. Distribution of statistics for the p-values corresponding to different numbers of stations in the Haihe River Basin.
p-Value RangeNatureSpringSummerAutumnWinterInterannual Correlation
PositiveNegativePositiveNegativePositiveNegativePositiveNegativePositiveNegative
0Completely non-correlation6600100103
0.01–0.19Weak correlation901451151184311616111
0.2–0.39Low correlation0110167014101321117
0.4–0.59Moderate correlation 0007502106010
0.6–0.79Significant correlation0000000000
0.8–0.99Highly correlated0000000000
1Completely correlated0000000000
Publisher’s Note: MDPI stays neutral with regard to jurisdictional claims in published maps and institutional affiliations.

