Next Article in Journal
Performance Analysis for Road-Bioretention with Three Types of Curb Inlet Using Numerical Model
Previous Article in Journal
The Use of TiO2 as a Disinfectant in Water Sanitation Applications
 
 
Correction published on 31 March 2022, see Water 2022, 14(7), 1116.
Article

The Ecological Relationship of Groundwater–Soil–Vegetation in the Oasis–Desert Transition Zone of the Shiyang River Basin

1
Institute of Hydrogeology and Environmental Geology, Chinese Academy of Geological Sciences, Shijiazhuang 050061, China
2
Chinese Academy of Geological Sciences, China University of Geosciences (Beijing), Beijing 100083, China
3
Key Laboratory of Groundwater Sciences and Engineering, Ministry of Natural Resources, Shijiazhuang 050061, China
*
Author to whom correspondence should be addressed.
Water 2021, 13(12), 1642; https://doi.org/10.3390/w13121642
Submission received: 13 May 2021 / Revised: 29 May 2021 / Accepted: 8 June 2021 / Published: 11 June 2021 / Corrected: 31 March 2022
(This article belongs to the Section Hydrology)

Abstract

:
Groundwater is an important ecological water source in arid areas. Groundwater depth (GWD) is an important indicator that affects vegetation growth and soil salinization. Clarifying the coupling relationship between vegetation, groundwater, and soil in arid areas is beneficial to the prevention of environmental problems such as desertification and salinization. Existing studies lack research on the water–soil–vegetation relationship in typical areas, especially in shallow groundwater areas. In this study, the shallow groundwater area in Minqin, northwest China, was taken as study area, and vegetation surveys and soil samples collection were conducted. The relationships between vegetation fractional coverage (VFC) and GWD, soil salinity, soil moisture, and precipitation were comprehensively analyzed. The results showed low soil salinity in the riparian zone and high soil salinity in other shallow-buried areas with salinization problems. Soil salinity was negatively correlated with VFC (R = −0.4). When soil salinity >3 g/kg, VFC was less than 20%. Meanwhile, when GWD >10 m, VFC was usually less than 15%. In the areas with soil salinity <3 g/kg, when GWD was in the range of 4–10 m, VFC was positively correlated with soil moisture content (R = 0.99), and vegetation growth mainly depended on surface soil water, which was significantly affected by precipitation. When GWD was less than 4 m, VFC was negatively correlated with GWD (R = −0.78), and vegetation growth mainly relied on groundwater and soil water. There are obvious ecological differences in the shallow-buried areas in Minqin. Hence, it is reasonable to consider zoning and grading policies for ecological protection.

1. Introduction

Desertification is the main ecological and environmental problem in arid areas [1,2,3], and vegetation is the main body of ecology in arid areas. Maintaining high vegetation coverage is the key to preventing desertification [4,5]. As vegetation growth relies on water, groundwater is an important ecological water source in addition to limited precipitation [6,7,8]. Groundwater depth (GWD) is an important factor affecting the growth of ecological vegetation [9,10,11,12]. Greater GWD leads to lower vegetation fractional coverage (VFC) [9,11], whereas lesser GWD causes salinization [13], which can restrict vegetation growth and affect VFC. Therefore, studying the ecological relationship between GWD, soil, and vegetation has important scientific significance.
The Shiyang River Basin in China faces serious salinization [14] and desertification problems [15], both of which are closely related to the GWD, especially in the Minqin Oasis at the lower reaches of the basin. After nearly 60 years of excessive groundwater exploitation, the GWD in the basin has increased significantly, affecting the growth of natural vegetation around the oasis. The sandstorm intrusion from the Badain Jaran Desert to the northwest of the oasis has gradually expanded [16,17], and the Badain Jaran Desert is now close to become merging with the Tengger Desert in the east to the oasis. Sandstorms in this area are also one of the main sources of sandstorms in China [18]. In addition to the increase of the desertification area, the proportion of salinized soil accounts for 80% of the Minqin area [14], and the salinization problem in this area is extremely serious. Therefore, studying the ecological value of groundwater in the basin to natural vegetation, the GWD, and the ecological relationship between soil and vegetation is of important significance to the ecological protection, management, and restoration of this area.
Many scholars have conducted research on the ecological environmental problems (desertification and salinization) related to groundwater and vegetation in the Minqin area [14,15,16,19,20,21]. Huang [19,22,23] and Chunyu [24] studied the dynamic simulation of the oasis driven by ecological water transfer and its significance for the restoration of natural oases in arid inland basins, and obtained an optimal water diversion amount of 45 million m3. Cao [25] concluded that the most suitable groundwater depth for natural vegetation growth in the Minqin Oasis was 2.5–3.9 m, which is not completely consistent with other basins in Northwest China [26,27,28]. Wang [29,30] improved the theory and method of groundwater function evaluation and regionalization, and delineated the nature reserves of groundwater maintaining vegetation ecology, which are mainly distributed in the shallow groundwater buried areas. Ding [16] and Ren [17] investigated the source and spatiotemporal pattern of sand migration in the Minqin Oasis. Yang [14] reported that the area of soil salinization in the Minqin Oasis has gradually increased in recent years. The degree of salinization is high in spring and low in autumn, and a large proportion of the salinized land is related to climate and hydrological factors. Liu [31] investigated the spatial distribution characteristics of soil water and salt under different land use types in Minqin Oasis. The average salt content is 47.02 g/kg and the degree of salinization is severe. Existing studies have mostly focused on the analysis of regional and basin-scale remote sensing of vegetation coverage as well as salinization degree and evolution. However, the analysis of the coupling effect of groundwater, salinization, and ecological vegetation is still lacking. Detailed analysis of the groundwater ecological effects based on the spatial heterogeneity of the Minqin area also required, especially for the study of shallow groundwater areas.
In this study, we conducted a vegetation ecological survey, measured GWD, and collected groundwater and soil samples in the shallow GWD area of the Shiyang River Basin. By analyzing the ecological relationship of groundwater–soil–vegetation, the main factors that control and affect the VFC in the region were examined. By combining the characteristic differences of basic ecological conditions with zoning, targeted ecological protection and management suggestions were proposed. The objective of this study is to clarify the VFC under the control of GWD and soil salt in the oasis–desert transition zone of the Shiyang River Basin and obtain important ecological GWD and salinization indicators, and provide a reference and scientific basis for the formulation of ecological policies in the basin.

2. Materials and Methods
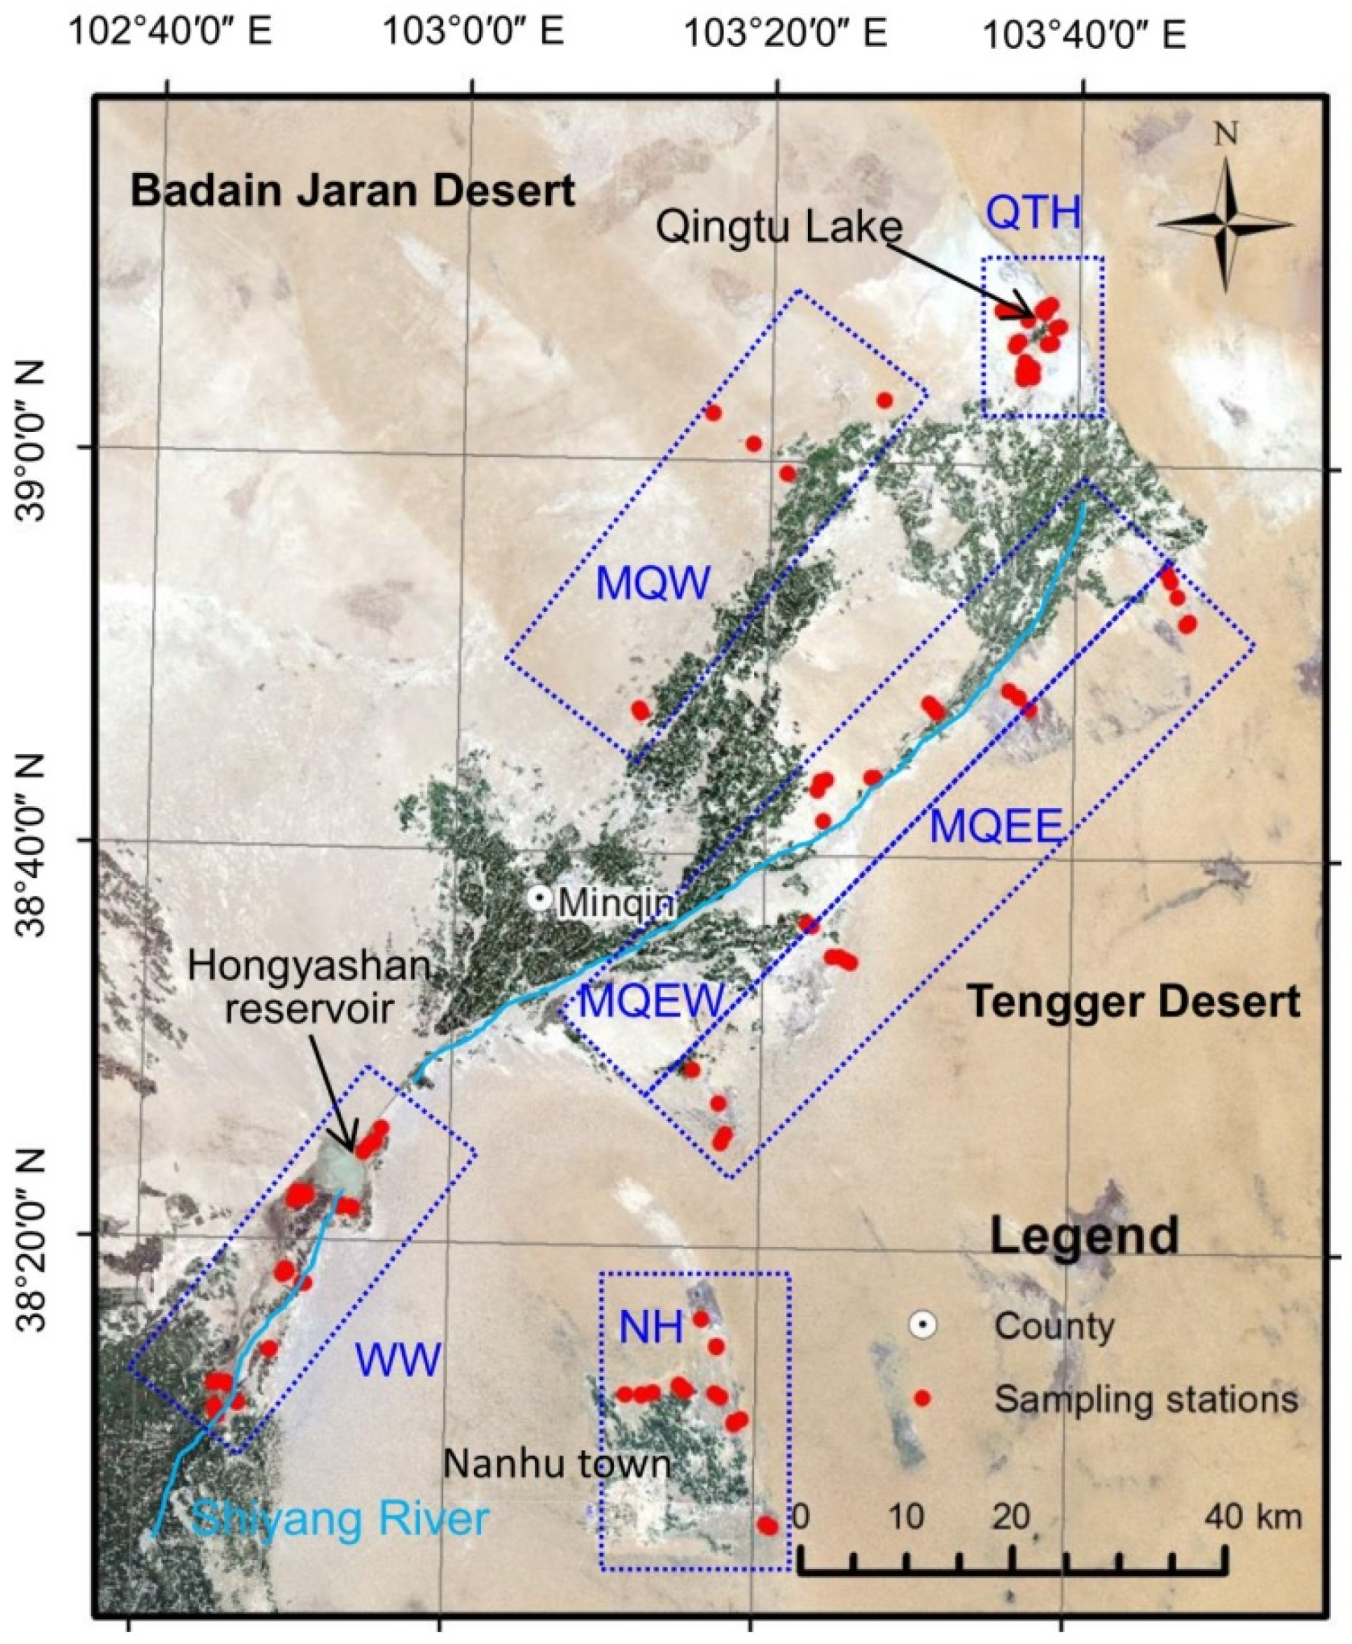
2.1. Study Area

The Shiyang River Basin is located in the eastern part of Gansu Province, China. It is one of the three inland river basins in the Hexi Corridor, with a total area of 4.16 × 10⁴ km2 [32]. The Minqin Basin is located in the lower reaches of the Shiyang River Basin with an area of about 1.58 × 10⁴ km2. The northwestern part is the Badain Jaran Desert, the southeastern part is the Tengger Desert (Figure 1), and the central part of the basin is the Minqin Oasis. The study area is mainly located in the oasis and desert transition zone from 38°00′ N to 39°20′ N and 102°37′ E to 103°55′ E. These areas are subject to serious ecological problems and risks. The Minqin Oasis area is characterized by a typical arid desertification climate with an average annual temperature of 7.8 °C, an average annual precipitation of about 116.5 mm, and an average annual evaporation of 2308 mm [33]. The landform types include mobile dunes, semi-fixed dunes, fixed dunes, interlaced deserts, and Gobi. Shrubs are the dominant component of natural vegetation in the area, and include Nitraria spp., Tamarix spp., Haloxylon ammodendron, Kalidium foliatum, Reaumuria soongorica, and Artemisia arenaria. The trees include Populus euphratica, Populus gansuensis, Elaeagnus angustifolia, and Salix matsudana. The herbs are mainly Phragmites australis, Achnatherum splendens, Sophora alopecuroides L., Bassia dasyphylla, and Agriophyllum squarrosum [34,35,36].
In recent years, the GWD of agricultural irrigation area in the Minqin area has been around 15–35 m [25,37,38]. The shallow groundwater area (GWD < 15 m) is mainly distributed in the oasis–desert transition zone around the irrigation area [25], the riparian zone [35], and the Qingtu Lake Wetland in the terminal lake of the Shiyang River [19]. According to the geographical location, landform, groundwater depth, and vegetation community, the shallow groundwater area was divided into six zones; detailed information is shown in Figure 1 and Table 1. These zones represent the riparian zone in the middle reaches (WW), the shallow groundwater area in Nanhu Town (NH), Qingtu Lake wetland (QTH), the west of Minqin oasis (MQW), Minqin Oasis (MQEW) and the east of Minqin oasis (MQEE).

2.2. Data Sources and Methods

The ecological survey was conducted in August 2018. According to different landform types and GWD intervals [25,37], representative plots in each district were selected to perform tree surveys with 30 × 30 m2 vegetation quadrats. Within the large quadrat, five 5 × 5 m2 quadrats were arranged in the four corners and the center according to the diagonal method to investigate shrubs. Within each shrub quadrat, a 1 × 1 m2 quadrat was set up to conduct herb surveys. The ecological survey recorded the community types (trees, shrubs, and herbs), number of vegetation species, number of single species, coverage, growth, and other ecological indicators [39]. The importance of vegetation in the quadrat was ranked according to the coverage of each species.
In the center of the quadrat, soil samples were collected at 20 cm intervals for a maximum depth of 1 m [31]. Five samples were thus taken from each sampling point, stored in aluminum boxes and Ziplock bags, and tested for the soil moisture content and soluble salt. The moisture content was determined using the drying method [40]. The averaged value of the five samples was calculated and used as the soil characteristic data of the sampling point. The GWD was measured using a Luoyang shovel and steel tape.
The normalized difference vegetation index (NDVI) is a commonly used indicator for evaluating vegetation development. Landsat NDVI data have been widely used for studying changes in regional ecological environments [8,19,20,41,42,43]. In general, NDVI values range between −1 and 1. A high NDVI value indicates that the vegetation is well-developed, whereas a low NDVI value indicates that the vegetation is in poor condition. This study used the Landsat satellite data (from 1980 to 2018) with a temporal resolution of 16 d and a spatial resolution of 30 m. Firstly, the satellite image was preprocessed using atmospheric and geometric correction. Then, image stitching, cropping, and band calculation were performed. Finally, the maximum value extraction and annual average calculation were performed.
The vegetation fractional coverage is estimated using NDVI and the following formula [44]:
VFC   =   NDVI NDVI min NDVI max NDVI min × 100 %   ,
where VFC is the vegetation fractional coverage and NDVImin and NDVImax are NDVI values with cumulative probabilities of 5% and 95%, respectively.
The long-term dynamic observation data of groundwater were obtained from the Shiyang River Administration. They include the data of typical groundwater depth monitoring wells in the Minqin area (1980–2016) and were used to calculate the annual average GWD.
The meteorological data of the Minqin area were downloaded from the China Meteorological Science Data Sharing Service Network (http://data.cma.cn; accessed on 1 July 2019) of the China Meteorological Administration. These data mainly include air temperature (T), relative humidity (RH), and precipitation (P) from 2004 to 2016. The annual average temperature, annual average relative humidity, and annual rainfall were calculated here based on the above data.

3. Results

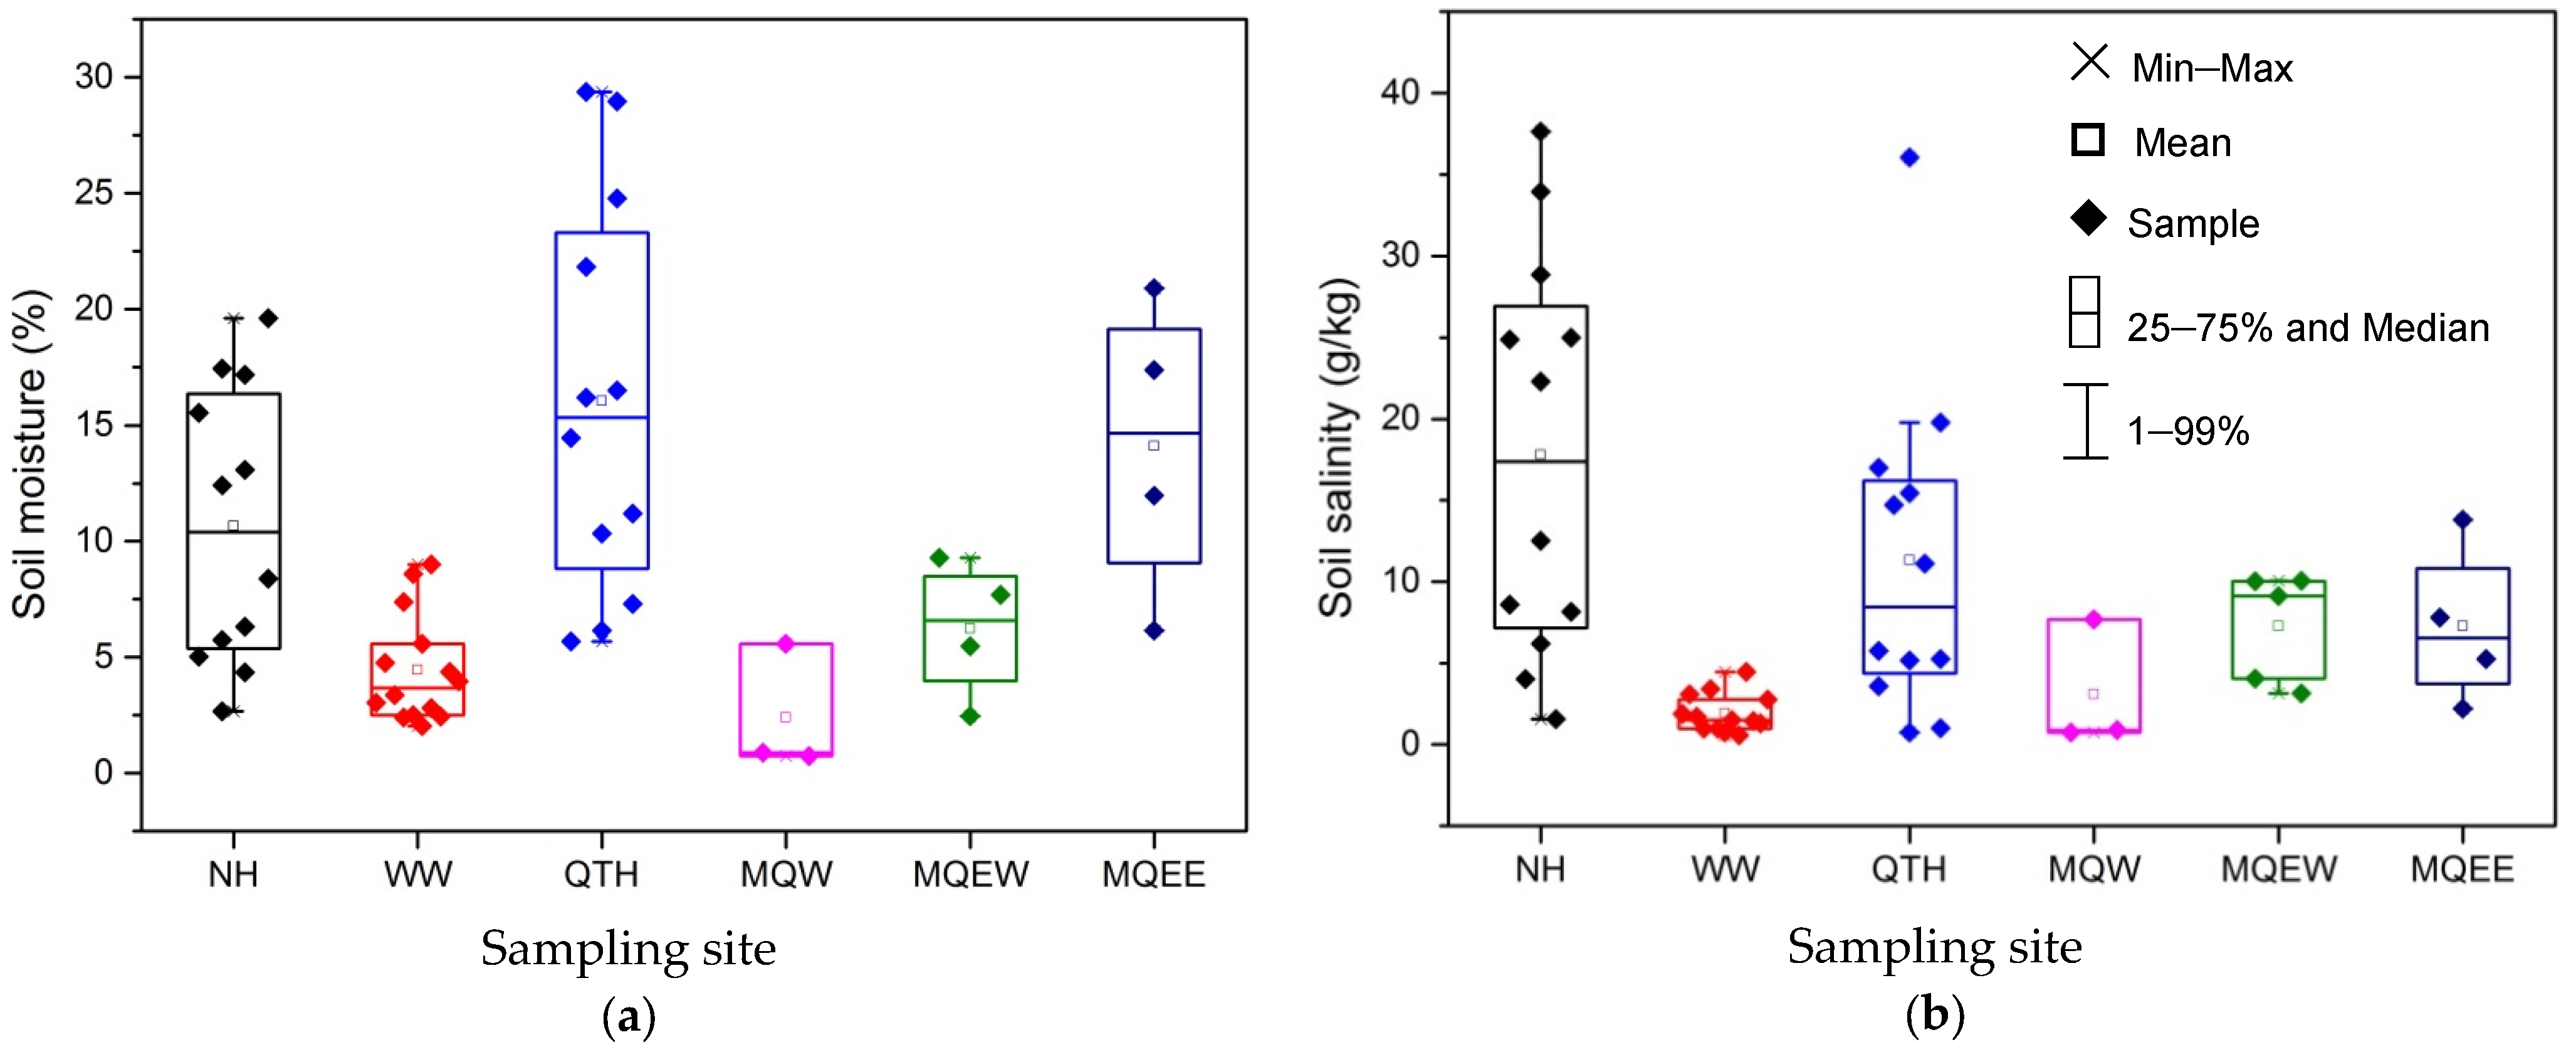
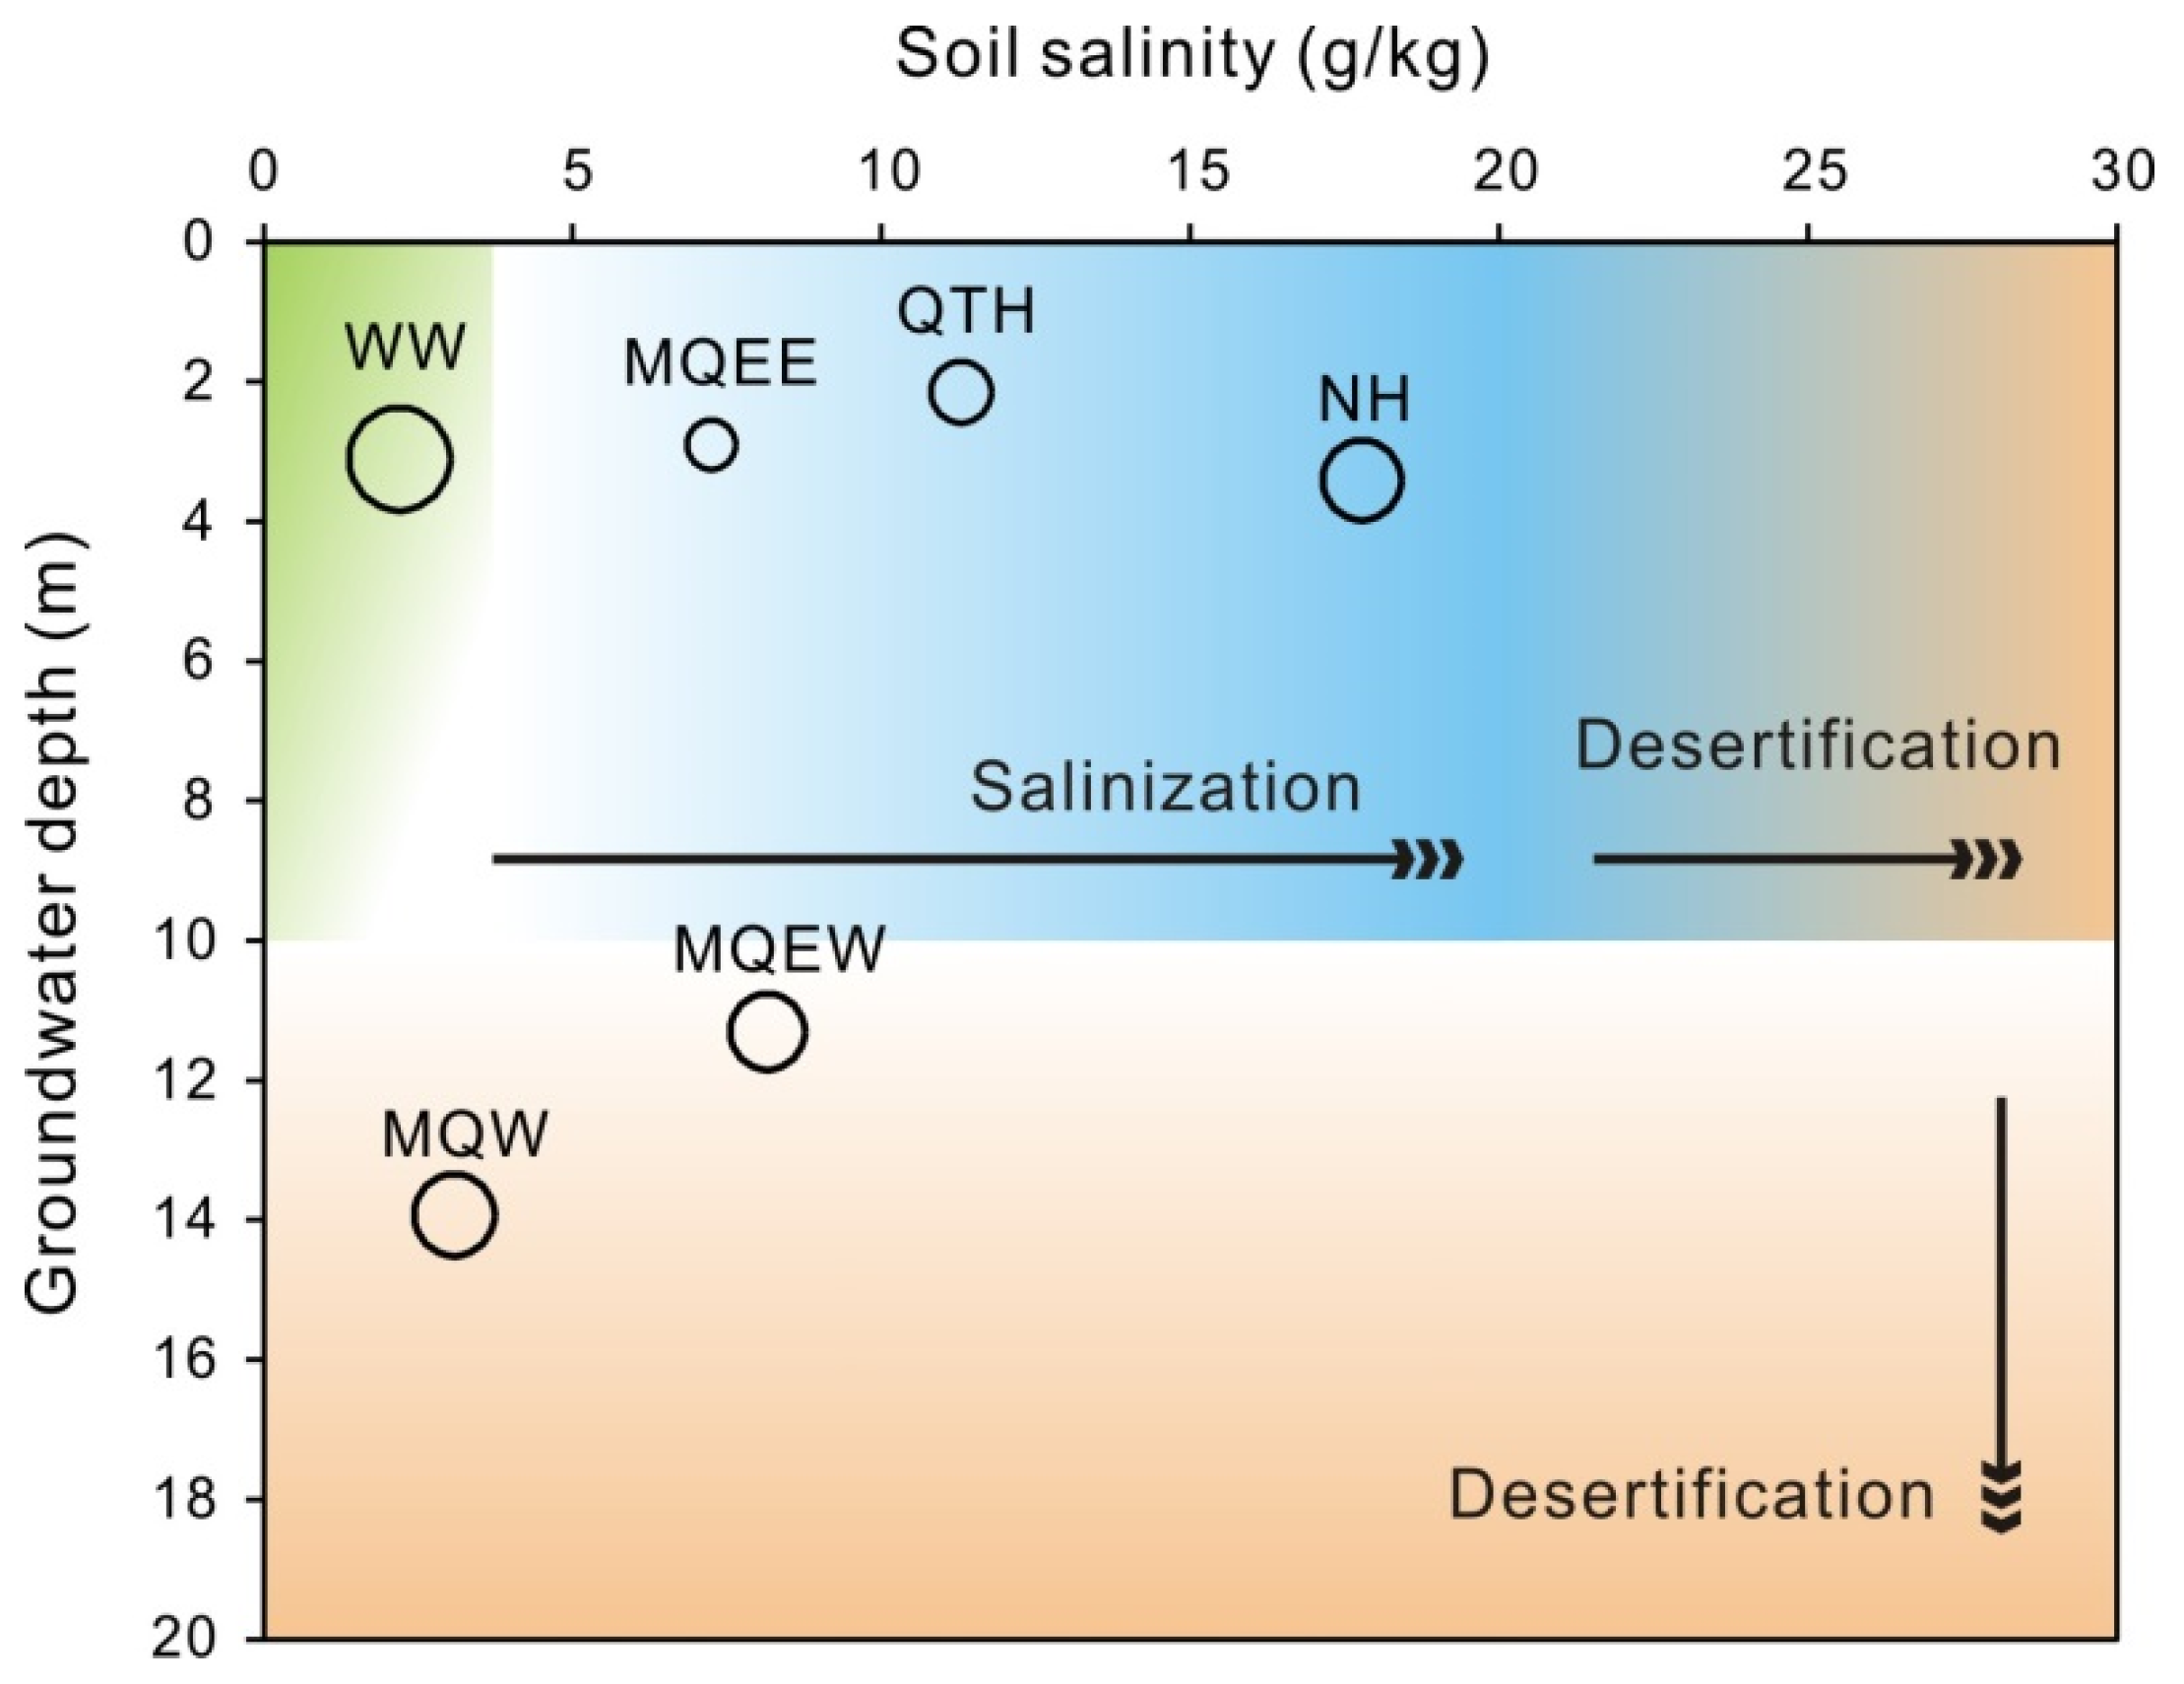
3.1. Surface Soil Moisture and Salt Content

The average surface soil moisture contents (Figure 2a) of the areas in descending order were QTH > MQEE > NH > MQEW > WW > MQW. The soil moisture contents of all areas ranged from 0% to 30%. MQW had the lowest average soil moisture content (only 2.5%), whereas QTH had the highest average soil moisture content (about 16%). However, the soil moisture content of QTH varied widely (5–30%).
The average surface soil salt contents (Figure 2b) of the areas in descending order were NH > QTH > MQEE > MQEW > MQW > WW. The salt contents of all areas ranged from 0 to 40 g/kg. The average salt content of WW was the lowest (at 1.5 g/kg), whereas that of NH was the highest (approximately 17.5 g/kg). The soil salt content of NH varied from 2 to 38 g/kg. With the exception of the WW area, the average salt content of the other five areas exceeded 3 g/kg, indicating salinized land.

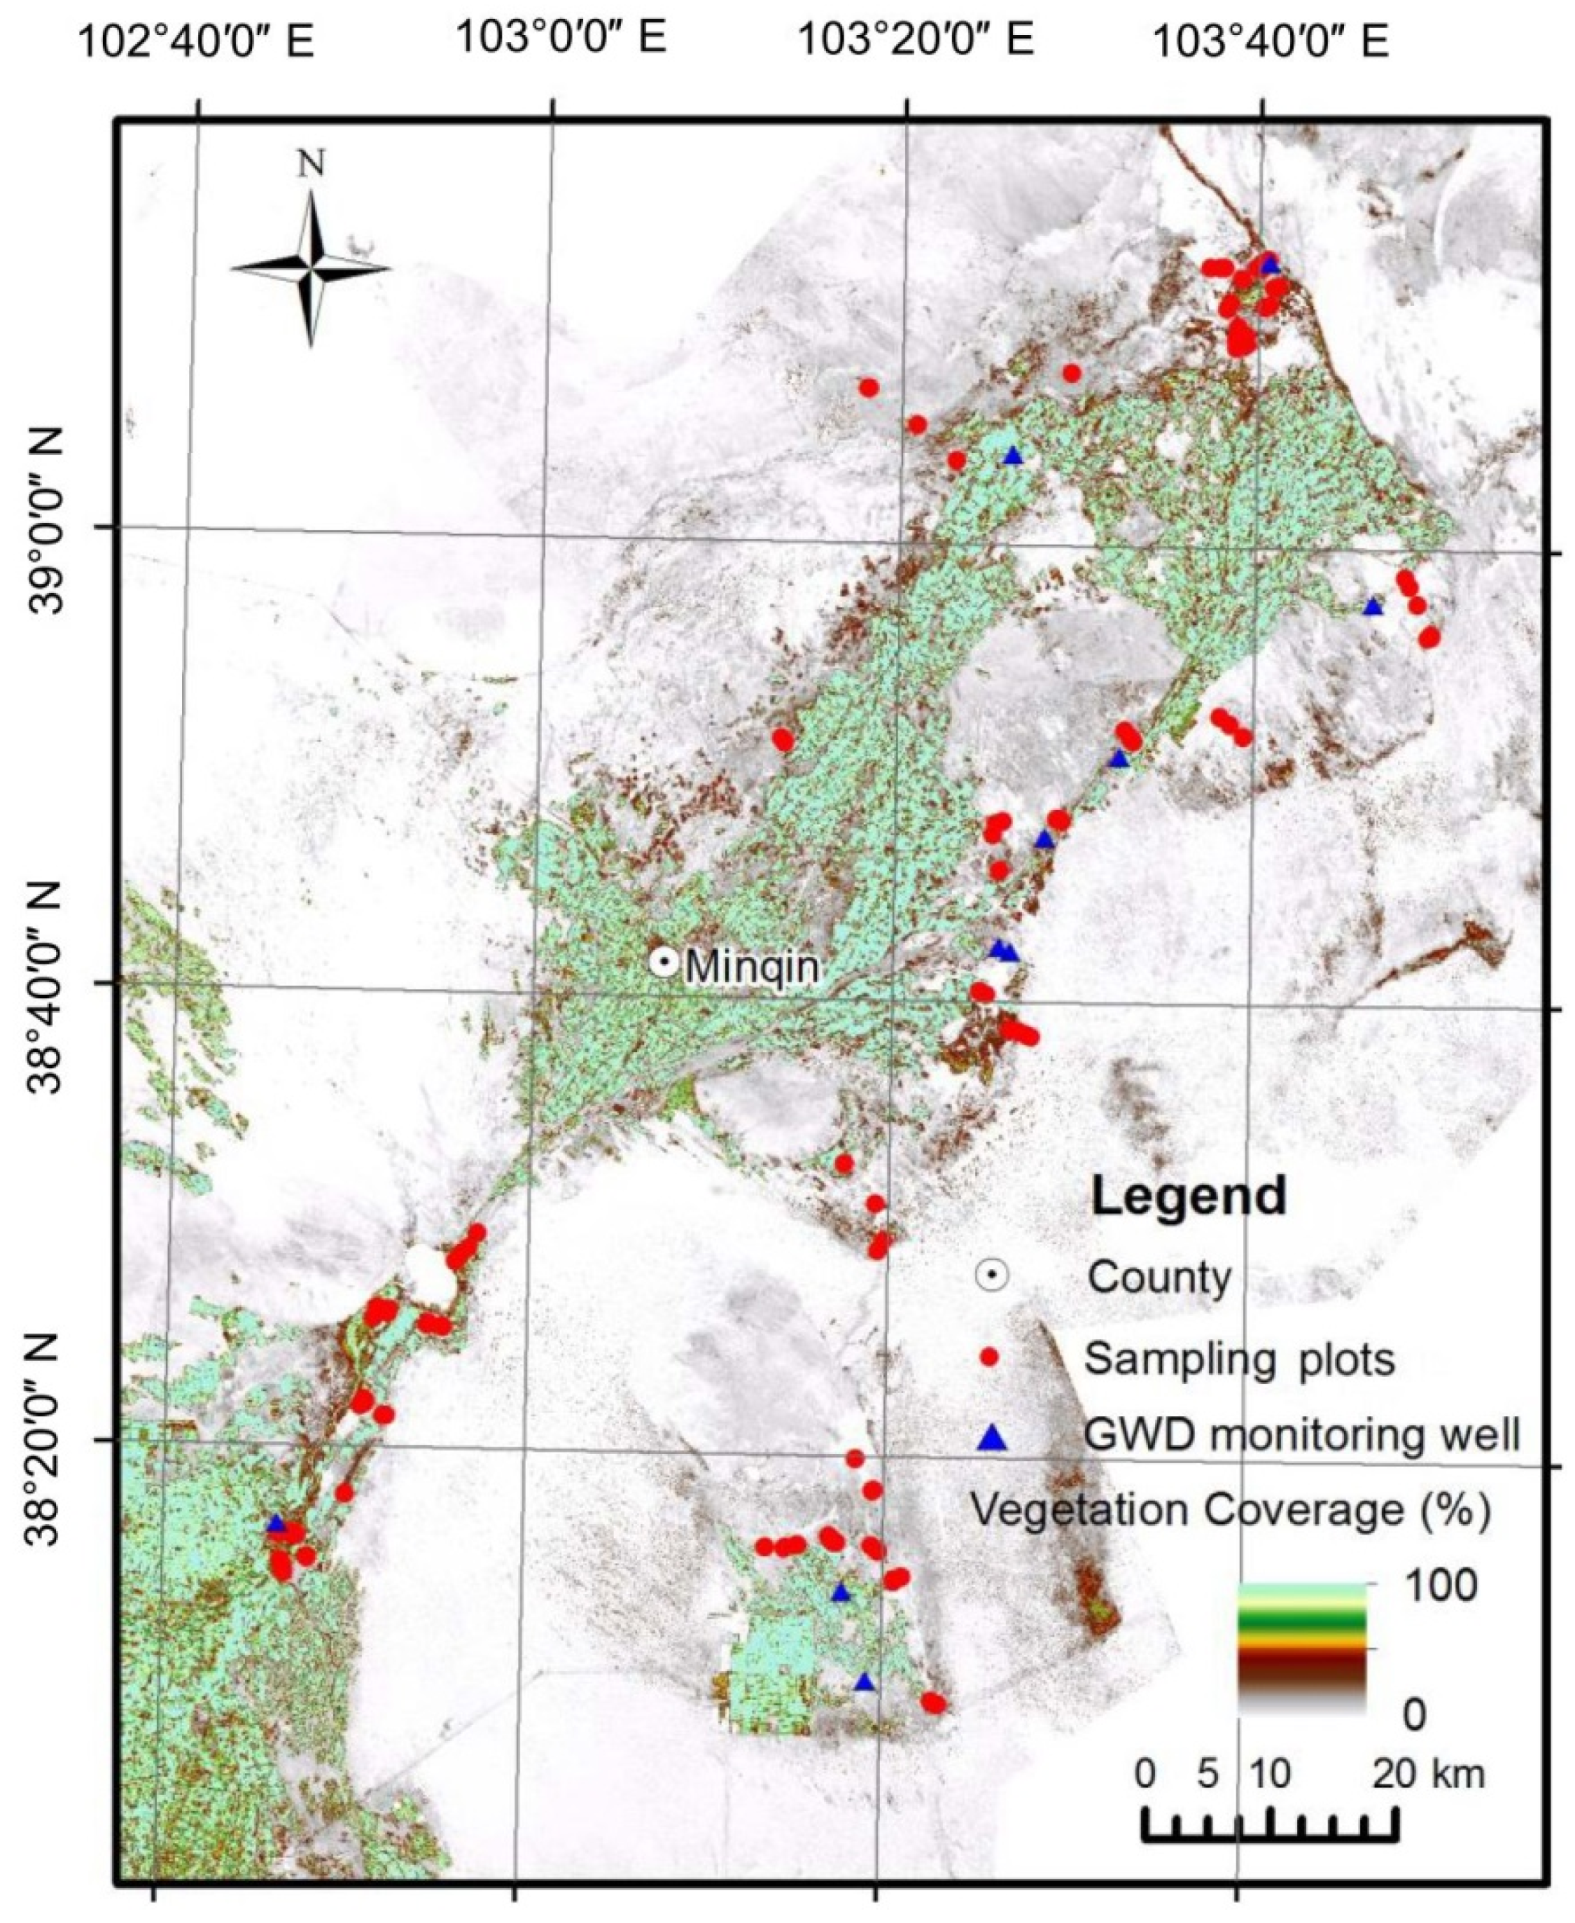
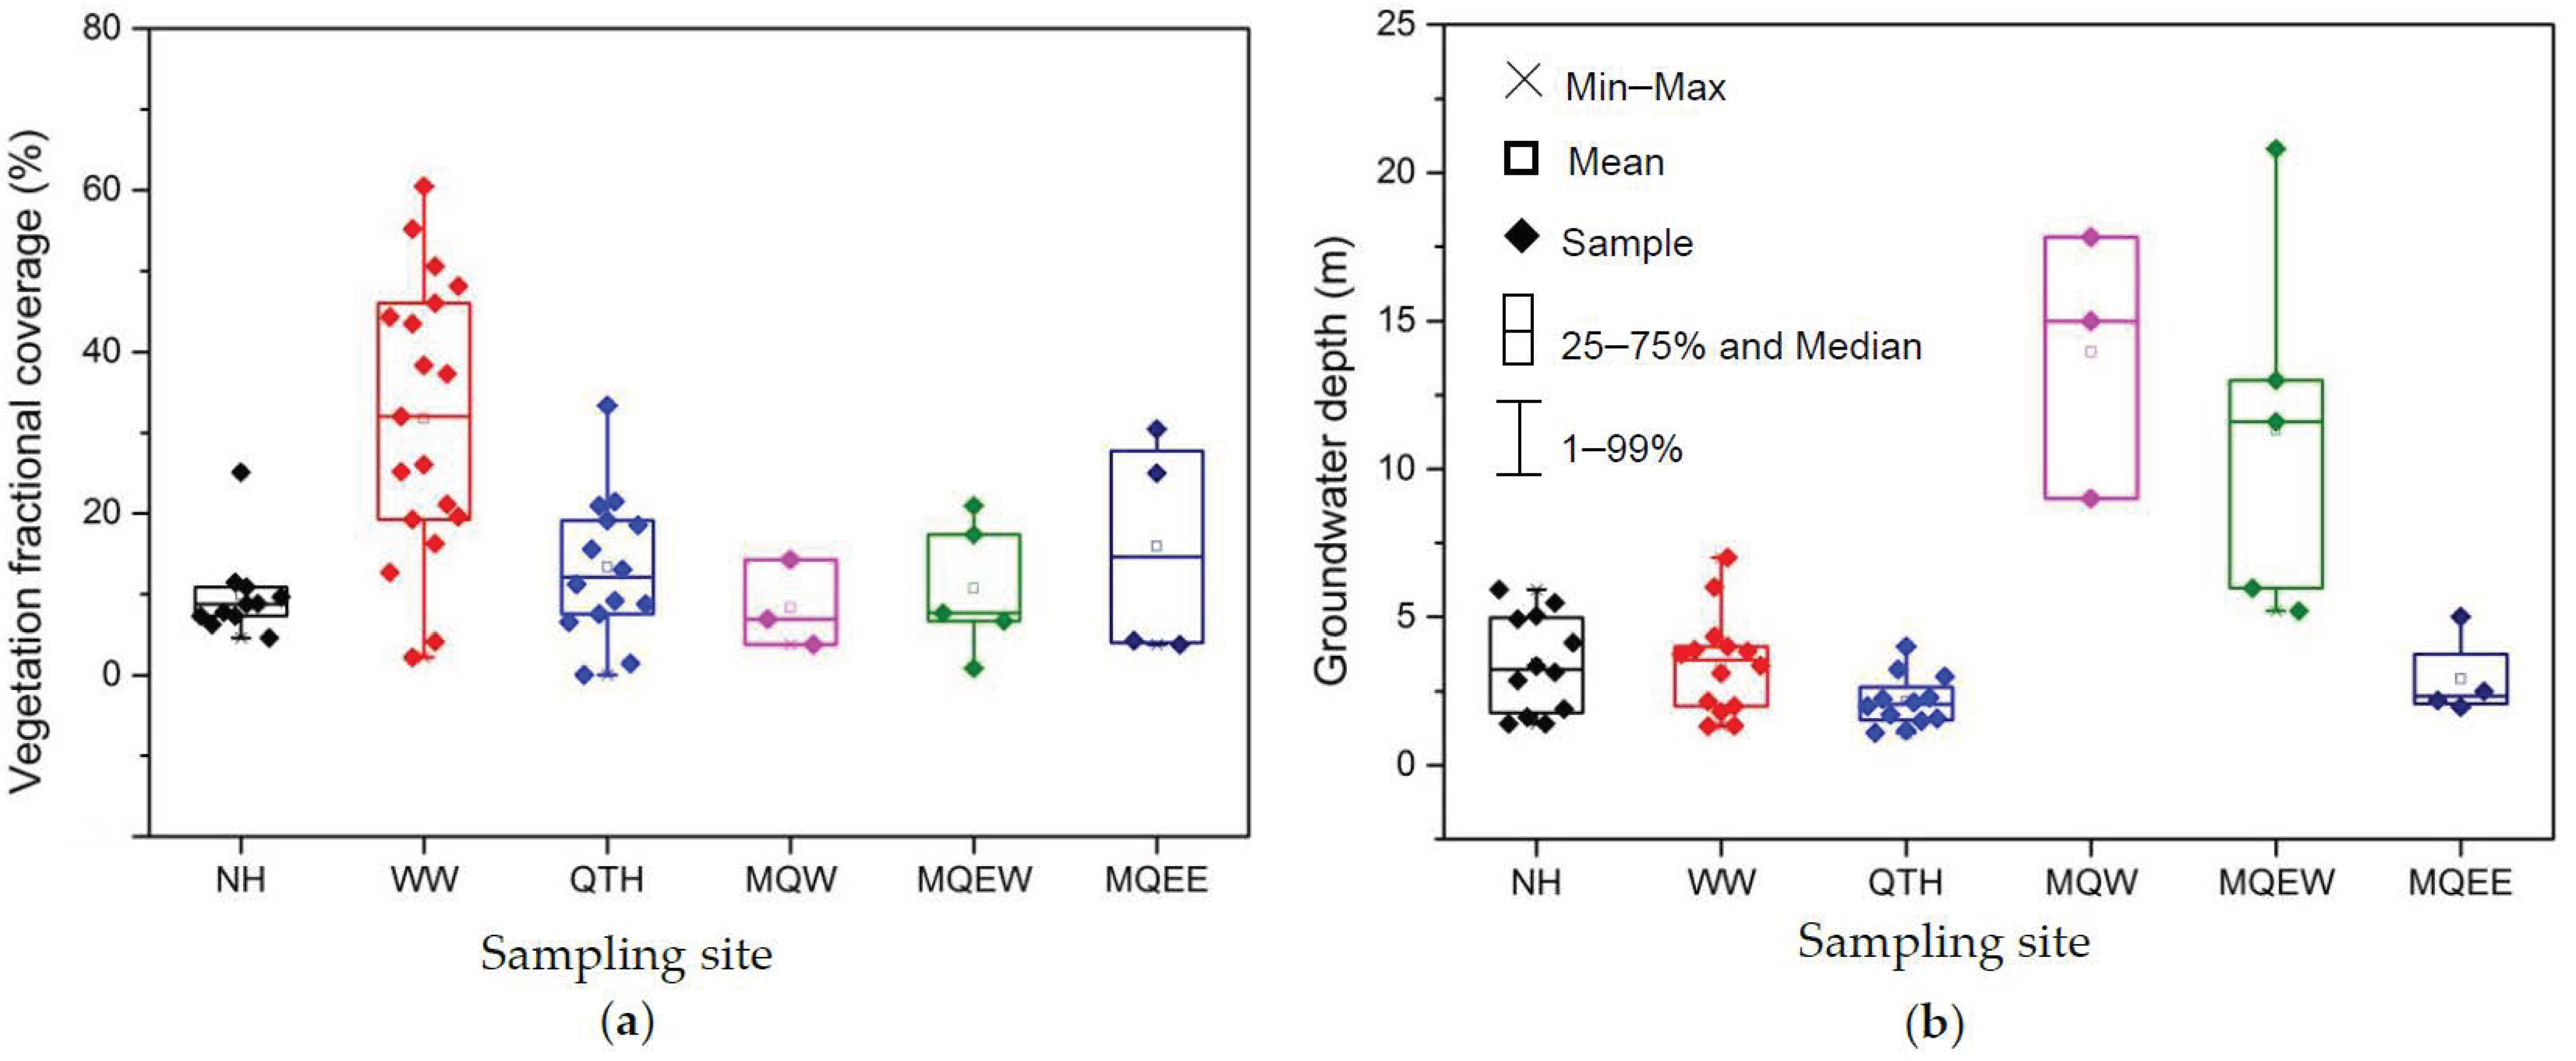
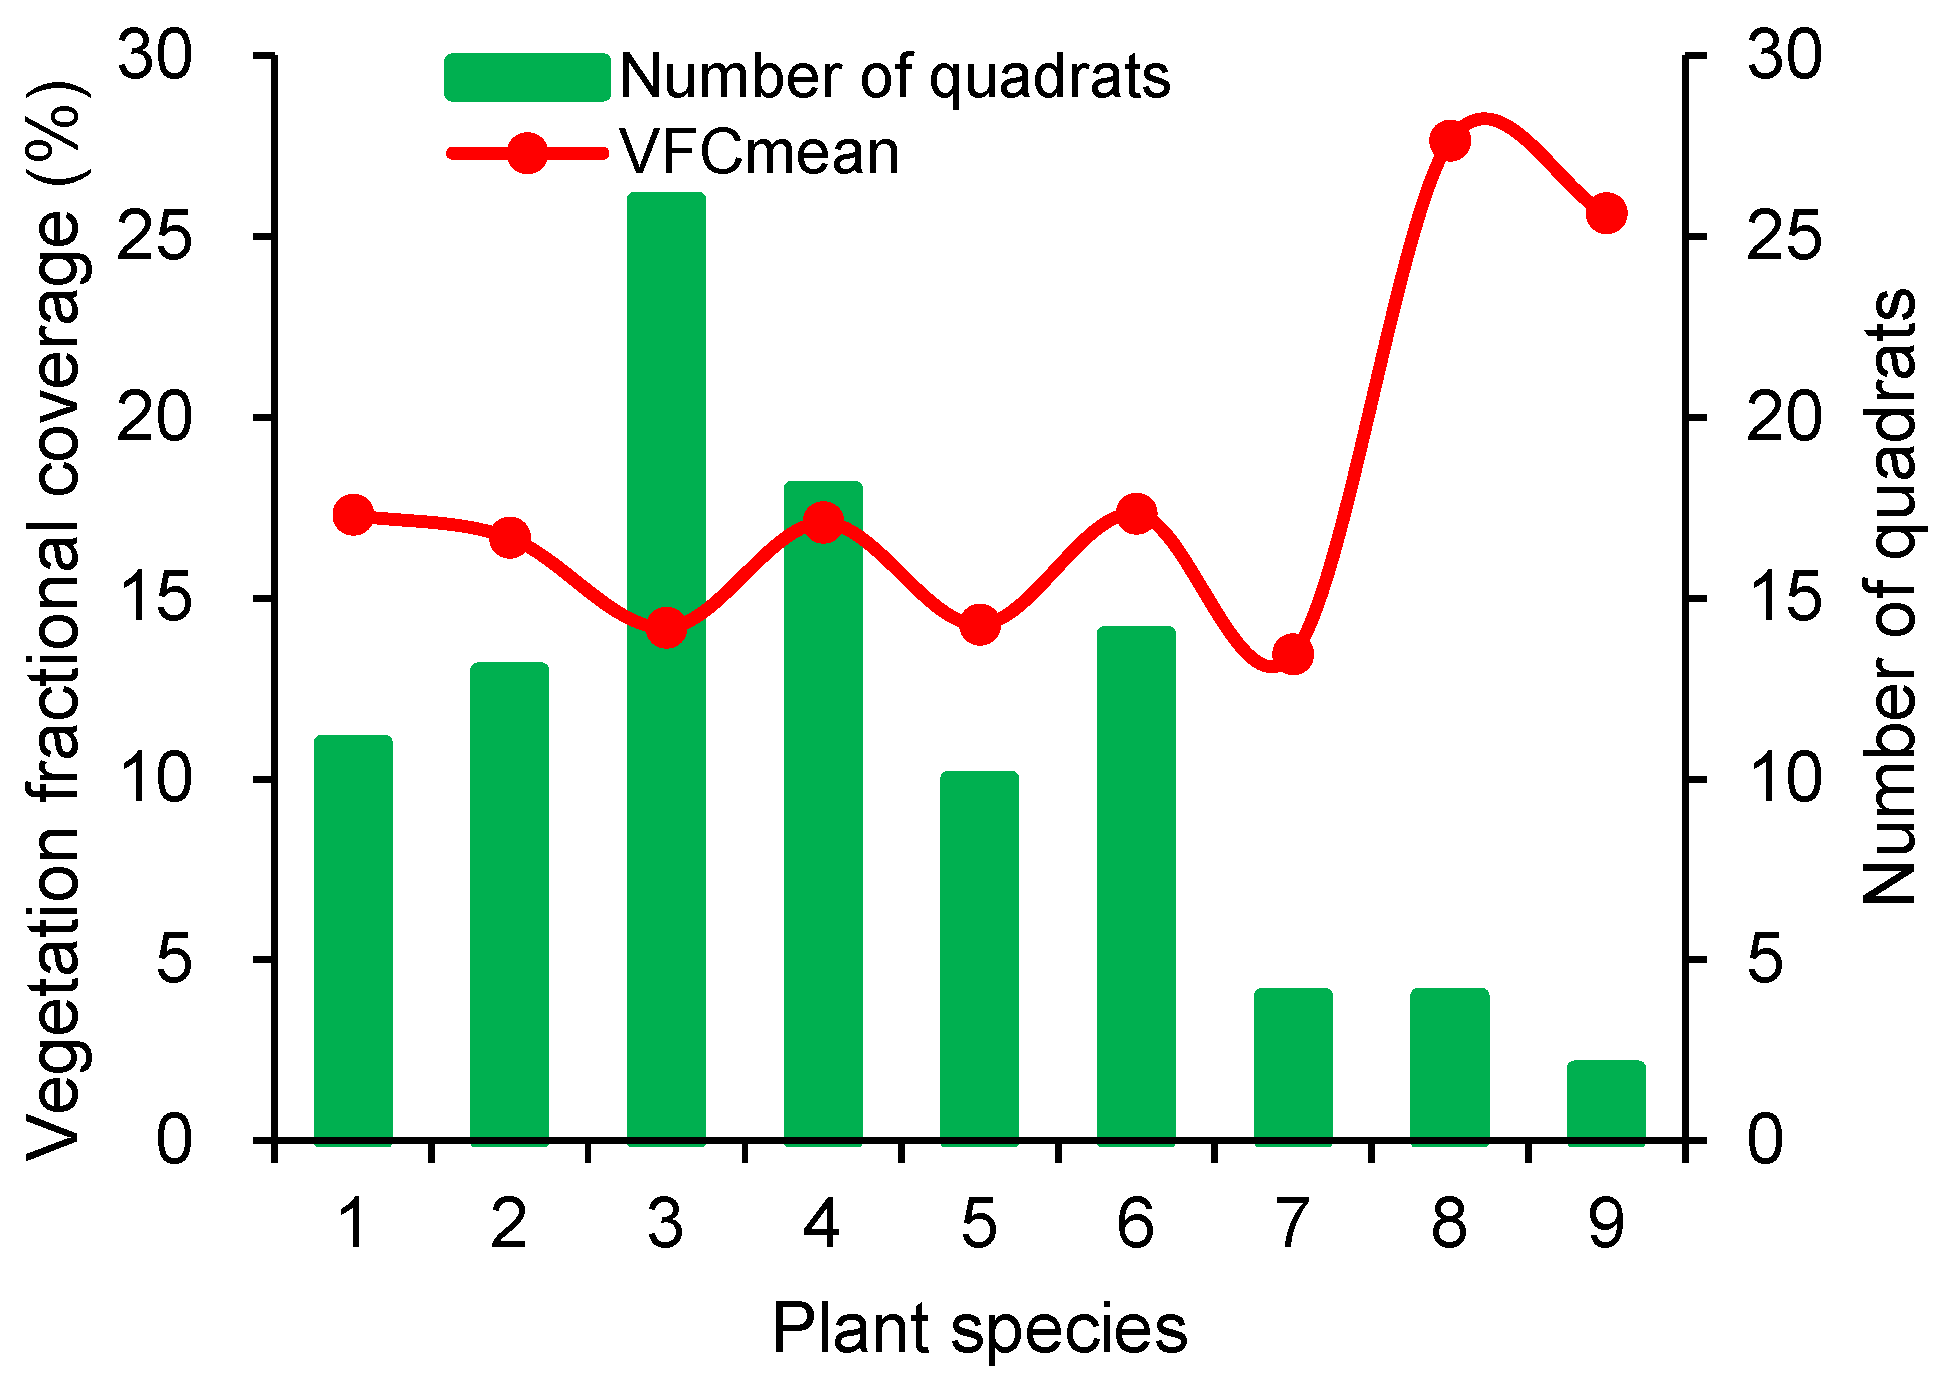
3.2. Ecological Vegetation Coverage and Groundwater Depth

The remote sensing data showed the average VFC of each area (Figure 3 or Figure 4a). The VFCs of the areas in descending order were as follows: WW > MQEE > QTH > MQEW > NH > MQW. The VFCs of all areas were less than 60%. The average VFC of WW was the highest at 32%, which indicated medium vegetation coverage. The VFC of MQW was the lowest at 8%, which indicated mostly bare land. In contrast, the VFCs of other areas ranged from 10 to 20% and were classified as medium and low vegetation coverage areas. The VFCs of the quadrats in the WW area varied widely (with a maximum of 60% and a minimum of 2%), with a high coefficient of variation.
The GWDs of the areas in descending order were MQW > MQEW > NH > MQEE > QQ > QTH (Figure 4b). The average GWD in MQW was 13.94 m; that in MQEW was 11.31 m; those in WW and NH were similar (3.42 m and 3.43 m, respectively); those in QTH and MQEE were less than 3 m; and that in QTH, at 2.16 m, was the lowest.
The vegetation quadrats demonstrate that a combination of shrubs and herbs is the main community type in the study area (Figure 5). There were 66 quadrats of this type, accounting for 71% of all investigated quadrats. The average VFC was 15%. The number of communities with trees was small, and they were only distributed in the WW area. In the communities with trees, the VFC was significantly higher (25–45%).

4. Discussion

4.1. Ecological Relationship among Groundwater, Soil and Vegetation

Figure 6 shows that the quadrats with higher vegetation fractional coverage were mainly concentrated in areas with shallow groundwater depth (<6 m) and relatively low surface soil salinity (<5 g/kg). These samples were distributed in WW, whereas the coverage rates of other areas were around 10–20%. When the GWD was more than 10 m, the VFC was less than 10% and the surface was bare soil, reflecting the poor overall ecological conditions of shallow-buried areas in the Shiyang River Basin.
The correlation analysis results of the water–soil–vegetation relationship showed that the VFC had the closest relationship with surface soil salinity, with a correlation coefficient between them of −0.43, whereas the VFC correlation with GWD was only −0.21. The relationship between GWD and vegetation growth was less obvious, meaning that the GWD does not significantly affect the VFC. Higher soil salinity may limit the types of vegetation and vegetation growth, resulting in a lower GWD that cannot produce high VFC.
To better understand the ecological effect of GWD and confirm the weak relationship between GWD depth and VFC, we analyzed the changes of GWD and vegetation conditions in a long time series. Figure 7 presents the change trend of groundwater from the 1980s to 2017. The GWDs of MQEE, NH, MQEW, WW, and MQW have trended upward. After 2012, the GWDs of the NH, MQEE, and MQW monitoring wells decreased and the water levels increased. After 2010, the GWD of the QTH area slowly decreased due to the implementation of ecological water transfer measures. As a wetland, the surface water area of QTH has also expanded [19,24,45]. The vegetation data in the same period show that, with the increase in GWD, the vegetation coverage conditions did not decrease significantly in the NH, WW, MQEW, and MQEE areas (Figure 8a,b,e,f). From the 1980s to 1996 and then from 2000 to 2017, the vegetation NDVI did not decrease significantly, but there were fluctuations. The average value of NDVI in MQW changed from 0.22 in 1980 to 0.15 in 1996, and subsequently remained stable at around 0.15 (Figure 8d). The NDVI of vegetation in QTH fluctuated around 0.13 from 1980 to 2010, and increased steadily after 2010 (corresponding to the decrease in GWD) (Figure 8c).
In QTH, the buried depth was usually less than 3 m, and the surface vegetation was consistent with the downward trend of ecological water transfer and buried depth, reflecting the ecological contribution of groundwater to the vegetation in the area. In other areas, the vegetation changes and buried depths were inconsistent with the evolution of GWD, indicating the weak influence of GWD and the close correlation between vegetation and surface soil. For areas with deeper GWD (>10 m), the soil moisture content is mainly affected by meteorological factors, such as precipitation, temperature, and relative humidity [34], especially summer precipitation. The meteorological data of the Minqin area from 2004 to 2017 (Figure 9) showed certain fluctuations in annual precipitation during this period. There were very high precipitation values in 2007, 2011, and 2014 and the fluctuations in annual precipitation and annual relative humidity were consistent with the change of vegetation NDVI in WW, NH, MQEW, and MQEE (Figure 10). This indicates that the growth of vegetation in these areas mainly depends on precipitation and soil water [21,46], and is not closely related to groundwater.
Among these areas, the VFC in the WW area had the closest relationship with precipitation with a correlation coefficient R of 0.63 (Table 2). This means that WW has a close relationship with the surface soil moisture content. Figure 11a shows all the quadrats and soil survey points in the WW area. According to the differences in GWD, these survey points were divided into three groups. When the local GWD was less than 2 m (Group 1), the soil moisture content and VFC were higher, and VFC reached 40–50%. When GWD was about 2–4 m (Group 2), the relationship between VFC and soil moisture content was not significant and VFC ranged from 20–50%. When the GWD was above 4 m (Group 3), VFC was less than 35% and there was a significant linear relationship between soil moisture content and VFC (R = 0.99). The higher the soil moisture content, the higher the VFC. From the perspective of community structure, Group 1 was composed of trees/shrubs and herbs, where shrubs were the dominant community, and marsh meadows were more developed [35]. Group 2 was dominated by a combination of trees, shrubs, and herbs, where trees were usually the dominant species. Group 3 included shrubs and herbs, where herbs were the dominant species in some of the quadrats. Desert vegetation communities in the Shiyang River Basin are usually composed of shrubs and herbs (Figure 5). The roots of shrubs and herbs in arid areas are mainly distributed at a depth of 1.2 m below the soil surface (Figure 12a) [47,48,49,50]. The water in this layer is the main water source that supports the growth of vegetation, which indicates the ecological significance of soil moisture in the surface unsaturated zone. For example, the root system of Haloxylon ammodendron is generally within 1 m of the surface, and the horizontal root system is concentrated 50–100 cm below the soil surface [47,48,50]. The root system of Tamarix spp. is distributed 40 cm below the soil surface. The roots of Nitraria spp. are distributed approximately 120 cm below the soil surface [47]. The main roots of the thin-branched Kalidium foliatum penetrate to 80–145 cm below the soil surface, where the main root system is distributed in the 10–30 cm soil layer, and the root width ranges from 100–115 cm [51]. For vegetation in the WW area, 4 m is an ecological water level boundary for the structure of the vegetation community (Figure 12a). When the GWD is greater than 4 m, the vegetation of the community dominated by small shrubs and herbs mainly depends on summer precipitation and surface soil moisture for growth. The vegetation roots extend laterally to access water, especially in annual plants (Figure 12b). The degree of lushness is greatly affected by the total amount of precipitation and its annual and seasonal distribution. When the precipitation is appropriate, it can form Nitraria spp. + Calligonum shrubs and “Halogeton arachnoideus + Reaumuria soonorica shrubs with a coverage of more than 40%. This type of vegetation has become an important part of the vegetation in this area [46,52]. The trees and some shrubs with a root depth of 4–10 m mainly rely on deep groundwater to survive [49,53]. When the GWD is less than 4 m, the roots of the vegetation can grow vertically and penetrate the groundwater surface or reach the groundwater capillary water uplift zone (Figure 12c). Hence, the vegetation no longer completely depends on the surface soil moisture to survive. When the GWD is further reduced to 2 m, vegetation growth can fully access soil moisture and groundwater to survive [54] (e.g., some species of Tamarix [49,55]), and thus VFC can reach a higher value [56]. Figure 11b displays the relationship between GWD and VFC when GWD <4 m. These two were highly negatively correlated (R = −0.78). The smaller the buried depth, the higher the VFC. This was consistent with an analysis of the NDVI–GWD relationship in the Minqin Oasis conducted by Cao [25].

4.2. Ecological Degradation of Transition Zone Dominated by Groundwater

Changes in the GWD can cause salinization and desertification [13]. A large GWD can result in reduced surface vegetation (as in MQW), which can in turn cause desertification (Figure 13), whereas a small GWD affected by surface evaporation can result in soil salinization. The growth of a small amount of salt-tolerant vegetation can limit the VFC [31], whereas lower vegetation cover can increase the risk of desertification. This process can make soil salinization a major environmental problem leading to land desertification [57,58].
In addition to the WW area, the VFCs of other areas were not high, but their soil salinity values were above 3 g/kg (Figure 2b). This suggested that the soil salinity may have constrained the VFC. For the NH area, with the highest salinity, the VFC was not high with scattered distribution of Kalidium foliatum and Sophora alopecuroides L. In the NH area, the correlation between NH and precipitation (R = 0.3) was also smaller than that of WW (R = 0.63), reflecting the obvious limitation of soil salinity on VFC. The expansion of the saline area in the Minqin Oasis and parts of the Qingtu Lake and the increase in salinity were mainly driven by ecological water transfer [14,46]. Figure 13 shows the relationship between desertification and salinization in the shallow buried area of the Shiyang River. When GWD was <4 m and soil salinity was <3 g/kg, the VFC was the highest and the number of species was the largest. There were 8–9 species of plants in the community of trees near the river bank (Figure 14). When the soil salinity was greater than 5 g/kg, VFC began to decrease. When the soil salinization reached 20 g/kg, it began to transform into bare land (Figure 6) and desertification occurred. When GWD was >6 m, the vegetation VFC began to drop. When GWD was >10 m, VFC was less than 10% and began to transform into bare land (Figure 6).

4.3. Suggestions and Measures for Ecological Protection in Different Levels and Districts

Over-exploitation of groundwater in the Shiyang River Basin has been detrimental. Since the 1960s, the groundwater level has declined significantly [25,38,59], and the ecological environment has deteriorated considerably. Since the implementation of ecological protection measures (such as ecological water transfer and a limitation on groundwater extraction), the initial achievements of ecological restoration in some areas have appeared [25,37]. The shallow groundwater area (<10 m) in the basin is the key area for protection and the easiest area for governance. Therefore, due to differences in GWD, soil quality, and salinity, it is necessary to implement targeted ecological protection measures at different levels. For the existing shallow groundwater areas, the WW area has a small GWD and low soil salinity. Its vegetation should be mainly protected by forest farms and grasslands. Groundwater exploitation in the riparian zone should be restricted. At the same time, attention should be paid to the salinization of areas with a GWD of less than 2 m. The current ecological environment of QTH is significantly affected by ecological water transfer [24]. It is recommended to maintain the existing water transfer measures and gradually expand the impact on the ecological vegetation around the wetland. The soil salinity in the MQW and MQEW areas are not very high, and the main factor limiting VFC is a large GWD. By restricting groundwater exploitation in the irrigation area, planting and maintaining ecological forest construction, and expanding the ecological forests with small trees, we can expect ecological improvement, which may gradually serve as an effective barrier against the Badain Jaran Desert. The NH and MQEE areas had GWDs of less than 5 m, but the high soil salinity limited the VFCs of these areas. Salinization control measures should be adopted in these areas.

5. Conclusions

In this work, the soil moisture, soil salinity, GWD, and VFC were integrated to study the ecological relationship of groundwater–soil–vegetation in Shiyang River Basin. The role of GWD and soil salinity in desertification and salinization were innovatively analyzed, and the key GWD and soil salinity standard for ecological vegetation maintenance and restoration were proposed.
In the Shiyang River Basin, soil salinity is the factor most closely related to VFC and is inversely correlated with VFC (R = −0.4). High salinity can significantly limit VFC. When soil salinity is greater than 3 g/kg, VFC is generally less than 20%.
The surface vegetation community is dominated by shrubs and herbs. In the areas with soil salinity less than 3 g/kg, when GWD >10 m, the vegetation fractional coverage is usually less than 15%. For areas with GWD <10 m, when GWD >4 m, VFC and soil moisture content are positively correlated (R = 0.99), or significantly affected by annual rainfall, and vegetation growth mainly depends on surface soil moisture. When GWD <4 m, VFC and GWD are negatively correlated (R = −0.78), and vegetation growth mostly relies on groundwater and soil moisture.
The water–soil–ecological conditions of the shallow-buried areas of the Shiyang River Basin have obvious differences, and ecological management measures should be formulated in specific areas.
Further work is required to better understand the water use strategies of typical vegetation under different GWD and salinization levels. In addition, it is beneficial to ecological protection to study the causes of soil salinity difference in the transition area.

Author Contributions

Conceptualization, L.C. and Z.N.; methodology, L.C. and M.L.; formal analysis, L.C.; investigation, L.C., M.L., L.W., J.W. and Q.W.; data curation, M.L., J.W. and Q.W.; writing—original draft preparation, L.C.; writing—review and editing, L.C. and J.W.; supervision, Z.N.; funding acquisition, Z.N. and M.L. All authors have read and agreed to the published version of the manuscript.

Funding

This research was funded by the National Key R&D Program of China, grant number 2017YFC0406103; by the National Natural Science Foundation of China, grant nos. 41807214 and 41902262; by the China Geological Survey Project, grant number DD20190349.

Institutional Review Board Statement

Not applicable.

Informed Consent Statement

Not applicable.

Data Availability Statement

The data presented in this study are available on request from the corresponding author.

Acknowledgments

We thank Huixiong Lu and his team for their acquisition and collation of remote sensing data. Great thanks to the editors and anonymous reviewers for providing valuable comments that significantly improved this paper.

Conflicts of Interest

The authors declare no conflict of interest.

References

  1. Odorico, P.D.; Bhattachan, A.; Davis, K.F.; Ravi, S.; Runyan, C.W. Global desertification: Drivers and feedbacks. Adv. Water Resour. 2013, 51, 326–344. [Google Scholar] [CrossRef]
  2. Yang, X.; Zhang, K.; Jia, B.; Ci, L. Desertification assessment in China: An overview. J. Arid Environ. 2005, 63, 517–531. [Google Scholar] [CrossRef]
  3. Miyazono, S.; Patiño, R.; Taylor, C.M. Desertification, salinization, and biotic homogenization in a dryland river ecosystem. Sci. Total Environ. 2015, 511, 444–453. [Google Scholar] [CrossRef] [PubMed]
  4. Zhang, Z.; Huisingh, D. Combating desertification in China: Monitoring, control, management and revegetation. J. Clean. Prod. 2018, 182, 765–775. [Google Scholar] [CrossRef]
  5. Tao, W. Aeolian desertification and its control in Northern China. Int. Soil Water Conserv. Res. 2014, 2, 34–41. [Google Scholar] [CrossRef] [Green Version]
  6. Xu, H.; Ye, M.; Li, J. Changes in groundwater levels and the response of natural vegetation to transfer of water to the lower reaches of the Tarim River. J. Environ. Sci. 2007, 19, 1199–1207. [Google Scholar] [CrossRef]
  7. Zhao, M.; Wang, W.; Wang, Z.; Chen, L.; Ma, Z.; Wang, Q. Water use of Salix in the variably unsaturated zone of a semiarid desert region based on in-situ observation. J. Hydrol. 2020, 591, 125579. [Google Scholar] [CrossRef]
  8. Bhanja, S.N.; Malakar, P.; Mukherjee, A.; Rodell, M.; Mitra, P.; Sarkar, S. Using Satellite-Based Vegetation Cover as Indicator of Groundwater Storage in Natural Vegetation Areas. Geophys. Res. Lett. 2019, 46, 8082–8092. [Google Scholar] [CrossRef]
  9. Jin, X.; Wan, L.; Zhang, Y.; Xue, Z.; Yin, Y. A Study of the Relationship between Vegetation Growth and Groundwater in the Yinchuan Plain. Earth Sci. Front. 2007, 14, 197–203. [Google Scholar] [CrossRef]
  10. You, X.; Liu, J. Describing the spatial–temporal dynamics of groundwater-dependent vegetation (GDV): A theoretical methodology. Ecol. Model. 2018, 383, 127–137. [Google Scholar] [CrossRef]
  11. Zhang, H.; Wang, X.-S. The impact of groundwater depth on the spatial variance of vegetation index in the Ordos Plateau, China: A semivariogram analysis. J. Hydrol. 2020, 588, 125096. [Google Scholar] [CrossRef]
  12. Johansen, O.M.; Andersen, D.K.; Ejrnæs, R.; Pedersen, M.L. Relations between vegetation and water level in groundwater dependent terrestrial ecosystems (GWDTEs). Limnologica 2018, 68, 130–141. [Google Scholar] [CrossRef] [Green Version]
  13. Jin, X.; Hu, G.; Shi, X. Relationship between soil salinization and vegetation growing, groundwater depth in the Yinchuan Plain. Geoscince 2009, 23, 23–27. [Google Scholar]
  14. Yang, J.; Zhao, J.; Zhu, G.; Wang, Y.; Ma, X.; Wang, J.; Guo, H.; Zhang, Y. Soil salinization in the oasis areas of downstream inland rivers—Case Study: Minqin oasis. Quat. Int. 2020, 537, 69–78. [Google Scholar] [CrossRef]
  15. Sun, Q.; Zhang, P.; Sun, D.; Liu, A.; Dai, J. Desert vegetation-habitat complexes mapping using Gaofen-1 WFV (wide field of view) time series images in Minqin County, China. Int. J. Appl. Earth Obs. Geoinf. 2018, 73, 522–534. [Google Scholar] [CrossRef]
  16. Ding, C.; Zhang, L.; Liao, M.; Feng, G.; Dong, J.; Ao, M.; Yu, Y. Quantifying the spatio-temporal patterns of dune migration near Minqin Oasis in northwestern China with time series of Landsat-8 and Sentinel-2 observations. Remote Sens. Environ. 2020, 236, 111498. [Google Scholar] [CrossRef]
  17. Ren, X.; Yang, X.; Wang, Z.; Zhu, B.; Zhang, D.; Rioual, P. Geochemical evidence of the sources of aeolian sands and their transport pathways in the Minqin Oasis, northwestern China. Quat. Int. 2014, 334–335, 165–178. [Google Scholar] [CrossRef]
  18. Dong, Z.; Man, D.; Luo, W.; Qian, G.; Wang, J.; Zhao, M.; Liu, S.; Zhu, G.; Zhu, S. Horizontal aeolian sediment flux in the Minqin area, a major source of Chinese dust storms. Geomorphology 2010, 116, 58–66. [Google Scholar] [CrossRef]
  19. Feng, H.; Ochoa, C.G.; Xi, C.; Danrong, Z. Modeling oasis dynamics driven by ecological water diversion and implications for oasis restoration in arid endorheic basins. J. Hydrol. 2021, 593, 125774. [Google Scholar]
  20. Wang, J.; Xie, Y.; Wang, X.; Dong, J.; Bie, Q. Detecting Patterns of Vegetation Gradual Changes (2001–2017) in Shiyang River Basin, Based on a Novel Framework. Remote Sens. 2019, 11, 2475. [Google Scholar] [CrossRef] [Green Version]
  21. Li, L.; Wang, D.; Han, T. Spatial-temporal dynamics of vegetation coverage and responding to climate change in Shiyang River Basin during 2000–2015. J. Desert Res. 2018, 38. [Google Scholar] [CrossRef]
  22. Huang, F.; Chunyu, X.; Zhang, D.; Chen, X.; Ochoa, C.G. A framework to assess the impact of ecological water conveyance on groundwater-dependent terrestrial ecosystems in arid inland river basins. Sci. Total Environ. 2020, 709, 136155. [Google Scholar] [CrossRef] [PubMed]
  23. Huang, F.; Zhang, Y.; Zhang, D.; Chen, X. Environmental Groundwater Depth for Groundwater-Dependent Terrestrial Ecosystems in Arid/Semiarid Regions: A Review. Int. J. Environ. Res. Public Health 2019, 16, 763. [Google Scholar] [CrossRef] [PubMed] [Green Version]
  24. Chunyu, X.; Huang, F.; Xia, Z.; Zhang, D.; Chen, X.; Xie, Y. Assessing the Ecological Effects of Water Transport to a Lake in Arid Regions: A Case Study of Qingtu Lake in Shiyang River Basin, Northwest China. Int. J. Environ. Res. Public Health 2019, 16, 145. [Google Scholar] [CrossRef] [Green Version]
  25. Cao, L.; Nie, Z.; Liu, M.; Lu, H.; Wang, L. Changes in natural vegetation growth and groundwater depth and their relationship in the Minqin oasis in the Shiyang River Basin. Hydrogeol. Eng. Geol. 2020, 47, 25–33. [Google Scholar] [CrossRef]
  26. Jin, X.; Wang, S.; Xia, W. Response of vegetation to variation in climate and groundwater in the Qaidam Basin. Hydrogeol. Eng. Geol. 2016, 43, 31–36. [Google Scholar] [CrossRef]
  27. Jin, X. Quantitative relationship between the desert vegetation and groundwater depth in Ejina Oasis, the Heihe River Basin. Earth Sci. Front. 2010, 17, 181–186. [Google Scholar]
  28. Dang, X.; Lu, N.; Gu, X.; Jin, X. Groundwater threshold of ecological vegetation in Qaidam Basin. Hydrogeol. Eng. Geol. 2019, 46, 1–8. [Google Scholar] [CrossRef]
  29. Wang, J.; Zhang, G.; Cui, H.; Wang, Q.; Dong, H.; Hao, J. System index attribute and application of groundwater function zoning in northwest inland area of China. Shuili Xuebao 2020, 51, 796–804. [Google Scholar]
  30. Wang, J.; Zhang, G.; Yan, M.; Tian, Y.; Wang, Q. Index weight analysis of groundwater function evaluation and zoning system in arid areas. Trans. Chin. Soc. Agric. Eng. 2020, 36, 133–143. [Google Scholar] [CrossRef]
  31. Liu, F.; Chen, P.; Yu, H.; Ma, J. Spatial distribution characteristics of soil water and salt under different land use types in Minqin Oasis. Arid Land Geogr. 2020, 43, 406–414. [Google Scholar] [CrossRef]
  32. Ma, Z.; Kang, S.; Zhang, L.; Tong, L.; Su, X. Analysis of impacts of climate variability and human activity on streamflow for a river basin in arid region of northwest China. J. Hydrol. 2008, 352, 239–249. [Google Scholar] [CrossRef]
  33. Wang, X.; Chen, X.; Ding, Q.; Zhao, X.; Wang, X.; Ma, Z.; Lian, J. Vegetation and soil environmental factor characteristics, and their relationship at different desertification stages: A case study in the Minqin desert-oasis ecotone. Acta Ecol. Sin. 2018, 38, 1569–1580. [Google Scholar]
  34. Zhang, Y.; Chang, Z. Study on the dynamic vegetation degeneration in the Minqin Desert Area. Arid Zone Res. 2008, 25, 16–21. [Google Scholar] [CrossRef]
  35. Liu, H.; Liu, S.; Li, Y.; Yang, Z.; Li, Y. Response of riparian vegetation to the change of groundwater level at middle and lower reaches of the Shiyang River. Arid Zone Res. 2012, 29, 335–341. [Google Scholar]
  36. Kang, S.; Xiaoling, S.U.; Tong, L.; Shi, P.; Yang, X.; Abe, Y.; Taisheng, D.U.; Shen, Q.; Zhang, J. The impacts of human activities on the water-land environment of the Shiyang River basin, an arid region in northwest China. Hydrol. Sci. J. 2004, 49, 413–427. [Google Scholar] [CrossRef]
  37. Hao, Y.; Xie, Y.; Ma, J.; Zhang, W. The critical role of local policy effects in arid watershed groundwater resources sustainability: A case study in the Minqin oasis, China. Sci. Total Environ. 2017, 601–602, 1084–1096. [Google Scholar] [CrossRef] [PubMed]
  38. Yue, S.; Kang, S.Z.; Li, F.S.; Lu, Z. Comparison of interpolation methods for depth to groundwater and its temporal and spatial variations in the Minqin oasis of northwest China. Environ. Model. Softw. 2009, 24, 1163–1170. [Google Scholar]
  39. Zhao, P.; Xu, X.; Qu, J.; Zhang, J.; Ma, Q.; Zhang, H.; Xu, G.; Ma, J.; WU, Y. Relationships between artificial Haloxylon ammodendron communities and soil-water factors in Minqin oasis-desert ecotone. Acta Ecol. Sin. 2017, 37, 1496–1505. [Google Scholar] [CrossRef] [Green Version]
  40. Bao, S. Soil Agro-Chemistrical Analysis; China Agriculture Press: Beijing, China, 2005. [Google Scholar]
  41. Tian, F.; Zhang, Y.; Lu, S. Spatial-temporal dynamics of cropland ecosystem water-use efficiency and the responses to agricultural water management in the Shiyang River Basin, northwestern China. Agric. Water Manag. 2020, 237, 106176. [Google Scholar] [CrossRef]
  42. Wei, W.; Xie, B.; Zhang, X.; Zhang, J. Spatial Heterogeneity of Soil Moisture and Vegetation Cover in Shiyang River Basin, Northwest China. Earth Environ. Sci. 2019, 237, 052003. [Google Scholar] [CrossRef]
  43. Zhang, S.; Ye, Z.; Chen, Y.; Xu, Y. Vegetation responses to an ecological water conveyance project in the lower reaches of the Heihe River basin. Ecohydrology 2017, 10, e1866. [Google Scholar] [CrossRef]
  44. Li, M.; Wu, B.; Yan, C.; Zhou, W. Estimation of vegetation fraction in the upper basin of Miyun Reservoir by remote sensing. Resour. Sci. 2004, 26, 153–159. [Google Scholar]
  45. Zhang, Y.; Zhu, G.; Ma, H.; Yang, J.; Pan, H.; Guo, H.; Wan, Q.; Yong, L. Effects of Ecological Water Conveyance on the Hydrochemistry of a Terminal Lake in an Inland River: A Case Study of Qingtu Lake in the Shiyang River Basin. Water 2019, 11, 1673. [Google Scholar] [CrossRef] [Green Version]
  46. Mo, K.; Chen, Q.; Chen, C.; Zhang, J.; Wang, L.; Bao, Z. Spatiotemporal variation of correlation between vegetation cover and precipitation in an arid mountain-oasis river basin in northwest China. J. Hydrol. 2019, 574, 138–147. [Google Scholar] [CrossRef]
  47. Chai, C.; Xu, X.; Tang, W.; Wang, F.; Wang, L. Root system of the main sand fixing plants in desert zone of Shiyanghe River Basin. J. Northwest For. Univ. 2009, 24, 21–26. [Google Scholar]
  48. Sheng, J.; Qiao, Y.; Liu, H.; Zhai, Z.; Guo, Y. A study on the root system of Haloxylon Aammodendron (C. A. Mey.) Bunge. Acta Agrestia Sin. 2004, 12, 91–94. [Google Scholar]
  49. Dong, Z.; Li, S.; Zhao, Y.; Lei, J.; Li, C. Stable oxygen-hydrogen isotopes reveal water use strategies of Tamarix taklamakanensis in the Taklimakan Desert, China. J. Arid Land 2020, 12, 115–129. [Google Scholar] [CrossRef] [Green Version]
  50. Kebin, Z. The growth of man-made forests of Haloxylon ammodendron and their soil water contents in the Minqin desert region, Gansu Province, China. J. Arid Environ. 1989, 17, 109–115. [Google Scholar] [CrossRef]
  51. Editorial board of Flora of China. Flora of China; Science Press: Beijing, China, 1979; Volume 25, p. 18. [Google Scholar]
  52. Liu, H.; Wang, J.; Chang, Z.; Ma, Q.; Yang, Z.; Zhan, K. Characteristics of desert flora and vegetation in lower reach of Shiyang River Basin. Chin. J. Ecol. 2006, 25, 113–118. [Google Scholar]
  53. Ehleringer, J.R.; Phillips, S.L.; Schuster, W.S.F.; Sandquist, D.R. Differential utilization of summer rains by desert plants. Oecologia 1991, 88, 430–434. [Google Scholar] [CrossRef]
  54. McLendon, T.; Hubbard, P.J.; Martin, D.W. Partitioning the use of precipitation- and groundwater-derived moisture by vegetation in an arid ecosystem in California. J. Arid Environ. 2008, 72, 986–1001. [Google Scholar] [CrossRef]
  55. Horton, J.L.; Clark, J.L. Water table decline alters growth and survival of Salix gooddingii and Tamarix chinensis seedlings. For. Ecol. Manag. 2001, 140, 239–247. [Google Scholar] [CrossRef]
  56. Fu, B.; Burgher, I. Riparian vegetation NDVI dynamics and its relationship with climate, surface water and groundwater. J. Arid Environ. 2015, 113, 59–68. [Google Scholar] [CrossRef]
  57. Amezketa, E. An integrated methodology for assessing soil salinization, a pre-condition for land desertification. J. Arid Environ. 2006, 67, 594–606. [Google Scholar] [CrossRef]
  58. Thomas, D.S.G.; Middleton, N.J. Salinization: New perspectives on a major desertification issue. J. Arid Environ. 1993, 24, 95–105. [Google Scholar] [CrossRef]
  59. Yang, H.; Feng, Q.; Guo, X. Variation of groundwater depth and its influence factors in the Minqin Oasis in 1999-2013. J. Desert Res. 2017, 37, 562–570. [Google Scholar] [CrossRef]
Figure 1. Remote-sensing image and sampling plots of the lower reaches of Shiyang River Basin.
Water 13 01642 g001
Figure 2. Surface soil moisture and salinity in different sampling sites: (a) surface soil moisture; (b) surface soil salinity.
Water 13 01642 g002
Figure 3. Distribution of groundwater depth (GWD) and vegetation fractional coverage (VFC).
Water 13 01642 g003
Figure 4. Vegetation fractional coverage and groundwater depth in different sampling sites: (a) vegetation fractional coverage; (b) groundwater depth.
Water 13 01642 g004
Figure 5. Statistics of vegetation community structure types and vegetation fractional coverage.
Water 13 01642 g005
Figure 6. The vegetation fractional coverage (VFC) with different soil salinity and groundwater depth of the Shiyang River Basin.
Water 13 01642 g006
Figure 7. Variation of groundwater depth from 1980 to 2016.
Water 13 01642 g007
Figure 8. Normalized difference vegetation index (NDVI) changes in different zones from 1980 to 2016. (a) NH; (b) WW; (c) QTH; (d) MQW; (e) MQEW; (f) MQEE.
Water 13 01642 g008aWater 13 01642 g008b
Figure 9. Meteorological changes in Minqin from 2004 to 2016.
Water 13 01642 g009
Figure 10. NDVI and meteorological factors changes in different zones from 2004 to 2016.
Water 13 01642 g010
Figure 11. Relationship between vegetation fractional coverage (VFC) and soil moisture and groundwater depth (GWD): (a) VFC–soil moisture; (b) VFC–GWD.
Water 13 01642 g011
Figure 12. (a) Sketch of root distribution in the profiles of different groundwater depth in Shiyang River Basin; (b) Reaumuria soongorica; (c) Tamarix.
Water 13 01642 g012
Figure 13. Ecological evolution process of desertification and salinization in shallow groundwater area of Shiyang River Basin. The circle size of each area represents the mean value of the number of vegetation species in the area, with the minimum of 2.6 and the maximum of 5.2; green represents the level of VFC, blue represents the level of salinization, and orange represents the level of desertification.
Water 13 01642 g013
Figure 14. Statistics of species number, VFC and number of quadrats.
Water 13 01642 g014
Table 1. Sampling sites information and the vegetation communities.
Site AbbreviationLandformNumber of QuadratsGroundwater Depth (m)Vegetation TypesTypical Communities
NHOasis–Desert Transition Zone/Wetland171.4–5.9Shrubs/HerbsHaloxylon ammodendron/Kalidium foliatum
WWRiparian zone261.3–6.0Trees/Shrubs/HerbsElaeagnus angustifolia/Tamarix spp./Achnatherum splendens
QTHDesert/Wetland241.1–4.0Shrubs/HerbsKalidium foliatum/Phragmites australis
MQWOasis–Desert Transition Zone89.0–17.8Shrubs/HerbsHaloxylon ammodendron/Tamarix spp.
MQEWOasis–Desert Transition Zone155.2–20.8Shrubs/HerbsHaloxylon ammodendron/Nitraria spp.
MQEEOasis–Desert Transition Zone141.97–5.0Trees/Shrubs/HerbsKalidium foliatum/Achnatherum splendens
Table 2. Correlation analysis between NDVI and meteorological factors in different zones.
RWWNHMQWMQEWMQEEQTH
n121231154
PRE/mm0.630.30−0.430.17−0.05−0.13
TEM/°C−0.29−0.15−0.05−0.06−0.120.49
RH/%0.230.03−0.250.040.09−0.37
R: 0 Water 13 01642 i001 1
Publisher’s Note: MDPI stays neutral with regard to jurisdictional claims in published maps and institutional affiliations.

