Article

The Value of Water—Estimating Water-Disruption Impacts on Businesses

1
RISE Research Institutes of Sweden, Box 857, 501 15 Borås, Sweden
2
Department of Architecture and Civil Engineering, Chalmers University of Technology, 412 96 Göteborg, Sweden
3
Swedish National Road and Transport Research Institute, Box 55685, 102 15 Stockholm, Sweden
*
Author to whom correspondence should be addressed.
Water 2021, 13(11), 1565; https://doi.org/10.3390/w13111565
Submission received: 24 March 2021 / Revised: 28 May 2021 / Accepted: 29 May 2021 / Published: 1 June 2021
(This article belongs to the Special Issue Risk Assessment and Decision Support in Drinking Water Systems)

Abstract

:
As water serves as a necessary and often irreplaceable input in a range of goods and services, a disruption in water supply can cause lost production and sales for businesses. Thus, large benefits may be generated by reducing the risk of water disruptions. To enable selection of economically viable risk mitigation measures, the investment costs should be weighed against the benefits of risk mitigation. Consequently, quantitative estimates of the consequences of disruptions need to be available. However, despite the importance of water to businesses, the literature on their financial losses due to short and long-term water disruptions is still scarce. The aim of this paper is to estimate time-dependent water supply resiliency factors for economic sectors, i.e., a metric focusing on the level of output that businesses can uphold during a disruption, to contribute to better decision support for water supply planning and risk management. An online survey was used to gather data from 1405 companies in Sweden on consequences of complete and unplanned water supply outages. Results show that Food, beverage and tobacco manufacturing and Accommodation and food services are the two most severely affected sectors over all analyzed disruption durations.

1. Introduction

It is estimated that about 42% of the world’s total active workforce is working in heavily water-dependent sectors, i.e., sectors requiring a significant amount of water as a necessary input to their activities and/or production processes [1]. An additional 36% of the workforce is working in moderately water-dependent sectors. These are sectors that do not require significant amounts of water to realize most of their operations, but for which water is a necessary part of the value chains. Water is thus indistinguishably linked to economic growth. At the same time, economic development and growth place considerable pressure on water resources and challenges water security for businesses as well as humans and nature [2]. Climate change, deteriorating infrastructure, population growth and urbanization contribute with additional threats to water security, providing risks for both short and long-term disruptions in water supply. In recent years, both the likelihood and the severity of water disruption events have increased, both in the European Union and around the world [3,4]. As a disruption in the water supply can force businesses to production slowdown or shut down [5,6], threats to uninterrupted water services are acknowledged as significant business risks in many economic sectors [7].
Reducing the risk of short and long-term water disruption events, for businesses as well as the society in general, can generate a range of public and private benefits. To facilitate water supply planning and selection of economically viable risk mitigation measures, the investment costs of alternative options should be weighed against the benefits of risk mitigation [5,8]. For this to be successful, quantitative estimates of the economic consequences of disruption, including residential welfare losses and business losses, need to be available. However, despite the importance of water to businesses, the literature on their economic disruption impacts is still scarce [9]. The main focus in literature has so far been targeted towards economic impacts of long-term disruptions due to major natural disasters, e.g., [10]. The research has largely been conducted using either empirical studies of businesses affected by actual disasters or by modeling, using e.g., input–output models or computable general equilibrium models [11,12]. Surveys and models have also been used to investigate preparedness and potential impacts of hypothetical disaster events [11]. One of the quantitative measurements used to assess business losses is the resiliency factor, i.e., a metric between 0 and 1 focusing on the level of output that the businesses in specific economic sectors can uphold during a water supply, or other lifeline, disruption. The Applied Technology Council (ATC) [13] provided early resiliency (or importance) factors, based on expert opinion, for month-long water disruptions due to earthquakes. Although old, these factors are still often used in the United States together with GDP data to estimate direct economic impact for businesses and to compare the benefits of alternative options [14]. More recently, Chang, et al. [15] and Kajitani and Tatano [16] estimated resiliency factors for 16 and 27 economic sectors, respectively, based on surveys of American and Japanese earthquakes. However, while the economic consequences of long-term water disruptions due to earthquakes and other major disasters may be large, the frequency with which they occur tends to be rather low [17]. Short-term disruption events are not evaluated as often as major disasters but may contribute significantly to the total economic losses due to their much higher frequency [18].
In Sweden, the number of annual pipe bursts is usually used as a measure of (short-term) water disruptions and the disruption length is typically assumed to be approximately 5 h per burst. In 2018, there were about 8500 pipe bursts on the 111,700 km long public pipe network [19]. However, apart from pipe bursts, water disruptions can also occur due to other events related to the distribution systems, e.g., pump failures, or events related to the raw water systems, e.g., insufficient water quality or quantity, or to the treatment systems, e.g., operational errors and component failures in treatment plants [20,21,22,23]. According to the Swedish Water Services Act [24], the responsibility of the municipalities (i.e., the public water providers) is primarily to provide drinking water for residential use. The supply of water for other uses is based on voluntary commitments on the part of the municipalities. This means that in an emergency water situation, when there is not enough water for everyone, prioritizing companies over households may be in violation of the law. Despite this, many businesses expect a 24-h supply of public drinking water and that their businesses will be prioritized in case of an emergency [25]. The lack of awareness and preparedness in the business community in combination with the potentially large economic consequences of water outages calls for an improved dialog between municipalities and businesses along with comprehensive water supply planning to mitigate both emergency events and foreseeable events (e.g., extreme drought). For this, information is needed on how water disruptions affect different user groups [25]. There is hence a need for more data gathering on economic consequences of water disruptions, particularly the short-term disruptions, to more accurately weigh potential benefits and costs of improvement measures in the public supply system.
The overall aim of this paper is to improve the understanding of the economic value that water and water services generate for businesses, and by that, advance the evaluations and comparisons of public water security improvement efforts. Specific objectives are to: (1) investigate direct economic business losses of short and long-term water supply outages, i.e., complete and unplanned disruptions of water; and (2) estimate time-dependent water supply resiliency factors based on survey data from Swedish economic sectors by integrating over outage duration and recovery time. The findings of the paper make an important contribution to the water disruption literature by providing information on the short-term effects on businesses and the changes in economic losses over time and among sectors. The results are expected to provide input to better decision support to advance public, and to some extent also private, planning and risk management. One possible use of the results is to combine the resiliency factors with information on the sectors’ contributions to GDP and the likelihood of short and long-term water outages, to provide estimates of expected economic benefits of alternative risk mitigation options [14].

2. Materials and Methods

The main steps of the methodology are schematically described in Figure 1. The first steps include the design and test of a questionnaire to gather data from Swedish companies on water disruptions. This was followed by steps to spread information about the survey and to collect data from responding companies. The last steps include data analysis and calculations to provide time dependent resiliency factors for each analyzed economic activity sector. The steps are further explained in the following text.

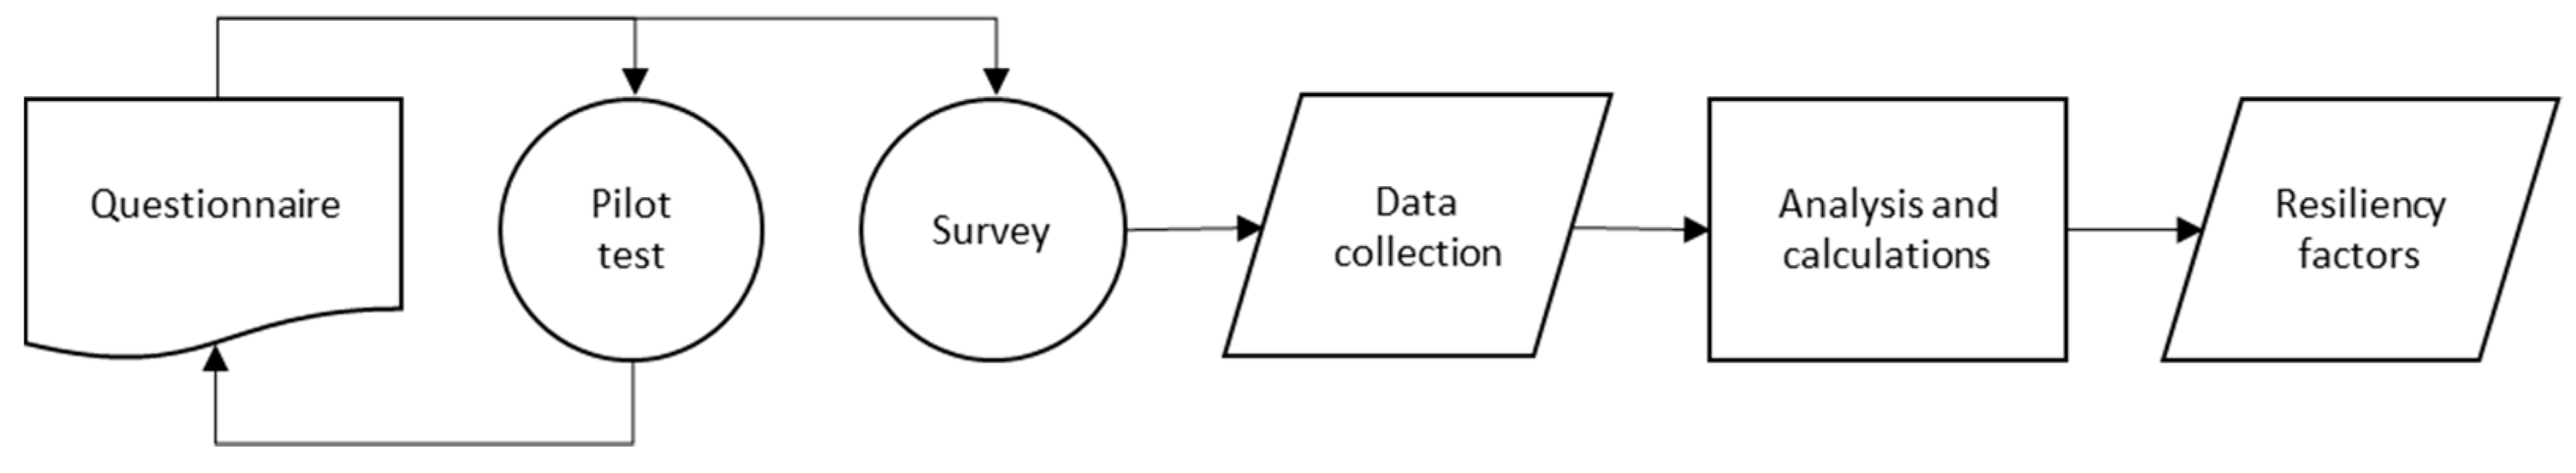
2.1. Data Collection

An online questionnaire was designed to gather qualitative and quantitative data on unplanned water outages from companies and organizations in the following economic activity sectors, categorized according to the European statistical classification of economic activities (NACE) [26]: A. Agriculture, forestry and fishing; B. Mining and quarrying; C. Manufacturing; D. Electricity, gas, steam and air; E. Water, sewerage, waste and remediation; F. Construction; G. Wholesale, retail and repair of motor vehicles; H. Transportation and storage; I. Accommodation and food service; J. Information and communication; K. Financial and insurance activities; L. Real estate activities; M. Professional, scientific and technical activities; N. Administrative and support service activities; O. Public administration and defense; P. Education; Q. Human health and social work activities; R. Arts, entertainment and recreation; and S. Other service activities. The data were collected at the NACE hierarchical level of divisions, identified by two-digit numerical codes. Both companies and other organizational units will be referred to as companies in the following text.
The questionnaire was based on a mix of open-ended and multiple-choice questions, consisting of a total of eight questions (see Questionnaire S1 for details): (1) whether the company uses public water, private water or both; (2) if private water, which type of water the company uses; (3) what proportion of value added (in percent of normal business activity) the company can maintain during a water disruption that lasts for: 2 h, 4 h, 12 h, 24 h, 1 week, and 1 month; (4) the reason for lost value added, if any; (5) how long it will take the company to recover after a water disruption that lasts for: 2 h, 4 h, 12 h, 24 h, 1 week, and 1 month; (6) if the company have access to supplementary water and if so, which kind; (7) if the company has taken any other measures so as not to be affected by water disruptions and if so, which; and (8) if the company has experienced an unplanned water disruption event during the last five years. Some administrative questions were also included.
To test the questions and online methodology, a pilot survey was conducted in which ten private companies from Accommodation and food services, Food, beverage and tobacco and Mining and quarrying sectors were asked to respond and comment on the survey. The pilot led to some adjustments of question formulations. After this, the link to the online survey was distributed both by mail, to companies randomly singled out by Statistics Sweden to represent the above-mentioned economic activity sectors, and through trade associations’ websites and newsletters. A total of 1405 companies responded to the questionnaire survey, which was kept open to different sectors for two rounds of about 3 weeks each in the fall of 2019 and 2020, respectively.

2.2. Data Analysis

Following Lizarraga [18] and Rose [27], resilience is here defined as the ability of a sector to maintain its function during disruption and recover quickly. The water supply resiliency factor, i.e., a metric between 0 and 1 focusing on the level of output that the businesses can uphold during and after a water supply disruption event, is estimated by the ratio of maintained value added during and after a water outage event to the value added during normal business activity (see Equation (1) below). This is similar to how e.g., Kajitani and Tatano [16] calculate resiliency factors, but with focus on value added instead of production level. The reason to forgo production as performance metric is that some companies can alter their business activity during outage events and thus maintain the level of production but possibly not the level of value added. Value added is also a preferred performance metric as it avoids double counting intermediate sectors and production performed outside the analyzed region [18]. Value added is the difference between the production value and the cost of the inputs involved in making it. It is a measure of the companies’ contribution to the GDP.
To calculate sector-specific resiliency factors, the following steps and simplifications were made. Firstly, in the questionnaire the respondents were asked to estimate their maintained value added during a water outage and could choose between answers of 100%, 80–99%, 60–79%, 40–59%, 20–39%, 1–19% and 0%. Responses indicating an interval were assumed to belong to the mean of that interval, i.e., respondents indicating 80–99% were assigned an 89.5% maintained value added. Secondly, a linear relationship was assumed between data points of maintained value added for different disruption durations as well as between data points of disruption end time and recovery end time (schematic description in Figure 2).
The fraction of the maintained value added at time t for company c in sector s is denoted by fc,s(t), illustrated by the sample points in Figure 2. The shaded area under the curve thus represents the total maintained value added. Dividing this by the value added of normal business activity (1∙ttot), where ttot is the total time of disruption and recovery, gives the water supply resiliency factor rc,s:
r c , s = 1 t t o t 0 t t o t f c , s ( t ) d t
To summarize these results for each sector, the mean resiliency factor across companies was calculated. In line with Kajitani and Tatano [16], all companies within a sector are here equally weighted, irrespective to business size. For resiliency factor calculation, the trapezoidal rule was used for approximation of the integral [28].
The 25th and 75th percentiles, as well as the 90% confidence interval, were calculated to illustrate variability with respect to differences in companies’ resilience and the number of respondents. To describe the total time the companies are affected, a time factor is also calculated for each company as t-factor = ttot/tdur where tdur is the disruption duration.
To probe the reliability of the approach and data, we looked at the variability of mean and percentile values across 10,000 bootstrap samples of the original dataset. Each bootstrapped sample was created by selecting n resiliency factors from the original dataset with replacement, where n is the number of responding companies in each sector. Mean and 25th and 75th percentiles were calculated for each bootstrapped dataset giving rise to 10,000 such values. The standard deviations of these were then calculated, providing an estimate of the standard error of the corresponding values from the original dataset. This shows the sensitivity of the results with respect to the selected companies among the respondents.

3. Results

The survey was answered by 1405 individual companies (see Table 1 for descriptive statistics). Categorized by number of employees only, most surveyed companies (74%) are classified as small enterprises [29] with fewer than 50 employees. This can be compared to the large proportion of small enterprises (99%) throughout Sweden [30]. The majority (83%) of the surveyed companies are supplied by public water only; however, the percental dependence on public water varies between the sectors. Thirty-six percent of all companies had experienced an unplanned water disruption in the last five years, varying between 11 and 62% for the various economic activity sectors.
It is worth noting that all sectors, based on survey mean values, are affected already by a 2-h disruption, ranging from a 7% reduction in value added in the Information and communication sector to 62% reduction in the Food, beverage and tobacco sector. The reduction in value added increases with the disruption duration and varies between 13 and 75% for a 4-h disruption, 23 and 90% for a 12-h disruption, 26 and 94% for a one-day disruption, 34 and 96% for a one-week disruption, and 38 and 97% for a one-month disruption (mean values per sector). However, a fairly large proportion of the companies can maintain a normal business activity (100% value added) throughout a water outage: 48% of all companies during a 2-h disruption, 34% during a 4-h disruption, 25% during a 12-h disruption, 23% during a one-day disruption, 18% during a one-week disruption, and 16% of all companies during a one-month disruption.
The average reduction in value added during water disruptions of different durations is shown for the non-manufacturing sectors in Figure 3 and for the manufacturing sectors in Figure 4. Based on mean values, Food, beverage and tobacco along with Accommodation and food services are the two overall most affected sectors. For these two sectors, the value added is reduced by 62 and 60%, respectively, already after 2 h without water. At a month-long water outage, the corresponding reductions are 93 and 97%, respectively. Perhaps not surprisingly, Forestry and logging is the least affected sector in the event of a water supply disruption.
Between 2 and 18% of the companies, in all sectors except the Financial and insurance, Real estate, Printing and recorded media, Coke and petroleum, and Accommodation and food services sectors, responded they had access to supplementary water in the form of their own groundwater or surface water resources (Figure S1). In the Crop and animal production, Forestry and logging and Fishing and aquaculture sectors, the corresponding numbers were 41, 33 and 60%, respectively. Between 9 and 30% of the companies in the service sectors (NACE codes F to S), except the Accommodation and food sector, responded that they can meet their water needs by purchasing water from a grocery store during disruptions.
When asked about other resilience measures to reduce the risk of being affected by water disruptions, between 50 and 100% of companies in each sector responded that they had neither taken nor planned any risk reducing measures (Figure S2). In the service sectors (NACE codes F to S), again except the Accommodation and food sector, between 3 and 15% of the companies responded that they can temporarily alter their business activity during disruptions. Of all companies, only 2% responded that they had invested or planned to invest in water efficient technologies.
Most companies stated that a reduced value added during water disruptions (Figure 3 and Figure 4) was due to either their production being dependent on water (37% of the companies) or that they chose to slow down production due to lack of water for sanitary and hygienic purposes (39% of the companies). However, lack of water for firefighting was also cited as a reason (9% of the companies), particularly by the Wood products and Furniture sectors.
Table 2 shows the calculated water supply resiliency factors (calculated according to Equation (1) as the ratio of maintained value added during and after a water outage event to the value added during normal business activity) and the time factors (calculated as the ratio of total time for disruption and recovery to the disruption duration, t t o t t d u r ) for all sectors and water-disruption durations. For a two-hour disruption, the resiliency factors for the different sectors vary between 0.69 and 0.97. For a month-long disruption, the resiliency factor varies between 0.10 and 0.83, but for most sectors it is between 0.4 and 0.6. And as previously notated, the Food, beverage and tobacco and the Accommodation and food services sectors are the two most severely affected, with one-month resiliency factors of 0.11 and 0.10, respectively. In Table S1, the confidence intervals and 25th and 75th percentiles of the resiliency factors are presented, demonstrating that the resiliency factor variation typically increases with increased disruption duration within each sector. Table S2 presents the standard errors of the mean, and of the 25th and 75th percentiles, providing insights into the generalization ability of the presented resiliency factors.
For shorter disruption durations, up to 24 h, the mean recovery time was less than a day for all sectors except the Chemical and pharmaceutical, Food, beverage and tobacco, Crop and animal, Forestry and logging, Accommodation and food, and Electricity, gas, steam and air sectors (see the time factors in Table 2). The mean recovery time for the longer disruptions of a week and a month varied between a few hours and six days. However, several companies responded that they could not recover at all from the disruptions and would have to file for bankruptcy. After a week-long water outage, 2.5% of all companies responded that they would have to file for bankruptcy. After a month-long outage, 5.5% of all companies would have to file for bankruptcy. This was most palpable in the Crop and animal production sector, in which 39% of the companies would have to file for bankruptcy after a month-long water outage.
It is important to note that the water supply resiliency factor is a measure of the maintained value added over the total time of disruption duration and recovery time. Thus, when using the resiliency factors for estimating economic losses due to water disruptions of specific durations, the recovery time must also be considered. This is done by use of the time factors in Table 2.

4. Discussion

Businesses and water providers are faced with multiple risks associated with the availability of water. An expected increase in the frequency and severity of water scarcity events, a deteriorating water infrastructure and possible operational water supply failures, are all examples of the range of risk scenarios, associated with low to high probability disruption events, that both businesses and water providers need to consider. The purpose of this paper is to increase our understanding of the economic consequences that short and long-term water supply disruptions can give rise to, and thereby improve our assessments, comparisons and decisions on potential risk mitigation measures. This to improve our water supply planning and risk management. The results show that already very short water disruption events can cause extensive consequences for individual companies by forcing them to slow down their business activities. For instance, a 2-h disruption will cause 87% of the surveyed companies in the Food, beverage and tobacco sector and 76% of the companies in the Chemical and pharmaceutical sector to decrease their business activity. These two sectors were shown to be the most severely affected manufacturing sectors, with one-month resiliency factors of 0.11 and 0.23, respectively, compared to an average of 0.51 for the other manufacturing sectors. This result, i.e., the limited ability of these two sectors to maintain their function during a water supply outage, is in line with resiliency factors estimated for Japanese industries by Kajitani and Tatano [16]. In the USA, however, ATC [13] found that the metal products and electronics sectors were the most severely affected. When compared to the manufacturing resiliency factors derived by Chang, Svekla and Shinozuka [15], for outage durations of less than one week, one to two weeks, and two weeks or more, the resiliency factors from this paper are consistently higher for each corresponding outage duration. The differences in study results may be due to both country specific conditions and different methodologies and research focus, e.g., major disaster versus everyday events.
As noted above, the economic consequences of water supply disruptions vary among the economic activity sectors, and the calculated resiliency factors are based on the consequences both during the water outage and during the recovery. Recovery time is here defined as the time it takes for a company to return to normal business activity after the water supply is restored. A large proportion of the companies (between 62% of all companies after a two-hour disruption to 37% after a one-month disruption) responded that they can return to normal business activity directly after the water supply is restored. However, the survey also shows that several companies cannot recover at all after longer water supply disruptions and must file for bankruptcy. It is important to clarify that no recovery time was included in the calculation of resiliency factors for those companies that responded that they are going bankrupt. Bankruptcy is thus seen as a cost that must be considered in addition to the lost value added when estimating the total effects of water supply disruptions.
To exemplify the use of the resiliency factors for water supply planning and management, we estimate the annual cost due to pipe bursts in an example municipality with 150,000 residents representing a large Swedish municipality. Based on statistics from the Swedish Water and Wastewater Association (SWWA) [31], we can assume that there are on average 115 pipe bursts per year in the municipality. In accordance with SWWA’s standard values, each pipe burst is on average expected to result in a five-hour water disruption [32]. Furthermore, based on SWWA statistics, approximately 4.5% of the residents are assumed to be affected by a water disruption due to pipe bursts each year [31]. We assume that both residents and companies are evenly distributed in the municipality, and hence also expect that 4.5% of the companies are affected by water disruptions due to pipe bursts each year. Using national (or regional if available) GDP data per capita for the economic sectors [33], we can calculate the affected companies’ (i.e., 4.5% of the companies in each sector) total value added during normal business activity in the 150,000-resident municipality (~2.0 million SEK; 10 SEK ~ 1 USD) for the estimated water outage duration of 5 h and additional recovery time for each sector (t-factor in Table 2). By multiplying the value added by each sector with the respective resiliency factor for a four-hour disruption, which is the closest resiliency factor duration to the desired five hours, we can calculate the sectors’ total maintained value added during the water outages (~1.7 million SEK). Hence, the annual business-related cost in the municipality due to pipe bursts is approximately 300,000 SEK. This information, of the total annual cost of water supply disruptions due to pipe bursts, can then be used to guide and support water supply management decisions. For example, as most water providers face difficult decisions on resource allocation and prioritizations of risk mitigation measures, this information can be used to compare the costs and benefits of reducing the risks of pipe bursts with the costs and benefits of other potential improvement measures and with the option of doing no improvements at all. Hence, the resiliency factors provided by the manuscript can be used as input parameters in, for example, risk assessments, cost-benefit-analyses or sustainability assessments, which in turn can form the basis for water resources planning and management. The contribution by the manuscript is thus in the form of background data on socio-economic consequences, something that is all too often lacking in order to carry out relevant socio-economic assessments for improved planning and management. It is important here to point out that effects on households, reparation costs and other relevant effects also should be considered when estimating total water disruption effects on society.
A disruption in the water supply can generate significant economic losses for both individual companies and wider society, and the need for (re)investments and improvement measures to uphold a reliable water supply provision is large, both globally and in Sweden [34]. Currently, about 12 billion SEK (approx. 1.3 billion USD) is invested annually in the water and wastewater infrastructure in Sweden. It is estimated that this number must increase by 35% over the next 20 years to maintain the level of water security in the country. Together with costs for converting residential areas from private water to public water, the renewal needs of the pipe network constitutes the largest proportion of this estimated investment need [35]. However, it is important to note that other parts of the public drinking water system must also be maintained in order to uphold a secure water supply.
Companies often fail to consider how dependent they are of uninterrupted lifeline services, such as a continuous water supply provision [36]. This is also indicated by the survey results, in which 80% of all companies responded that they had not taken any measures to reduce the risk of being affected by water disruption. Four percent of the companies responded that they had performed a risk analysis and taken relevant precautions. Seven percent responded that they can temporarily alter their business activity. To raise awareness in the business community of potential improvement measures and provide incentives for a better prepared and more resilient society, the Swedish government is currently developing a national strategy for efficient and sustainable water management [37].
Short-duration-high-probability events have not been studied as thoroughly as long-term disruptions but may contribute significantly to the total economic losses due to their much higher frequency. This lack of good and relevant data affects the quality of socio-economic and risk assessments, thereby limiting their usefulness and credibility as planning tools when comparing alternative improvement measures [2]. The findings of this paper therefore make an important contribution to the water disruption literature by providing information on the short-term effects on businesses and the changes in economic losses over time and among sectors. Understanding of how companies are affected by disruptions is of great importance for understanding society’s vulnerability. The results of this paper can be used to estimate business losses of current water disruptions and the value of avoiding future disruptions. The results can therefore contribute with useful information for improved decision support for water supply planning and management, where trade-offs can be made between performance, risk and finances in a structured and transparent way. The results can also be used to identify the economic activity sectors with the largest potential of reducing the total economic losses for society. Important next steps are to more thoroughly study business preparedness, response and recovery. Future work should also focus on the additional benefits that an improved preparedness and an effective management of water disruption risks can bring to society.

5. Conclusions

The conclusions of this paper are:
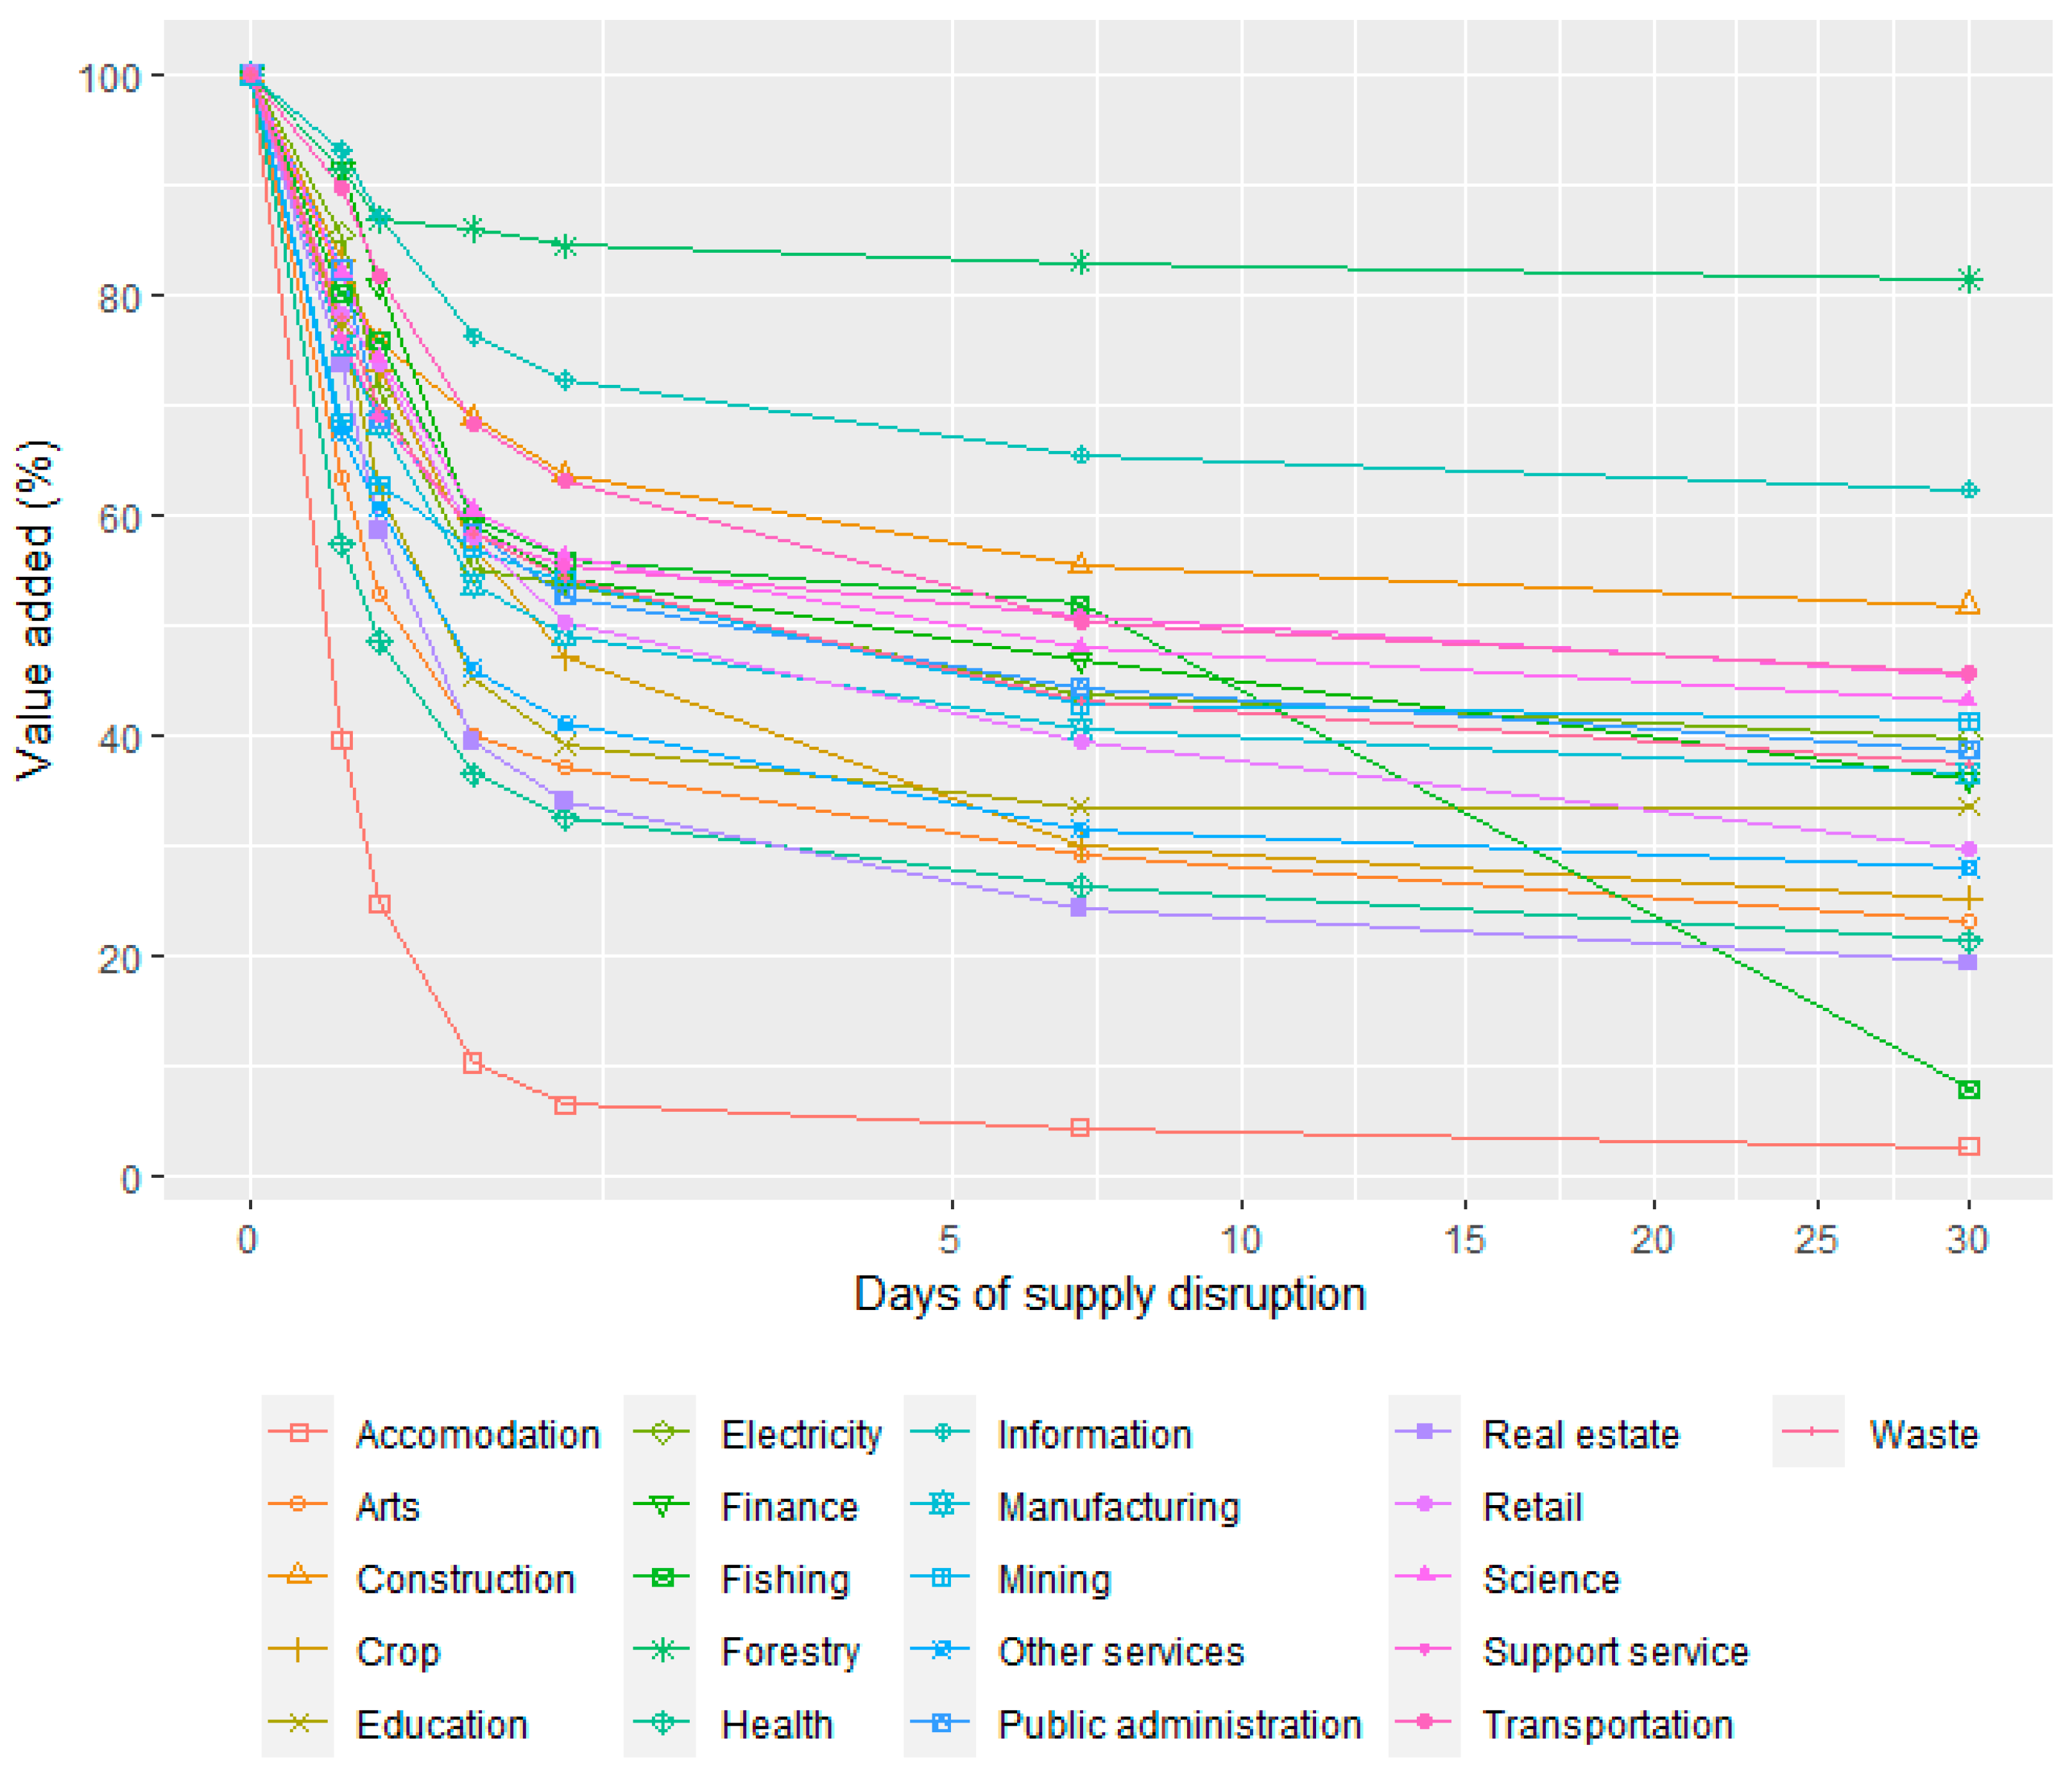
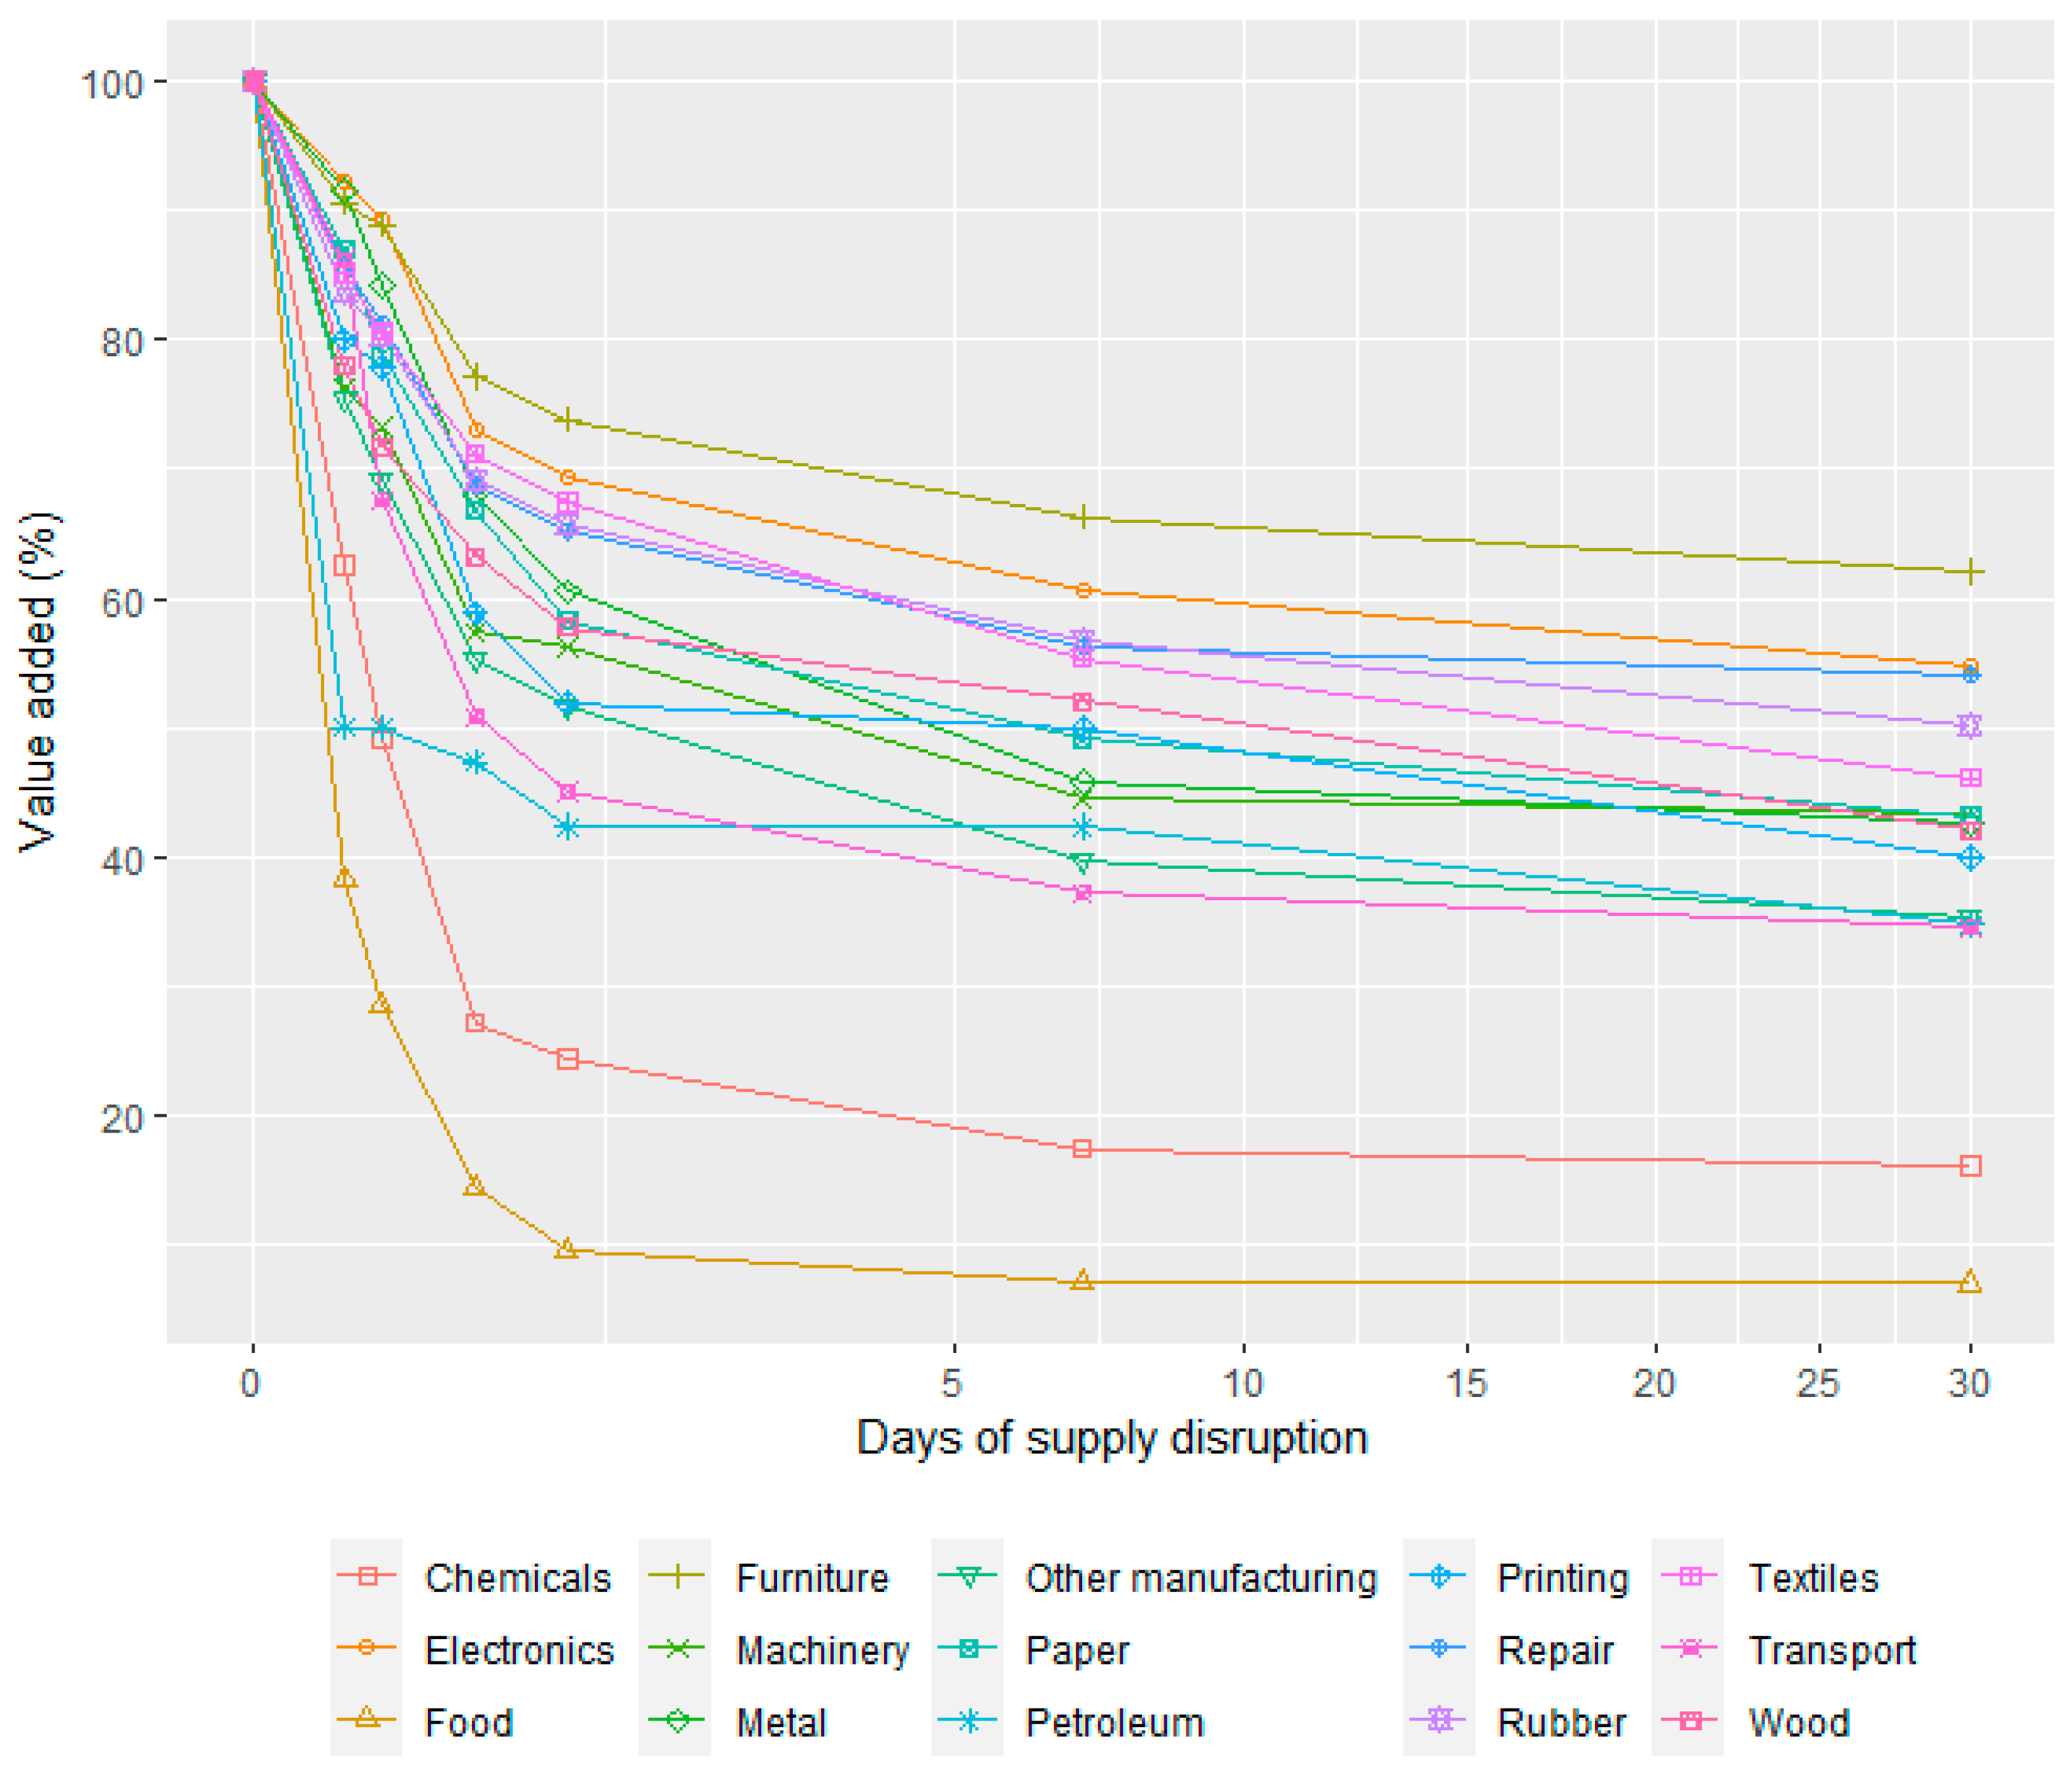
  • The investigation of direct economic business losses of short and long-term water supply outages shows that Food, beverage and tobacco is the most severely affected manufacturing sector over all analyzed water disruption durations. The sector’s water resiliency factors range from 0.69 to 0.11 for the analyzed disruption durations (from two hours to one month). The Accommodation and food service sector is the most severely affected non-manufacturing sector, with resiliency factors ranging between 0.70 and 0.10. Forestry and logging is the least affected sector, with factors between 0.96 (two-hour disruption) to 0.83 (one-month disruption). The information provided by the resiliency factors can be used to improve assessments at the societal level, by for example, water providers or authorities who need to assess the annual risk of an existing water supply system or compare the (socio-economic) benefits of alternative risk mitigation measures. The stepwise procedure for estimating the annual risk (with consequences measured in costs) will include assessing which types of delivery failures that can occur in the supply system of interest, the likelihood of occurrence of these types of disruption events based on historical site-specific data or expert judgements, and which economic sectors are present in the region. For each type of disruption event, the cost per sector is calculated over disruption duration and recovery time as the product of the sector’s contribution to the regional GDP at normal business activity and the complement of the sector’s resiliency factor (1—resiliency factor). The total annual cost for businesses is then the aggregate product of the probability of each type of event and its respective costs for all present sectors.
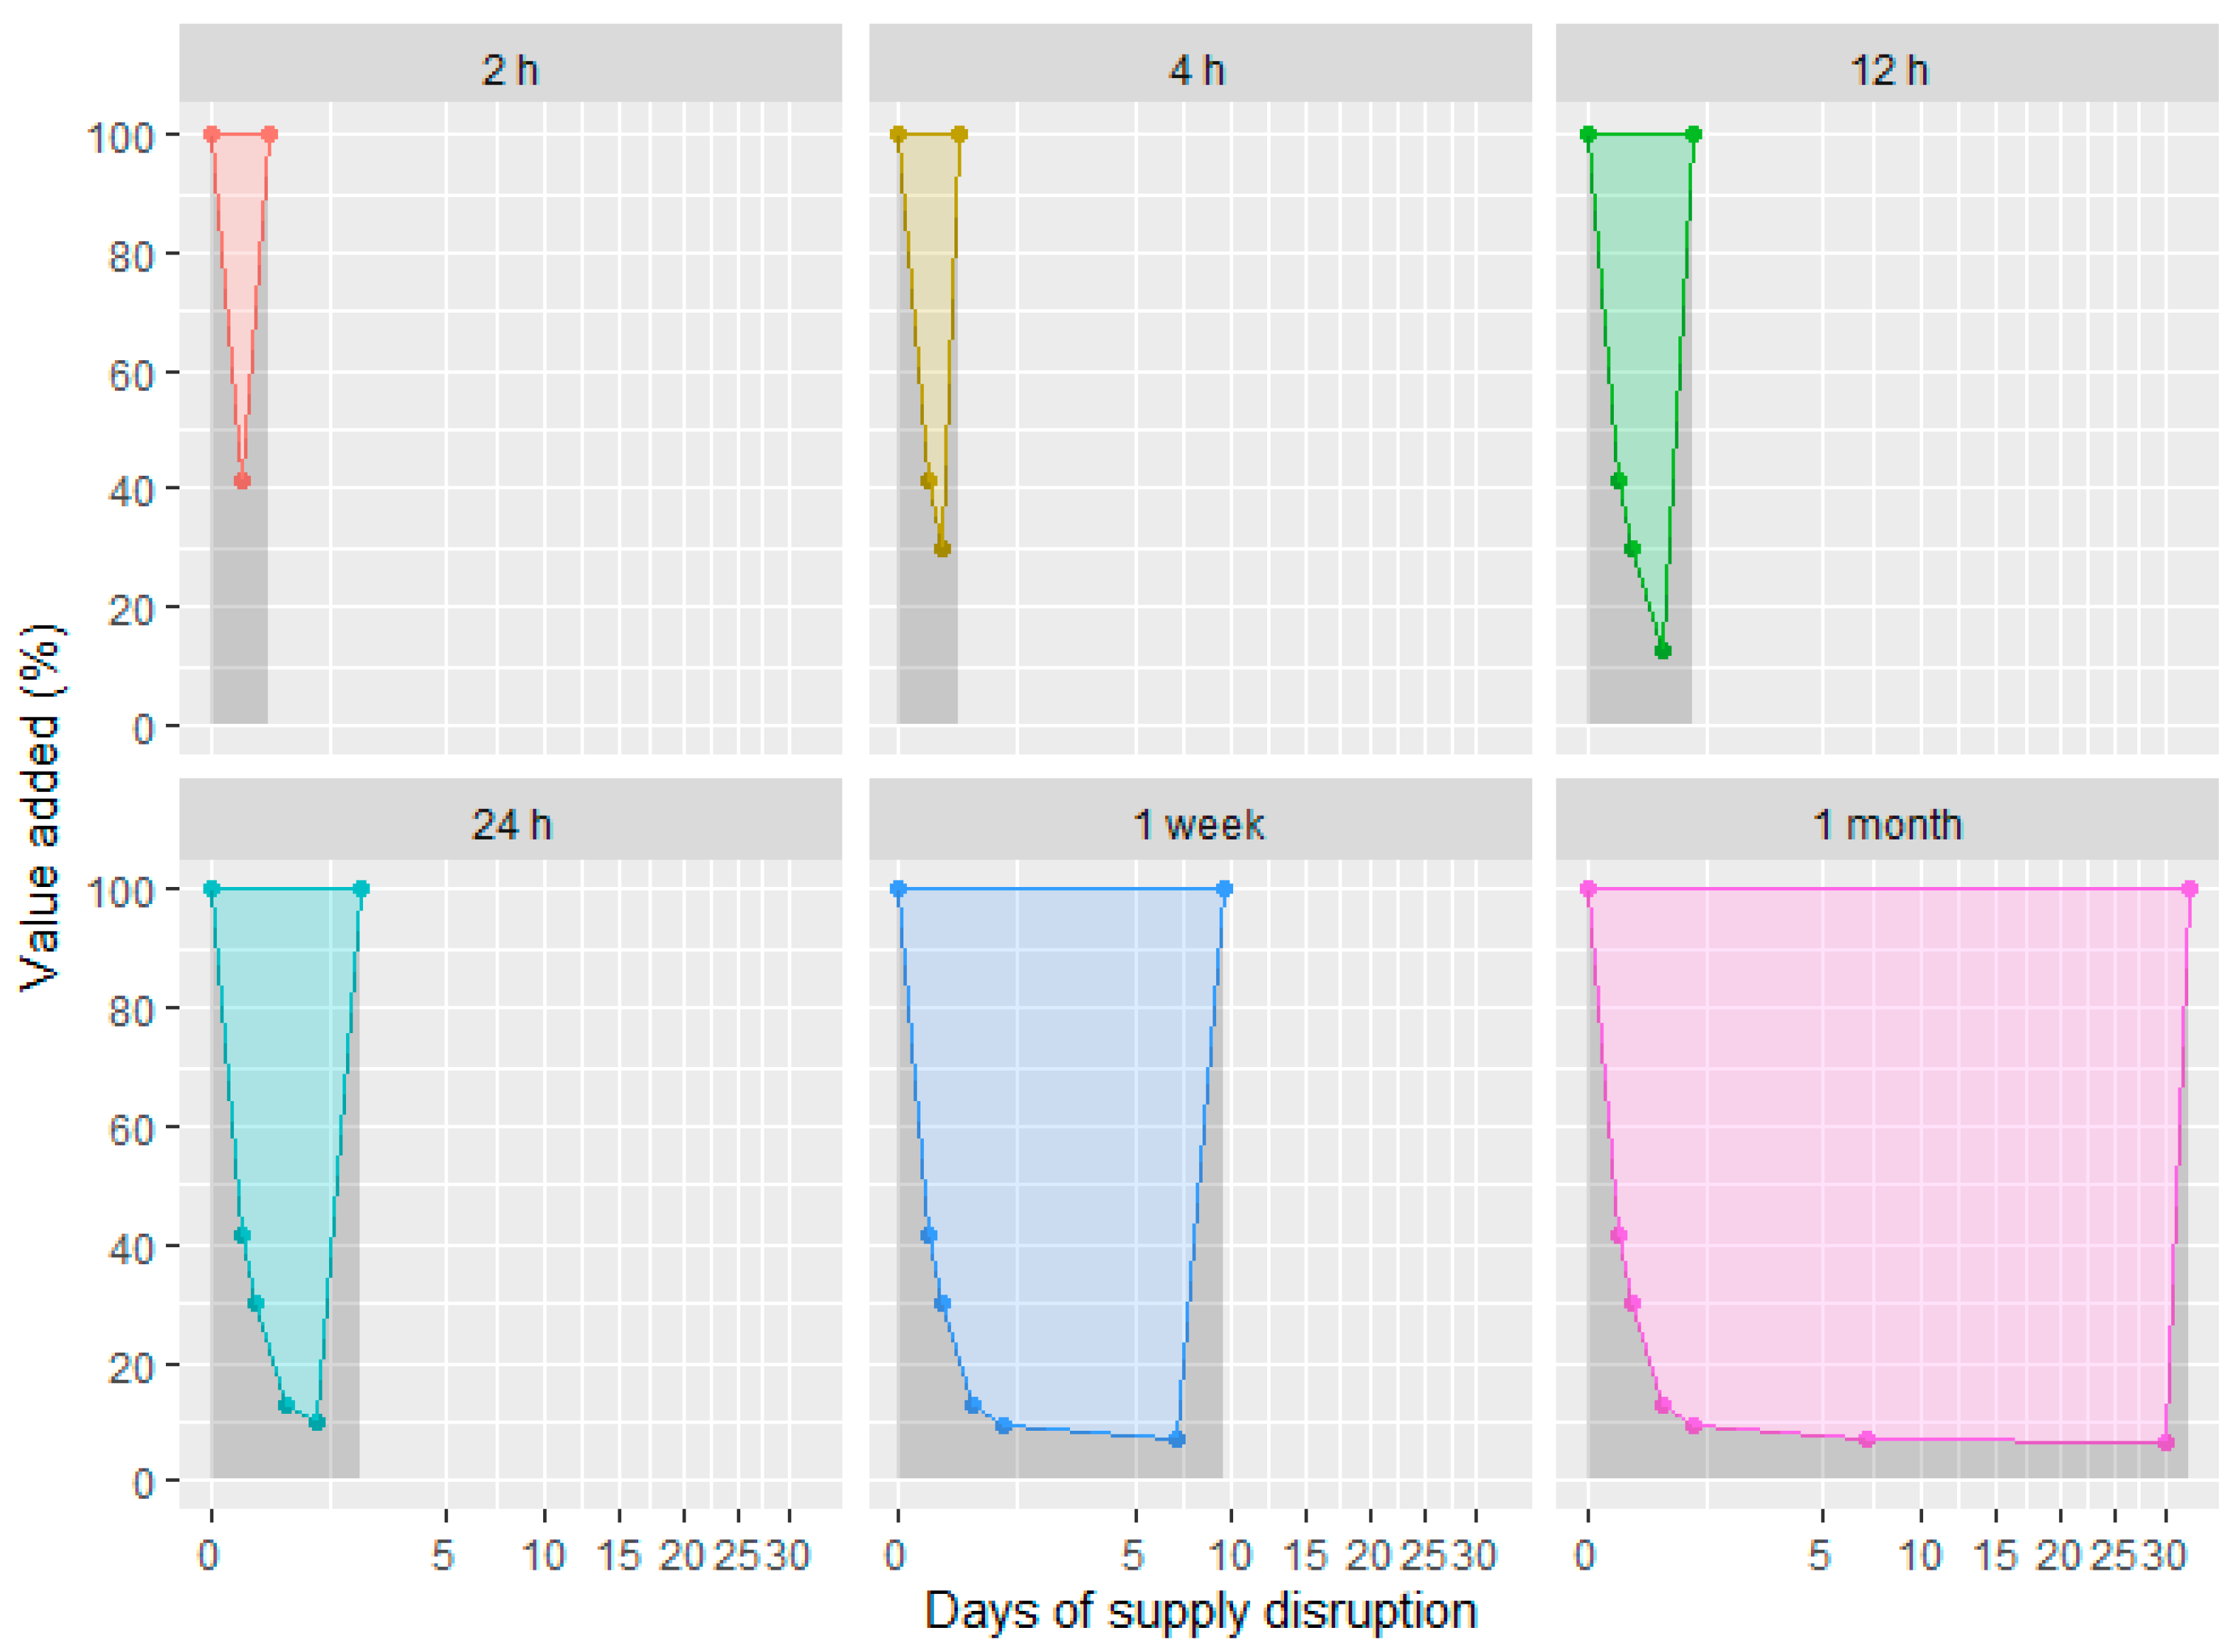
  • It is worth noting that all sectors are affected already by a two-hour disruption, ranging from 7% reduction in value added in the Information and communication sector to 62% reduction in the Food, beverage and tobacco sector (mean values). The reduction in value added increases with the disruption duration, with sector-wise mean values varying between 13 and 75% for a four-hour disruption, 23 and 90% for a 12-h disruption, 26 and 94% for a one-day disruption, 34 and 96% for a one-week disruption; and 38 and 97% for a one-month disruption. However, a fairly large proportion of the companies can maintain a normal business activity (100% value added) throughout a water outage: 48% of all companies during a two-hour disruption, 34% during a four-hour disruption, 25% during a 12-h disruption, 23% during a one-day disruption; 18% during a one-week disruption; and 16% of all companies during a one-month disruption.
  • The mean recovery time was less than a day for most sectors following disruptions lasting 24 h or less. The recovery time after week-long or month-long disruptions varied between a few hours and six days. However, several companies responded that they could not recover at all from those longer disruptions and would have to file for bankruptcy. When estimating the total business-related effects of water supply disruptions, effects of bankruptcy should thus be considered in addition to the lost value added.
  • The business resilience factors provided here contribute with information to help respond to the challenges arising from water disruption risks. With a better understanding of the value of water to all water users, a good, effective and efficient water governance is made possible. The results can be used for better economic impact assessments and evaluations of mitigation strategies, hence facilitating the managing of risks at the least cost to society. By illustrating the economic benefit of a reliable water provision, the results can thus be used to justify measures aimed at strengthening water security and by that contributing to ensuring a long-term sustainable use of our water resources.

Supplementary Materials

The following are available online at https://www.mdpi.com/article/10.3390/w13111565/s1, Questionnaire S1: Survey questionnaire, Table S1: Resiliency factors for analyzed economic activity sectors and water supply disruption durations (µ = average, ci = confidence interval, P25 = 25th percentile, P75 = 75th percentile), Table S2: Mean, 25th percentile and 75th percentile values of the resiliency factors, along with their respective bootstrapped standard errors (10,000 iterations), Figure S1: Survey results regarding whether the companies in each sector have access to supplementary water, and if so which kind, Figure S2: Survey results regarding whether the companies in each sector have taken, or plan to take, any measures to reduce the risk of being affected by a water disruption, Figure S3: Reasons for reduced value added during water disruptions.

Author Contributions

Conceptualization, K.S., A.L. and L.R.; methodology, K.S., J.K., A.L. and L.R.; formal analysis, K.S.; investigation, K.S., J.K. and N.S.Z.; writing—original draft preparation, K.S.; writing—review and editing, K.S., J.K., N.S.Z., L.R., M.H. and A.L.; visualization, K.S. and J.K; validation and supervision, A.L. and L.R.; project administration, K.S.; funding acquisition, K.S. and M.H. All authors have read and agreed to the published version of the manuscript.

Funding

This research was funded by Mistra the Swedish Foundation for Strategical Environmental Research and SMHI the Swedish Meteorological and Hydrological Institute.

Data Availability Statement

The data presented in this study are available in this article and its Supplementary Materials (see details on Supplementary Materials above).

Acknowledgments

The authors gratefully acknowledge the funding bodies for their support.

Conflicts of Interest

The authors declare no conflict of interest. The funders had no role in the design of the study; in the collection, analyses, or interpretation of data; in the writing of the manuscript, or in the decision to publish the results.

References

  1. WWAP. The United Nations World Water Development Report 2016 Report: Water and Jobs; UNESCO: Paris, France, 2016. [Google Scholar]
  2. WWAP. The United Nations World Water Development Report 2015: Water for a Sustainable World; UNESCO: Paris, France, 2015. [Google Scholar]
  3. Vladimirova, I.; Nguyen, N.; Schellekens, J.; Vassileva, I. Assessment of the Water Productivity Index. Deliverable to Task A4a of the Blue2 Project “Study on EU Integrated Policy Assessment for the Freshwater and Marine Environment, on the Economic Benefits of EU Water Policy and on the Costs of Its Non-Implementation”; DG ENV: Brussels, Belgium, 2018. [Google Scholar]
  4. Contreras, D.; Voets, A.; Junghardt, J.; Bhamidipati, S.; Contreras, S. The drivers of child mortality during the 2012–2016 drought in la Guajira, Colombia. Int. J. Disaster Risk Sci. 2020, 11, 87–104. [Google Scholar] [CrossRef] [Green Version]
  5. Ding, Y.; Hayes Michael, J.; Widhalm, M. Measuring economic impacts of drought: A review and discussion. Disaster Prev. Manag. Int. J. 2011, 20, 434–446. [Google Scholar] [CrossRef] [Green Version]
  6. Nocera, F.; Gardoni, P. A ground-up approach to estimate the likelihood of business interruption. Int. J. Disaster Risk Reduct. 2019, 41, 101314. [Google Scholar] [CrossRef]
  7. KPMG. Sustainable Insight–Water Scarcity: A Dive into Global Reporting Trends; KPMG International Cooperative: Zurich, Switzerland, 2012. [Google Scholar]
  8. Buck, S.; Auffhammer, M.; Hamilton, S.; Sunding, D. Measuring welfare losses from urban water supply disruptions. J. Assoc. Environ. Resour. Econ. 2015, 3, 743–778. [Google Scholar] [CrossRef] [Green Version]
  9. Graveline, N.; Grémont, M. Measuring and understanding the microeconomic resilience of businesses to lifeline service interruptions due to natural disasters. Int. J. Disaster Risk Reduct. 2017, 24, 526–538. [Google Scholar] [CrossRef]
  10. Brozović, N.; Sunding, D.L.; Zilberman, D. Estimating business and residential water supply interruption losses from catastrophic events. Water Resour. Res. 2007, 43, 14. [Google Scholar] [CrossRef]
  11. Chang, S.E. Socioeconomic impacts of infrastructure disruptions. Oxf. Res. Encycl. Nat. Hazard Sci. 2016, 31. [Google Scholar] [CrossRef]
  12. Rose, A.; Wing, I.S.; Wei, D.; Avetisyan, M. Total Regional Economic Losses from Water Supply Disruptions to the Los Angeles County Economy; Los Angeles County Economic Development Corporation: Los Angeles, CA, USA, 2012. [Google Scholar]
  13. ATC. Atc-25. Seismic Vulnerability and Impact of Disruption of Lifelines in the Conterminous United States; FEMA Federal Emergency Management Agency: Washington, WA, USA, 1991.
  14. FEMA. Fema Benefit-Cost Analysis Re-Engineering (Bcar). Development of Standard Economic Values; Federal Emergency Management Agency (FEMA): Washington, WA, USA, 2011.
  15. Chang, S.E.; Svekla, W.D.; Shinozuka, M. Linking infrastructure and urban economy: Simulation of water-disruption impacts in earthquakes. Environ. Plan. B Plan. Des. 2002, 29, 281–301. [Google Scholar] [CrossRef]
  16. Kajitani, Y.; Tatano, H. Estimation of lifeline resilience factors based on surveys of Japanese industries. Earthq. Spectra 2009, 25, 755–776. [Google Scholar] [CrossRef]
  17. Heflin, C.; Jensen, J.; Miller, K. Understanding the economic impacts of disruptions in water service. Eval. Program Plann. 2014, 46, 80–86. [Google Scholar] [CrossRef] [PubMed]
  18. Lizarraga, S.A. The Economic Consequences of Water Utility Disruptions; University of Missouri: Columbia, MO, USA, 2013. [Google Scholar]
  19. VASS. Swedish Water and Wastewater Associations Statistic’s System. Available online: http://www.vass-statistik.se/ (accessed on 23 September 2020).
  20. Lindhe, A.; Rosen, L.; Norberg, T.; Bergstedt, O. Fault tree analysis for integrated and probabilistic risk analysis of drinking water systems. Water Res. 2009, 43, 1641–1653. [Google Scholar] [CrossRef] [PubMed]
  21. Lindhe, A.; Norberg, T.; Rosén, L. Approximate dynamic fault tree calculations for modelling water supply risks. Reliab. Eng. Syst. Saf. 2012, 106, 61–71. [Google Scholar] [CrossRef] [Green Version]
  22. Sjöstrand, K.; Lindhe, A.; Söderqvist, T.; Rosén, L. Water supply delivery failures—A scenario-based approach to assess economic losses and risk reduction options. Water 2020, 12, 1746. [Google Scholar] [CrossRef]
  23. Malm, A.; Moberg, F.; Rosén, L.; Pettersson, T.J.R. Cost-benefit analysis and uncertainty analysis of water loss reduction measures: Case study of the gothenburg drinking water distribution system. Water Resour. Manag. 2015, 29, 5451–5468. [Google Scholar] [CrossRef]
  24. SFS. The Swedish Water Services Act (Lag (2006:412) om Allmänna Vattentjänster); The Ministry of the Environment: Stockholm, Sweden, 2006.
  25. Swedish Food Agency. Guide to Planning Emergency Water Supply; The Swedish Food Agency: Uppsala, Sweden, 2017.
  26. European Parliament. Regulation (Ec) No 1893/2006 of the European Parliament and of the Council of 20 December 2006 Establishing the Statistical Classification of Economic Activities Nace Revision 2 and Amending Council Regulation (Eec) No 3037/90 as Well as Certain Ec Regulations on Specific Statistical Domains. Available online: https://eur-lex.europa.eu/legal-content/EN/ALL/?uri=CELEX%3A32006R1893 (accessed on 7 April 2020).
  27. Rose, A. A framework for analyzing the total economic impacts of terrorist attacks and natural disasters. J. Homel. Secur. Emerg. Manag. 2009, 6, 27. [Google Scholar] [CrossRef]
  28. Atkinson, K.E. An Introduction to Numerical Analysis, 2nd ed.; John Wiley and Sons: New York, NY, USA, 1989. [Google Scholar]
  29. OECD. Oecd Sme and Entrepreneurship Outlook: 2005; OECD: Paris, France, 2005. [Google Scholar]
  30. Statistics Sweden. Current Statistics from the Business Register. Available online: https://www.scb.se/vara-tjanster/foretagsregistret/aktuell-statistik-fran-foretagsregistret/ (accessed on 4 May 2020).
  31. Swedish Water and Wastewater Association. Result Report for 2019 from Swedish Water and Wastewater Associations Statistic’s System; Swedish Water and Wastewater Association: Bromma, Sweden, 2020. [Google Scholar]
  32. Swedish Water and Wastewater Association. Sustainability Index for the Municipalities’ Water and Wastewater Operations; Swedish Water and Wastewater Association: Bromma, Sweden, 2020. [Google Scholar]
  33. Statistics Sweden. Gdp Quarter 1993–2020:1. Available online: https://www.scb.se/hitta-statistik/statistik-efter-amne/nationalrakenskaper/nationalrakenskaper/nationalrakenskaper-kvartals-och-arsberakningar/pong/tabell-och-diagram/tabeller/bnp-kvartal/ (accessed on 4 May 2020).
  34. Westling, K.; Kärrman, E.; Norström, A. A Vision for Water—Research and Innovation Agenda for the Swedish Water Sector. Available online: https://www.svensktvatten.se/forskning/vattenplattformen/vattenvisionen/ (accessed on 19 August 2019).
  35. Carlsson, H.; Haraldsson, M.; Kärrman, E.; Lidström, V.; Lundh, M.; Malm, A.; Malmström, H.; Pendrill, L.; Rönnbäck, M.; Sjögren, L.; et al. Investment Needs and Future Costs for Municipal Water and Sewage; Swedish Water and Wastewater Association: Stockholm, Sweden, 2017. [Google Scholar]
  36. Tierney, K.J. Businesses and Disasters: Vulnerability, Impacts, and Recovery. In Handbook of Disaster Research; Rodríguez, H., Quarantelli, E.L., Dynes, R.R., Eds.; Springer Science + Business Media: New York, NY, USA, 2007. [Google Scholar]
  37. The Government Offices of Sweden. National Strategy for Efficent and Sustainable Water Management. Available online: https://www.regeringen.se/pressmeddelanden/2021/02/en-efterfragad-strategi-for-effektiv-och-hallbar-vattenhushallning/ (accessed on 12 February 2021).
Figure 1. Schematic description of survey methodology.
Water 13 01565 g001
Figure 2. Schematic description of changes in value added over time during and after water supply disruption events of different lengths. A value added of 100% represents the baseline level of normal business activity. The colorful areas thus represent the value added lost, and the dark gray areas represent the maintained value added from disruption start to the end of recovery.
Water 13 01565 g002
Figure 3. Maintained value added for the non-manufacturing sectors, expressed as a percentage of normal business activity during water supply disruptions of different durations.
Water 13 01565 g003
Figure 4. Maintained value added in the manufacturing sector, expressed as a percentage of normal business activity during water supply disruptions of different durations.
Water 13 01565 g004
Table 1. Descriptive statistics of responding companies.
NACE CodeEconomic Activity NumberEmployees (%)Water Source (%)Disruption Experience * (%)
0–910–4950–199200–9999PublicPublic & PrivatePrivate
A 01Crop and animal production7177183128234941
A 02Forestry and logging1362380015384623
A 03Fishing and aquaculture580200060202020
B 07–09Mining and quarrying7434314071141457
C 10–12Food, beverage and tobacco 6821431819884750
C 13–15Textiles and leather 3865191437632127
C 16Wood products265835808541242
C 17Paper products20106052560301045
C 18Printing and recorded media108020001000010
C 19Coke and petroleum 47500257525025
C 20–21Chemical and pharmaceutical5394334138911040
C 22–23Rubber and plastic 3341381937991238
C 24–25Metal products634438162895617
C 26–27Computer and electronics384739113950529
C 28Machinery 172429291871121841
C 29–30Transport equipment 193226375950532
C 31Furniture 12552799920827
C 32Other manufacturing 275630150857741
C 33Repair and installation 288214408601411
D 35Electricity, gas, steam and air 3017473077720340
E 36–39Water, sewerage and waste 26275412869151562
F 41–43Construction2050455080101040
G 45–47Wholesale and retail 4430322316895732
H 49–53Transportation and storage5034342210926232
I 55–56Accommodation and food service 5939371410920863
J 58–63Information and communication944930165944220
K 64–66Financial and insurance activities25164428121000036
L 68Real estate activities3821263221955061
M 69–75Scientific and technical activities814637152912628
N 77–82Administrative and support service 345021246829935
O 84Public administration and defense3631942368911047
P 85Education393333268905544
Q 86–88Human health activities864028248868638
R 90–93Arts, entertainment and recreation824541104884934
S 94–96Other service activities10943291988112730
Total 1405
* Percentage of responding companies affected by disruptions over the last five years.
Table 2. Water supply resiliency factors (r) and time factors (t-factor) for all analyzed economic activity sectors and water disruption durations.
NACE CodeEconomic Activity2 h4 h12 h24 h1 Week1 Month
rt-Factorrt-Factorrt-Factorrt-Factorrt-Factorrt-Factor
A 01Crop and animal production0.9213.970.9010.950.737.120.653.770.441.250.321.09
A 02Forestry and logging0.961.000.942.620.905.620.883.310.851.330.831.08
A 03Fishing and aquaculture0.901.400.841.000.731.030.661.030.561.010.361.00
B 07–09Mining and quarrying0.841.140.781.070.651.110.611.070.511.030.441.00
C 10–12Food, beverage and tobacco 0.693.410.682.280.402.730.322.660.181.460.111.10
C 13–15Textiles and leather 0.931.310.881.050.811.300.761.170.651.160.551.09
C 16Wood products0.891.440.831.080.721.060.671.030.571.010.491.00
C 17Paper products0.933.390.952.270.801.460.731.260.581.290.511.12
C 18Printing and recorded media0.901.000.841.050.731.100.651.140.551.060.491.07
C 19Coke and petroleum 0.753.190.782.090.622.750.581.880.471.130.441.15
C 20–21Chemical and pharmaceutical0.8111.140.826.180.533.480.452.380.321.590.231.15
C 22–23Rubber and plastic 0.921.410.911.230.801.160.751.130.651.170.571.08
C 24–25Metal products0.961.360.931.160.821.190.741.160.571.050.471.03
C 26–27Computer and electronics0.961.030.941.050.851.050.781.510.671.080.601.04
C 28Machinery 0.881.240.831.150.711.100.651.060.531.050.471.05
C 29–30Transport equipment 0.931.210.861.080.671.140.571.080.411.150.341.06
C 31Furniture 0.951.080.931.040.861.080.811.090.721.020.661.01
C 32Other manufacturing 0.881.800.852.030.711.430.631.220.511.310.411.05
C 33Repair and installation 0.932.540.881.020.791.000.731.010.631.010.581.03
D 35Electricity, gas, steam and air 0.932.250.921.570.742.090.692.260.541.120.451.05
E 36–39Water, sewerage and waste 0.891.490.861.300.721.250.661.280.541.200.451.11
F 41–43Construction0.911.780.861.190.771.150.721.250.641.260.571.07
G 45–47Wholesale and retail 0.892.070.831.580.711.080.631.060.481.100.381.06
H 49–53Transportation and storage0.951.230.911.170.811.090.731.070.591.030.511.03
I 55–56Accommodation and food service 0.702.550.621.690.362.160.292.210.171.570.101.22
J 58–63Information and communication0.971.580.941.090.861.110.801.080.711.040.661.00
K 64–66Financial and insurance activities0.961.040.921.080.761.060.661.050.521.020.421.05
L 68Real estate activities0.871.710.781.410.591.520.501.450.331.070.261.08
M 69–75Scientific and technical activities0.912.240.861.340.741.240.671.170.561.090.481.03
N 77–82Administrative and support service 0.891.000.831.080.721.080.661.120.551.020.501.01
O 84Public administration and defense0.912.510.861.830.711.290.641.160.511.040.441.02
P 85Education0.901.540.841.270.661.340.561.200.411.040.371.03
Q 86–88Human health activities0.794.110.711.280.531.320.451.250.351.210.281.11
R 90–93Arts, entertainment and recreation0.825.690.774.000.582.170.511.900.381.210.311.10
S 94–96Other service activities0.841.530.782.980.621.910.541.580.401.140.331.04
Publisher’s Note: MDPI stays neutral with regard to jurisdictional claims in published maps and institutional affiliations.

