1. Introduction
The study of the interaction between road constructions and the water current during flood events is an important aspect that requires the identification of management measures aimed at improving the level of safety and favoring the development of mitigation actions and civil protection to be undertaken in the event of emergency conditions.
Hydraulic causes were the chief triggering cause of bridge failures [
1,
2] and several studies investigate this topic from different points of view, in particular the analysis of the erosive phenomena concerning the foundation of the riverbed structures. Etemad-Shahidi et al. [
3], Azamathulla [
4], Muzzammil [
5,
6], and Toth and Brandimarte [
7] propose estimation methods based on gene-expression programming, artificial neural network, adaptive neuro-fuzzy inference system approaches and provide a more reliable evaluation of the phenomenon with respect to traditional regressive techniques, even for lacking or approximate initial data. In [
8] the vulnerability of the embankment piles to erosive processes is assessed through the application and comparison of suitable hydraulic and morphological indices.
The Federal Highway Administration (FHwA) developed a procedure and a tool named HYRISK [
9] to assess the annual risk of scour failure of a vulnerable bridge [
10]. The approach associates the critical shear stress of a soil to its USCS (Unified Soil Classification System) soil group classification. The application of this approach to approximately 40 bridges in Georgia showed how soil property information can be used to properly program the maintenance of those bridges most at risk of scour failure.
In [
11,
12], the more general problem of the causes determining the hydraulic vulnerability of river bridges is examined: dynamic forces on the structure, subsidence of the foundation due to erosion of the riverbed, stress from impact of floating material or sediments [
13,
14], phenomena of riverbed instability, occlusion of the openings from storage of solid material or from boats. Such analyses demonstrate that erosion around the foundation structures in the riverbed is not the main cause of damage, constituted instead by the hydrodynamic thrust of the current, and that the works most subject to damage are the bridge access ramps.
For the purposes of this work, the authors propose and develop a novel methodology [
15] for the assessment of the hydraulic vulnerability of bridges and road embankments which aims to achieve a double objective: (a) defining a synthetic index that identifies the degree of vulnerability of the analyzed structure; (b) defining an operational protocol that limits any non-objective aspects of judgment.
The results confirm the presence of a widespread critical aspect, in line with other situations at the national and international level, as demonstrated by the criteria adopted by the Po River Basin Authority [
16] and the experience of the Federal Highway Administration [
17]. For this reason, a WebGis system has been developed and applied to the management of all the data useful for reporting both risk situations and the actions to be taken in emergencies, depending on the alert levels issued by the Functional Centers. The system, developed as a prototype for most of the Umbria Region, can be the basis for further specializations in areas with different morphological and hydrogeological characters. The same system was designed to facilitate the disclosure of risk data, the dissemination of which can be of fundamental importance in emergency situations.
This study concerns the basin of the Tiber River and is focused on the assessment of the vulnerability of hydraulic constructions in flood-prone areas. The result of the study, which takes into account 84 structures (69 bridges and 15 road embankments) along with the Upper Tiber River network, is a concise evaluation of the degree of vulnerability of each examined structure according to the following classes: fair, average, high, very high. This assessment has been articulated through successive stages of analysis, regarding the general features of the structure, the characteristics of the river reach, hydrologic and hydraulic calculations and evaluations.
The paper is organized as follows. In
Section 2 we present the employed methodology, featuring the field activities and the hydraulic vulnerability assessment. The case study is described in
Section 3. Results and discussion are presented in
Section 4, before we draw our conclusions.
2. Methodology for Hydraulic Vulnerability Assessment
The proposed methodology for determining the degree of vulnerability of hydraulic structures (e.g., bridges or road embankments) includes the following macro classes of degree of vulnerability: (a) fair; (b) average; (c) high; and (d) very high.
In order to determine the degree of vulnerability of these structures, the cognitive data relating to the bridge and the stretch of watercourse concerned, the hydrological and hydraulic processes have been organized into representative data sheets of each work. These data constitute an interactive database, which can also be updated with detailed insights in relation to changes in the parameters that led to assigning the degree of vulnerability.
The following sections are identified for each structure:
Coding;
Location;
Geometric characteristics, flood limits and river belts;
Morphological characteristics of the riverbed;
Hydrological and hydraulic analysis;
Analysis of the work’s vulnerability;
Analysis of the vulnerability of the work in relation to and with the surrounding areas.
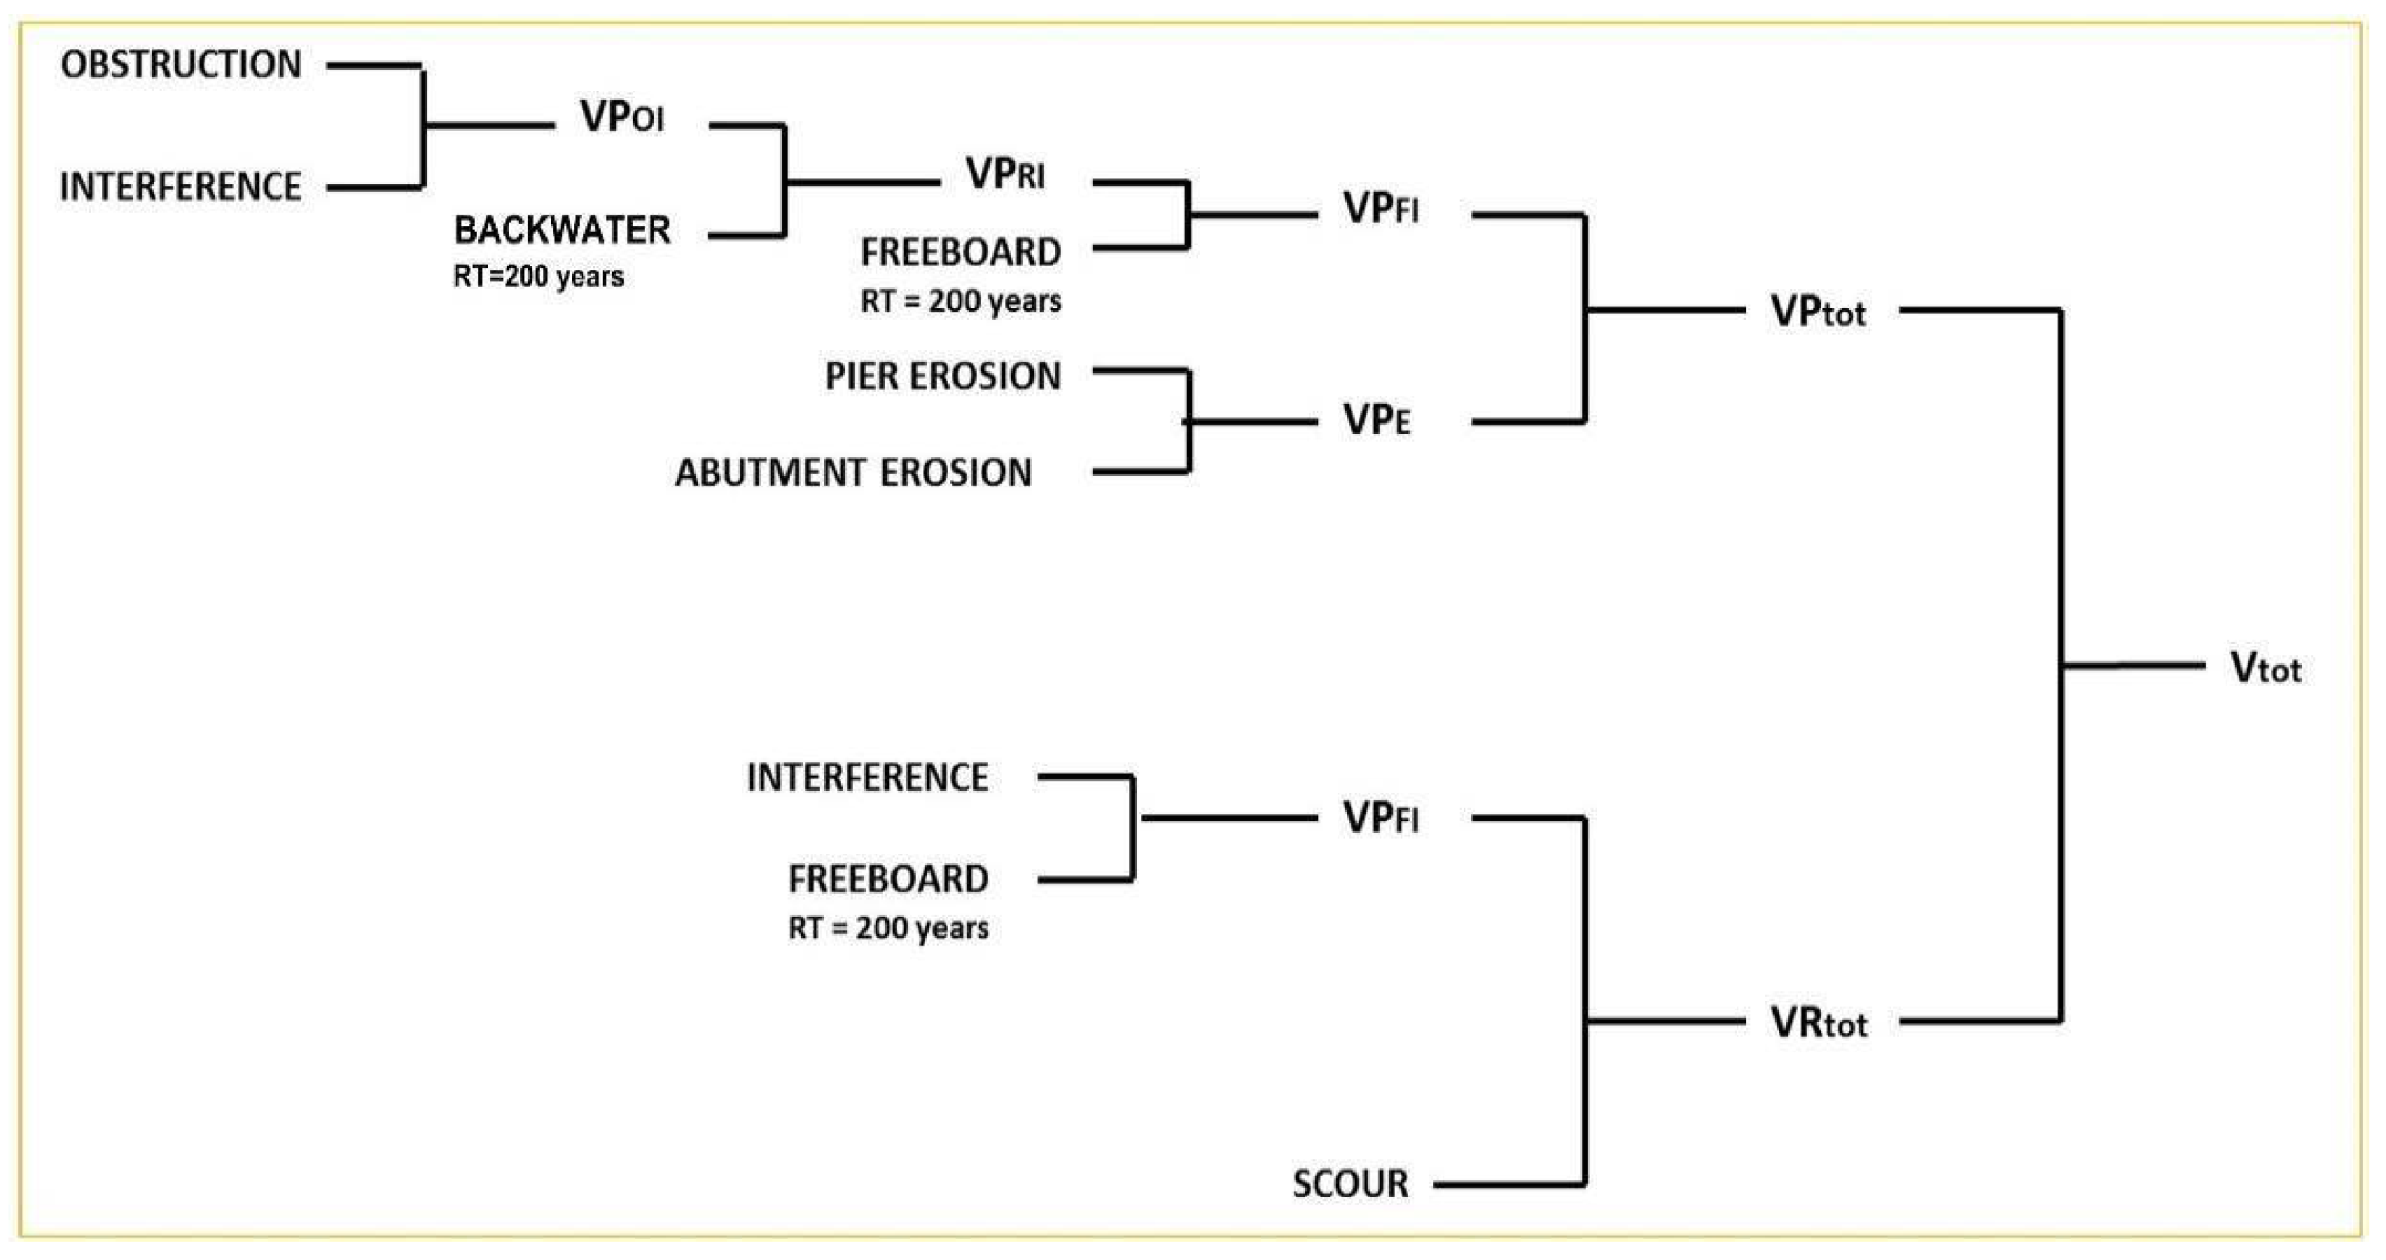
The procedure that evaluate the total vulnerability of a bridge, indicated with V
tot, starts from comparing two of the selected parameters. In our case, the chosen initial parameters are the potential obstruction of the openings and the interference of the structure with the waterflow, the morphology and other works, in order to obtain a preliminary degree of vulnerability, V
POI. The latter is then compared with a third parameter, the backwater with a Return Time (RT) of 200 years, to obtain a second partial degree of vulnerability, V
PRI, and so on until V
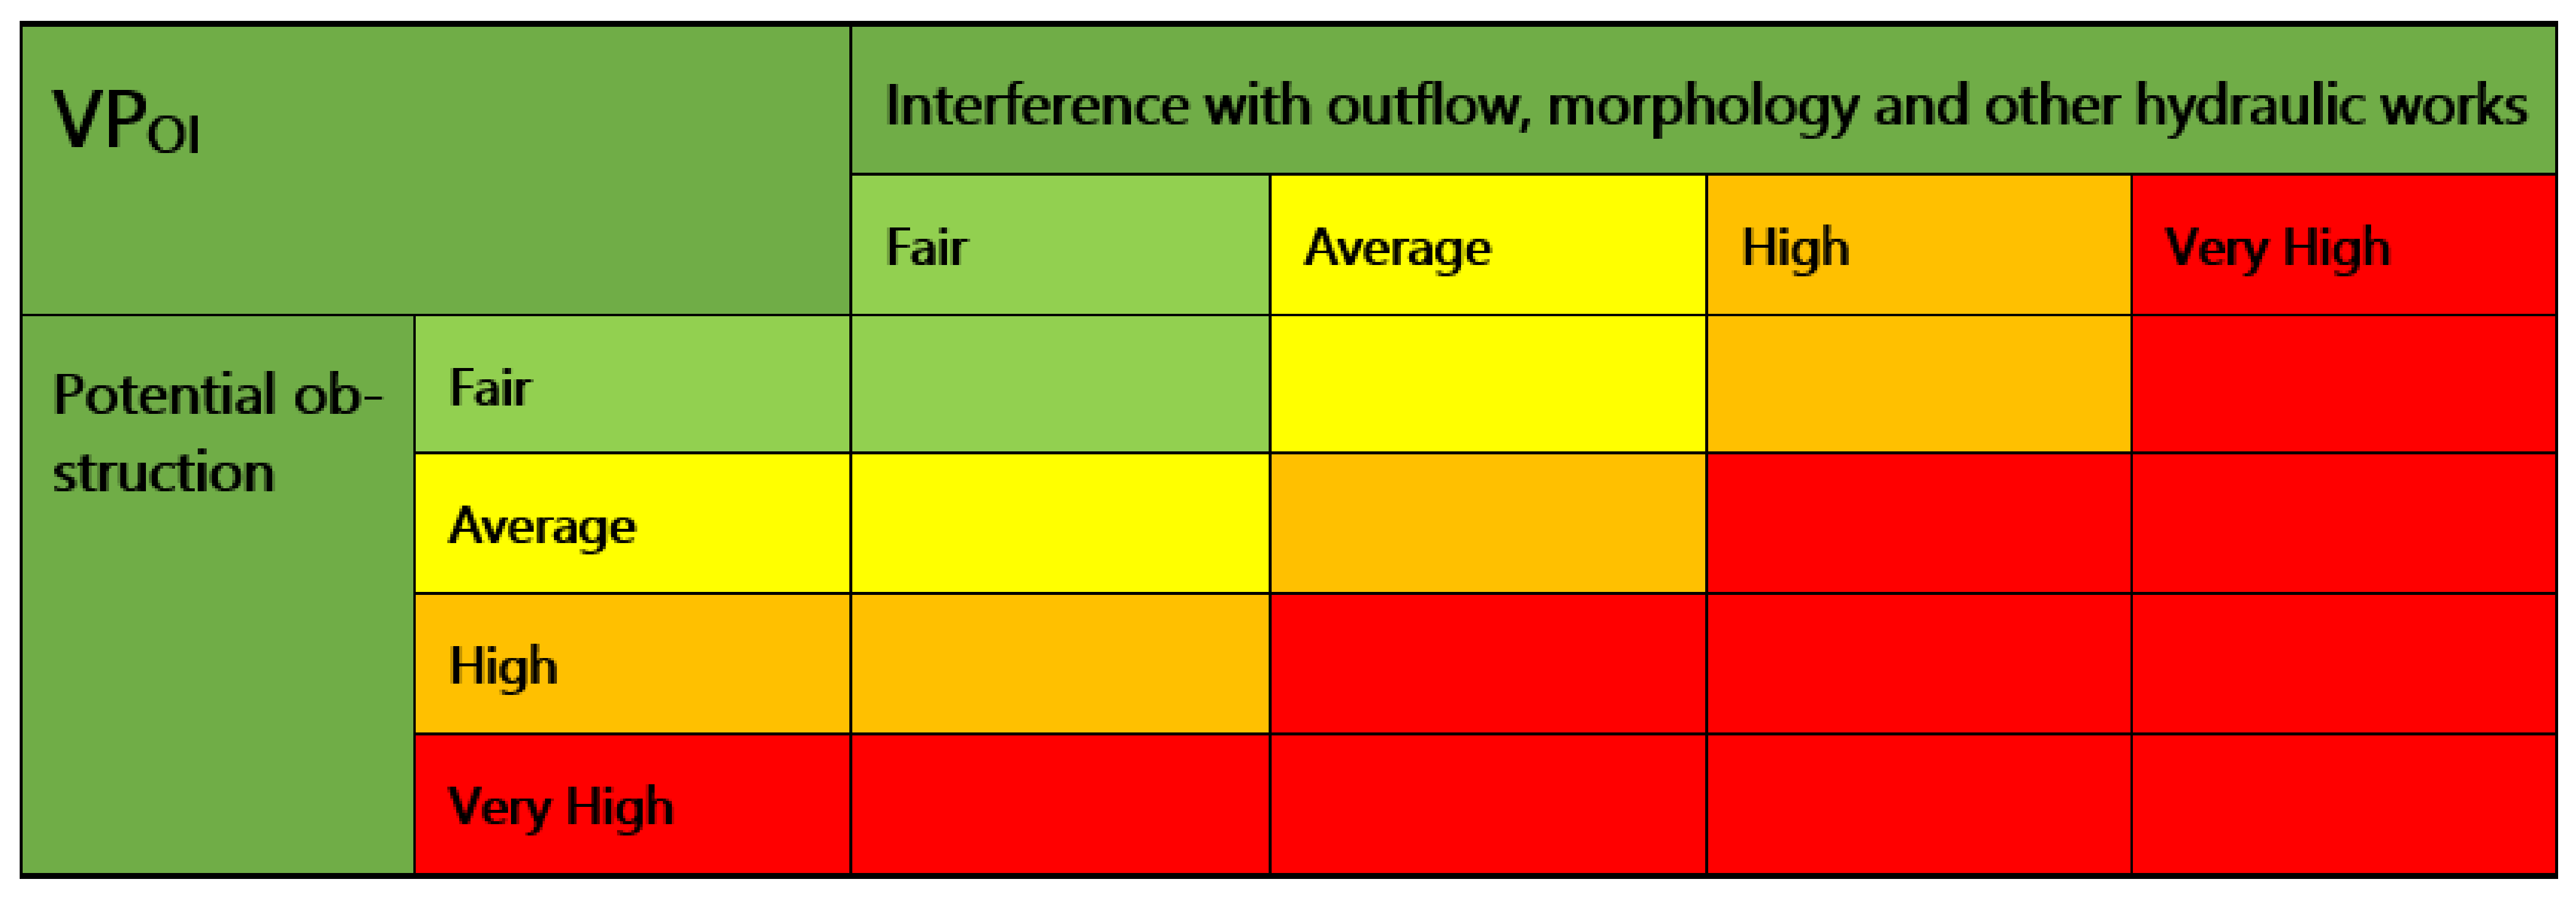
tot is obtained. The comparison between the two parameters or between a parameter and a partial degree of vulnerability takes place through suitable combination matrices, all characterized by the same structure, regardless of the terms of comparison (see
Figure 1).
The procedure for assessing the hydraulic vulnerability of a structure initially consisted of a choice of parameters that can determine critical conditions. Therefore, for each bridge or road embankment, we assigned a vulnerability judgment to each parameter, according to a classification in four levels: fair, average, high and very high.
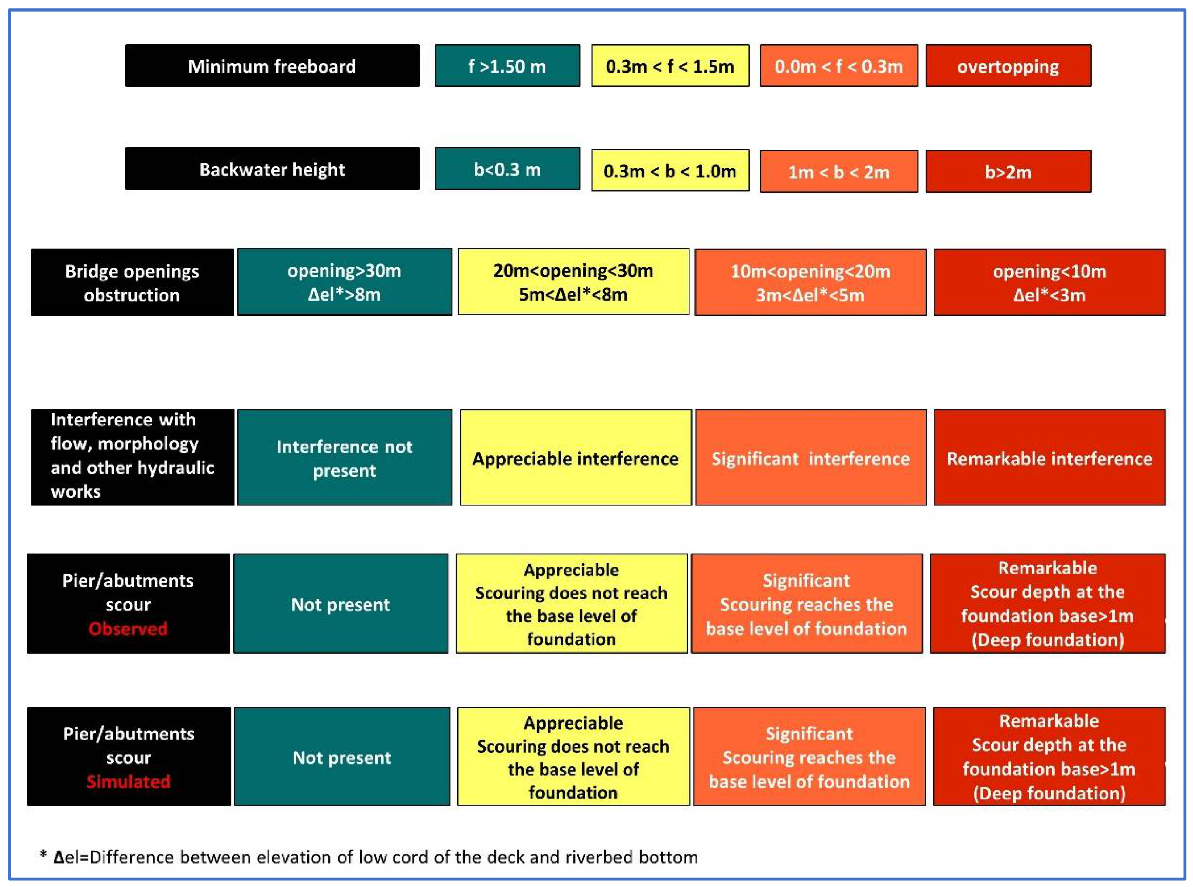
An explanation of the criteria used to define the threshold values for the vulnerability levels (fair, average, high and very high) of the different parameters is shown in
Figure 2. The parameters taken into consideration were: freeboard, backwater height, bridge openings obstruction, interference with flow, morphology and other hydraulic works, pier/abutments scour surveyed and simulated.
The degree of vulnerability for each individual parameter was assigned, whenever possible, with a reference to the criteria dictated by the Italian legislation [
18] and a similar approach can be extended to other countries. For example, the freeboard value of 1.5 m that characterizes the fair level of vulnerability has been chosen according to [
18]. However, such a threshold is also compatible with the American legislation [
19], which indicates a freeboard between 2 ft and 4 ft, depending on the debris quantity in the flow. Moreover, the lower boundary value of the range adopted for the medium freeboard (between 1.5 m and 0.3 m) agrees with [
20], where a minimum freeboard allowance of 0.3 m is required.
The different levels of the parameter “interference with flow, morphology and other hydraulic works” (see
Figure 2) have been evaluated, adopting as a reference the Directive 7.2 of the Hydrological Plan (PAI) made by the Po River Basin Authority [
21]. The following criteria are considered: orientation of piers/shoulders with respect to the flow direction; alignment of piers/shoulders in the main channel with piers of close hydraulic works; presence of piers/abutments in the main channel; distance of abutments/piers from levees.
If not supported by law or technical rules, the vulnerability level needs to be set according to assessments dictated by experience or carried out in practice and must be strongly sustained by a preliminary study on river hydraulics, morphological and evolutive characteristics of the area, accurate surveys and, finally, by research into historical flood events related to the works.
For the purposes of a synthetic classification of the works according to a degree of vulnerability, which is useful to have a synthetic picture of the cases investigated and for establishing priorities for intervention or attention, the individual parameters are compared through matrices combining the values assumed.
The methodological path to obtain the total vulnerability degree of the work is shown in
Figure 3 (bridge) and
Figure 4 (road embankment).
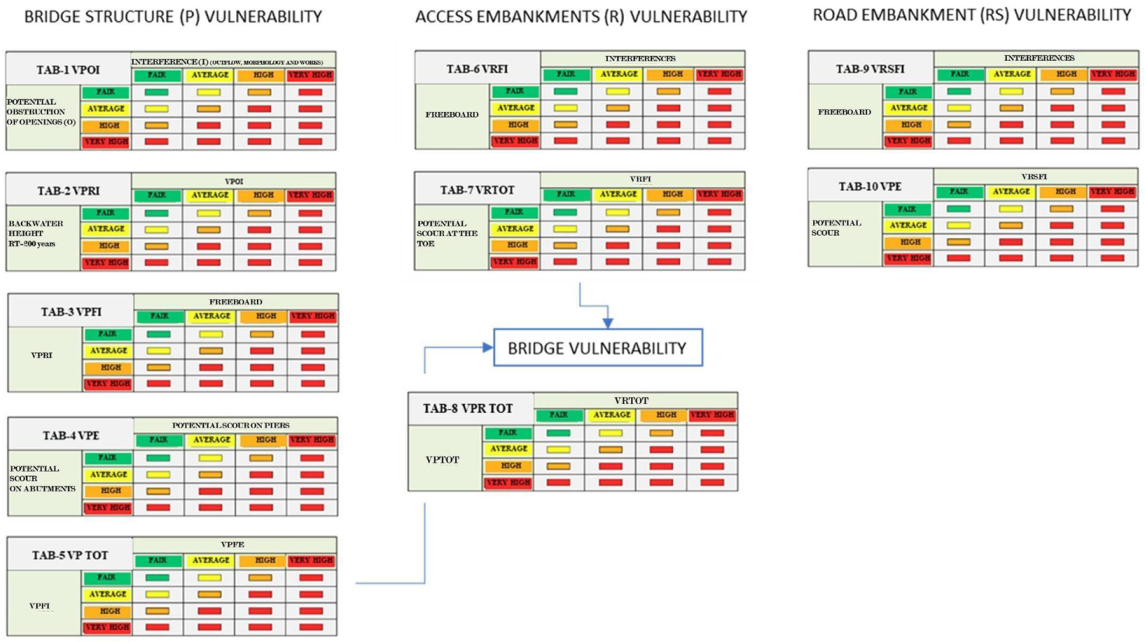
The methodological path to determine the total vulnerability of the bridge, referred to in the tables shown in
Figure 5, is as follows:
- (a)
the comparison of potential obstruction of the openings (O) with the interference with outflow (I), morphology and works through the matrix represented in TAB.1 in
Figure 5 obtaining a partial vulnerability degree (VP
OI) of the bridge as a function of the two parameters;
- (b)
V
POI is compared with the backwater height at RT = 200 years (RI), obtaining the degree of partial vulnerability V
PRI through the matrix represented in TAB.2 in
Figure 5;
- (c)
V
PRI is compared with the freeboard at RT = 200 (FI) with the matrix of TAB. 3 in
Figure 5 to assess the degree of vulnerability VP
FI;
- (d)
V
PFI is compared with the partial vulnerability degree, V
PE, dependent on the potential erosion on piers and abutments (E) derived from the matrix of TAB.4 in
Figure 5;
- (e)
the degree of vulnerability of the bridge structure, VP
TOT is obtained through the matrices represented in TAB.5 in
Figure 5.
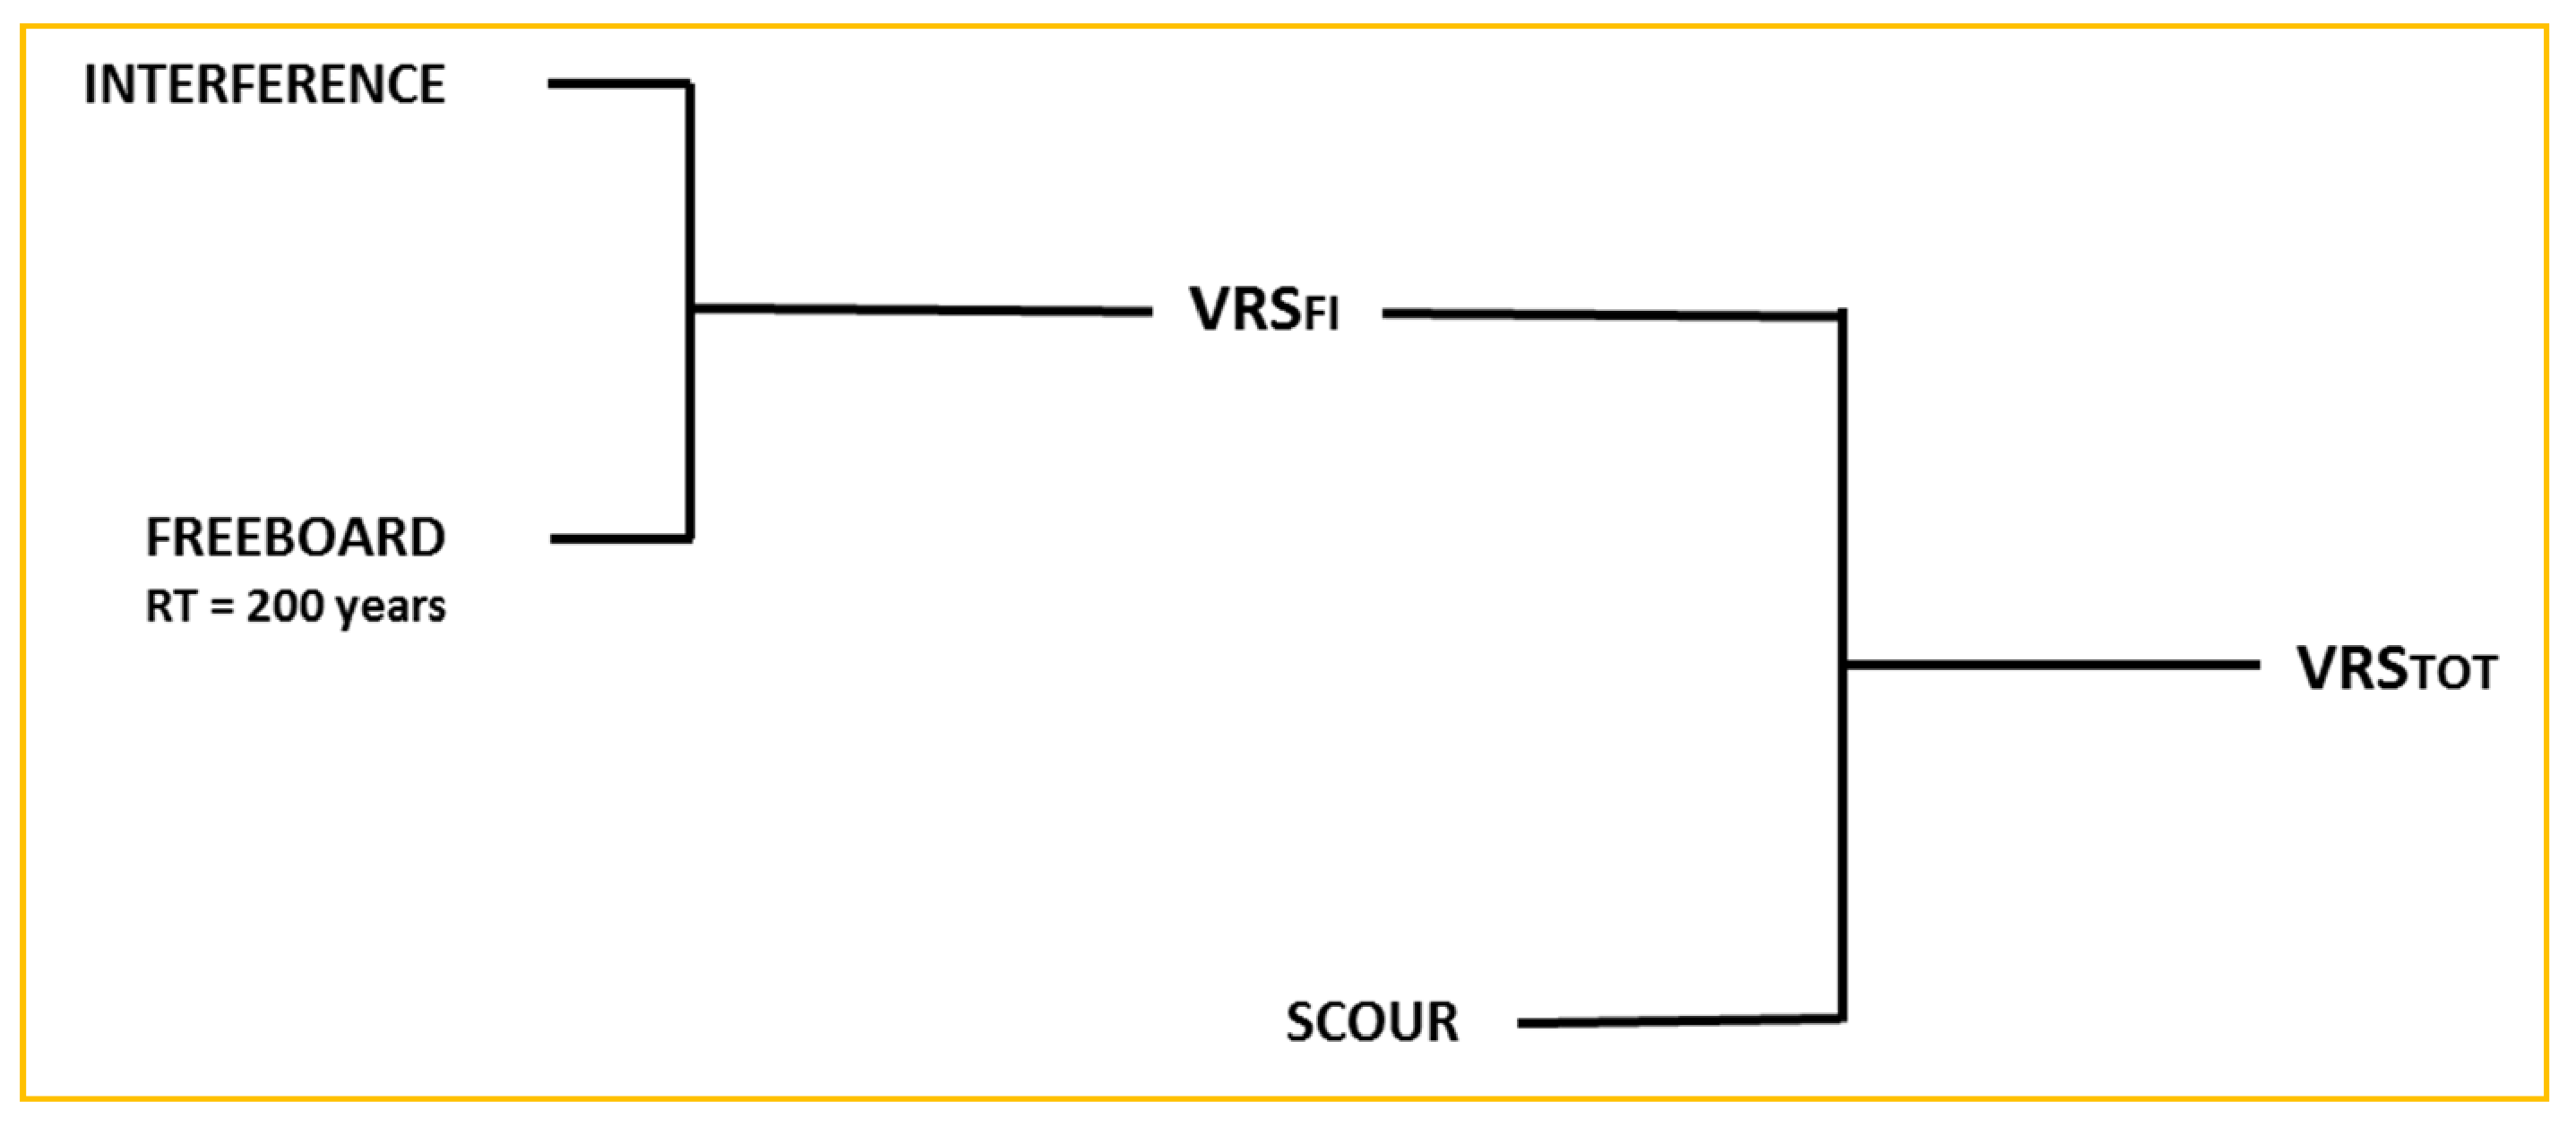
A similar procedure is followed to assess the vulnerability of the bridge access embankments:
- (a)
the interference of the embankments with outflow, morphology and works is compared with the freeboard at RT = 200 years through the matrix in TAB.6 in
Figure 5, obtaining the degree of partial vulnerability, VRS
FI;
- (b)
V
RFI is compared with the potential erosion at the foot of the embankment through the matrix represented in TAB.7 in
Figure 5, obtaining the degree of vulnerability of the access embankment, VRS
TOT;
- (c)
the total vulnerability degree of the “bridge and embankments” structure, V
TOT, is obtained by comparing V
PTOT and V
RTOT through the matrix in TAB.8 in
Figure 5.
The procedure followed to assess the vulnerability of the road embankment is similar to that of the bridge and can be easily deduced from TABs 9 and 10 in
Figure 5.
3. Case Study
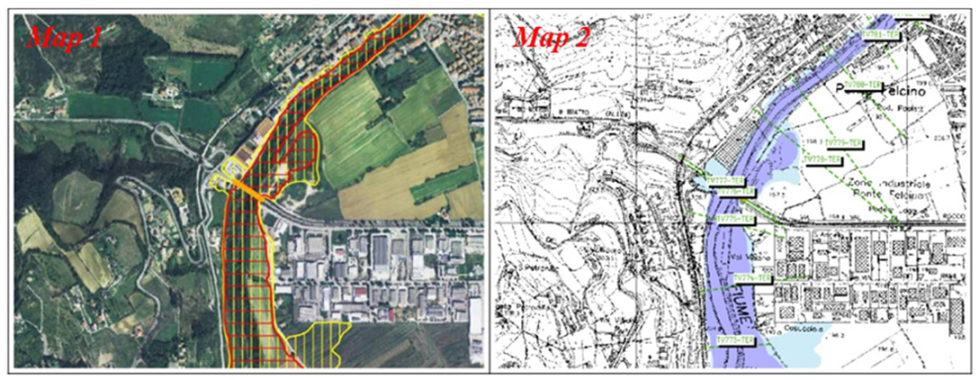
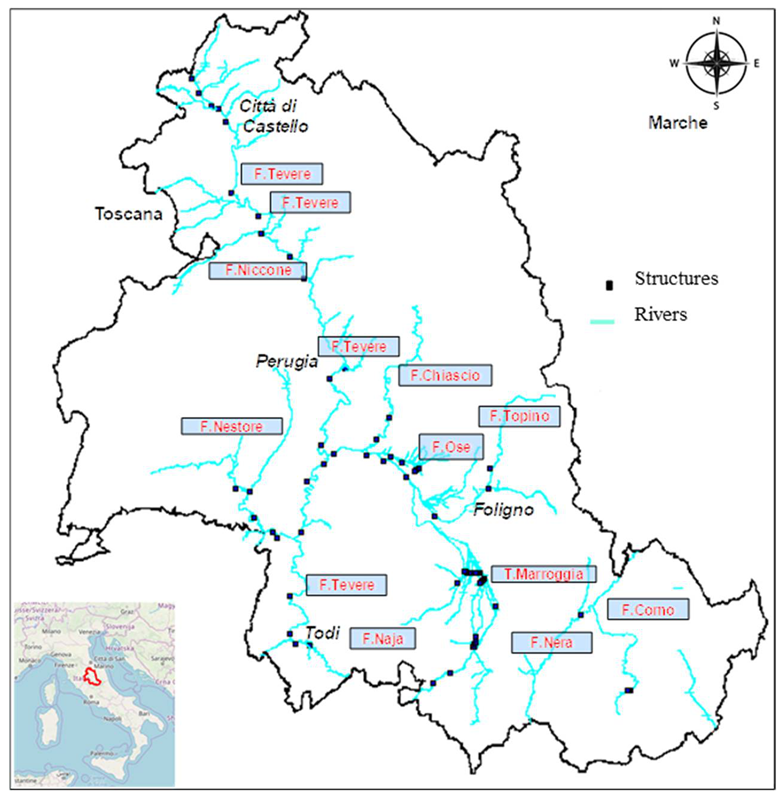
The proposed methodology is here applied to verify the hydraulic vulnerability of the bridge or road embankments of the road network of the Province of Perugia (see
Figure 6), falling within the river belts A and B as defined in the Hydrogeological Plan (PAI), Authority of Bacino of the Tiber River [
22].
Pursuant to the PAI, the owners or concessionaires of works affected by flood events with a return time (RT) of 50 and 200 years must verify the hydraulic risk conditions and with regard to the structural stability conditions of the works themselves [
22,
23,
24,
25,
26].
The road works examined in this study are 84, 69 bridges and 15 road embankments; 41 belong to the main hydrographic network and the remaining belong to the secondary network.
The documents already developed on the subject for similar purposes were acquired from the Tiber River Basin Authority and the Umbria Region. In particular, the results of the studies on flood areas drawn up on the main and the secondary networks were used, as definitive calculations of the hydraulic state of the river network. For some specific aspects of this study, the data already available within the PAI (topography of the works, modeling flow rates) were used as a basis for subsequent elaborations, such as, for example, the estimation of the erosion processes in the vicinity of the crossing bridges and embankment connections.
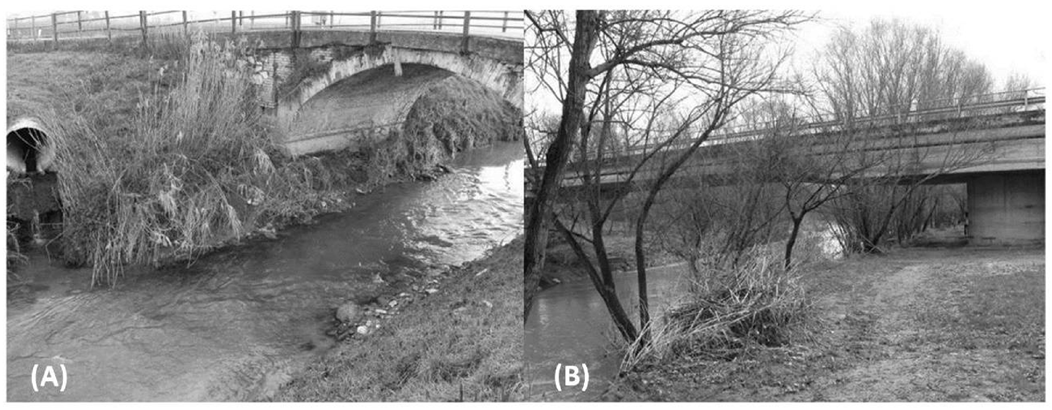
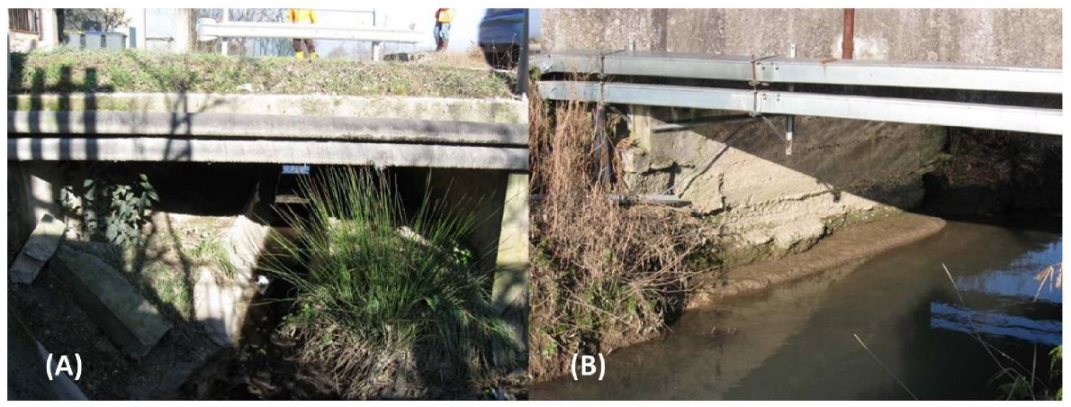
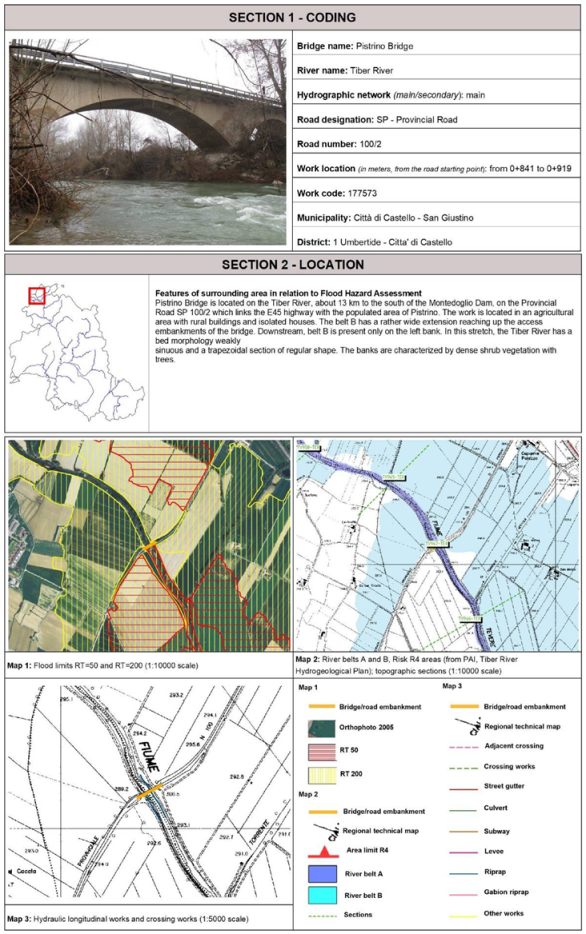
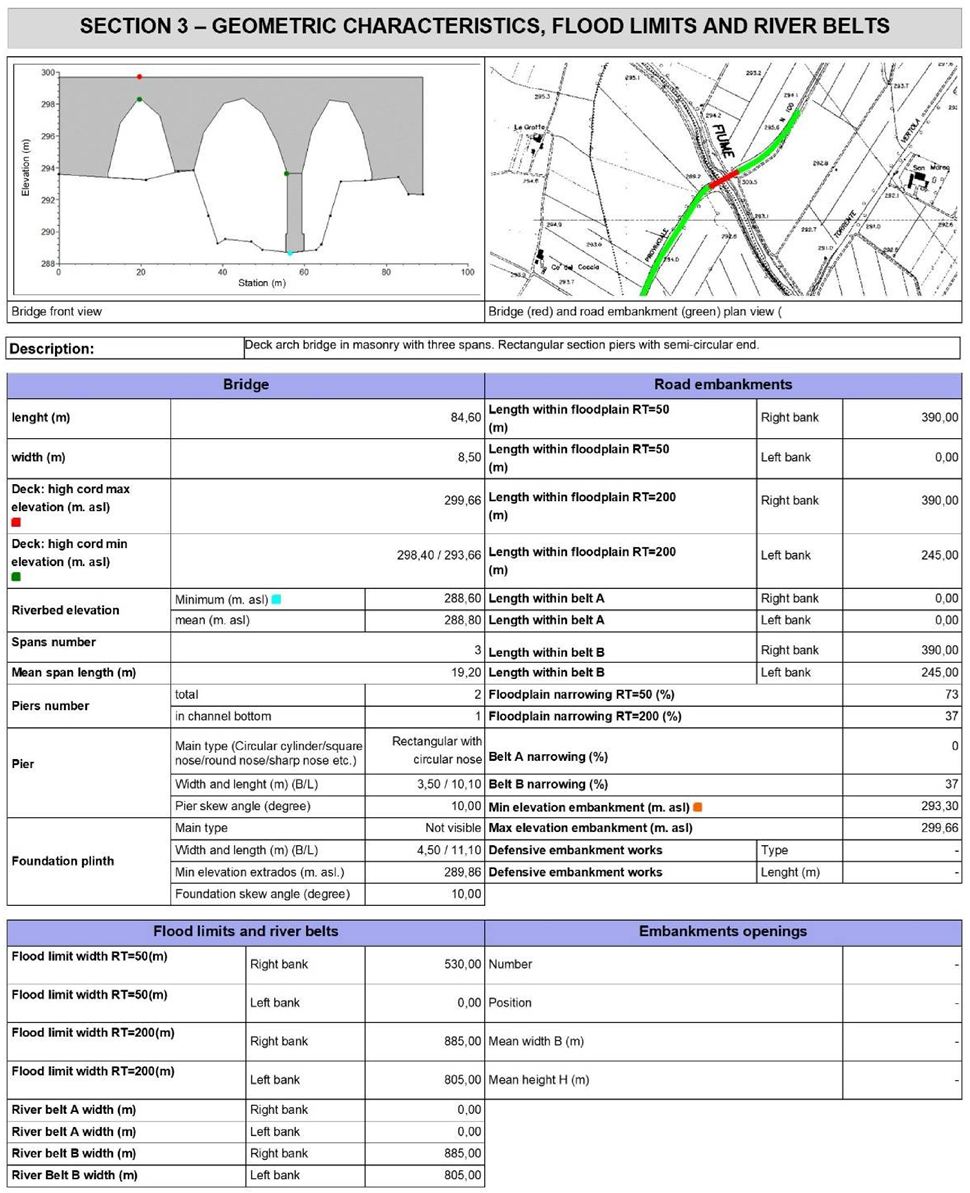
The need for a granulometric classification of the stretches of the riverbed studied, necessary for the subsequent erosion and solid transport assessments, was as far as possible deduced from photogrammetric surveys, experimenting with a quick procedure that can ignore campaign activities, that were not foreseen in the previous studies and in any case are extremely demanding and expensive to carry out on a large scale. The inspection activity made it possible to detect in detail the dimensional and constructive characteristics of these works, which vary from small arched masonry bridges (
Figure 7A) to structures with large span girders in reinforced concrete (
Figure 7B), highlighting a broad representation of situations that give greater meaning to the final results of the study.
We also acquired fundamental information for the complete description of the works, as reported in the following subsections. Among these, the detailed situation in the riverbed near the building is a crucial aspect, particularly for the erosive phenomena and the characteristics of elements that do not insist directly on the river course, such as access to embankments to the bridge.
3.1. Field Activities
The necessary field activities of inspection and assessment were performed on all the structures considered in the present study. They were developed through the following stages:
- (a)
the acquisition of georeferenced photographic data;
- (b)
the survey of civil works for the hydraulic protection, embankments, hydraulic works;
- (c)
photogrammetric surveys of the grain size of the bottom of the riverbed;
- (d)
observations on the possible presence of erosion.
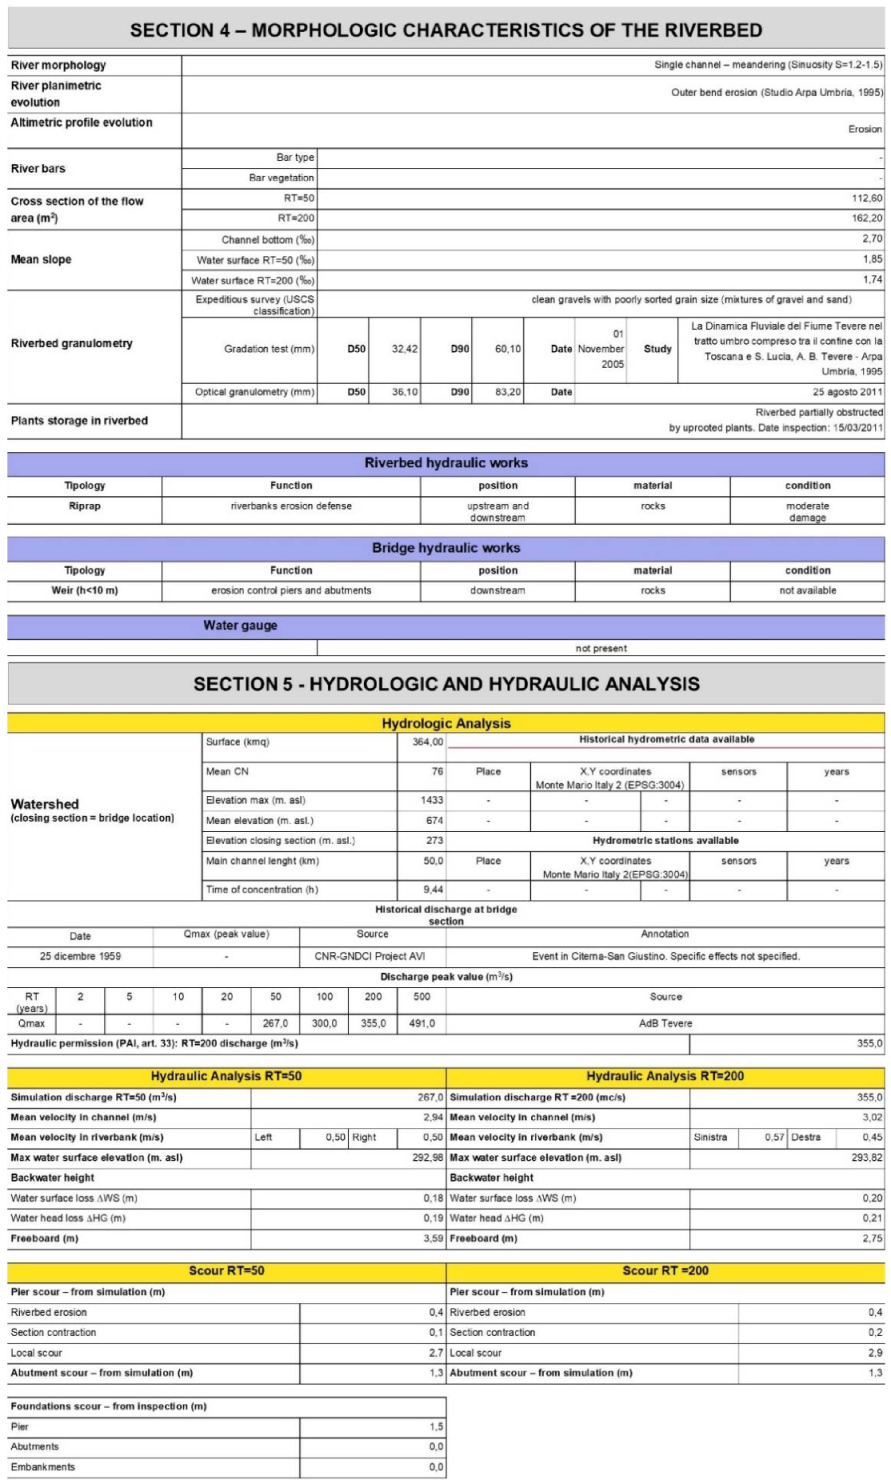
3.2. Morphological, Hydrological and Flow Conditions
The morphological, hydrological and flow conditions were obtained by means of a developed GIS (Geographical Information System) procedure primarily based on the river basin module of the open-source platform GRASS (Geographic Resources Analysis Support System) [
27], adapted and tested for the purposes of this study. To evaluate the spatial distribution of the Curve Number (CN), used for the estimation of the runoff coefficient, the procedure overlaps maps with land use information [
28] and maps related to the permeability of the soil derived from the Geological Maps (Geological Map of Italy). This allowed us to find the value of CN for each unit (with a raster size 20 × 20). Next, the average CN of each basin was obtained as an average of the values of CN relating to each single cell.
The HEC-RAS [
29] calculation program was used for hydraulic simulations. The modeling of the flood profiles was carried out in conditions of stationary motion, in the hypothesis of one-dimensional flow of gradually varied currents.
The estimation of the potential erosion of the foundations of piers and abutments of bridges is performed by following the directions of the circular HEC (Hydraulic Engineering Circular) No. 18 [
30].
The value of the general scour, related to the concept of equilibrium slope, is derived from the river channel slope,
i, by means of the following relation [
31]:
where α is in the range 0.5–0.77 with an average value, α
avg = 0.66.
For the evaluation of the contraction scour, many formulations can be found based on both laboratory experiments and on the interpretation of empirical field observations [
32,
33,
34].
The present calculations are performed differently, depending on whether there is (live bed) or is not (clear water) sediment transportation.
The estimated local scour at the piers is evaluated using an equation proposed by Richardson and Davis [
35], usually referred to as the CSU (Colorado State University) formula, also recommended in the circular HEC-18 and used by the FHwA program HEC-RAS. The CSU equation provides a value for the maximum erosion depth as follows:
where
K1,
K2,
K3, and
K4 are dependent correction factors, for the shape of the pier, the angle of incidence of the current, the condition of the riverbed, and the bottom of the riverbed armoring, respectively;
a is the width of the pier;
y1 is the average depth of the flow in the main channel or in the riverside areas; and
Fr1 is the Froude number in the section before the start of the branch of contraction. Equation (2) is valid both in the absence and in the presence of solid transportation.
Here we followed the guidelines provided in [
15].
The degree of vulnerability is synthetically evaluated such that each hydraulic structure (bridge or road embankment) belongs to one of the four classes defined in the methodological section.
The evaluation of the vulnerability degree is articulated through seven different phases of the analysis summarized in
Figure A1,
Figure A2,
Figure A3 and
Figure A4 in
Appendix A. In particular, in order to determine the degree of vulnerability of the structures, the cognitive data relating to the bridge and the stretch of watercourse, the hydrological and hydraulic processes have been organized into representative sheets of each bridge or road embankment. These sheets constitute a database that can be updated and give a detailed insight in relation to changes in the parameters that led to assigning the degree of vulnerability. The composition of each of the seven sections relating to a specific work is illustrated in
Figure A1,
Figure A2,
Figure A3 and
Figure A4 in
Appendix A.
3.3. Dataset and Material
Most of the topographic material employed in the present analysis has been taken from [
36,
37,
38].
Ad hoc measurements have been performed for those hydraulic structures not included in the available topographic material.
The hydrological and hydraulic analyses necessary to verify the hydraulic behavior of the structures with flood return periods RT = 50 years and RT = 200 years have been integrated and validated on the basis of [
36,
38,
39,
40].
The morphologic and hydrologic characterization of the river basins featuring the studied hydraulic structures have been performed with the following technical information:
- (a)
technical cartography available in [
41];
- (b)
1: 10,000 hydrographic network (digitized on a Regional Technical Map basis);
- (c)
DEM 20 m × 20 m (Digital Elevation Model) corrected by carving the above hydrographic network with the GIS software gvSIG [
42,
43].
The land use characterization is necessary to evaluate the hydrological response of the river basins featuring the hydraulic structures. To this aim we employed the classification named “Corine Land Cover2006” [
28].
Moreover, we evaluated the geo-lithological characteristics of the river basins featuring the hydraulic structures under investigation. To this aim we utilized the information available in [
44,
45].
The granulometric classification of the sections of the riverbed, necessary for subsequent erosion and solid transport assessments, was as far as possible deduced from photogrammetric surveys. The methodology used for the granulometric characterization of sediments is implemented in the open source software Image [
46,
47], developed for the return of photogrammetric images of the riverbed.
For a general framework of the problem or for situations where it was not possible to carry out direct surveys, reference was made to [
48,
49].
3.4. On-Site Surveys
The on-site inspection activities involved in an exhaustive manner all the road construction objects of the present study.
Typically, the inspection activities have developed through the following phases:
- (a)
acquisition of georeferenced photographic material (i.e., position of the shooting point, angle of view and direction);
- (b)
planimetric localization, using portable GPS instruments, of significant points of the structures (e.g.,: beginning/end of the bridge, beginning/end of the access embankments, positioning of culverts and road underpasses, etc.) and of hydraulic works (e.g.,: bank defenses, thresholds, bridles, etc.);
- (c)
integration of existing topographic surveys through measurements performed with a laser distance meter and/or with metric tape on the characteristic elements of the analyzed work (width and length of the deck, size of the spans, width and length of the piers, of the foundation plinths, etc.);
- (d)
census of any hydrometers installed near the building with indication of type and position;
- (e)
observations relating to the presence of protection works of the access embankments, of hydraulic works connected to the bridge or riverbed, with indication of type and position;
- (f)
photogrammetric surveys of the granulometric characteristics of the riverbed as far as they are visible and photographable;
- (g)
observations on the morphology of the riverbed;
- (h)
observations related to the possible presence of erosion at the foot of the foundations of piers, abutments and access embankments.
During the summer, in drought conditions of the watercourse, additional inspections were carried out in order to acquire information on the grain size in the riverbed and on the possible erosion of the foundations of piles, abutments and access embankments.
3.5. Evaluation of the Morphological and Hydrological Parameters
The processing of the identification of these parameters concerned most of the works belonging to the main network and some of the works of the secondary network, in particular:
- (a)
for the bridges of the main network, morphological parameters (basin area; average and maximum basin elevation; water elevation at closing section, river length) and the CN (Curve Number) relating to the section subtended by the bridge were evaluated in the context of this study;
- (b)
for the bridges of the secondary network, the morphological data of the basin underlying the section of bridge closure, the CN and the reference flow rates were obtained from this study;
- (c)
for road embankments, the morphological parameters, the reference CN and the flow data are referred to the bridge immediately upstream of the embankment.
The morphometric parameters of the basins underlying the section of the building and the relative flow rates (where necessary) were obtained with an ad hoc procedure that uses GIS technology [
50]. This module uses as data input: (a) the digital land model of the basin to be studied; (b) the coordinates of the closing section of the basin; (c) the threshold, expressed in the number of cells, of the drainage area in a channel. The module implements some tools recently developed by Jasiewicz and Metz [
51].
To evaluate the territorial distribution of the CN, used to estimate the inflow coefficient, the procedure superimposes the information from the land use map (Corine Land Cover 2006) and those relating to the permeability of the soil derived from the Geological Maps (Geological Map of Italy) to find the CN value for each raster unit of size 20 m × 20 m; the average CN of each basin was then obtained by weighing the CN values relative to the single cell with respect to the area.
3.6. Hydraulic Analysis
The values of the parameters relating to the hydraulic simulations for each work have been obtained through the already mentioned hydraulic simulations. These simulations concerned some bridges belonging to the secondary network of which no official elaborations by the Tiber Basin Authority were available.
3.7. Potential Erosion of the Bridge Foundation
The evaluation of the erosion on the foundations of piers and abutments of bridges concerned all the works belonging to the main network (Tiber, Chiascio, Nestore, Naia) and some of the works of the secondary network.
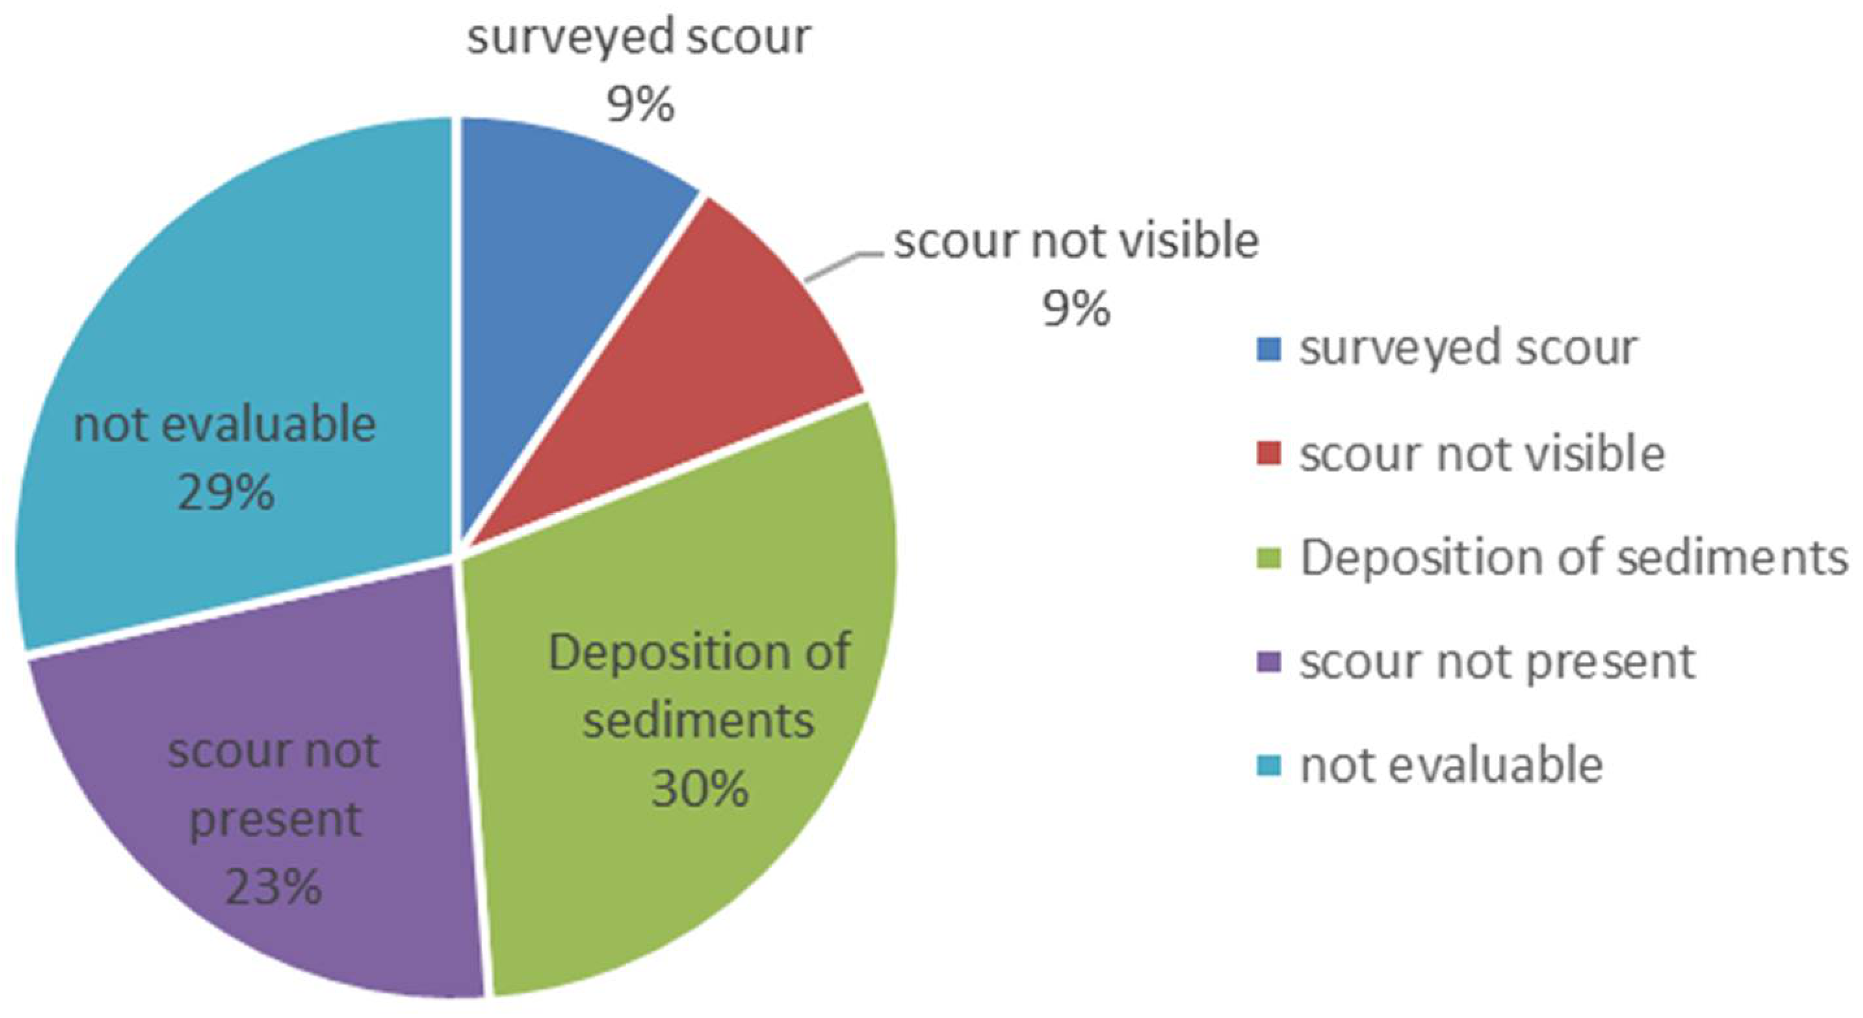
As for most of the bridge and embankments relating to the Topino and Marroggia basin (with the exception of some works belonging to the Alto Topino, the Alto Marroggia and the Basso Topino near the confluence with the Chiascio), we did not estimate potential erosion, as these stretches are notoriously in a state of deposition of sediments [
52].
The phenomenon of erosion at the base of bridge piers can be considered as the superposition of three processes: general scour, generalized erosion due to the plano-altimetric evolution of the watercourse on which the crossing work insists and is therefore independent of the presence of the work itself; contraction scour, due to the shrinkage induced by the crossing work; local scour, the localized erosion at the base of the piers and abutments of the bridge, caused by the deviations of the water flow induced by the presence of the structures in the riverbed that in turn cause local increases in the flow speed.
3.7.1. Generalized Erosion
The estimate of the generalized erosion of a watercourse can be considered to be linked to the concept of compensation slope or equilibrium slope; the value of ic can be obtained from that of the slope of the watercourse through Equation (1).
3.7.2. Erosion by Contraction
In the literature, for the evaluation of erosion by contraction, several formulations can be found based both on laboratory experiences and on the empirical interpretation of the field observations available [
32,
33,
34].
Here we performed this evaluation with the HEC-RAS software, which implements the algorithms illustrated in the HEC (Hydraulic Engineering Circular) circular n° 18 [
32]. The formulas used vary depending on whether solid transport is present (live bed) or not (clear water), which requires a calculation of the value of the critical speed associated with the so-called “beginning of the movement” [
33].
3.7.3. Localized Erosion at the Piers and Abutments
The evaluation of localized erosion at the piers is done using Equation (2), which provides a value for the maximum erosion depth and is valid both in the absence and in the presence of a solid transport.
With regards to localized erosion at the abutments of the bridge, the application of the Hire Equation [
35] and the Froehlich Equation [
53] lead to unlikely results, probably because these formulas have been experimentally deduced from observations on works that cannot be assimilated from the point of view of hydraulic behavior to those studied. Therefore, in most cases, we assumed that the erosion on the foundations of the abutments was equal to a portion of that calculated on the foundations of the piers. In the absence of piles, we assumed that the erosion on the foundations of the abutments was equal to that caused by the contraction of the section due to the presence of the work.
3.7.4. Potential Erosion at the Base of Road Embankments
Potential erosion at the base of road embankments was assessed using Shields’ limiting equilibrium criterion for sediments with a uniform grain size, which defines a minimum threshold value of the dimensionless stress [
54].
4. Results
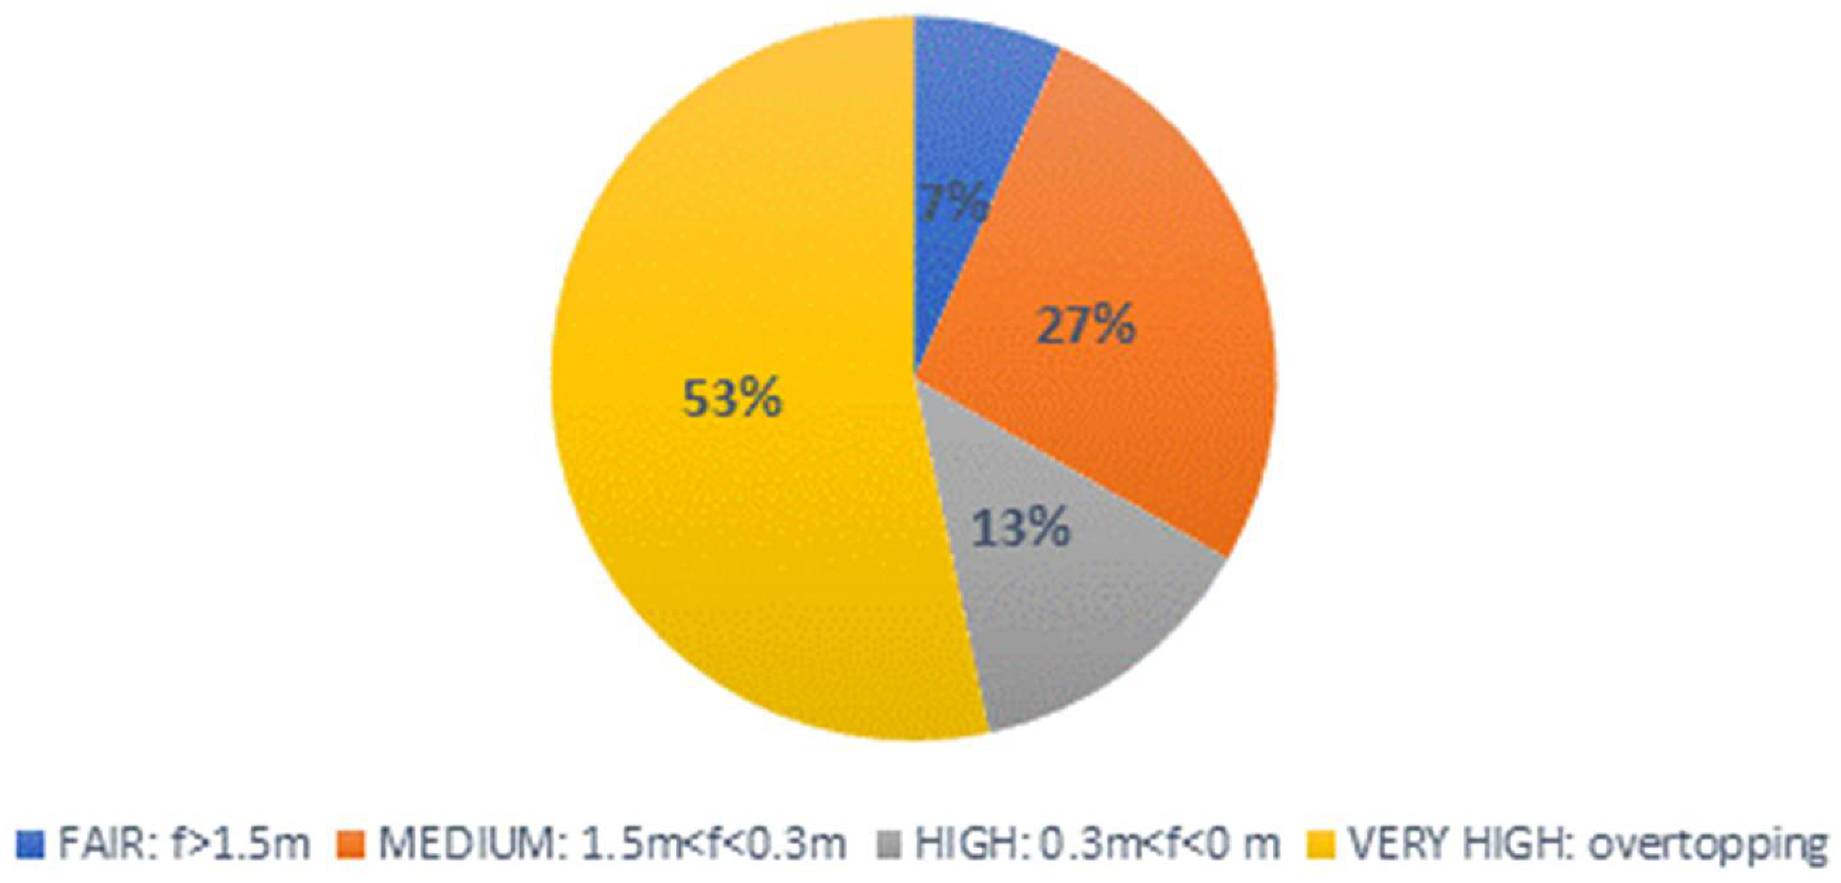
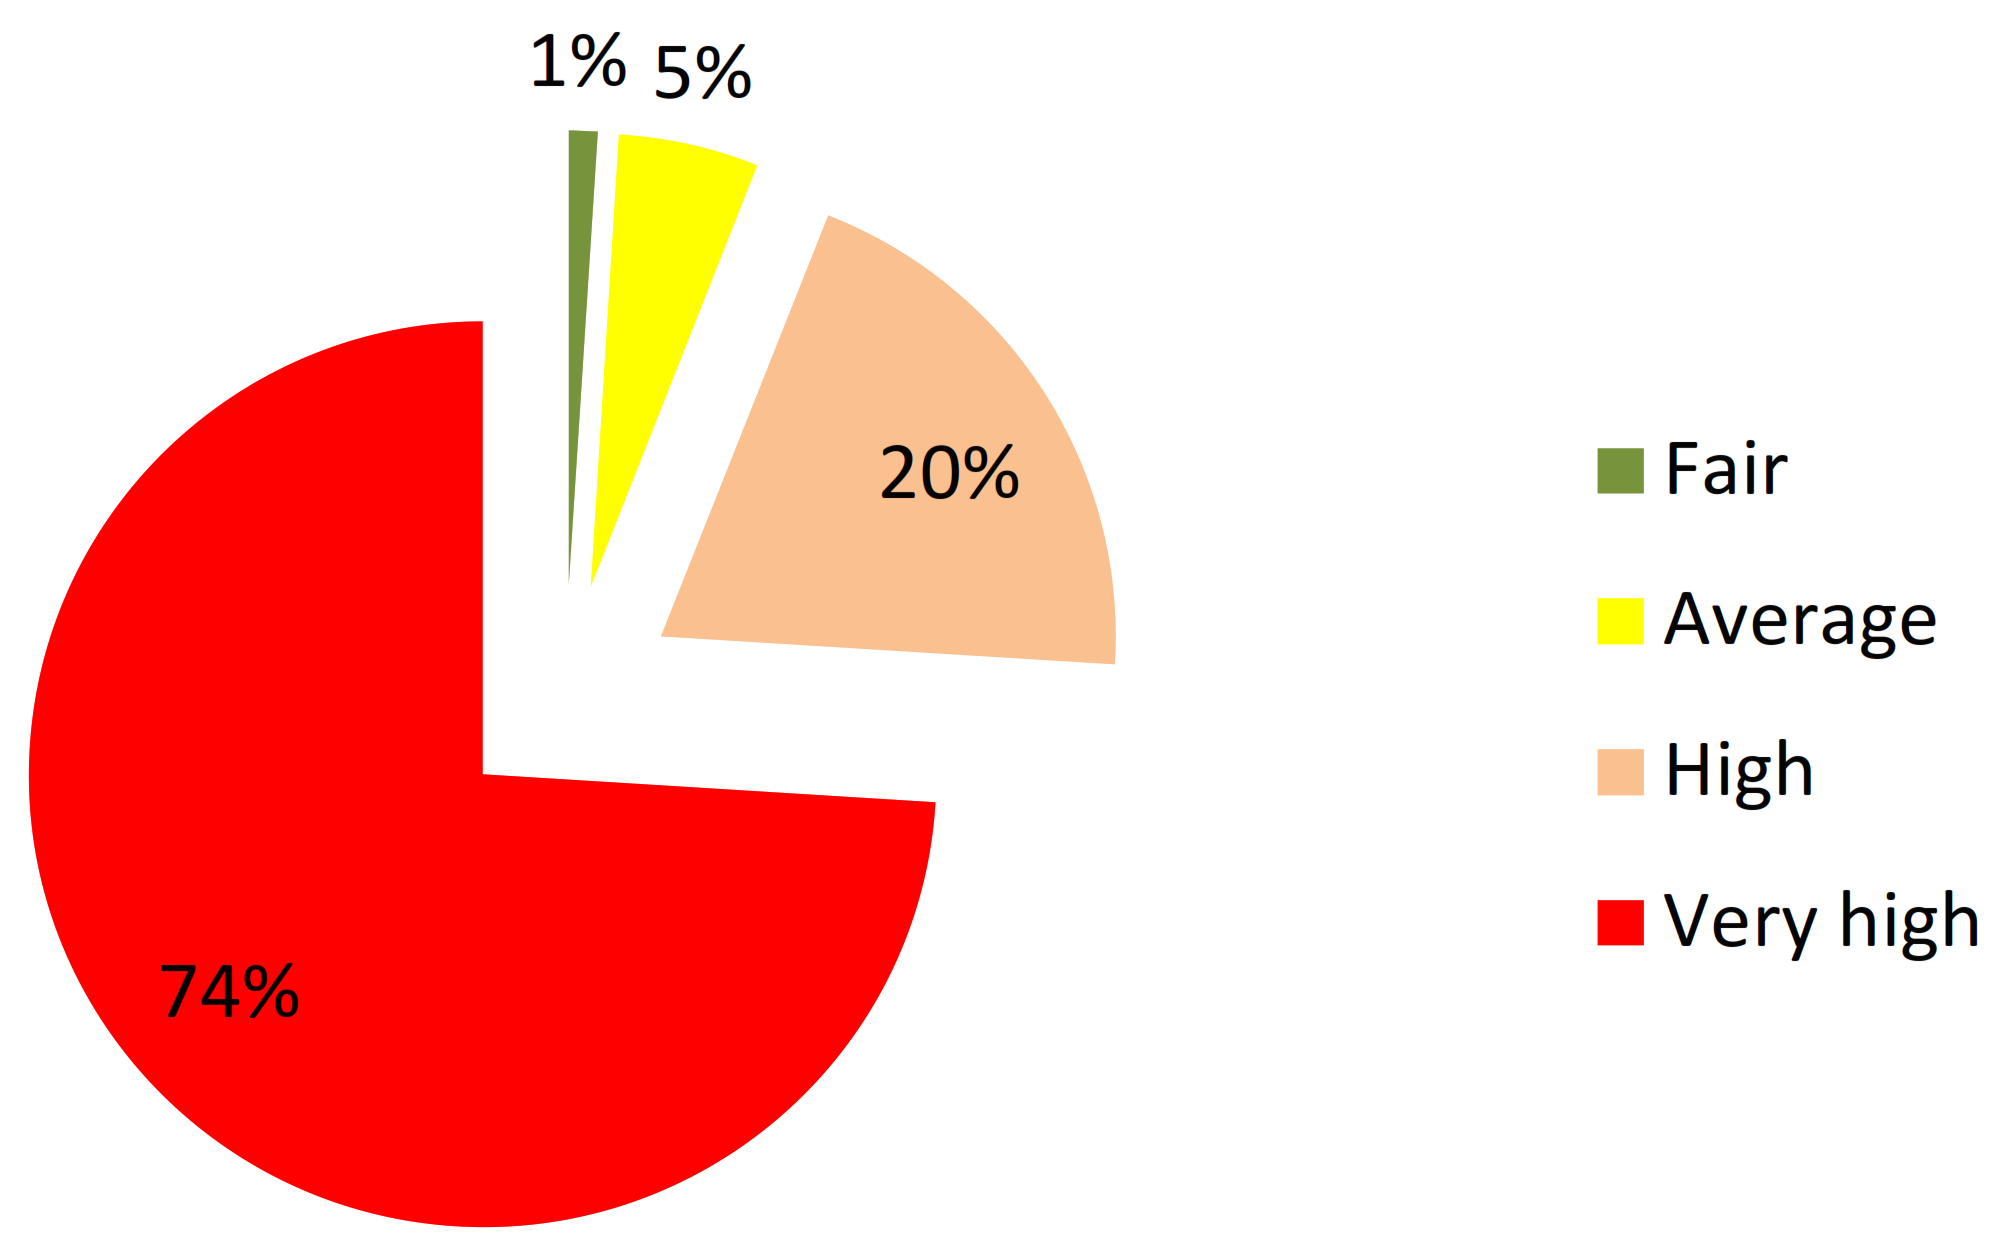
Analysis of the results of this study shows that 74% of the works (bridges and road embankments) on provincial roads have a very high vulnerability value, 20% a high value, 5% an average value, and finally only 1% a fair value (see
Figure 8). It is worth noting that the case study analyzed in the present paper is focused on an area characterized by old structures; it is therefore quite reasonable that most of them are allocated in the high risk category.
The high number of structures with very high vulnerability is related to the observed hydraulic and geometric conditions, especially along the secondary river network, and reveals that the proposed methodology is conservative, which is to say that safety conditions are preferred. We also observe that in some cases the high or very high vulnerability is related to a freeboard value out of the range established by legislation. On the other hand, pier and abutment erosion of the foundations has affected the judgment of global vulnerability, especially for the structures of the main river network that are most exposed to this phenomenon.
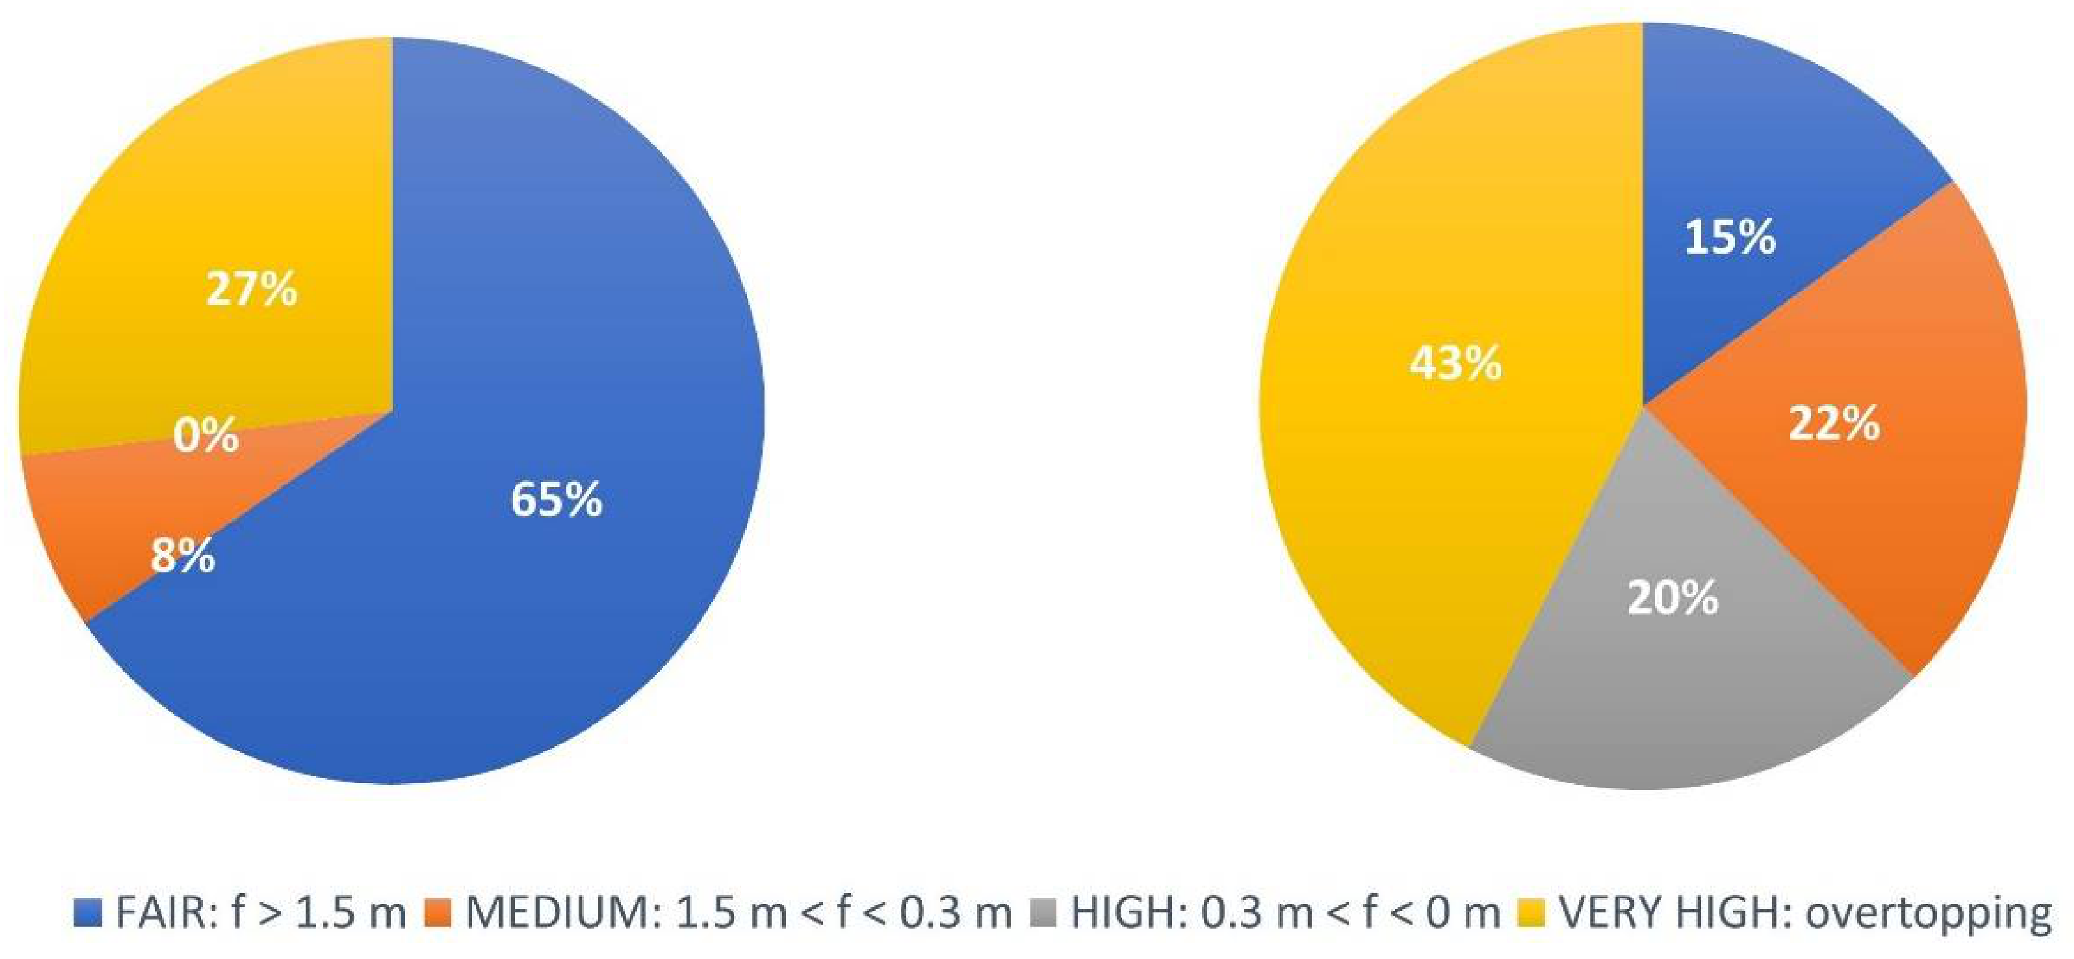
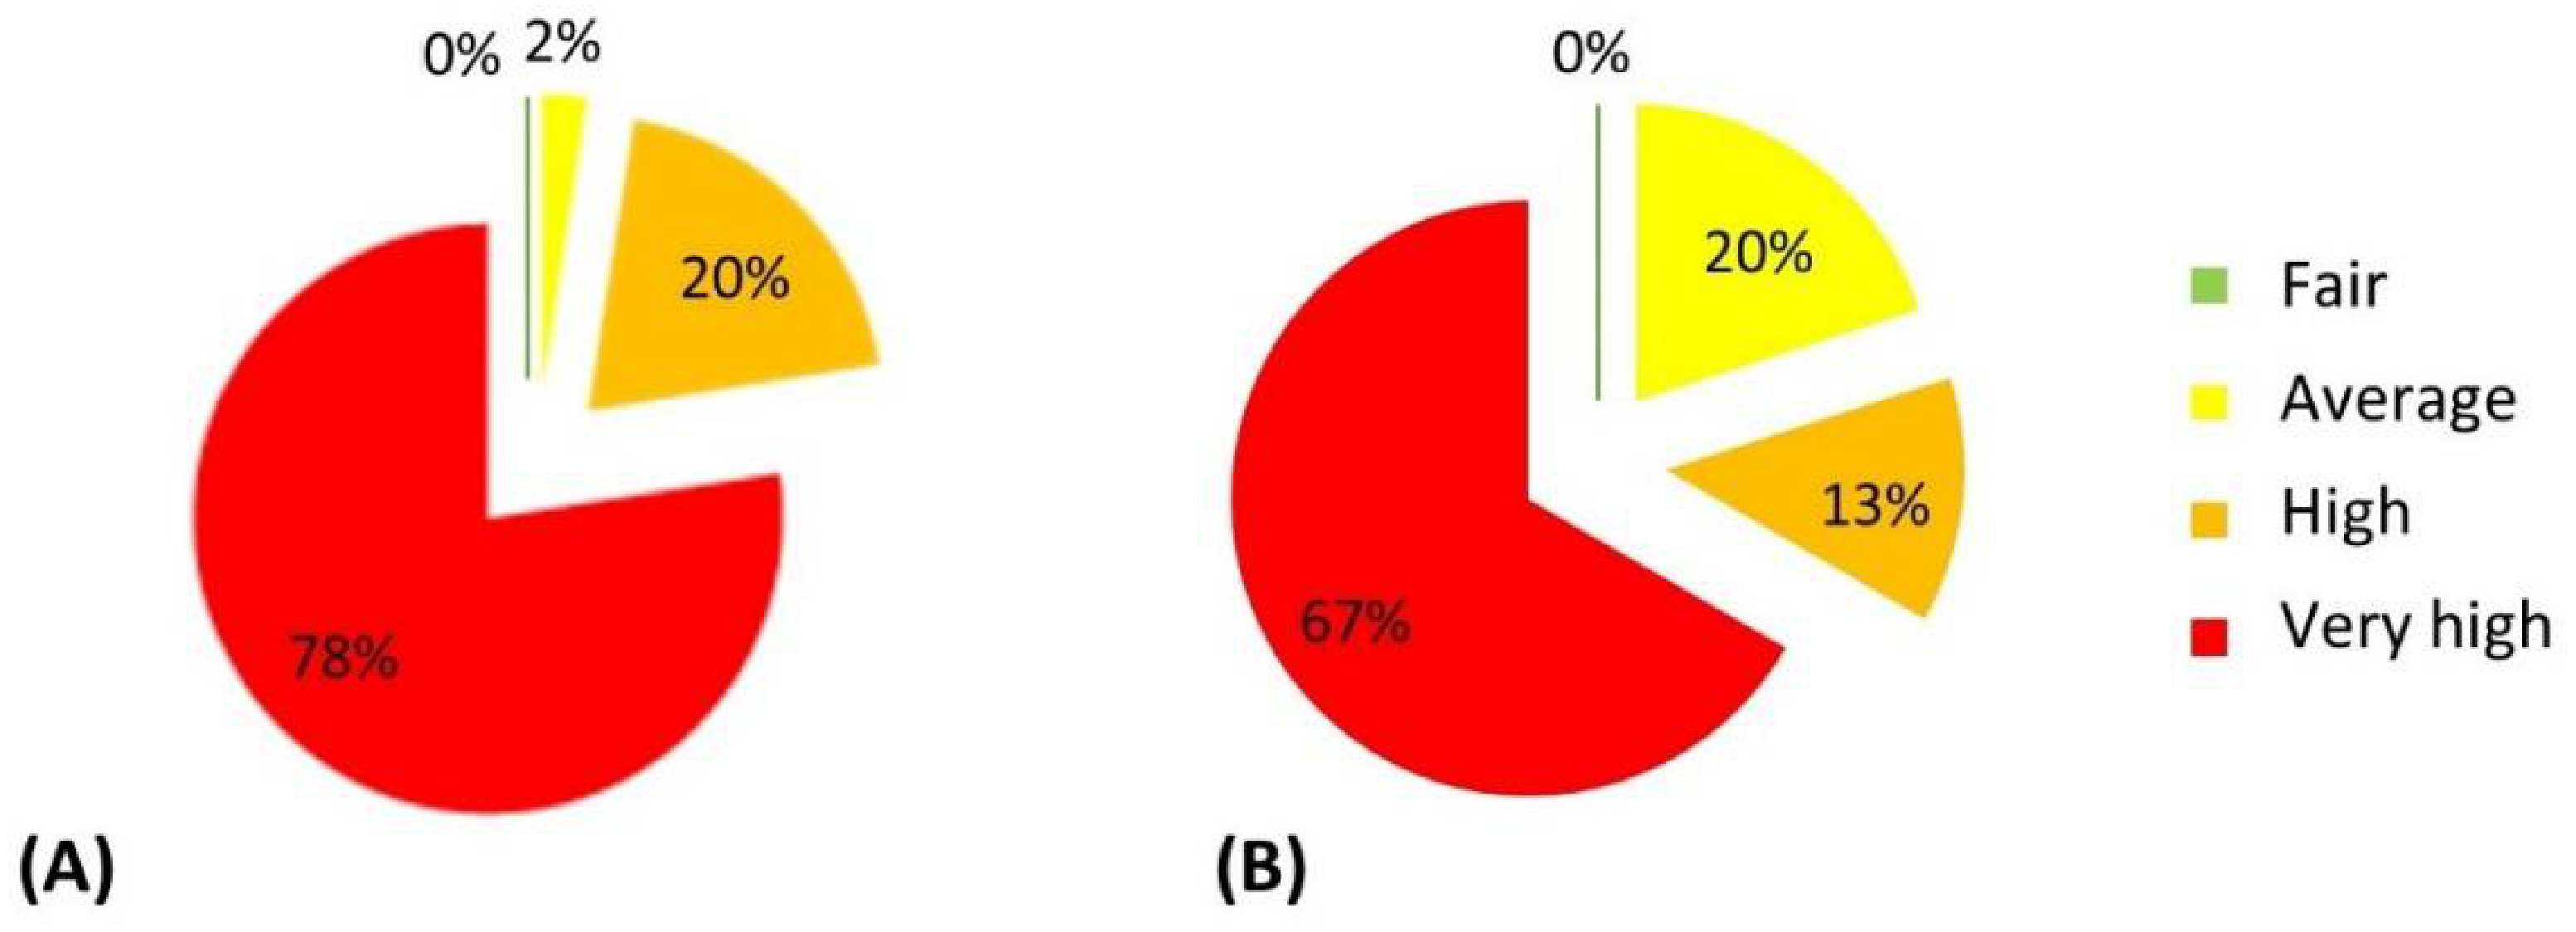
The situation is particularly critical for the crossing structures that lie on the secondary grid, for which the very high degree of vulnerability is clearly prevalent (78%) (
Figure 9A), while a lower vulnerability is observed for road embankments and access ramps, although no works of this type were found to be entirely adequate (
Figure 9B).
Among the main causes underlying the high and very high vulnerability assessed, we can mention: (a) the inadequacy of the safety freeboard with respect to the intrados of the bridge; (b) the safety freeboard with respect to the minimum share of the access embankment; (c) the danger of obstruction of openings; (d) the danger of erosion on the foundations of piers and/or abutments of the bridge. The critical issues listed are more reflected in the works that insist on the secondary network, as those shown for example in
Figure 10, demonstrating a widespread vulnerability, especially on minor waterways where attention and maintenance are often lacking, with problems of competence between local institutions for execution and control.
The analysis of the factors that contribute to the definition of the vulnerability of a work allows us to identify, in a first approximation, the qualitative indications on the measurements that can be implemented to reduce its vulnerability. In particular, the following categories of intervention were considered:
- (a)
Measure 1: insights into the critical issues highlighted in the study, which can range from collecting data in great detail to implement more precise calculation procedures, up to properly monitoring such criticalities;
- (b)
Measure 2: extraordinary maintenance interventions (rehabilitation and/or structural consolidation);
- (c)
Measure 3: ordinary periodic maintenance of the building and of the works connected to it, preventive and subsequent to flood events;
- (d)
Measure 4: management procedures of the building during the flood event within the framework of preordained Civil Protection Plans (alarm level, monitoring, exclusion from traffic, etc.)
Then, these measures have been further distinguished for each work, not only on the basis of the global vulnerability, but also on the basis of the characteristics of the work and of the single parameter that leads us to define the level of global vulnerability.
Measure 1: An analysis of the hydraulic behavior close to the structure (velocity, water surface level, erosive dynamics) is suggested for all the structures (fair, medium, high, very high vulnerability), but it has to be detailed especially for structures with high or very high vulnerability derived from a non-adequate freeboard or scour at foundations; moreover, for such structures, a periodic surveys should be programmed to test the state of the work and its foundations in detail.
Measure 2: Extraordinary maintenance interventions based on structural measurements (i.e., design and realization of protection methods useful to reduce the scour vulnerability) have been provided only for structures with high or very high vulnerability.
Measure 3: A preventive periodic survey (at least annual) has been suggested for all the structures (fair, medium, high, very high vulnerability). For high and very high vulnerability structures, periodic interventions should be programmed to monitor the state of defensive works (if present) linked to the structure. Eventual opening obstructions should be removed after a flood event.
Measure 4: During a flood event, all the structures have to be monitored; but, for given discharge values, the Provincial Road Service (in accordance with the Civil Protection Service) will close the bridge or the road embankment characterized by high or very high vulnerability and different routes will be organized to avoid any traffic jam close to the structure.
The proposed methodology represents an analysis of the hydraulic risk in agricultural areas with the presence of infrastructures and the aim of this work is to present a concise evaluation of the degree of vulnerability of each examined work. Even though the synthetic output is represented by qualitative information, as specified in
Section 3, the proposed approach is based on a quantitative analysis of different aspects: the degree of vulnerability for each individual parameter is evaluated, in most cases, with reference to the numerical criteria dictated by the legislation.
Only if the corresponding technical rule of a parameter does not give requirements in terms of numerical ranges or thresholds to be fulfilled (e.g., interference with flow morphology and other hydraulic works) is the vulnerability level set according to an in situ evaluation based on accurate surveys, a preliminary study on river hydraulics, morphological and evolutive characteristics of the area and historical floods events.
The model gives a global vulnerability value of the analyzed work that is generally conservative, but we have to consider that the structures considered in this paper are old and only one (the one that presents a fair global vulnerability value) has been recently built. Moreover, we do not have to consider only the global vulnerability of the work. In fact, the model defines a priority order of the strategies protecting the work and this is due to an accurate differentiation of the vulnerability parameters.
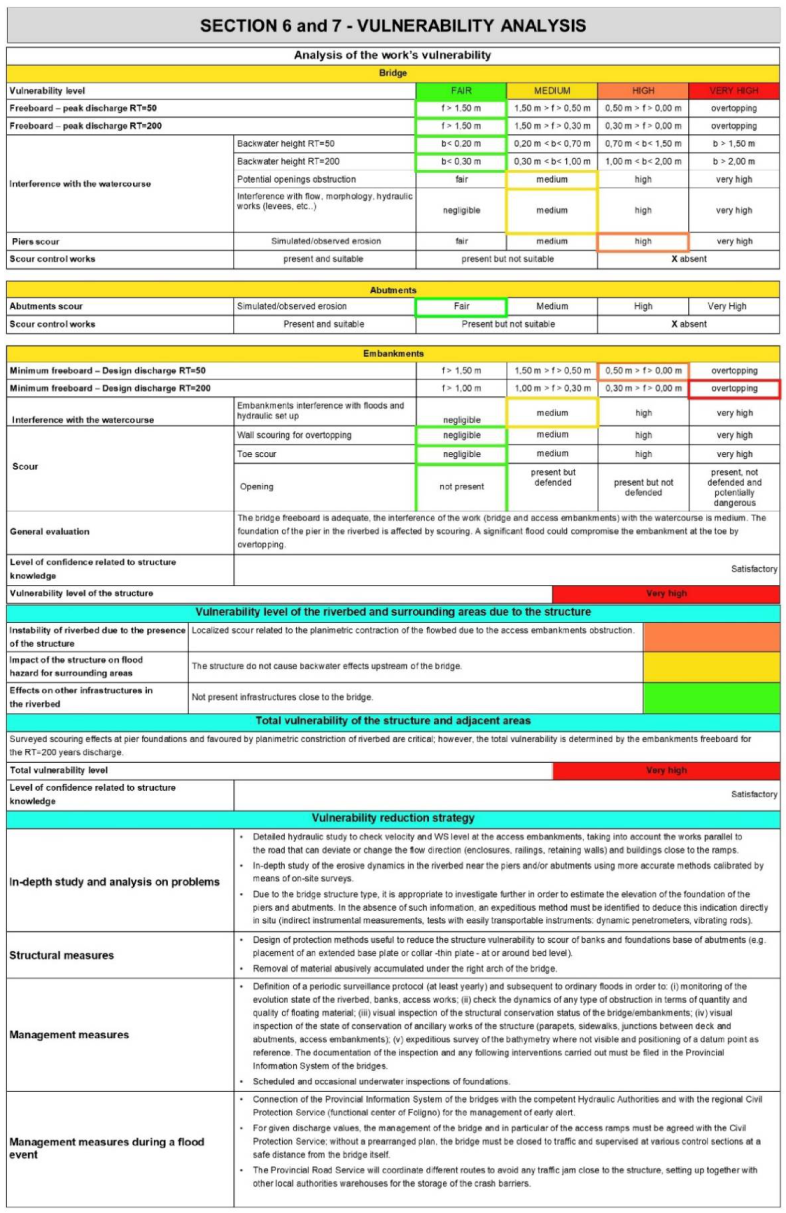
A clear example is given in
Figure A3 in the
Appendix A. In such a case, the bridge is characterized by a very high vulnerability global level, and this is due to the scour at the pier foundations and to the overtopping of the embankments. These two parameters influence the vulnerability reduction strategies listed in
Appendix A and
Appendix B (vulnerability analysis). For every work, a similar analysis has been performed and the strategies adopted depend on the parameters influencing the vulnerability of the bridge/road embankments.
For the sake of length, we could not include all this information in this paper. However, to further clarify the methodology and its quantitative nature, an example of the data collected to evaluate the vulnerability (i.e., freeboard and surveyed scour) for the 84 analyzed works is reported (see
Table A1 and
Table A2 and
Figure A5,
Figure A6,
Figure A7 and
Figure A8 in
Appendix B).
A crucial aspect highlighted by the Floods Directive [
55] is the importance of the transition from protection to risk management.
This concept appears to be very important in the topic under consideration, given the obtained results, in which the prevalence of high-grade vulnerability requires the dissemination of information to all the subjects involved in civil protection activities, even all citizenship.
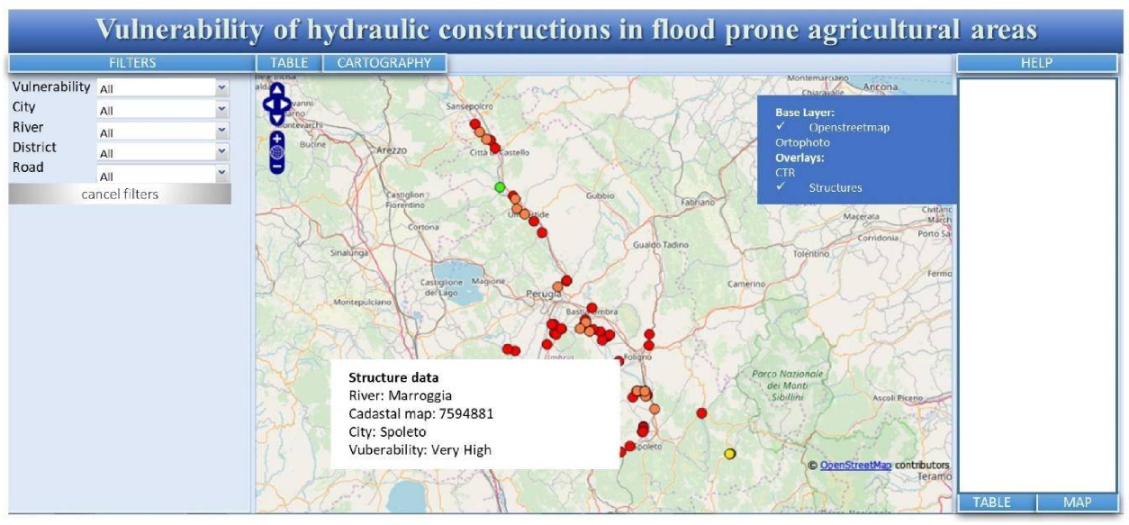
In fact, it is now an established fact that the conscious participation of all the subjects currently represents the main guarantee to avoid the greatest damage, represented by the loss of human life. From this perspective, ICT (Information and Communications Technology) tools certainly represent a valid contribution to the achievement of this goal. Therefore, in this study, a WebGis system was developed, both on a methodological and an operational level, which is easy to consult as the first ICT approach to disseminating results.
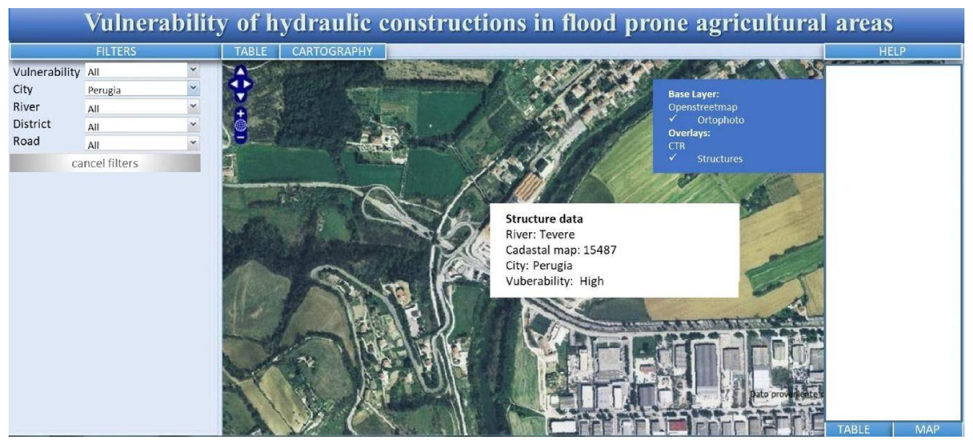
The system allows viewing all the structures studied in tabular form and on a map (
Figure 11), being able to operate filters by a level of vulnerability, municipal area, watercourse, district and road, and thus allowing an easy identification of those bridges which require monitoring and/or traffic bans during flood events. It is possible to easily detail the urban context of these structures by zooming in on the map (
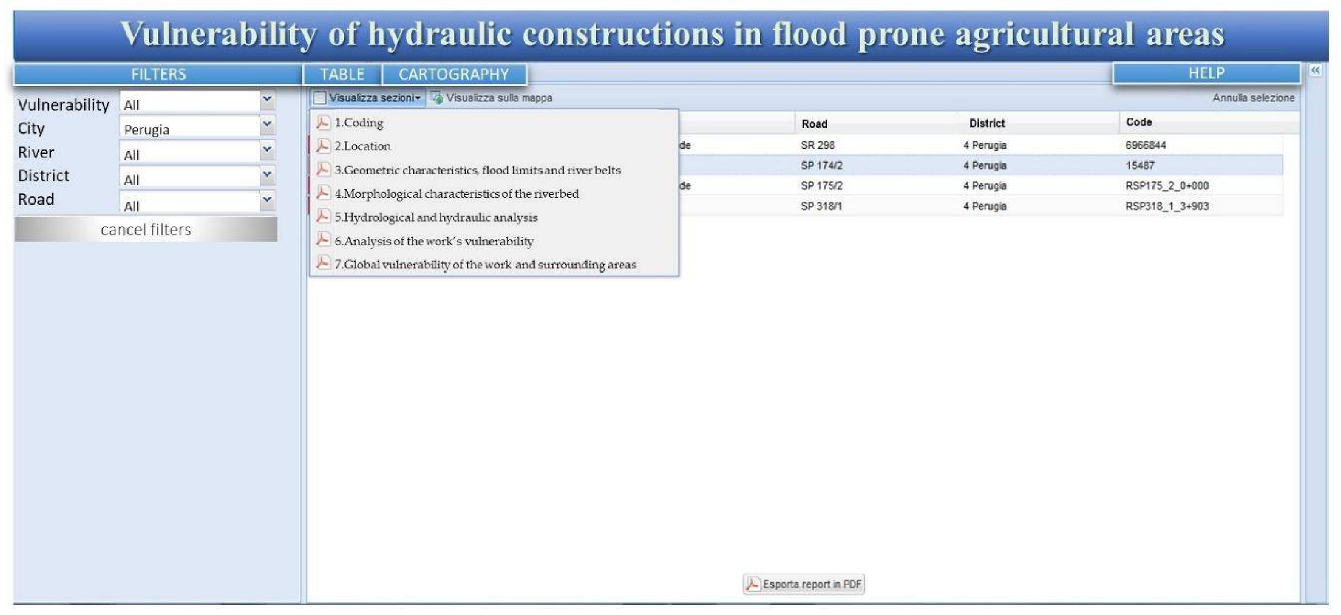
Figure 12), or to search specifically for the results of the study by viewing the various sections of the sheet (
Figure 13) and downloading the details of moments of the greatest interest (
Figure 14).
All these operations can be carried out with tools now commonly used by authorized users or, with limitations on data management, by free users, thus allowing an aware management of risk but also an easy dissemination of information to a wider audience than the technical and administrative ones, erroneously considered the only bearers of interest on these issues.
5. Conclusions
A methodology for assessing the vulnerability of hydraulic constructions in flood-prone areas has been developed and applied to part of the Tiber River basin. In particular, 84 structures (69 bridges and 15 road embankments) along the Tiber River network have been analyzed and a concise evaluation of the degree of vulnerability of each work has been determined according to the following classes: fair, average, high, very high. The assessment includes successive stages of analysis regarding the general features of the structure, the characteristics of the river reach and the hydrologic and hydraulic calculations and evaluations.
The results of the aforementioned study showed that 74% of the works have a very high vulnerability, 20% have a high vulnerability, 5% an average vulnerability and only 1% of the works were characterized by low vulnerability.
The most significant aspects of the study concerned the formalization of an objective and repeatable methodology to assess the vulnerability of road constructions that interfere with the hydrographic network and the possibility of disseminating the results from an ICT (Information and Communications Technology) perspective to raise awareness of the population concerned “ex-ante”, to manage flood events of different risks “in itinere”, and to evaluate the effects on vulnerable structures “ex-post”. It is important to note that the analysis of road constructions according to the illustrated procedure allows defining an ordinal hierarchy to plan the necessary extraordinary maintenance interventions, thus achieving the best allocation of the available economic resources. The proposed methodology remains open to scientific updates regarding the hydraulic modeling of the interaction between water flow and infrastructures and to in-depth analyses of cognitive data, especially those regarding the state of places (topographic, sedimentological and structural data). The connection of the WebGis system with the warning systems managed by the Functional Hydrological Meteorological Monitoring Centers represents the natural conclusion of the study. This connection, in fact, allows the safe management of bridges and of the entire road network when fully operational through hydraulic analyses on vulnerability and on the hydraulic status, which can be detected or modeled.
As a future development, a further enhancement of the proposed methodology could be integration with a Multicriteria Analysis (MCA) [
56], combining the priority order of vulnerability parameters resulting from the present methodology, which is strongly supported by the literature [
1,
2,
3,
13], and an assessment against the criteria set and the criteria weights typical of an MCA approach, possibly requiring sufficient data available for calibration. In fact, the MCA could be applied to our case study if we had proper data to calibrate the model.
Moreover, we are currently investigating the possible integration of detailed hydraulic simulations [
57,
58,
59,
60,
61] instead of one-dimensional ones for particularly complex circumstances, thus improving the effectiveness of the methodology.


 ,
, 


