
Green Space Optimization Strategy to Prevent Urban Flood Risk in the City Centre of Wuhan


Abstract
:1. Introduction
2. Materials and Methods
2.1. Catchment-Capacity Simulation Experiment
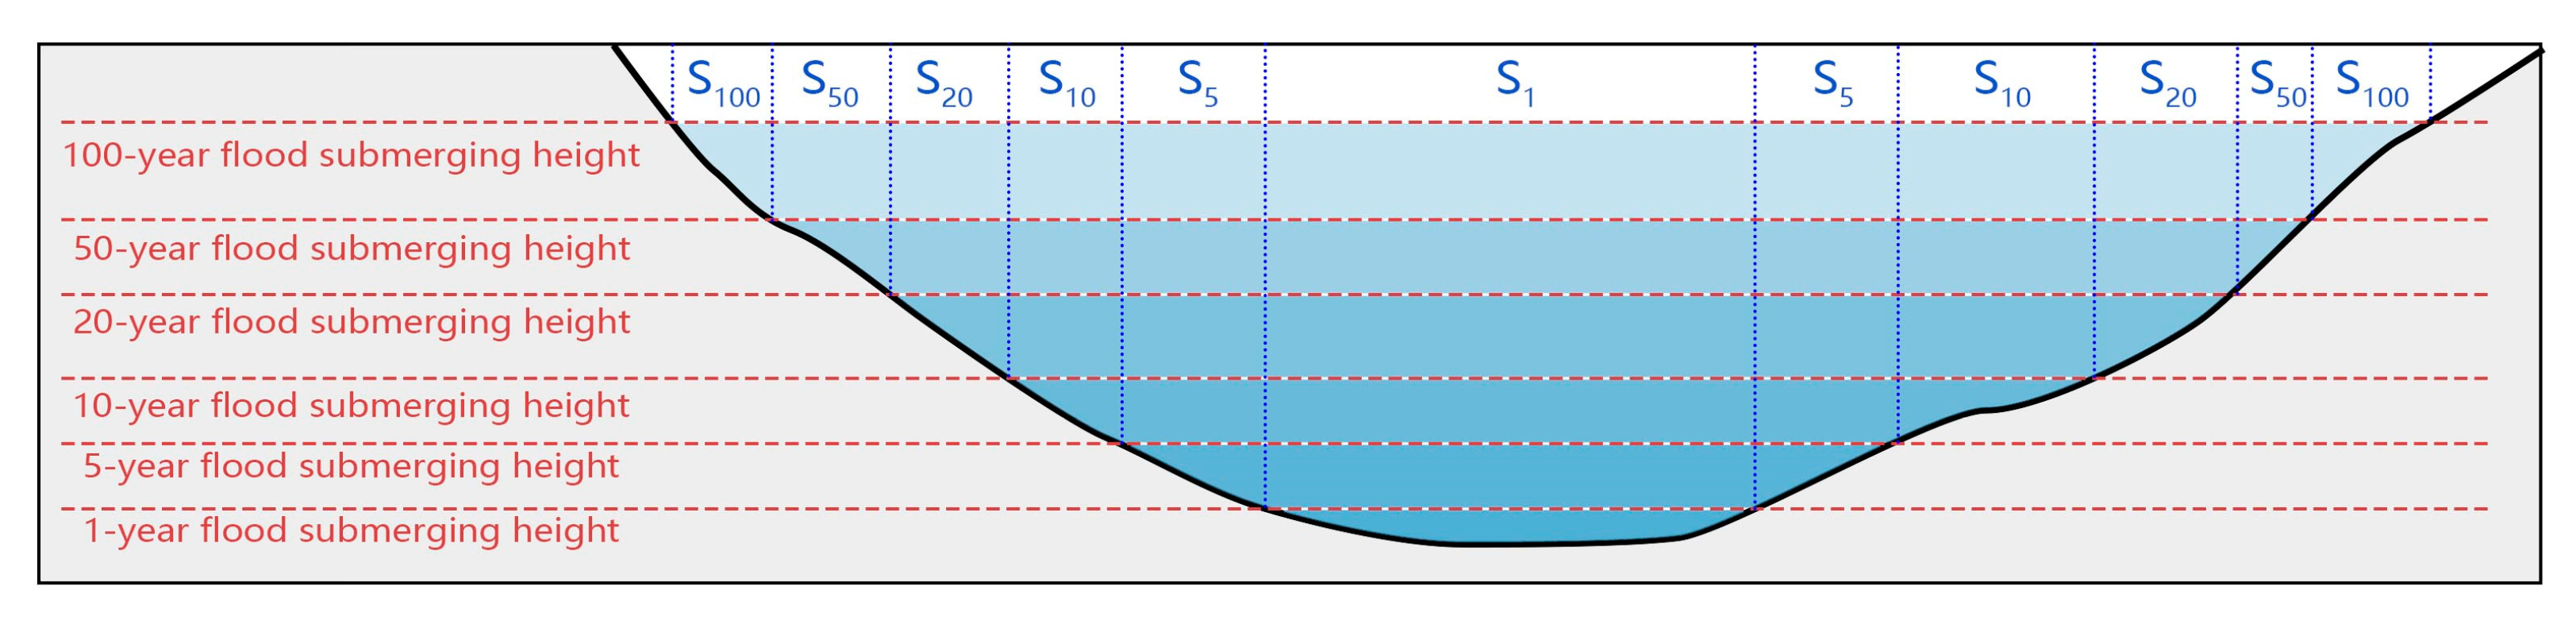
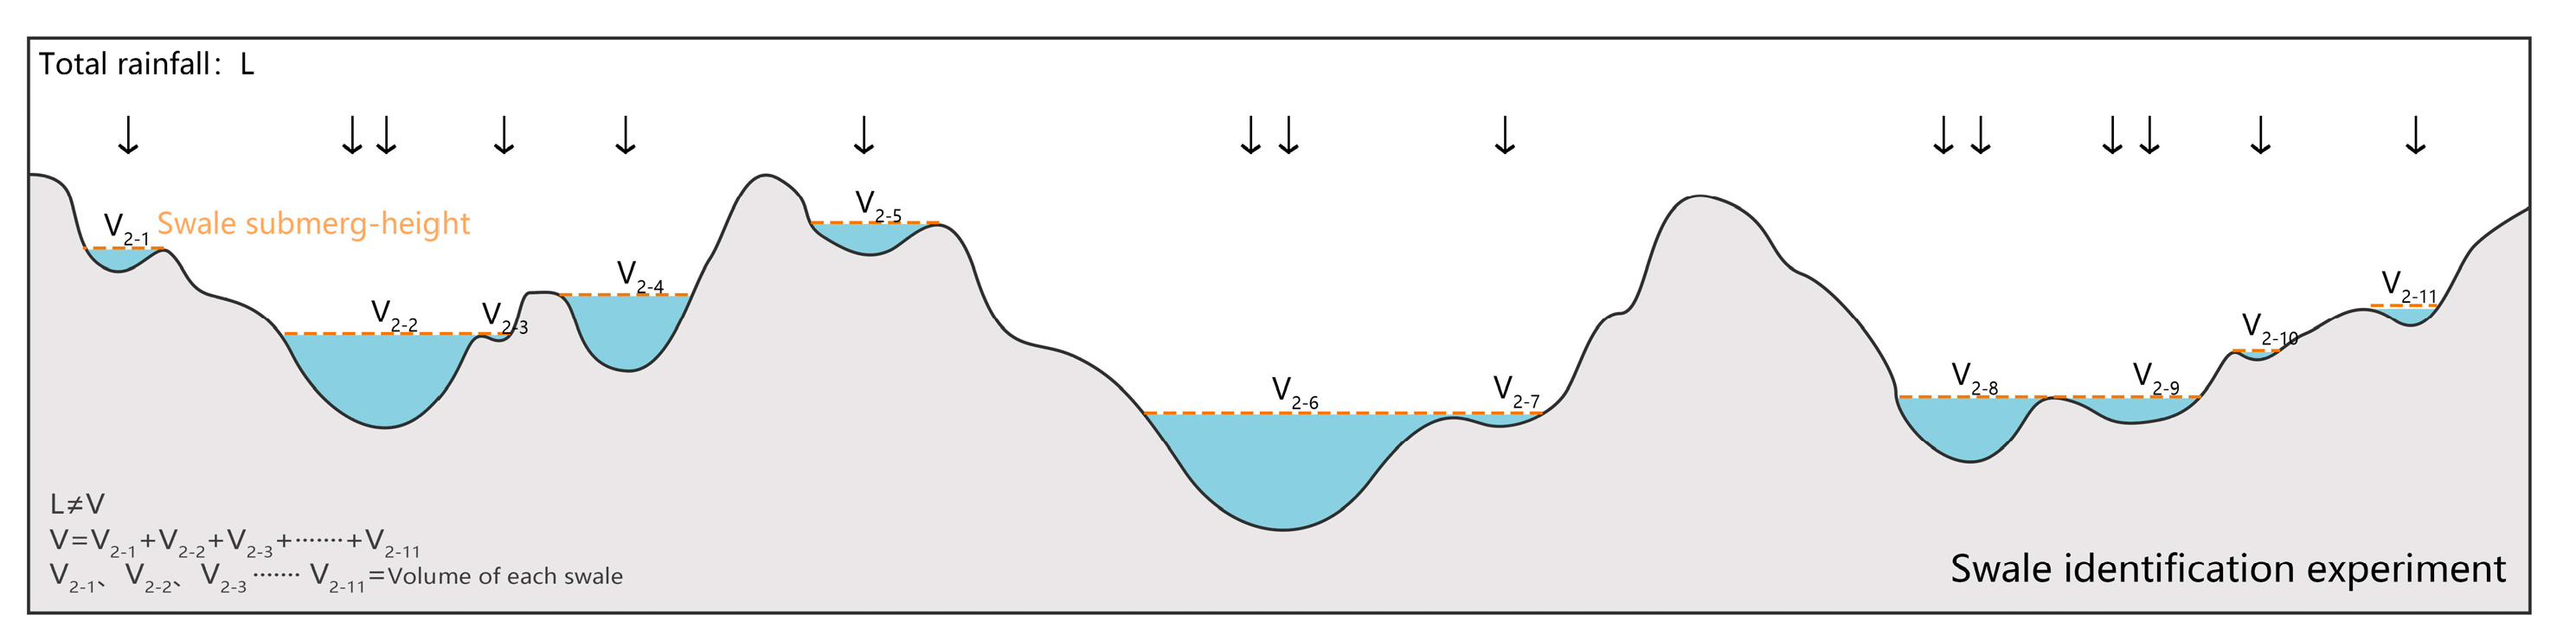
2.1.1. Swale Identification Experiment
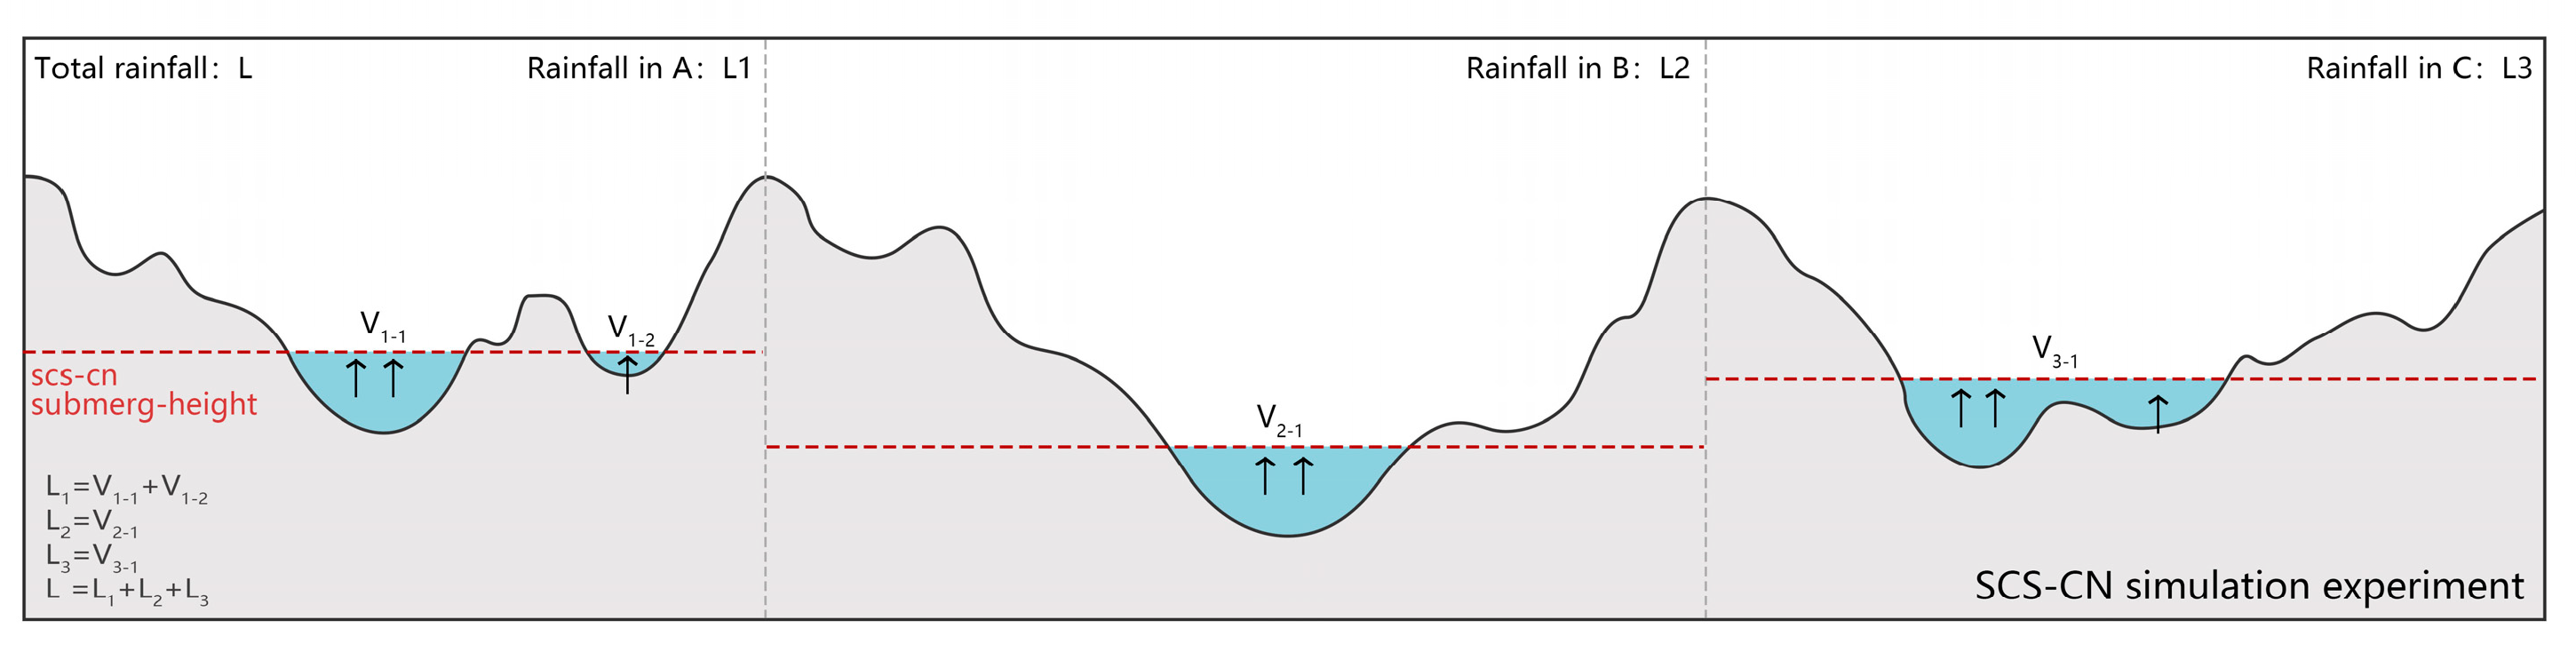
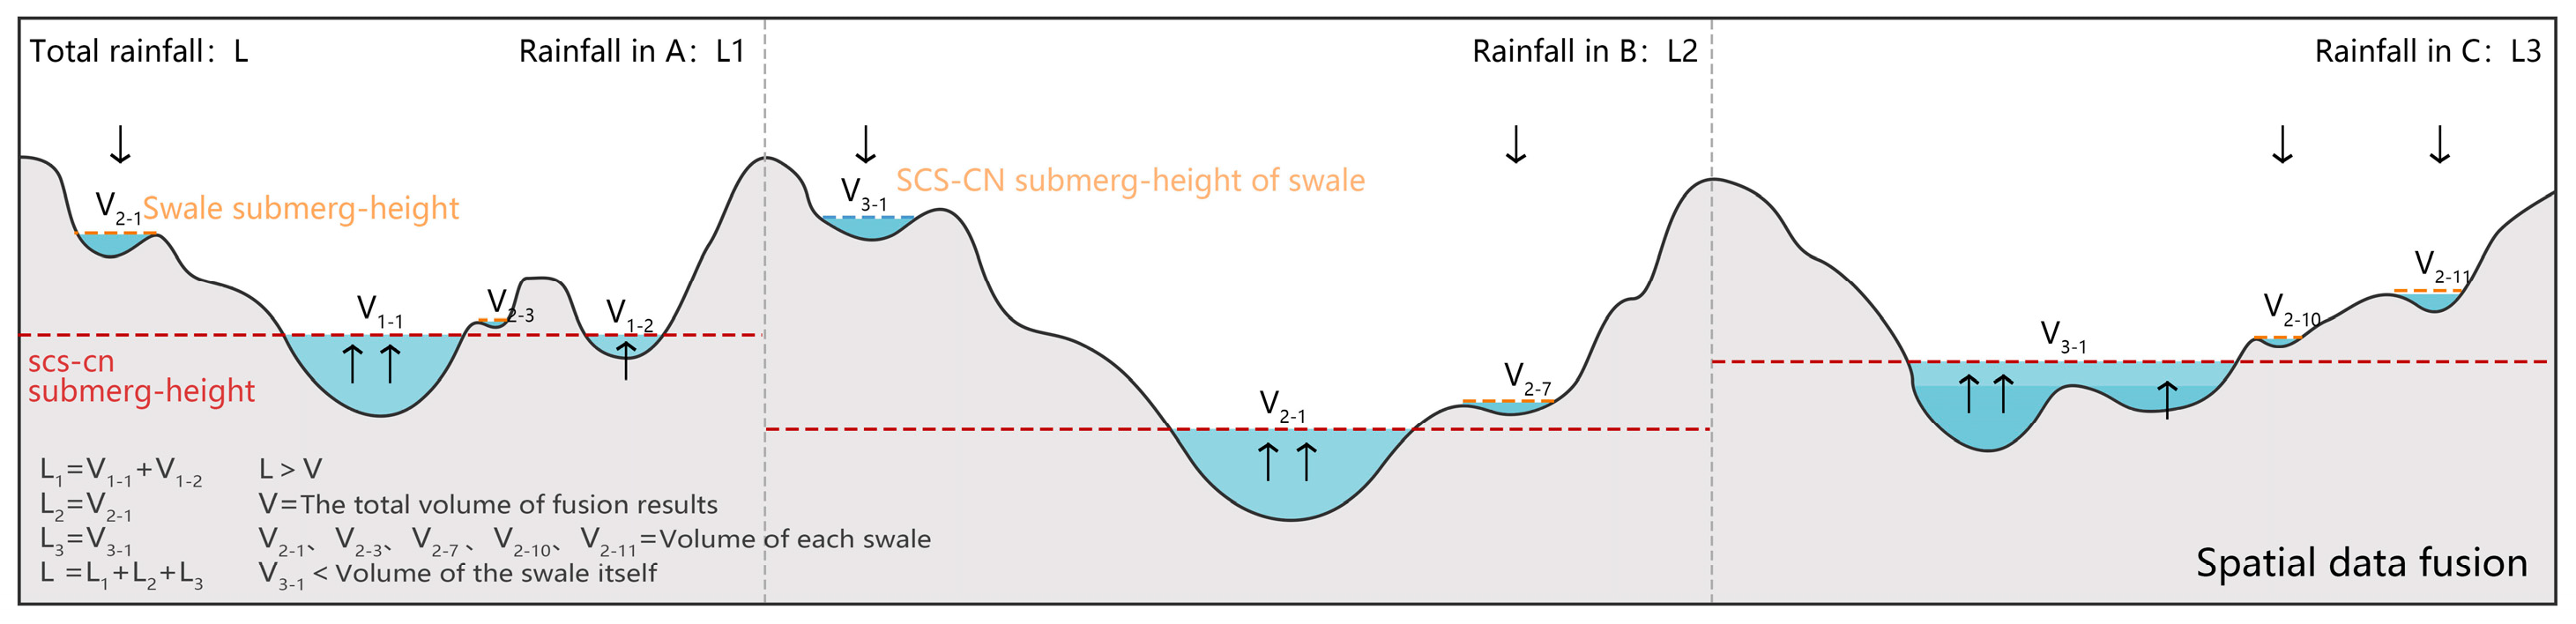
2.1.2. SCS-CN-Based Flood-Submerging Simulation Experiment
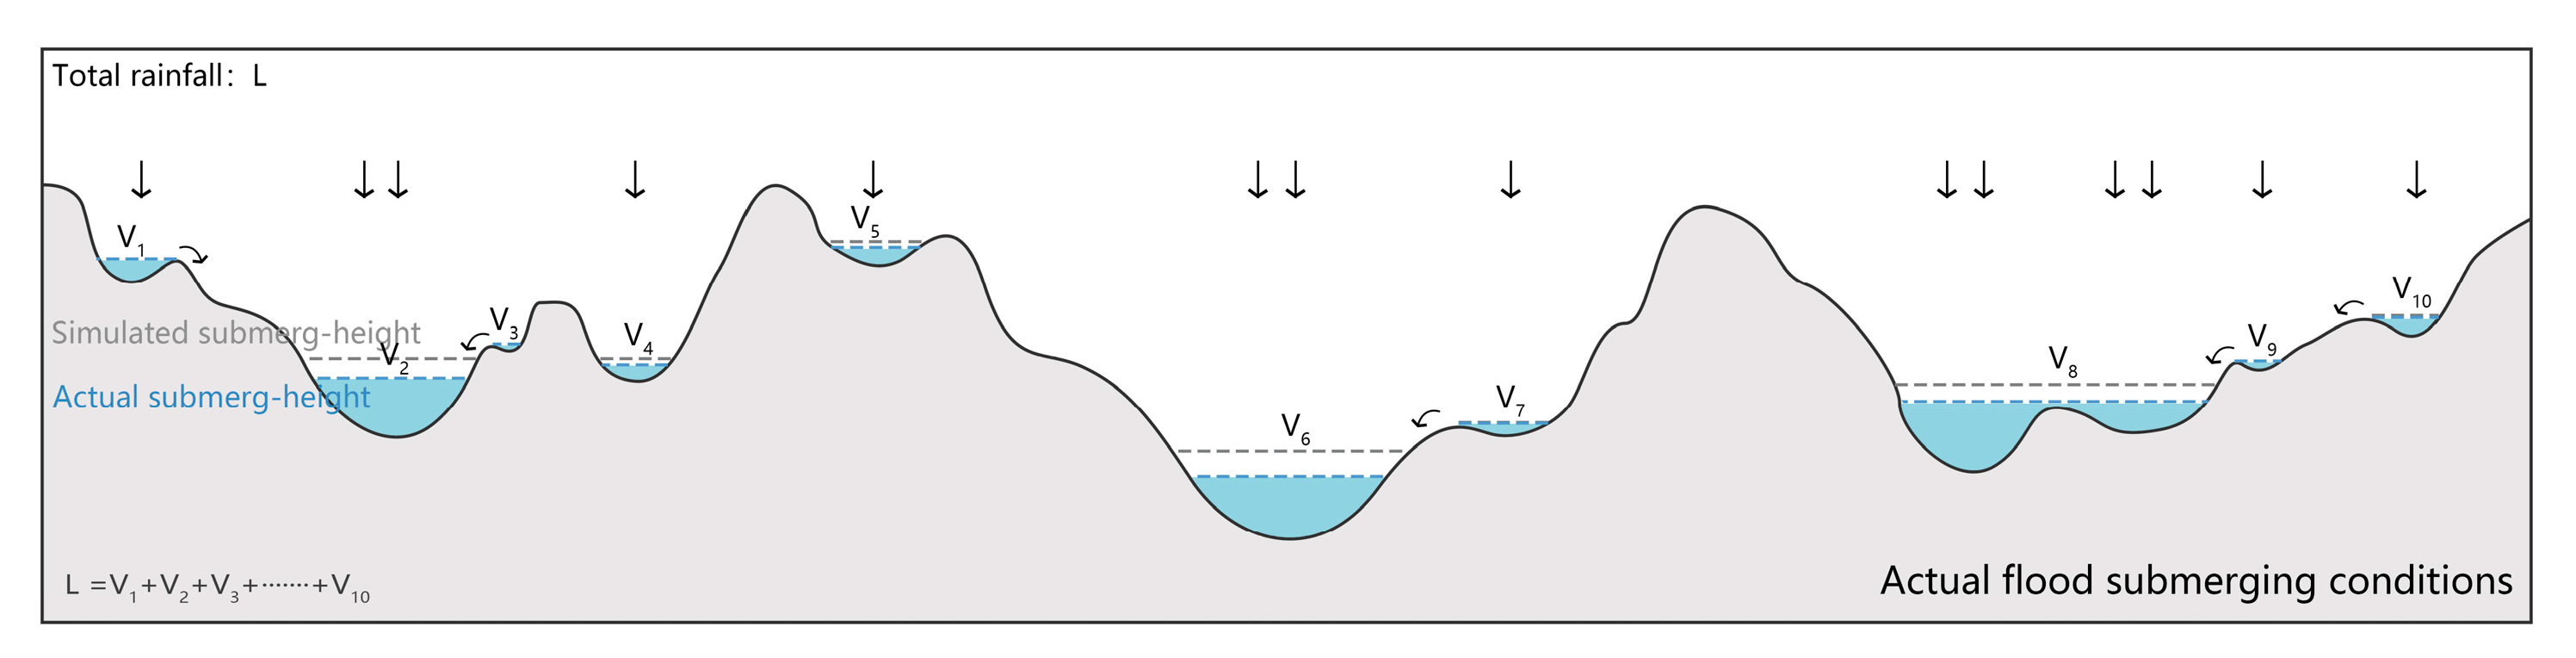
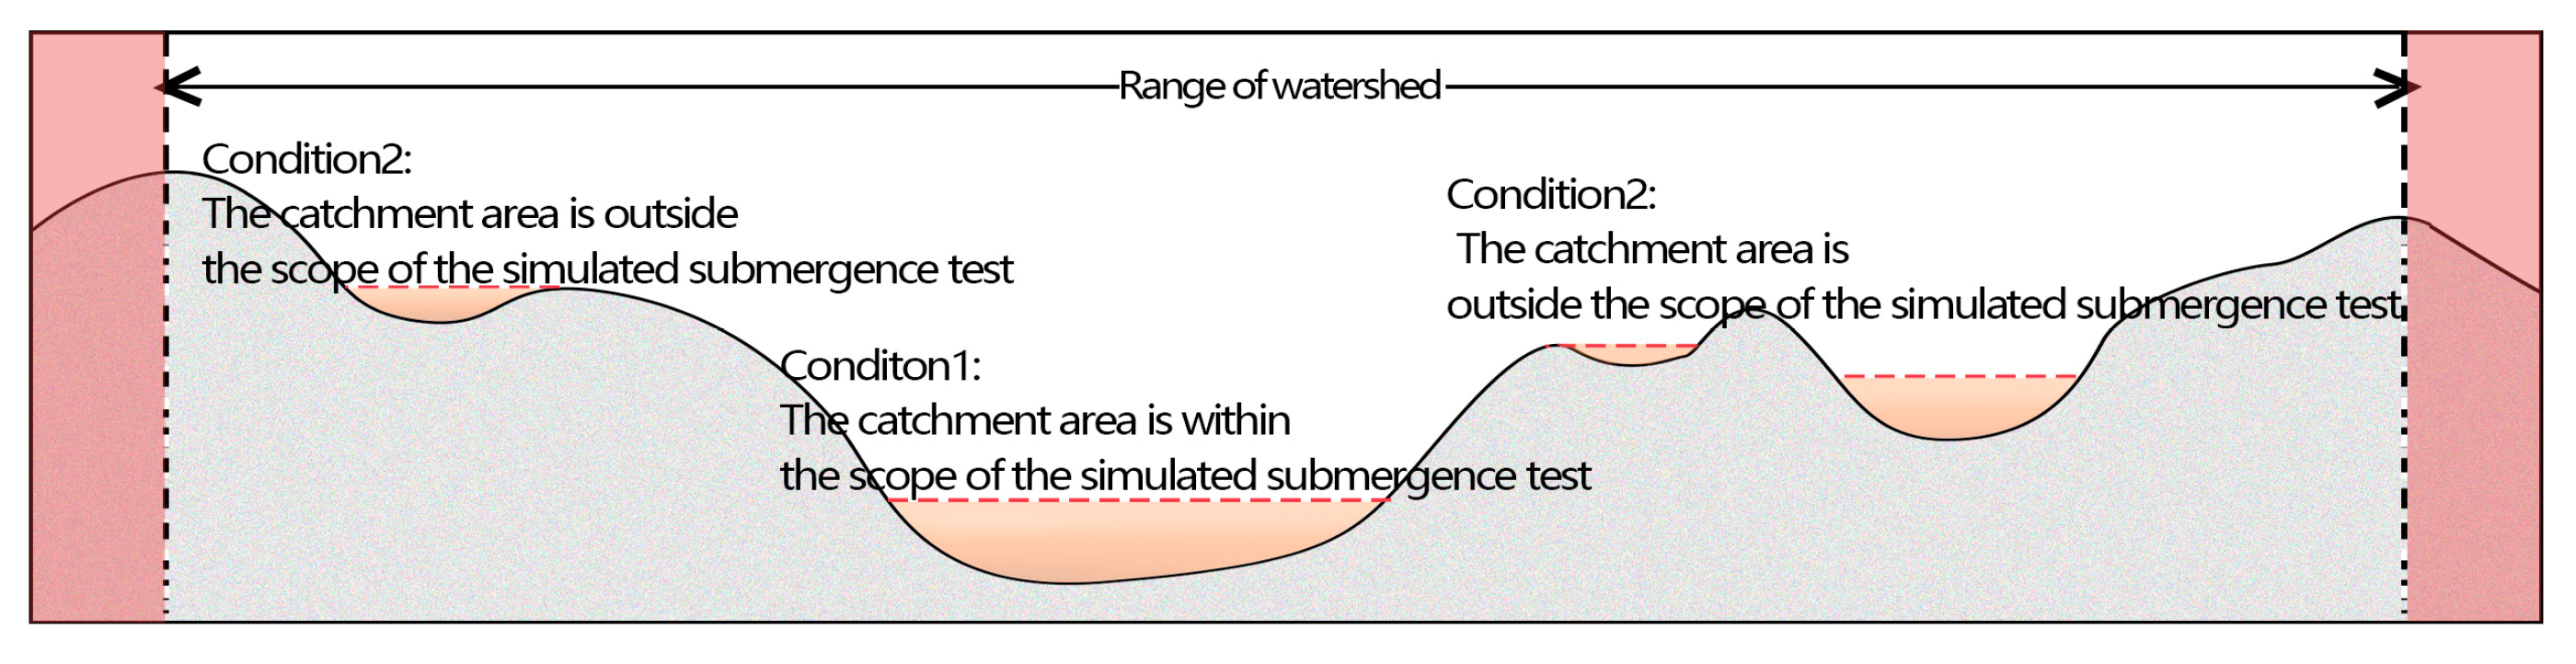
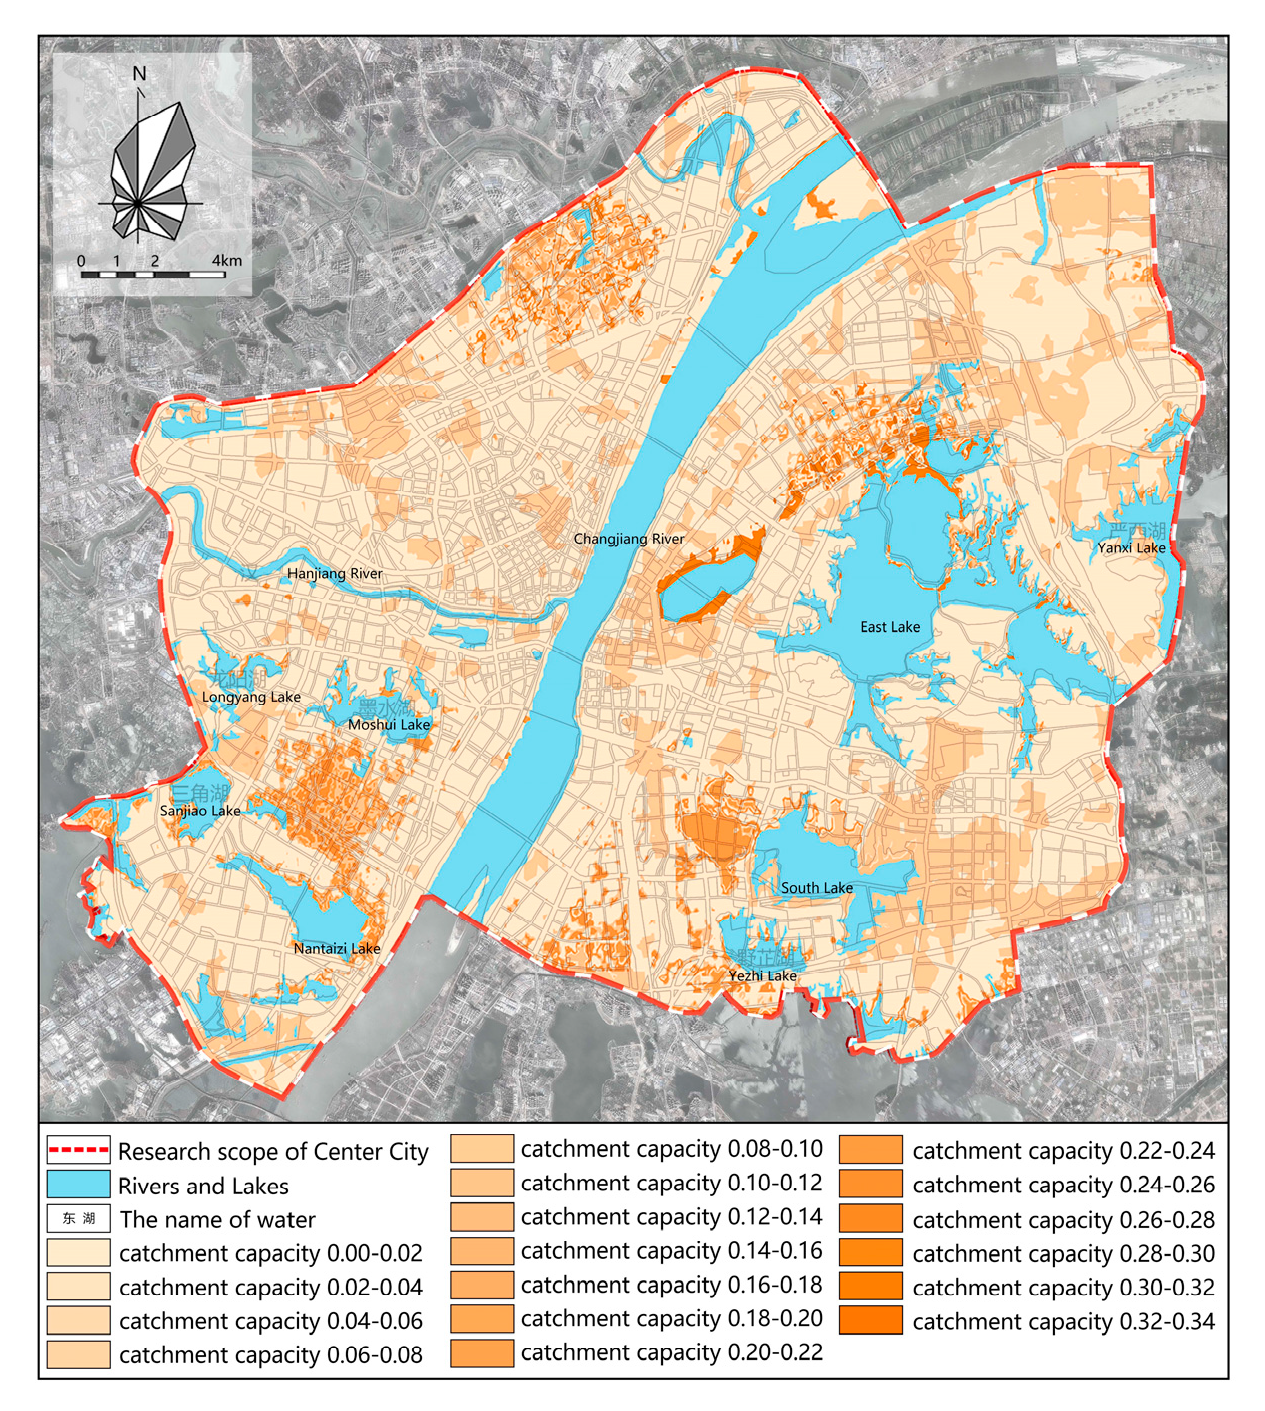
2.1.3. Catchment-Capacity Calculation
2.2. Rainwater Storage Capacity Assessment
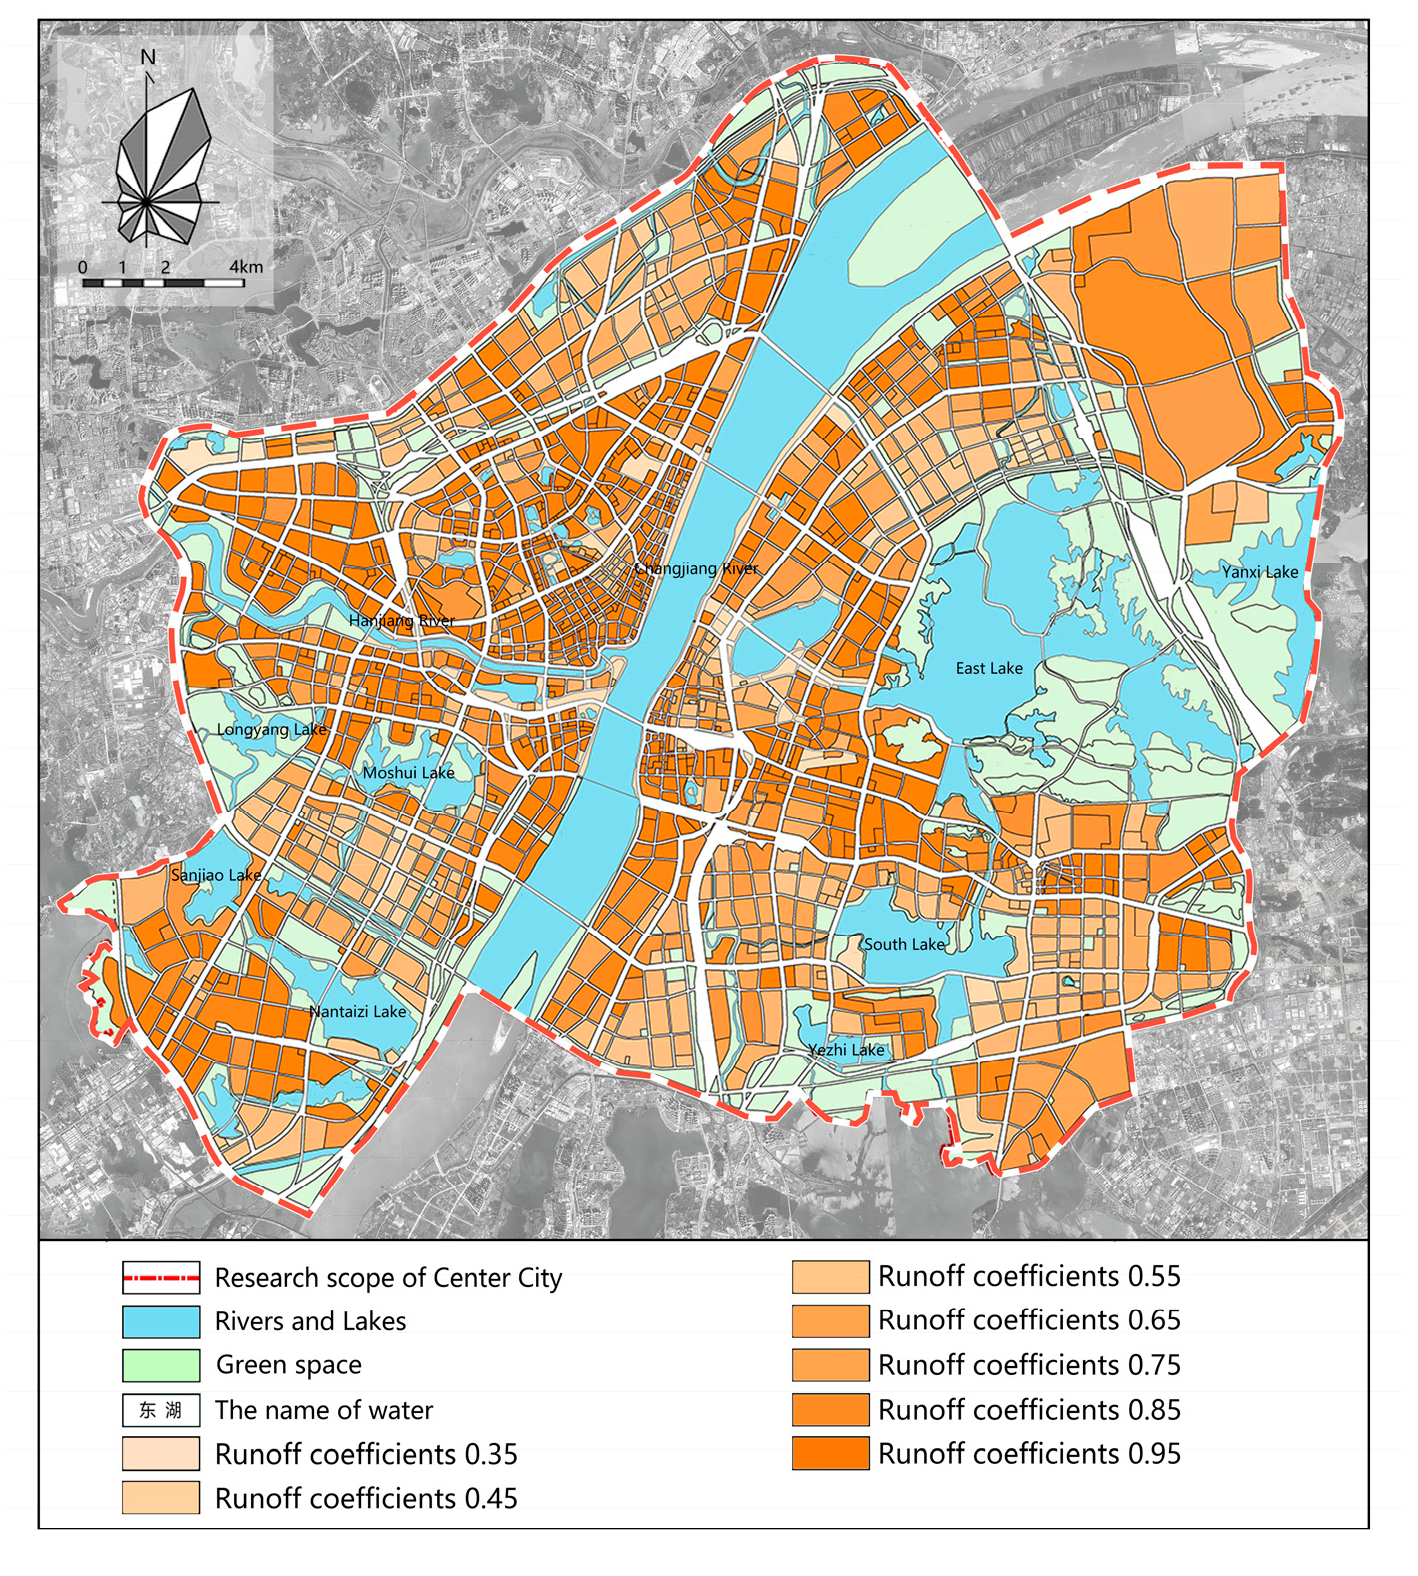
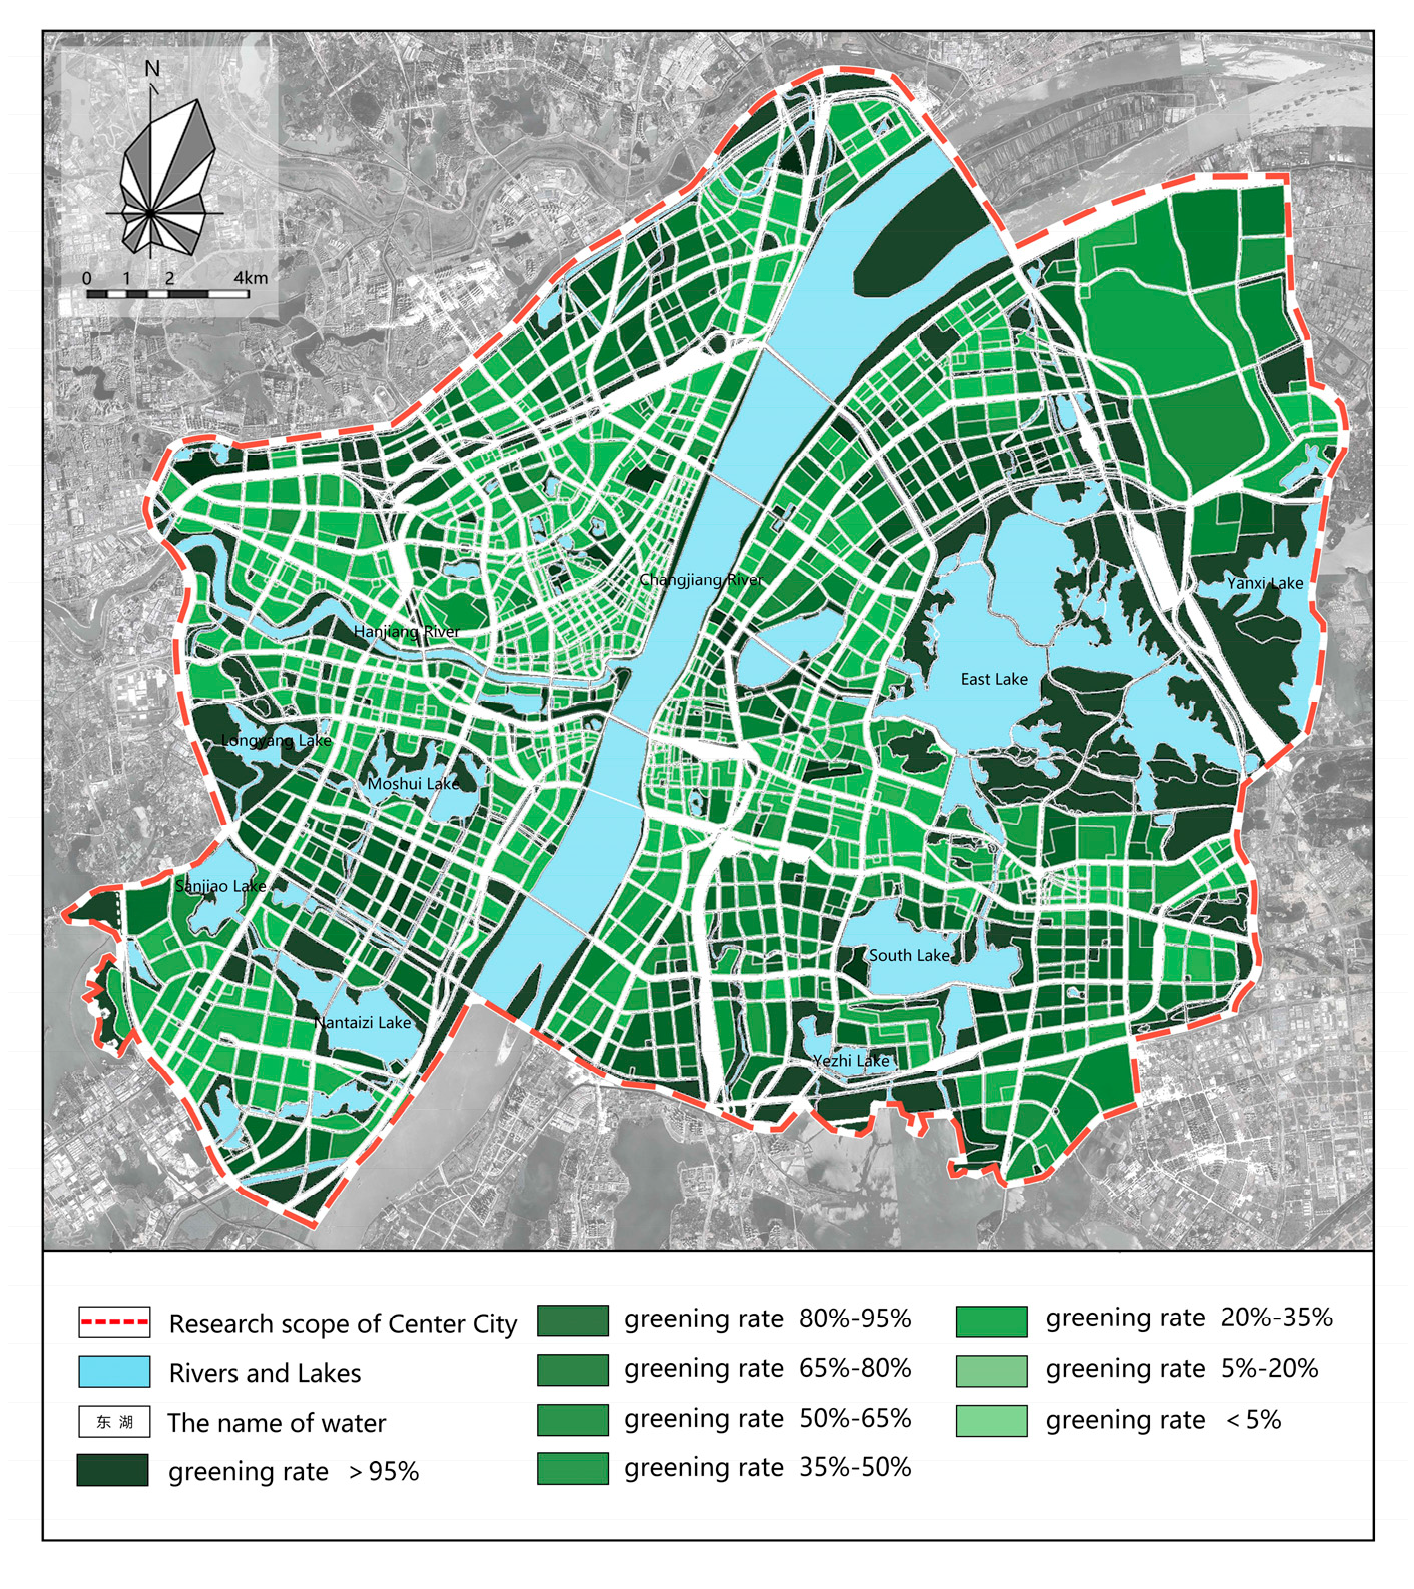
2.3. Ratio of Green Space Calculation
3. Results and Discussion
3.1. Experiment and Assessment Results
3.2. Experimental Results and Analysis
- ①
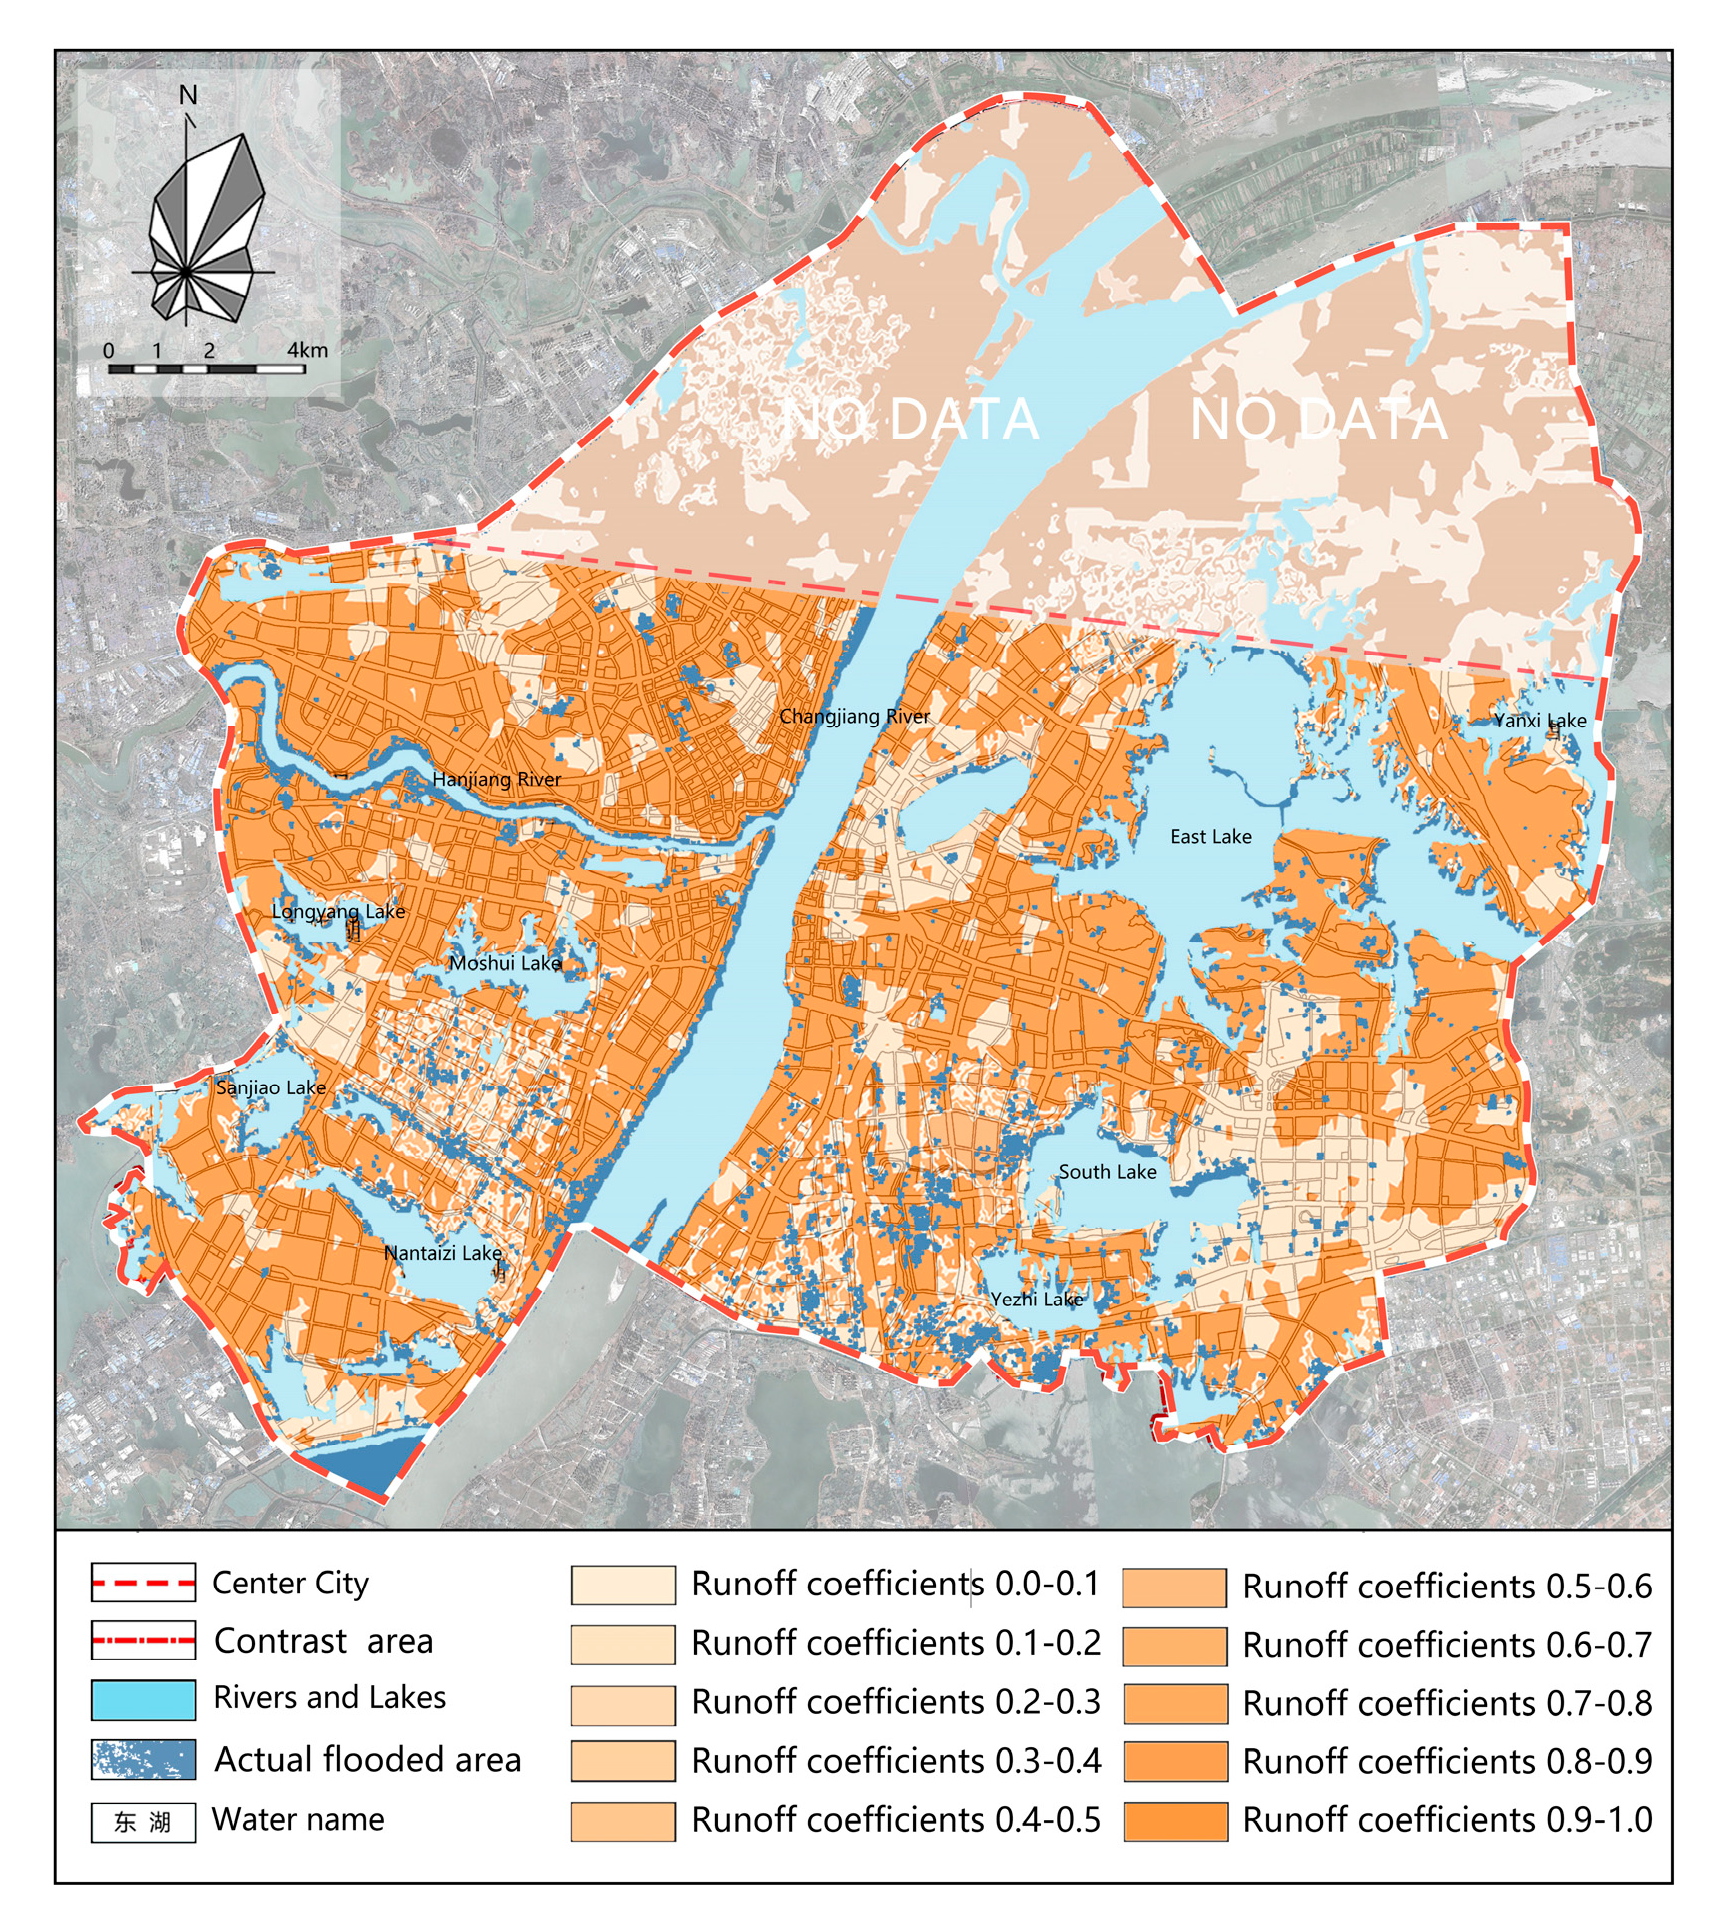
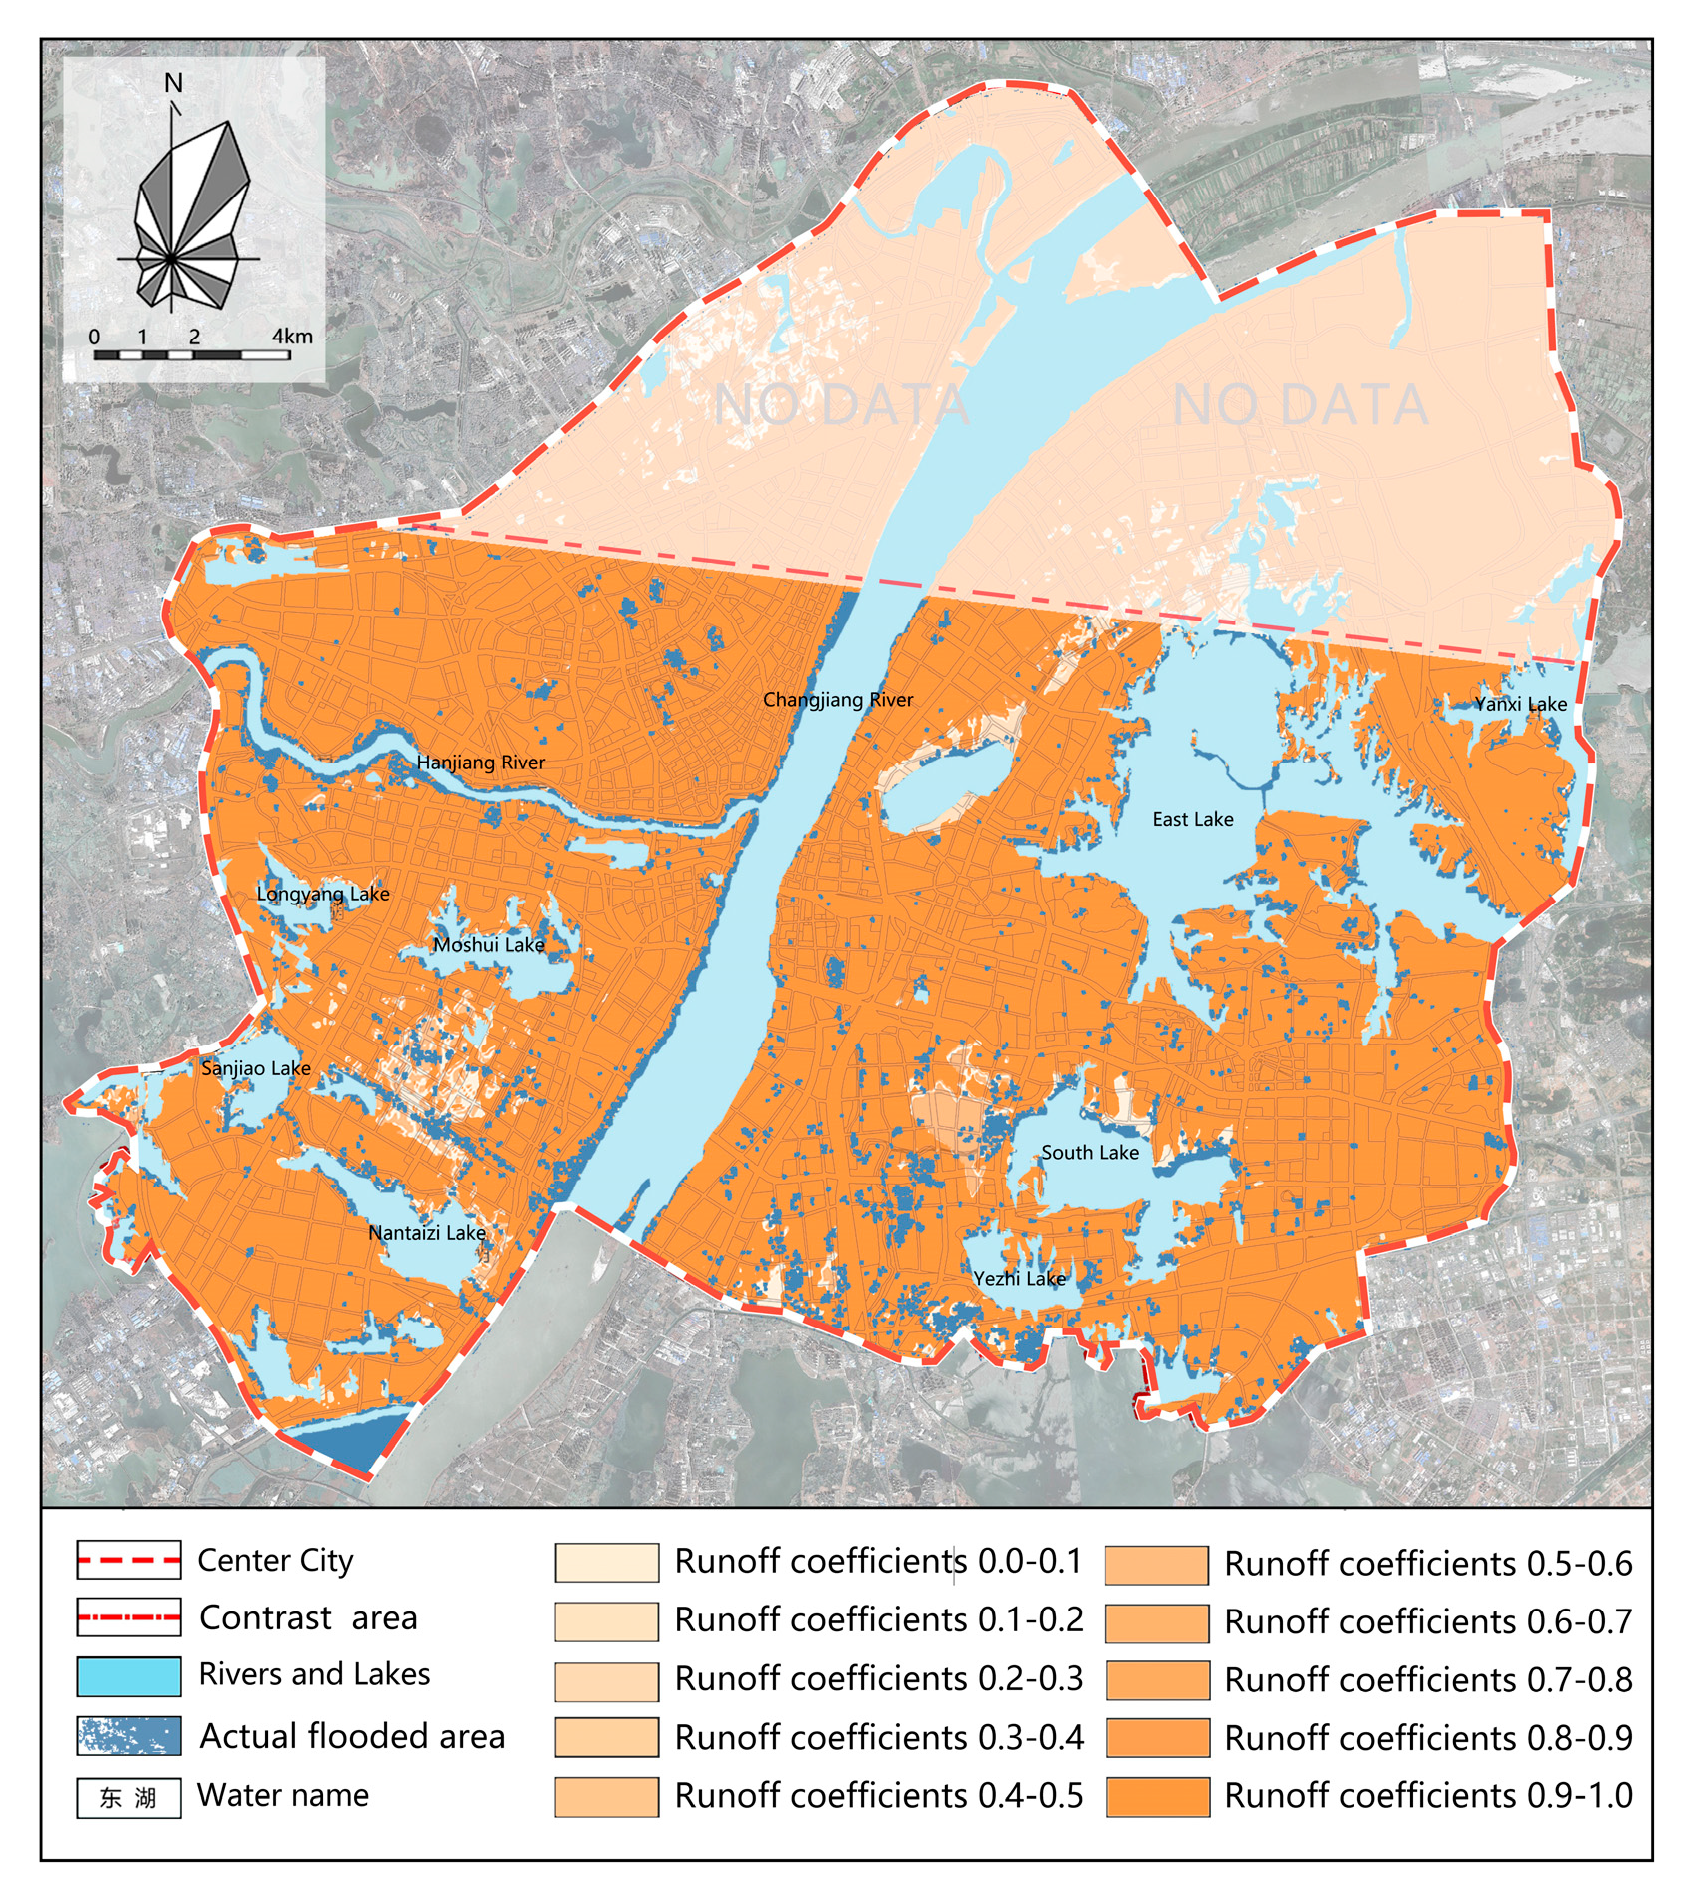
- When the rainwater storage capacity was the same, most areas within the flood-submerged areas often had lower green coverage than those outside the flood-submerged areas. This shows that increasing the proportion of green space can effectively reduce urban flood.
- ②
- A few areas with greater rainwater storage capacity and green coverage were within the flood-submerged areas because the rainwater collected exceeded the infiltration speed of the green space.
- ③
- There were also areas with greater rainwater storage capacity and smaller green coverage not within the submerged areas or areas with smaller rainwater storage capacity and greater green coverage within the submerged areas. This was caused by experiment errors.
4. Conclusions
Supplementary Materials
Author Contributions
Funding
Institutional Review Board Statement
Informed Consent Statement
Data Availability Statement
Acknowledgments
Conflicts of Interest
Appendix A

| Data | Source |
|---|---|
| Digital Elevation Data at a Resolution Rate of GDEMDEM 30 m in Wuhan | Geographical Information Monitoring Cloud Platform (China). |
| Surface Runoff Coefficient CN | National Land Use Type Classification. Please refer to Table A2 for details (China). |
| Rainstorm Intensity on Extreme Days P | 24-h rainfall for the return periods of 1 year, 5 years, 10 years, 20 years, 30 years, 50 years, and 100 years of Wuhan in Wuhan Water Resource Communique 2017 |
| Vector Data on Land Use | The lands are classified into 6 Class I use types (arable land, woodland, grassland, water bodies, construction land, and unused land) and 25 Class II use types (woodland, shrub wood, open forest land, other types of woodland, and grassland with high, medium, and low coverage, etc.) based on the national land use digital products produced by Landsat 30 m remote sensing in accordance with the LUCC classification system established by Li Jiyuan et al. when developing the China LUCC Temporal-Spatial Platform in the 20th Century. |
| Class I | Class II | CN | ||
|---|---|---|---|---|
| No. | Type | No. | Type | |
| 1 | Arable land | 11 | Rice field | 1 |
| 12 | Dry land | 0.15 | ||
| 2 | Woodland | 21 | Forested land | 0.1 |
| 22 | Shrub wood | 0.1 | ||
| 23 | Open forest land | 0.1 | ||
| 24 | Others | 0.1 | ||
| 3 | Grassland | 31 | Grassland with large coverage | 0.2 |
| 32 | Grassland with medium coverage | 0.2 | ||
| 33 | Grassland with small coverage | 0.2 | ||
| 4 | Water bodies | 41 | Rivers and canals | 1 |
| 42 | Lakes | 1 | ||
| 43 | Reservoirs, ponds, and pools | 1 | ||
| 44 | Permanent glacier and snow | |||
| 45 | Mud flats | 1 | ||
| 46 | Bottomland | 1 | ||
| 5 | Urban-rural construction land, industrial and mining land, and residential land | 51 | Urban land | 0.75 |
| 52 | Rural settlements | 0.4 | ||
| 53 | Construction land for other purposes | 0.6 | ||
| 6 | Unused land | 61 | Sand | 0.25 |
| 62 | Gobi | 0.25 | ||
| 63 | Saline-alkali land | 0.25 | ||
| 64 | Wetland | 1 | ||
| 65 | Barren earth | 0.25 | ||
| 66 | Barren rock surface | 0.6 | ||
| 67 | Others | |||

| No. | Type | 1-Year Return Period | 5-Year Return Period | 10-Year Return Period | 20-Year Return Period | 50-Year Return Period | 100-Year Return Period |
|---|---|---|---|---|---|---|---|
| 8 | P (mm) | 95 | 162 | 205 | 249 | 303 | 344 |
| CN | 81.519 | 81.519 | 81.519 | 81.519 | 81.519 | 81.519 | |
| S (mm) | 57.5838 | 57.5838 | 57.5838 | 57.5838 | 57.5838 | 57.5838 | |
| Q (mm) | 92.7348 | 159.7191 | 202.7144 | 246.7113 | 300.7087 | 341.7073 | |
| Drainage area (m2) | 477,686,464 | 477,686,464 | 477,686,464 | 477,686,464 | 477,686,464 | 477,686,464 | |
| Flood volume (m3) | 44,298,165 | 76,295,689 | 96,833,966 | 117,850,674 | 143,644,497 | 163,228,957 | |
| 12 | P (mm) | 95 | 162 | 205 | 249 | 303 | 344 |
| CN | 63.8694 | 63.8694 | 63.8694 | 63.8694 | 63.8694 | 63.8694 | |
| S (mm) | 143.6865 | 143.6865 | 143.6865 | 143.6865 | 143.6865 | 143.6865 | |
| Q (mm) | 89.4846 | 156.3908 | 199.3623 | 243.3432 | 297.3273 | 338.3184 | |
| Drainage area (m2) | 81,160,950 | 81,160,950 | 81,160,950 | 81,160,950 | 81,160,950 | 81,160,950 | |
| Flood volume (m3) | 7,262,659 | 12,692,831 | 16,180,440 | 19,749,971 | 24,131,366 | 27,458,250 | |
| 13 | P (mm) | 95 | 162 | 205 | 249 | 303 | 344 |
| CN | 67.2196 | 67.2196 | 67.2196 | 67.2196 | 67.2196 | 67.2196 | |
| S (mm) | 123.8659 | 123.8659 | 123.8659 | 123.8659 | 123.8659 | 123.8659 | |
| Q (mm) | 90.2187 | 157.1484 | 200.1272 | 244.1129 | 298.1010 | 339.0944 | |
| Drainage area (m2) | 278,770,265 | 278,770,265 | 278,770,265 | 278,770,265 | 278,770,265 | 278,770,265 | |
| Flood volume (m3) | 25,150,312 | 43,808,326 | 55,789,512 | 68,051,425 | 83,101,699 | 94,529,448 | |
| 14 | P(mm) | 95 | 162 | 205 | 249 | 303 | 344 |
| CN | 73.4135 | 73.4135 | 73.4135 | 73.4135 | 73.4135 | 73.4135 | |
| S (mm) | 91.9854 | 91.9854 | 91.9854 | 91.9854 | 91.9854 | 91.9854 | |
| Q (mm) | 91.4170 | 158.3777 | 201.3659 | 245.3579 | 299.3513 | 340.3477 | |
| Drainage area (m2) | 100,142,226 | 100,142,226 | 100,142,226 | 100,142,226 | 100,142,226 | 100,142,226 | |
| Flood volume (m3) | 9,154,707 | 15,860,300 | 20,165,229 | 24,570,693 | 29,977,711 | 34,083,178 | |
| 15 | P (mm) | 95 | 162 | 205 | 249 | 303 | 344 |
| CN | 73.0794 | 73.0794 | 73.0794 | 73.0794 | 73.0794 | 73.0794 | |
| S (mm) | 93.5671 | 93.5671 | 93.5671 | 93.5671 | 93.5671 | 93.5671 | |
| Q (mm) | 91.3570 | 158.3164 | 201.3041 | 245.2959 | 299.2891 | 340.2853 | |
| Drainage area (m2) | 182,403,969 | 182,403,969 | 182,403,969 | 182,403,969 | 182,403,969 | 182,403,969 | |
| Flood volume (m3) | 16,663,895 | 28,877,548 | 36,718,684 | 44,742,962 | 54,591,529 | 62,069,405 | |
| 16 | P (mm) | 95 | 162 | 205 | 249 | 303 | 344 |
| CN | 78.8657 | 78.8657 | 78.8657 | 78.8657 | 78.8657 | 78.8657 | |
| S (mm) | 68.0665 | 68.0665 | 68.0665 | 68.0665 | 68.0665 | 68.06650 | |
| Q (mm) | 92.3305 | 159.3087 | 202.3022 | 246.2978 | 300.2942 | 341.2922 | |
| Drainage area (m2) | 293,267,090 | 293,267,090 | 293,267,090 | 293,267,090 | 293,267,090 | 293,267,090 | |
| Flood volume (m3) | 27,077,500 | 46,720,017 | 59,328,586 | 72,231,058 | 88,066,414 | 100,089,778 | |
| 17 | P (mm) | 95 | 162 | 205 | 249 | 344 | |
| CN | 81.3199 | 81.3199 | 81.3199 | 81.3199 | 81.3199 | ||
| S (mm) | 58.3466 | 58.3466 | 58.3466 | 58.3466 | 58.3466 | ||
| Q (mm) | 92.7053 | 159.6892 | 202.6844 | 246.6812 | 341.6770 | ||
| Drainage area (m2) | 19,719,894 | 19,719,894 | 19,719,894 | 19,719,894 | 19,719,894 | ||
| Flood volume (m3) | 1,828,138 | 3,149,055 | 3,996,915 | 4,864,527 | 0 | 6,737,835 | |
| 18 | P (mm) | 95 | 162 | 205 | 249 | 344 | |
| CN | 69.8384 | 69.8384 | 69.8384 | 69.8384 | 69.8384 | ||
| S (mm) | 109.6967 | 109.6967 | 109.6967 | 109.6967 | 109.6967 | ||
| Q (mm) | 90.74866 | 157.6931 | 200.6764 | 244.6652 | 339.6506 | ||
| Drainage area (m2) | 748,159,926 | 748,159,926 | 748159,926 | 748,159,926 | 748,159,926 | ||
| Flood volume (m3) | 67,894,515 | 117,979,732 | 150,138,065 | 183,048,699 | 0 | 254,113,019 | |
| 19 | P (mm) | 95 | 162 | 205 | 249 | 344 | |
| CN | 73.6103 | 73.6103 | 73.6103 | 73.6103 | 73.6103 | ||
| S (mm) | 91.0604 | 91.0604 | 91.0604 | 91.0604 | 91.0604 | ||
| Q (mm) | 91.4521 | 158.4136 | 201.4020 | 245.3942 | 340.3841 | ||
| Drainage area (m2) | 453,176,540 | 453,176,540 | 453,176,540 | 453,176,540 | 453,176,540 | ||
| Flood volume (m3) | 41,443,968 | 71,789,334 | 91,270,661 | 111,206,907 | 0 | 154,254,124 |
| No. | 1-Year Return Period | 5-Year Return Period | 10-Year Return Period | ||||||
|---|---|---|---|---|---|---|---|---|---|
| Surface Runoff (Mm) | Flood Volume (M3) | Flood Elevation (M) | Surface Runoff (Mm) | Flood Volume (M3) | Flood Elevation (M) | Surface Runoff(Mm) | Flood Volume (M3) | Flood Elevation (M) | |
| 8 | 92.735 | 44,298,165,157 | 18.683 | 159.719 | 76,295,689,051 | 19.339 | 202.714 | 96,833,966.441 | 19.690 |
| 12 | 89.485 | 7,262,659,118 | 18.641 | 156.391 | 12,692,831,670 | 19.734 | 199.362 | 16,180,440.776 | 20.381 |
| 13 | 90.219 | 25,150,312,969 | 18.541 | 157.148 | 43,808,326,252 | 19.165 | 200.127 | 55,789,512.965 | 19.528 |
| 14 | 91.417 | 9,154,707,467 | 17.902 | 158.378 | 15,860,300,683 | 19.089 | 201.366 | 20,165,229.782 | 19.709 |
| 15 | 91.357 | 16,663,895,540 | 20.088 | 158.316 | 28,877,548,772 | 20.436 | 201.304 | 36,718,684.104 | 20.658 |
| 16 | 92.331 | 27,077,500,567 | 19.301 | 159.309 | 46,720,017,924 | 19.827 | 202.302 | 59,328,586.716 | 20.119 |
| 17 | 92.705 | 1,828,138,883 | 18.707 | 159.689 | 3,149,055,339 | 19.233 | 202.684 | 3,996,915.852 | 19.550 |
| 18 | 90.749 | 67,894,515,627 | 20.526 | 157.693 | 117,979,732,158 | 21.221 | 200.676 | 150,138,065.625 | 21.549 |
| 19 | 91.452 | 41,443,968,539 | 18.74 | 158.414 | 71,789,334,635 | 19.238 | 201.402 | 91,270,661.982 | 19.511 |
| No. | 20-Year Return Period | 50-Year Return Period | 100-Year Return Period | ||||||
| Surface Runoff (mm) | Flood Volume (m3) | Flood Elevation (m) | Surface Runoff (mm) | Flood Volume (m3) | Flood Elevation (m) | Surface Runoff (mm) | Flood Volume (m3) | Flood Elevation (m) | |
| 8 | 246.711 | 11,785,0674,343 | 20.017 | 300.709 | 143,644,497,809 | 20.315 | 341.707 | 163,228,957,129 | 20.538 |
| 12 | 243.343 | 19,749,971,050 | 20.97 | 297.327 | 24,131,366,380 | 21.511 | 338.318 | 27,458,250,099 | 21.89 |
| 13 | 244.113 | 68,051,425,946 | 19.886 | 298.101 | 83,101,699,609 | 20.274 | 339.094 | 94,529,448,899 | 20.556 |
| 14 | 245.358 | 24,570,693,624 | 20.237 | 299.351 | 29,977,711,937 | 20.795 | 340.348 | 34,083,178,465 | 21.133 |
| 15 | 245.296 | 44,742,962,683 | 20.881 | 299.289 | 54,591,529,940 | 21.133 | 340.285 | 62,069,405,427 | 21.317 |
| 16 | 246.298 | 72,231,058,133 | 20.385 | 300.294 | 88,066,414,701 | 20.706 | 341.292 | 100,089,778,212 | 20.942 |
| 17 | 246.681 | 4,864,527,785 | 19.866 | 300.679 | 5,929,349,292 | 20.217 | 341.677 | 6,737,835,900 | 20.471 |
| 18 | 244.665 | 183,048,699,778 | 21.866 | 298.656 | 223,442,326,941 | 22.155 | 339.651 | 254,113,019,597 | 22.342 |
| 19 | 245.394 | 11,120,6907,245 | 19.791 | 299.388 | 135675504,457 | 20.101 | 340.384 | 154,254,124,751 | 20.324 |
References
- Costa, S.; Peters, R.; Martins, R.; Postmes, L.; Keizer, J.J.; Roebeling, P. Effectiveness of Nature-Based Solutions on Pluvial Flood Hazard Mitigation: The Case Study of the City of Eindhoven (The Netherlands). Resources 2021, 10, 24. [Google Scholar] [CrossRef]
- Kim, J.; Kang, J. Analysis of Flood Damage in the Seoul Metropolitan Government Using Climate Change Scenarios and Mitigation Technologies. Sustainability 2021, 13, 105. [Google Scholar] [CrossRef]
- Leandro, J.; Martins, R. A methodology for linking 2D overland flow models with the sewer network model SWMM 5.1 based on dynamic link libraries. Water Sci. Technol. 2016, 73, 3017–3026. [Google Scholar] [CrossRef] [PubMed]
- Fletcher, T.D.; Andrieu, H.; Hamel, P. Understanding, management and modelling of urban hydrology and its consequences for receiving waters: A state of the art. Adv. Water Resour. 2013, 51, 261–279. [Google Scholar] [CrossRef]
- Shao, Z.; Fu, H.; Li, D.; Altan, O.; Cheng, T. Remote sensing monitoring of multi-scale watersheds impermeability for urban hydrological evaluation. Remote Sens. Environ. 2019, 232, 111–338. [Google Scholar] [CrossRef]
- Zolch, T.; Henze, L.; Keilholz, P.; Pauleit, S. Regulating urban surface runoff through nature-based solutions—An assessment at the micro-scale. Environ. Res. 2017, 157, 135–144. [Google Scholar] [CrossRef]
- Davis, A.P. Green engineering principles promote low-impact development. Environ. Sci. Technol. 2005, 39, 338A–344A. [Google Scholar] [CrossRef] [Green Version]
- Roy, A.H.; Wenger, S.J.; Fletcher, T.D.; Walsh, C.J.; Ladson, A.R.; Shuster, W.D.; Thurston, H.W.; Brown, R.R. Impediments and solutions to sustainable, watershed-scale urban stormwater management: Lessons from Australia and the United States. Environ. Manag. 2008, 42, 344–359. [Google Scholar] [CrossRef]
- Taghizadeh, S.; Khani, S.; Rajaee, T. Hybrid SWMM and particle swarm optimization model for urban runoff water quality control by using green infrastructures (LID-BMPs). Urban For. Urban Green. 2021, 60, 127032. [Google Scholar] [CrossRef]
- Li, J.; Li, S.; Li, Z. Simulation study on urban stormwater reduction effect based on synergistic transformation concept. J. Nat. Disasters 2019, 28, 79–89. [Google Scholar]
- Jiao, P.; Xu, D.; Wang, S.; Yu, Y.; Han, S. Improved SCS-CN Method Based on Storage and Depletion of Antecedent Daily Precipitation. Water Resour. Manag. 2015, 29, 4753–4765. [Google Scholar] [CrossRef]
- Guo, Y.; Zhuge, Z. Analytical probabilistic flood routing for urban stormwater management purposes. Can. J. Civ. Eng. 2008, 35, 487–499. [Google Scholar] [CrossRef]
- Elliot, A.H.; Trowsdale, S.A. A Review of Models for Low Impact Urban Stormwater Drainage. Environ. Model. Softw. 2007, 22, 394–405. [Google Scholar] [CrossRef]
- Ahiablame, L.; Engel, B.; Chaubey, I. Effectiveness of Low Impact Development Practices: Literature Review and Suggestions for Future Research. Water Air Soil Pollut. 2012, 223, 4253–4273. [Google Scholar] [CrossRef]
- Kaykhosravi, S.; Khan, U.T.; Jadidi, A. Comprehensive Review of Low Impact Development Models for Research, Conceptual, Preliminary and Detailed Design Applications. Water 2018, 10, 1541. [Google Scholar] [CrossRef] [Green Version]
- Jacobson, C.R. Identification and quantification of the hydrological impacts of imperviousness in urban catchments: A review. J. Environ. Manag. 2011, 92, 1438–1448. [Google Scholar] [CrossRef] [PubMed]
- Rezende Osvaldo, M.; Miranda Francis, M.; Haddad Assed, N. A Framework to Evaluate Urban Flood Resilience of Design Alternatives for Flood Defence Considering Future Adverse Scenarios. Water 2019, 11, 1485. [Google Scholar] [CrossRef] [Green Version]
- Hu, B.; Zhou, J.; Wang, J.; Xu, S.; Meng, Q. Risk assessment on rainstorm flood of Tianjin Binhai New Area based on scenario simulation. Sci. Geogr. Sin. 2012, 32, 846–852. [Google Scholar]
- Quan, R.S. Vulnerability analysis of rainstorm flood on buildings in central urban area of Shanghai based on scenario simulation. Sci. Geogr. Sin. 2014, 34, 1399–1403. [Google Scholar]
- Chandran, S.; Thiruchelve, S.R.; Dhanasekarapandian, M. Integrated urban water resources management strategy for a smart city in India. Water Supply 2021, 21, 736–749. [Google Scholar] [CrossRef]
- Shalamzari, M.J.; Zhang, W.C.; Gholami, A.; Zhang, Z.J. Runoff Harvesting Site Suitability Analysis for Wildlife in Sub-Desert Regions. Water 2019, 11, 1944. [Google Scholar] [CrossRef] [Green Version]
- Bartlett, M.S.; Parolari, A.J.; McDonnell, J.J.; Porporato, A. Beyond the SCS-CN method: A theoretical framework for spatially lumped rainfall-runoff response. Water Resour. Res. 2016, 52, 4608–4627. [Google Scholar] [CrossRef] [Green Version]
- Singh, P.K.; Mishra, S.K.; Berndtsson, R.; Jain, M.K.; Pandey, R.P. Development of a Modified SMA Based MSCS-CN Model for Runoff Estimation. Water Resour. Manag. 2015, 29, 4111–4127. [Google Scholar] [CrossRef]
- Yin, Z.Y.; Walcott, S.; Kaplan, B.; Cao, J.; Lin, W.; Chen, M.; Liu, D.; Ning, Y. An analysis of the relationship between spatial patterns of water quality and urban development in Shanghai, China. Comput. Environ. Urban Syst. 2005, 29, 197–221. [Google Scholar] [CrossRef]
- Boughton, W. A review of the USDA SCS curve number method. Aust. J. Soil Res. 1989, 27, 511–523. [Google Scholar] [CrossRef]
- Gebre Egziabher, M.; Demissie, Y. Modeling Urban Flood Inundation and Recession Impacted by Manholes. Water 2020, 12, 1160. [Google Scholar] [CrossRef] [Green Version]
- Lee, E.H.; Lee, Y.S.; Joo, J.G.; Jung, D.; Kim, J.H. Flood Reduction in Urban Drainage Systems: Cooperative Operation of Centralized and Decentralized Reservoirs. Water 2016, 8, 469. [Google Scholar] [CrossRef]
- Liang, Y.T.; Chen, Z.H.; Xia, Z.H. Decades change and mechanism of the urban heat island effect in Wuhan based on RS and GIS. Resour. Environ. Yangtze Basin 2010, 19, 914–918. [Google Scholar]
- Crispino, G.; Pfister, M.; Gisonni, C. Supercritical flow in junction manholes under invert- and obvert-aligned set-ups. J. Hydraul. Res. 2019, 57, 534–546. [Google Scholar] [CrossRef]
- Shi, Z.H.; Chen, L.D.; Fang, N.F.; Qin, D.F.; Cai, C.F. Research on the SCS-CN initial abstraction ratiousing rainfall-rmoff event analysis in the Three Gorges Area, China. Catena 2009, 77, 1–7. [Google Scholar] [CrossRef]


| Green Coverage | Runoff Coefficient | Green Coverage | Runoff Coefficient | Green Coverage | Runoff Coefficient |
|---|---|---|---|---|---|
| 95–100 | 0.2–0.24 | 60–65 | 0.46–0.50 | 25–30 | 0.73–0.76 |
| 90–95 | 0.24–0.28 | 55–60 | 0.50–0.54 | 20–25 | 0.76–0.80 |
| 85–90 | 0.28–0.31 | 50–55 | 0.54–0.58 | 15–20 | 0.80–0.84 |
| 80–85 | 0.31–0.35 | 45–50 | 0.58–0.61 | 10–15 | 0.84–0.88 |
| 75–80 | 0.35–0.39 | 40–45 | 0.61–0.65 | 5–10 | 0.88–0.91 |
| 70–75 | 0.39–0.43 | 35–40 | 0.65–0.69 | 0–5 | 0.91–0.95 |
| 65–70 | 0.43–0.46 | 30–35 | 0.69–0.73 | 0 | 0.95 |
Publisher’s Note: MDPI stays neutral with regard to jurisdictional claims in published maps and institutional affiliations. |
© 2021 by the authors. Licensee MDPI, Basel, Switzerland. This article is an open access article distributed under the terms and conditions of the Creative Commons Attribution (CC BY) license (https://creativecommons.org/licenses/by/4.0/).
Share and Cite
Liu, Y.; Zhou, Y.; Yu, J.; Li, P.; Yang, L. Green Space Optimization Strategy to Prevent Urban Flood Risk in the City Centre of Wuhan. Water 2021, 13, 1517. https://doi.org/10.3390/w13111517
Liu Y, Zhou Y, Yu J, Li P, Yang L. Green Space Optimization Strategy to Prevent Urban Flood Risk in the City Centre of Wuhan. Water. 2021; 13(11):1517. https://doi.org/10.3390/w13111517
Chicago/Turabian StyleLiu, Yajing, Yan Zhou, Jianing Yu, Pengcheng Li, and Liuqi Yang. 2021. "Green Space Optimization Strategy to Prevent Urban Flood Risk in the City Centre of Wuhan" Water 13, no. 11: 1517. https://doi.org/10.3390/w13111517
APA StyleLiu, Y., Zhou, Y., Yu, J., Li, P., & Yang, L. (2021). Green Space Optimization Strategy to Prevent Urban Flood Risk in the City Centre of Wuhan. Water, 13(11), 1517. https://doi.org/10.3390/w13111517