1. Introduction
Precipitation is regarded as an essential component of global energy and water cycles, and it plays a significant role in the interactions between atmosphere, biosphere and hydrosphere [
1]. The measurement of precipitation not only provides essential information to weather forecasters and climate scientists but also to a wide range of decision-makers, including agriculturalists, hydrologists, industrialists and emergency managers [
2]. Therefore, accurate estimation and prediction of precipitation is important for a wide range of applications, such as agricultural crop forecasting, monitoring freshwater resources and numerical weather prediction. In the last three decades, satellite measurement of precipitation has grown to be an uninterrupted, reliable and cost-effective source over large data-void areas [
3]. In 1997, NASA sent the first dedicated meteorological precipitation satellite—the Tropical Rainfall Measurement Mission (TRMM) Multi-satellite Precipitation Analysis (TMPA)—with the National Space Development Agency (NASDA) to measure energy and precipitation exchange across tropical and subtropical areas of the world for 17 years (1997–2014) [
4,
5]. Motivated by the splendid success of the TRMM satellite, on 27 February 2014, its successor, the GPM Core Observatory (GPMCO) was launched by Japan Aerospace Exploration Agency (JAXA) and NASA to continue and improve satellite-based precipitation observations on a global scale [
6]. Thanks to the other satellites, the Core satellite is possible to guarantee a covering region between 65° N and 65° S.
The GPM mission includes a constellation of nine satellites unified by the GPMCO as a reference standard for the other partner satellites [
7]. The GPMCO contains an advanced 13-channel passive microwave radiometer, and a GPM Microwave Imager (GMI) combined with a Ka/Ku-band Dual-frequency Precipitation Radar (DPR). Since this radar has two frequencies that provides more accurate corrections for microwave rain attenuation, it unifies precipitation estimates as a benchmark [
8]. Compared to the TRMM Precipitation Radar (PR), the DPR Ka-band is more sensitive for high-latitude snowfall and light rainfall (sensitivity of PR and Ka-band is 0.5 mm/h and 0.2 mm/h, respectively) [
9]. Therefore, GPM DPR can more accurately detect extreme precipitation and estimate its impact on global climate models, which is essential for exploring and understanding the global water cycle [
10].
In late 2014, precipitation from Integrated Multi-satellite Retrievals for GPM (IMERG) were released to the public; this especially high-resolution precipitation product is now available at the 30 min and 0.1° resolution in early mode (with a 4 h latency), late mode (with a 12 h latency) and final mode (with a 2.5 months latency), which run based on accuracy and latency [
11]. The early and late products are multi-satellite data. The final run is, instead, obtained taking advantage of a combination of information acquired from satellite and monthly rain gauges data. Huffman et al. [
12] suggested that this product can be regarded as the next generation of multi-sensor precipitation data and utilized for near real-time flood risk monitoring applications. Currently, some studies have utilized the IMERG products to estimate snowfall [
11,
13]. The potential of data from IMERG for real-time short-term rainfall nowcasting and forecasting are less unexplored due to the lack of reliable ground rain gauge observations. Therefore, the rainfall nowcasting and forecasting by IMERG data should be investigated with a view to improving the forecasting of extreme rainfall events and assessing the potential of feeding this information into hydrological models, especially in regions where high-resolution precipitation data is not available. Gilewski and Nawalany [
14] suggested that precipitation nowcasting is the generation of short-term (0–3 h) future precipitation distributions from a sequence of radar images, while Xinjian et al. [
15] claimed that the goal of precipitation nowcasting is to predict the future rainfall intensity in a local region over a short period of time. Nowcasting models are based on the extrapolation of radar rainfall scans to track the motion of precipitation cells with a forecasting lead time of a few hours. Quantitative precipitation estimation and precipitation nowcasting will help reduce or manage precipitation-related disasters such as flash-flooding [
16], seasonal flooding [
17], storms [
18] and landslides [
19]. Therefore, both precipitation measuring and predicting are significant for hydrology applications.
Using rain gauge data available from the Mexico Meteorological Services, this study applied a nowcasting model to compare the efficacy and reliability of precipitation data generated by GPM IMERG with ground data. The results provide valuable information, not only for improving the processes of satellite precipitation retrieval but also for operators in many relevant applications, from hydrological modelling and hazard research to climatic change-based simulations such as for flash flood forecasting in urban areas. The aim of this study was to investigate whether real-time short-term (0–6 h) satellite rainfall measurements can be applied effectively for nowcasting and forecasting of precipitation (rainfall) in developing countries. The research objectives are in three-folds: (1) to determine the efficacy and reliability of GPM precipitation compared to rain gauge data; (2) to assess the ability of nowcasting to forecast rainfall events with GPM rainfall; and (3) to gather evidence to show that GPM precipitation data can be used for real-time short-term forecasting.
To achieve the objectives, the STEPS (Short Term Ensemble Prediction System) nowcasting model was used to investigate the potential of GPM IMERG precipitation data and predict short-term real-time precipitation (0–3 h). The short duration analysis is justified due to the fact that the resolution of weather radar is typically 1 km by 1 km, which is the most commonly used in nowcasting modelling. It was therefore necessary to use MATLAB projection for the GPM data in order to improve the accuracy of nowcasting results; the code developed by Liguori and Rico-Ramirez [
20] was used for this purpose. After data projection, the resolution of the GPM data was corrected from 10 km by 10 km to 5 km by 5 km, which is the least resolution for GPM data without reducing the accuracy of the data. Several representative precipitation events (i.e., heavy rainfall for a day) in Mexico were then selected to simulate and nowcast precipitation. Finally, the performance of precipitation nowcasting was evaluated by calculating the errors between the observed precipitation and the nowcast results.
2. Latest Developments
Several studies have assessed the quality of the rainfall products of GPM missions when estimating global precipitation and the performance of precipitation nowcasting. At present, point measurements using a rain gauge and disdrometer [
21,
22], ground-based weather radar [
23] and satellite-based sensors [
24] are the most widely used techniques to measure and estimate precipitation. In most regions, tipping bucket rain gauges are frequently utilized to measure precipitation. Several studies demonstrated that tipping bucket rain gauge measurements are the most reliable technique in terms of point ground measurements [
25,
26,
27]. However, they cannot measure quantities of precipitation less than 0.1 or 0.2 mm, depending on the size of the bucket [
28]. Thus, depending on the intensity of rainfall measured, the tipping bucket rain gauges perform a temporal integration over a more or less long period. By contrast, ground weather radars have a large volume sample but present an indirect observation [
23]. In terms of radar observations (also known as a remote sensing instrument), the reflectivity of precipitation at a given altitude is measured to estimate precipitation. The ground weather radar is able to supply rainfall rate data with a fine spatiotemporal resolution, but it is hindered by several limitations. For instance, the poor data management and archiving, difficult image data processing and usage is limited for weather forecasting [
29]. Although ground weather radar can provide sound spatial resolutions to relatively large precipitation areas, the accuracy of radar precipitation estimates is affected by several sources of uncertainties and errors. For example, the radar signal attenuation and stability of radar calibration can affect the radar reflectivity measurement because of contamination of heavy precipitation by range effects or non-meteorological echoes (e.g., ground clutter) [
30].
For satellite precipitation estimates, sensors onboard low-orbiting satellites are the only instruments able to retrieve global and homogeneous measurements of precipitation [
31]. After the satellite measurement of radiances, the approaches applied to derive precipitation from radiances have advanced from Infrared (IR)- and Visible (VIS)-based methods to active and passive Microwave (MW) techniques and merged MW and IR methods [
31]. In terms of active microwave sensors, Ku-band TRMM Precipitation Radar (PR) was the first space-borne precipitation radar and has operated since 1997 [
32]. The goal of TRMM satellite was to measure moderate to heavy precipitation to give a better understanding of the precipitation distribution on Earth and conduct near-real-time precipitation products. Since then, many methods such as [
33,
34,
35] have built upon the success of the TRMM, culminating in the GPM mission. The Integrated Multi-Satellite Retrievals for GPM (IMERG) is the multi-satellite precipitation algorithm for GPM, which merges sparse precipitation estimates from IR-based geosynchronous satellites, all constellation microwave sensors and monthly gauge precipitation data [
29]. NASA Goddard Earth Sciences (GES) Data and Information Services Center (DISC) produced the latest GPM IMERG version 5 (IMERG V5) precipitation dataset, which was employed in this study.
Compared to TRMM, GPM has improved temporal and spatial resolution, as well as a more efficient minimum latency time [
31,
36,
37,
38]. For example, Prakash et al. [
36] compared both the TRMM TMPA (V7) and GPM IMERG (V03) with the rain gauge measurements over India. Their findings demonstrates that GPM provide more accurate information about extreme rainfall events compared to TRMM. The IMERG data also presented a notable improvement over TMPA during the comparison with the rain gauge data in mountainous areas. Arshad et al. [
37] compared both the GPM IMERG V05 data and the TRMM 3B42 V7 data with the rain gauge measurements over Pakistan. This work revealed that the performance of the IMERG final product showed the best results in the areas of higher annual average rainfall in terms of statistical indices (i.e., FAR, POD and CSI).
From
Table 1 it can be obtained that the GPM satellite born precipitation data are available as near-real-time data available with a 4-h latency from acquisition and post-real-time research data, which are processed within 2.5 months.
3. Methodology and Study Area
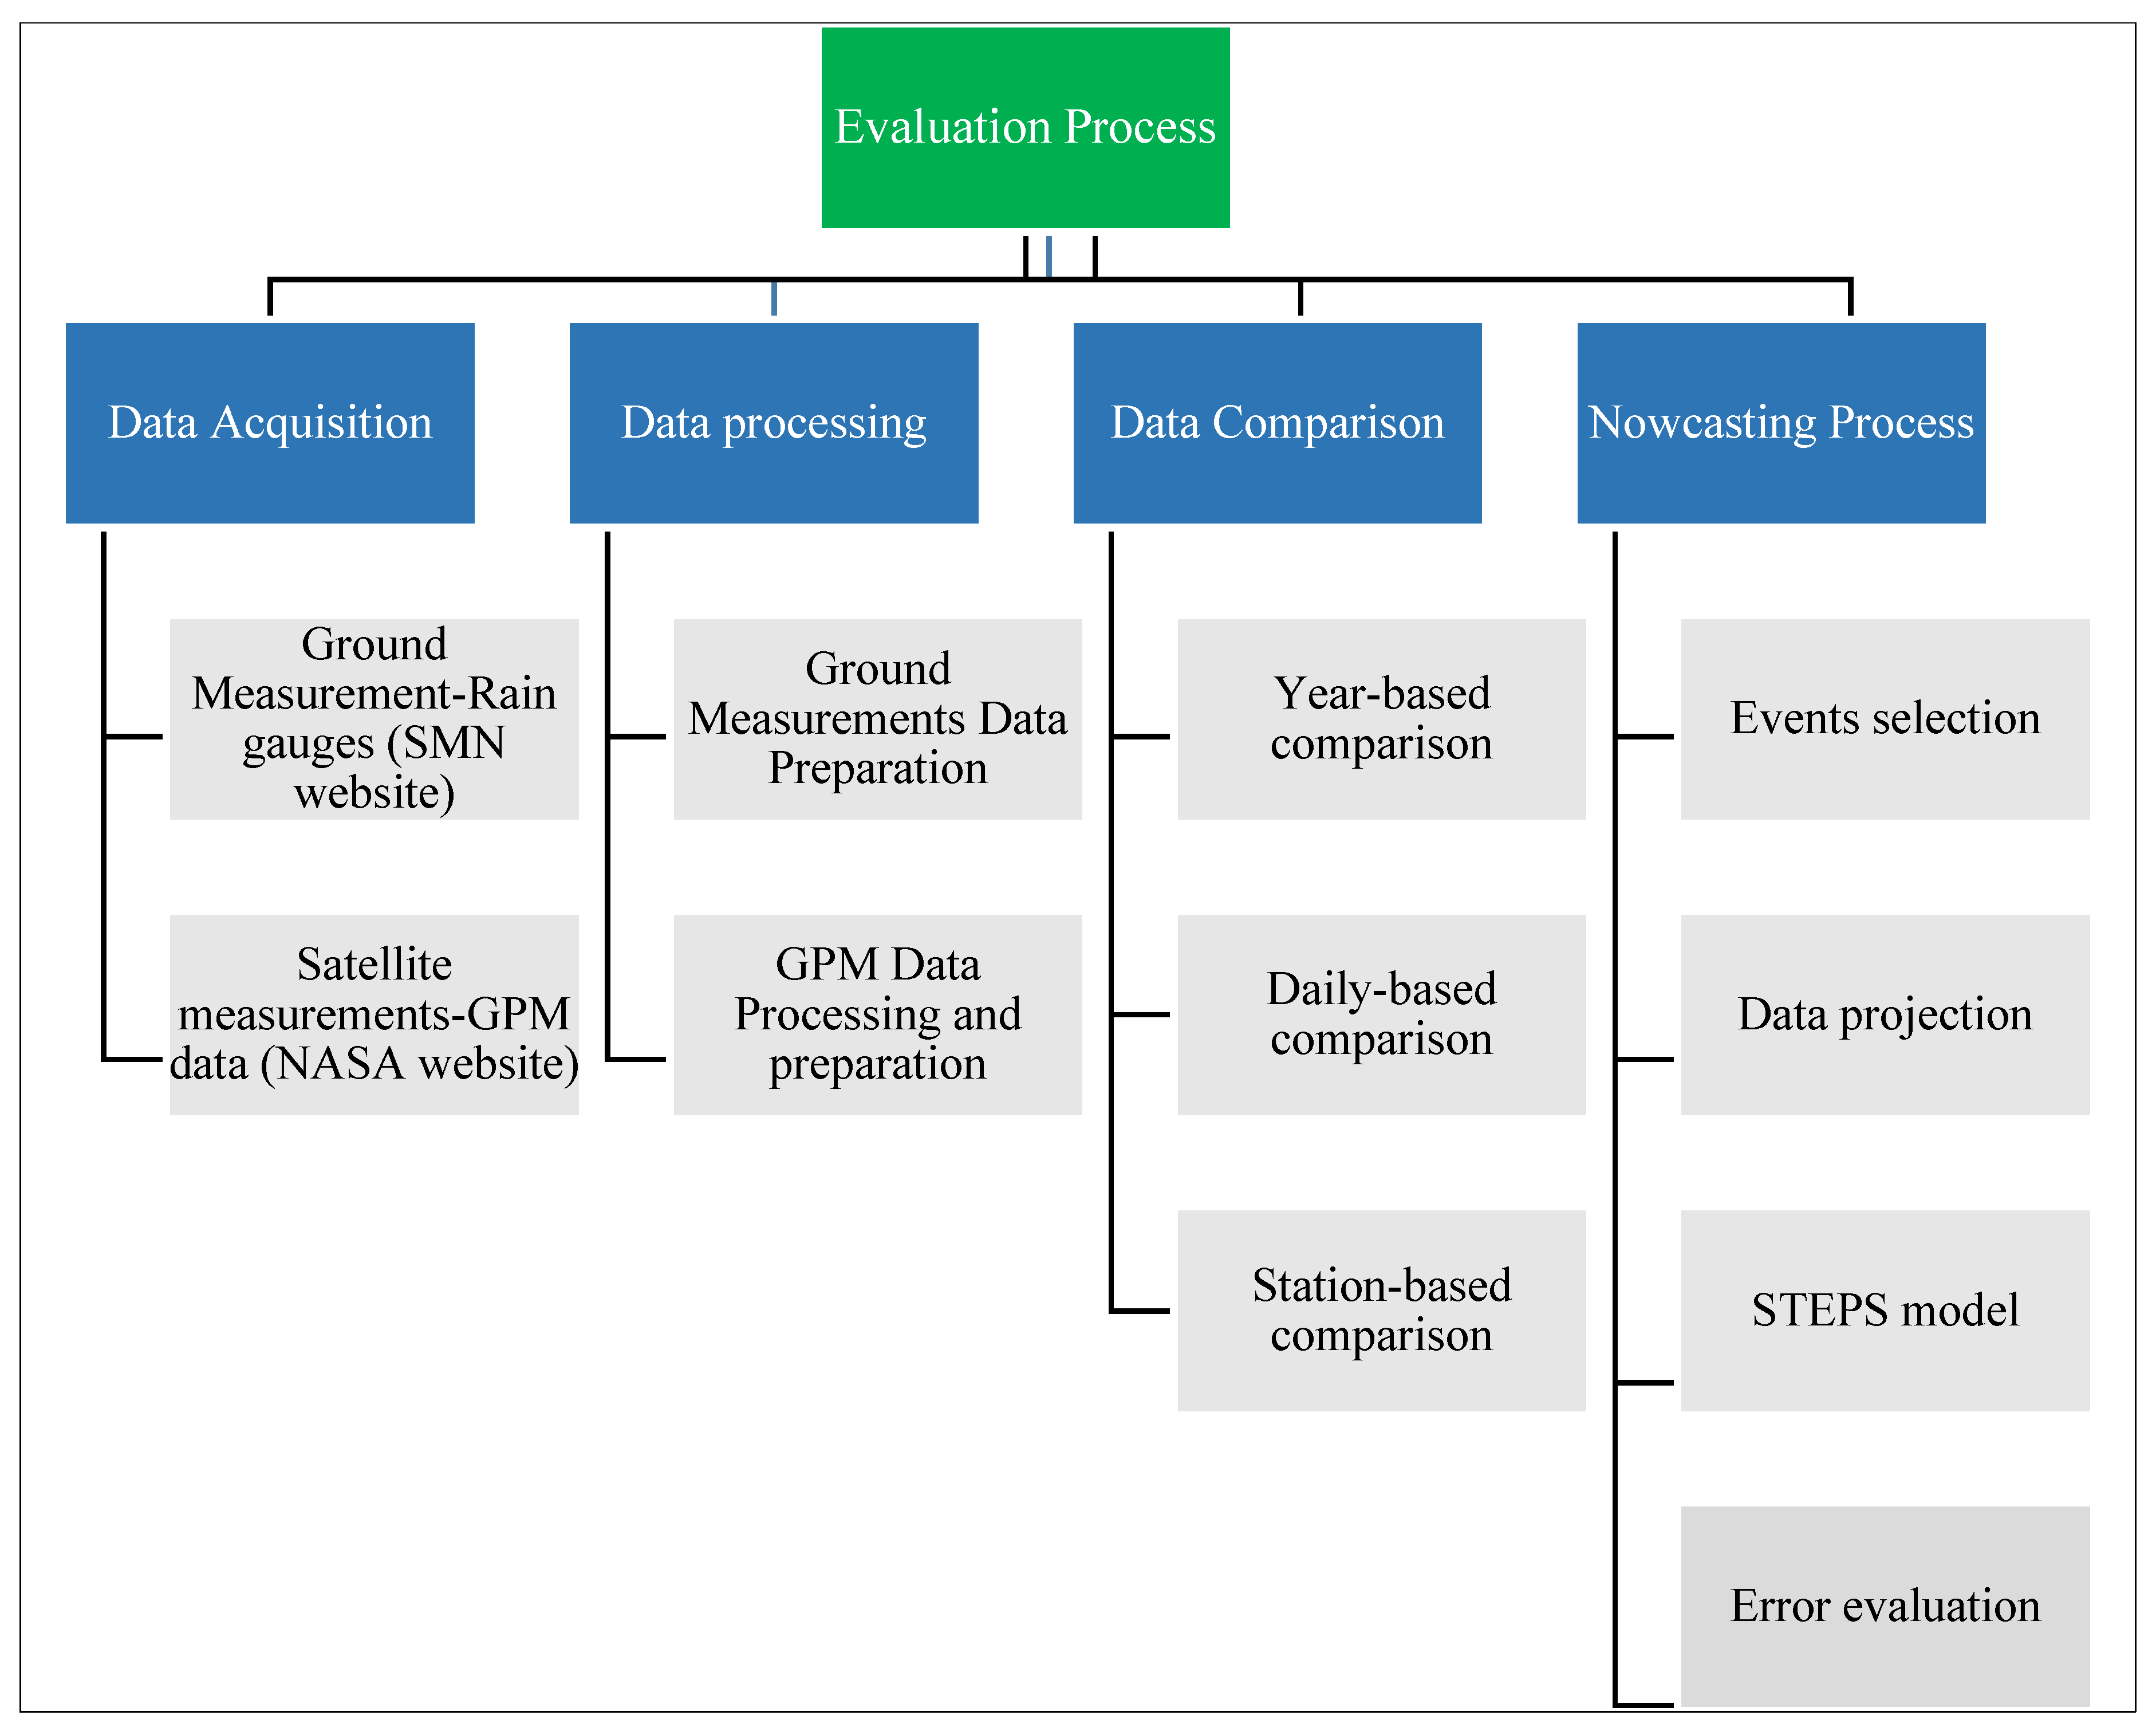
To evaluate the GPM IMERG, several steps were carried out, which are presented in
Figure 1 below. The process started with the preparation of the rain gauge precipitation measurement data and the GPM data processing and preparation. The following step consisted of data comparison, which involved four major steps carried out by MATLAB processing [
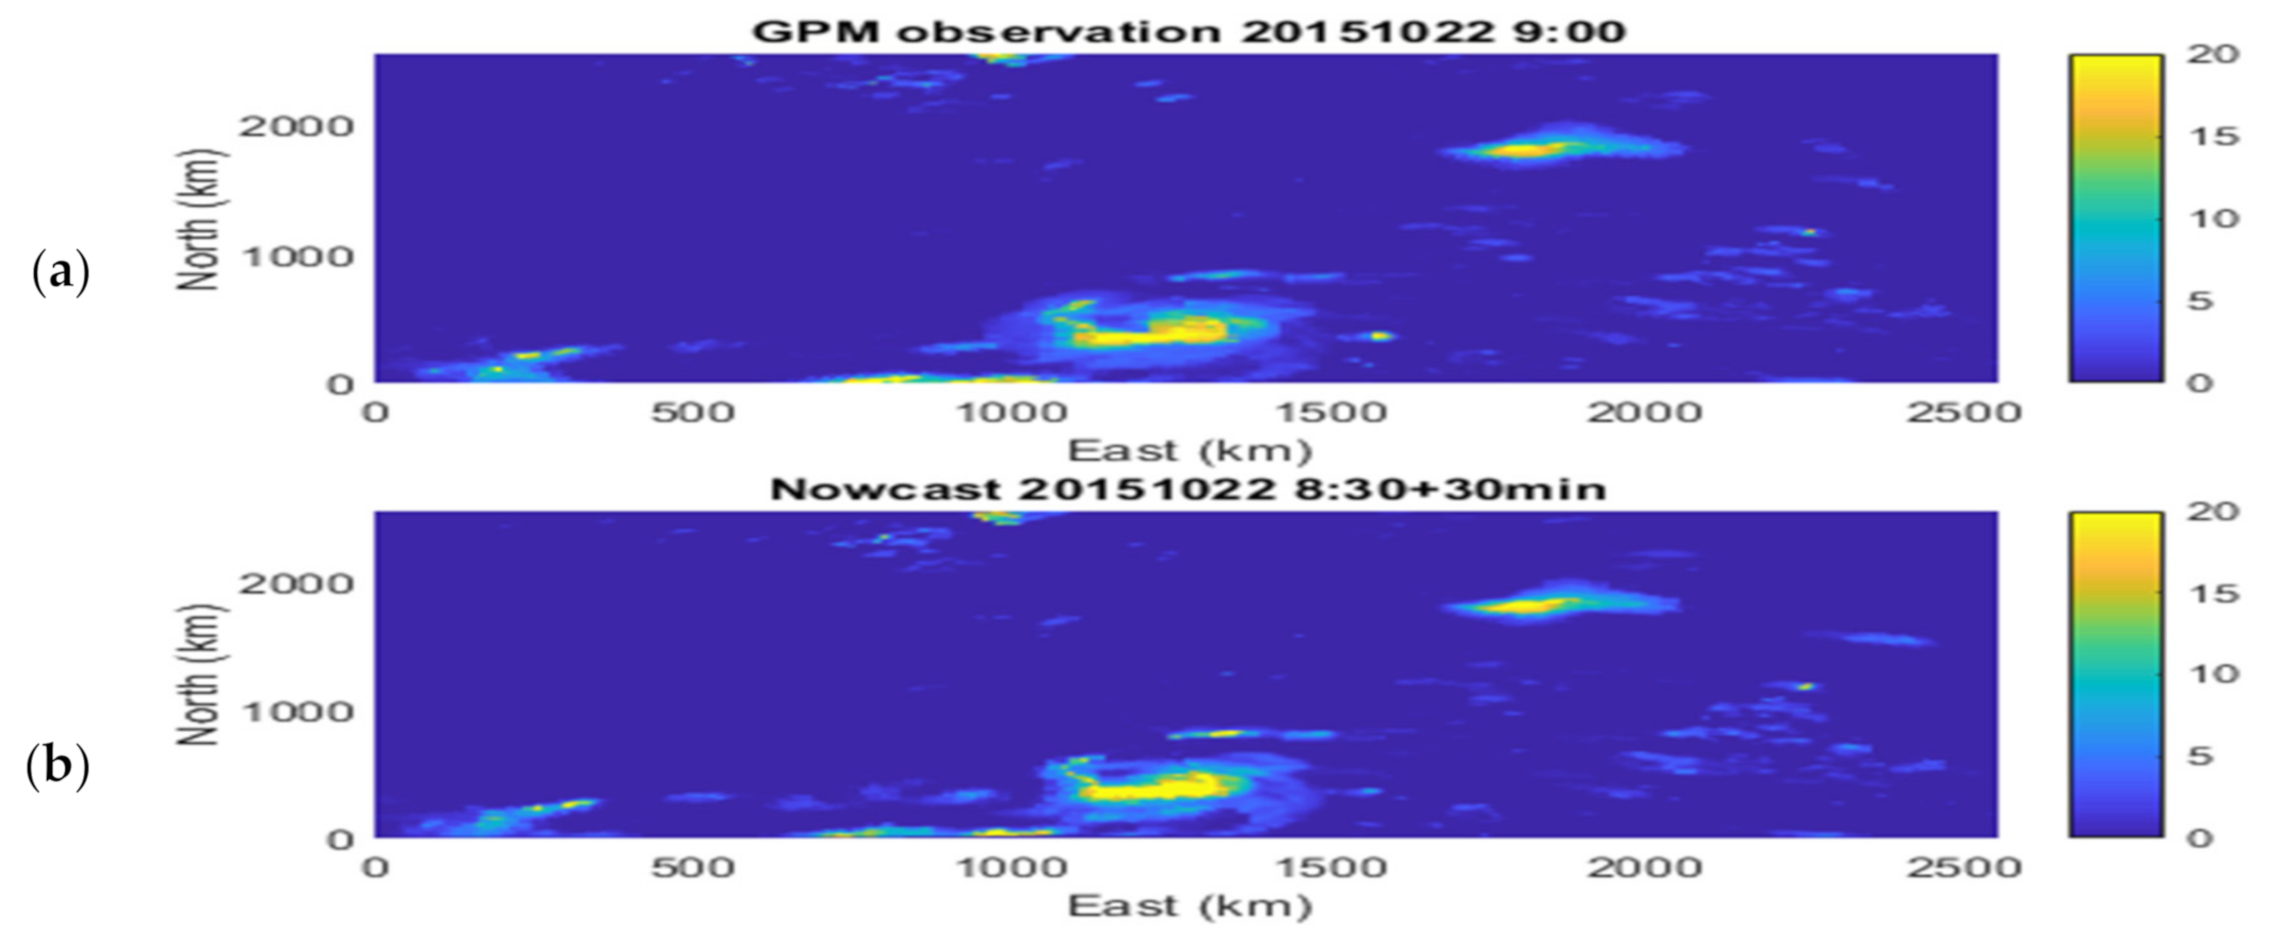
39], the last step of which was precipitation nowcasting of the observed GPM data by using the STEPS model. The STEPS nowcasting model is an available advanced Quantitative Precipitation Forecast (QPF) system, which was developed in the cooperation of the Australian Bureau of Meteorology and the UK MetOffice. A detailed mathematical description of the STEPS model can be found in [
40,
41]. The model generates ensembles of rainfall nowcasts by employing both the extrapolation of radar images and the downscaled rainfall output of Numerical Weather Prediction (NWP) models. The basis behind STEPS is to represent the uncertainty caused by the unpredictable rainfall growth and decay processes by adding stochastic perturbations to the deterministic extrapolation of radar images. The stochastic perturbations are designed to account for the unpredictable rainfall growth and decay processes and to reproduce the dynamic scaling of rainfall fields. Some studies have proved this model is reliable in several applications, such as prediction of flows in the sewer system [
42] and hydrological forecasting in catchment [
43].
The study area of this project is the whole of mainland Mexico, which is located at 23.626° N and 102.538° W in the southern portion of North America and covers a land surface area of 1964 million square kilometers [
44]. The climate in Mexico is determined by different factors, such as latitude, elevation and ocean currents. As a result of its geographical location, the northern part of the country is located in a temperate area, while the southern part is in the inter-tropical area of the globe. Nearly two-thirds of the territory is considered semi-arid or arid, with annual precipitation lower than 500 mm, whereas one third is regarded as humid (the southeast), with precipitation of over 2000 mm per year [
44].
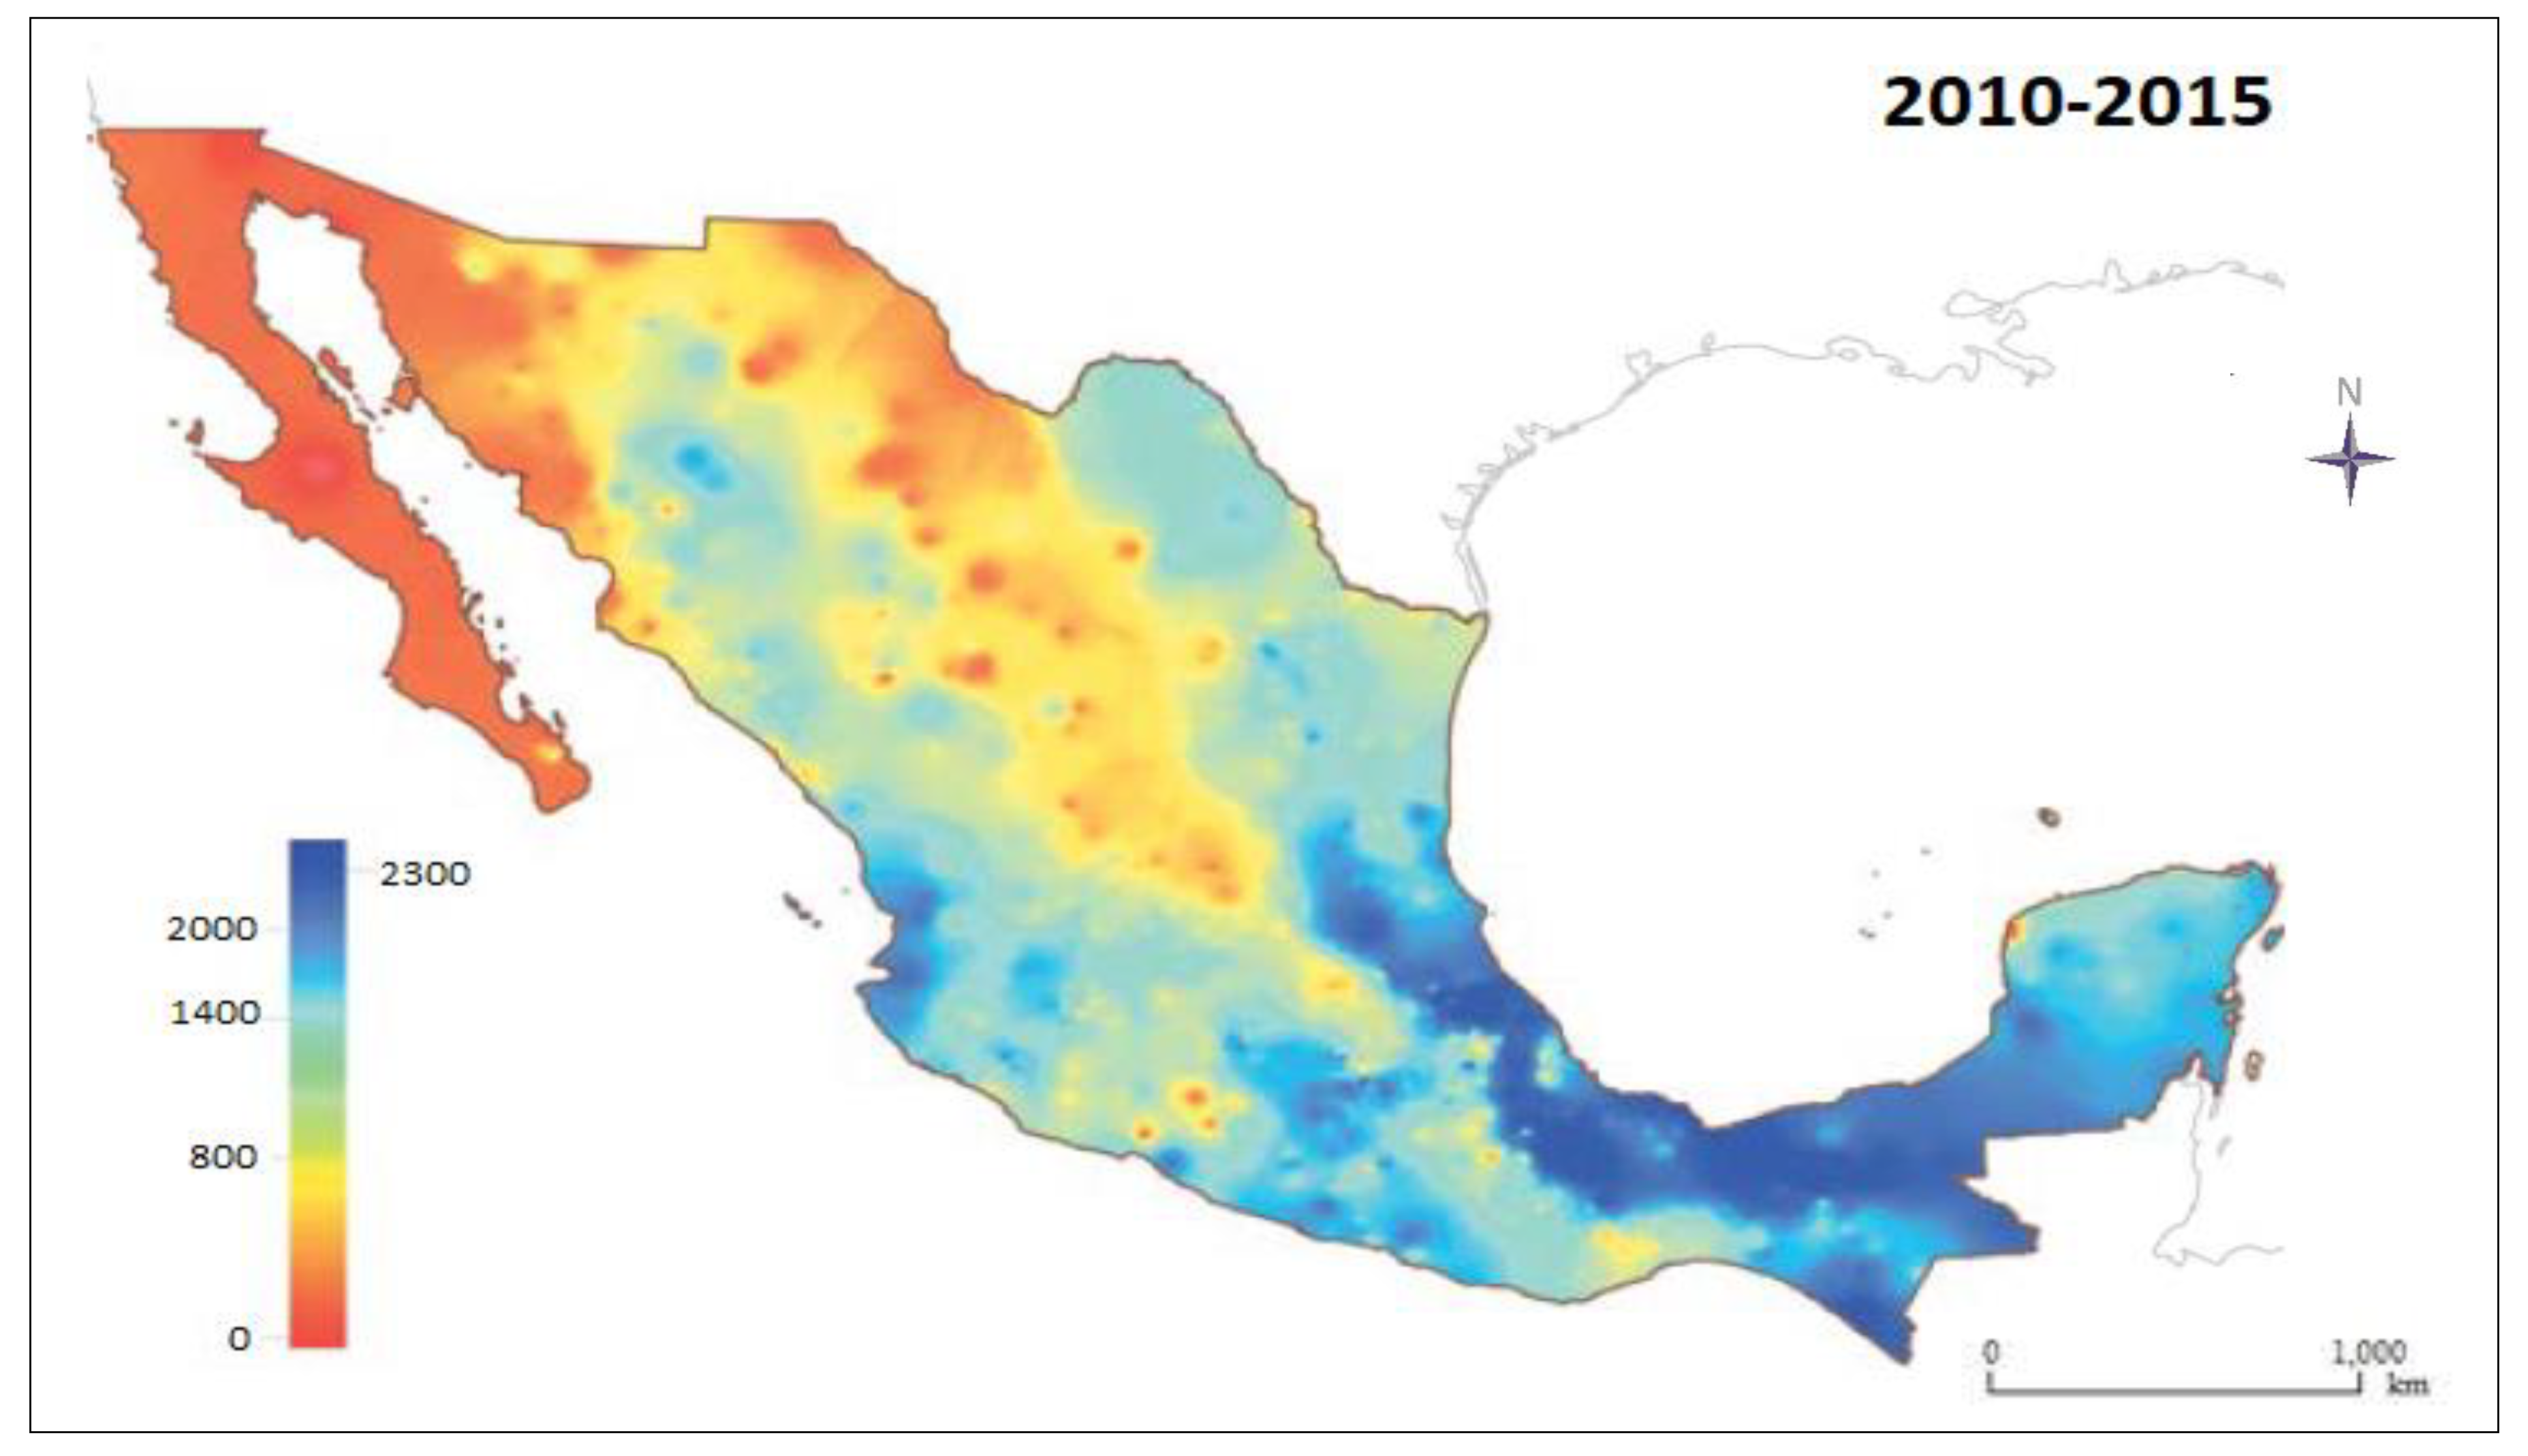
Figure 2 shows the precipitation distribution in Mexico from 2010 to 2015 observed by ground weather radar, with more precipitation in the south of Mexico and less in the north during this period. The west coast of Mexico has a relatively low intense rainfall, while the east coast of Mexico has a relatively high intense rainfall, the details can be referred from [
45]. This graph was used in this study as a reference for the GPM rainfall observations comparison. In most parts of Mexico, precipitation is more intense in the summertime when there is often torrential rain.
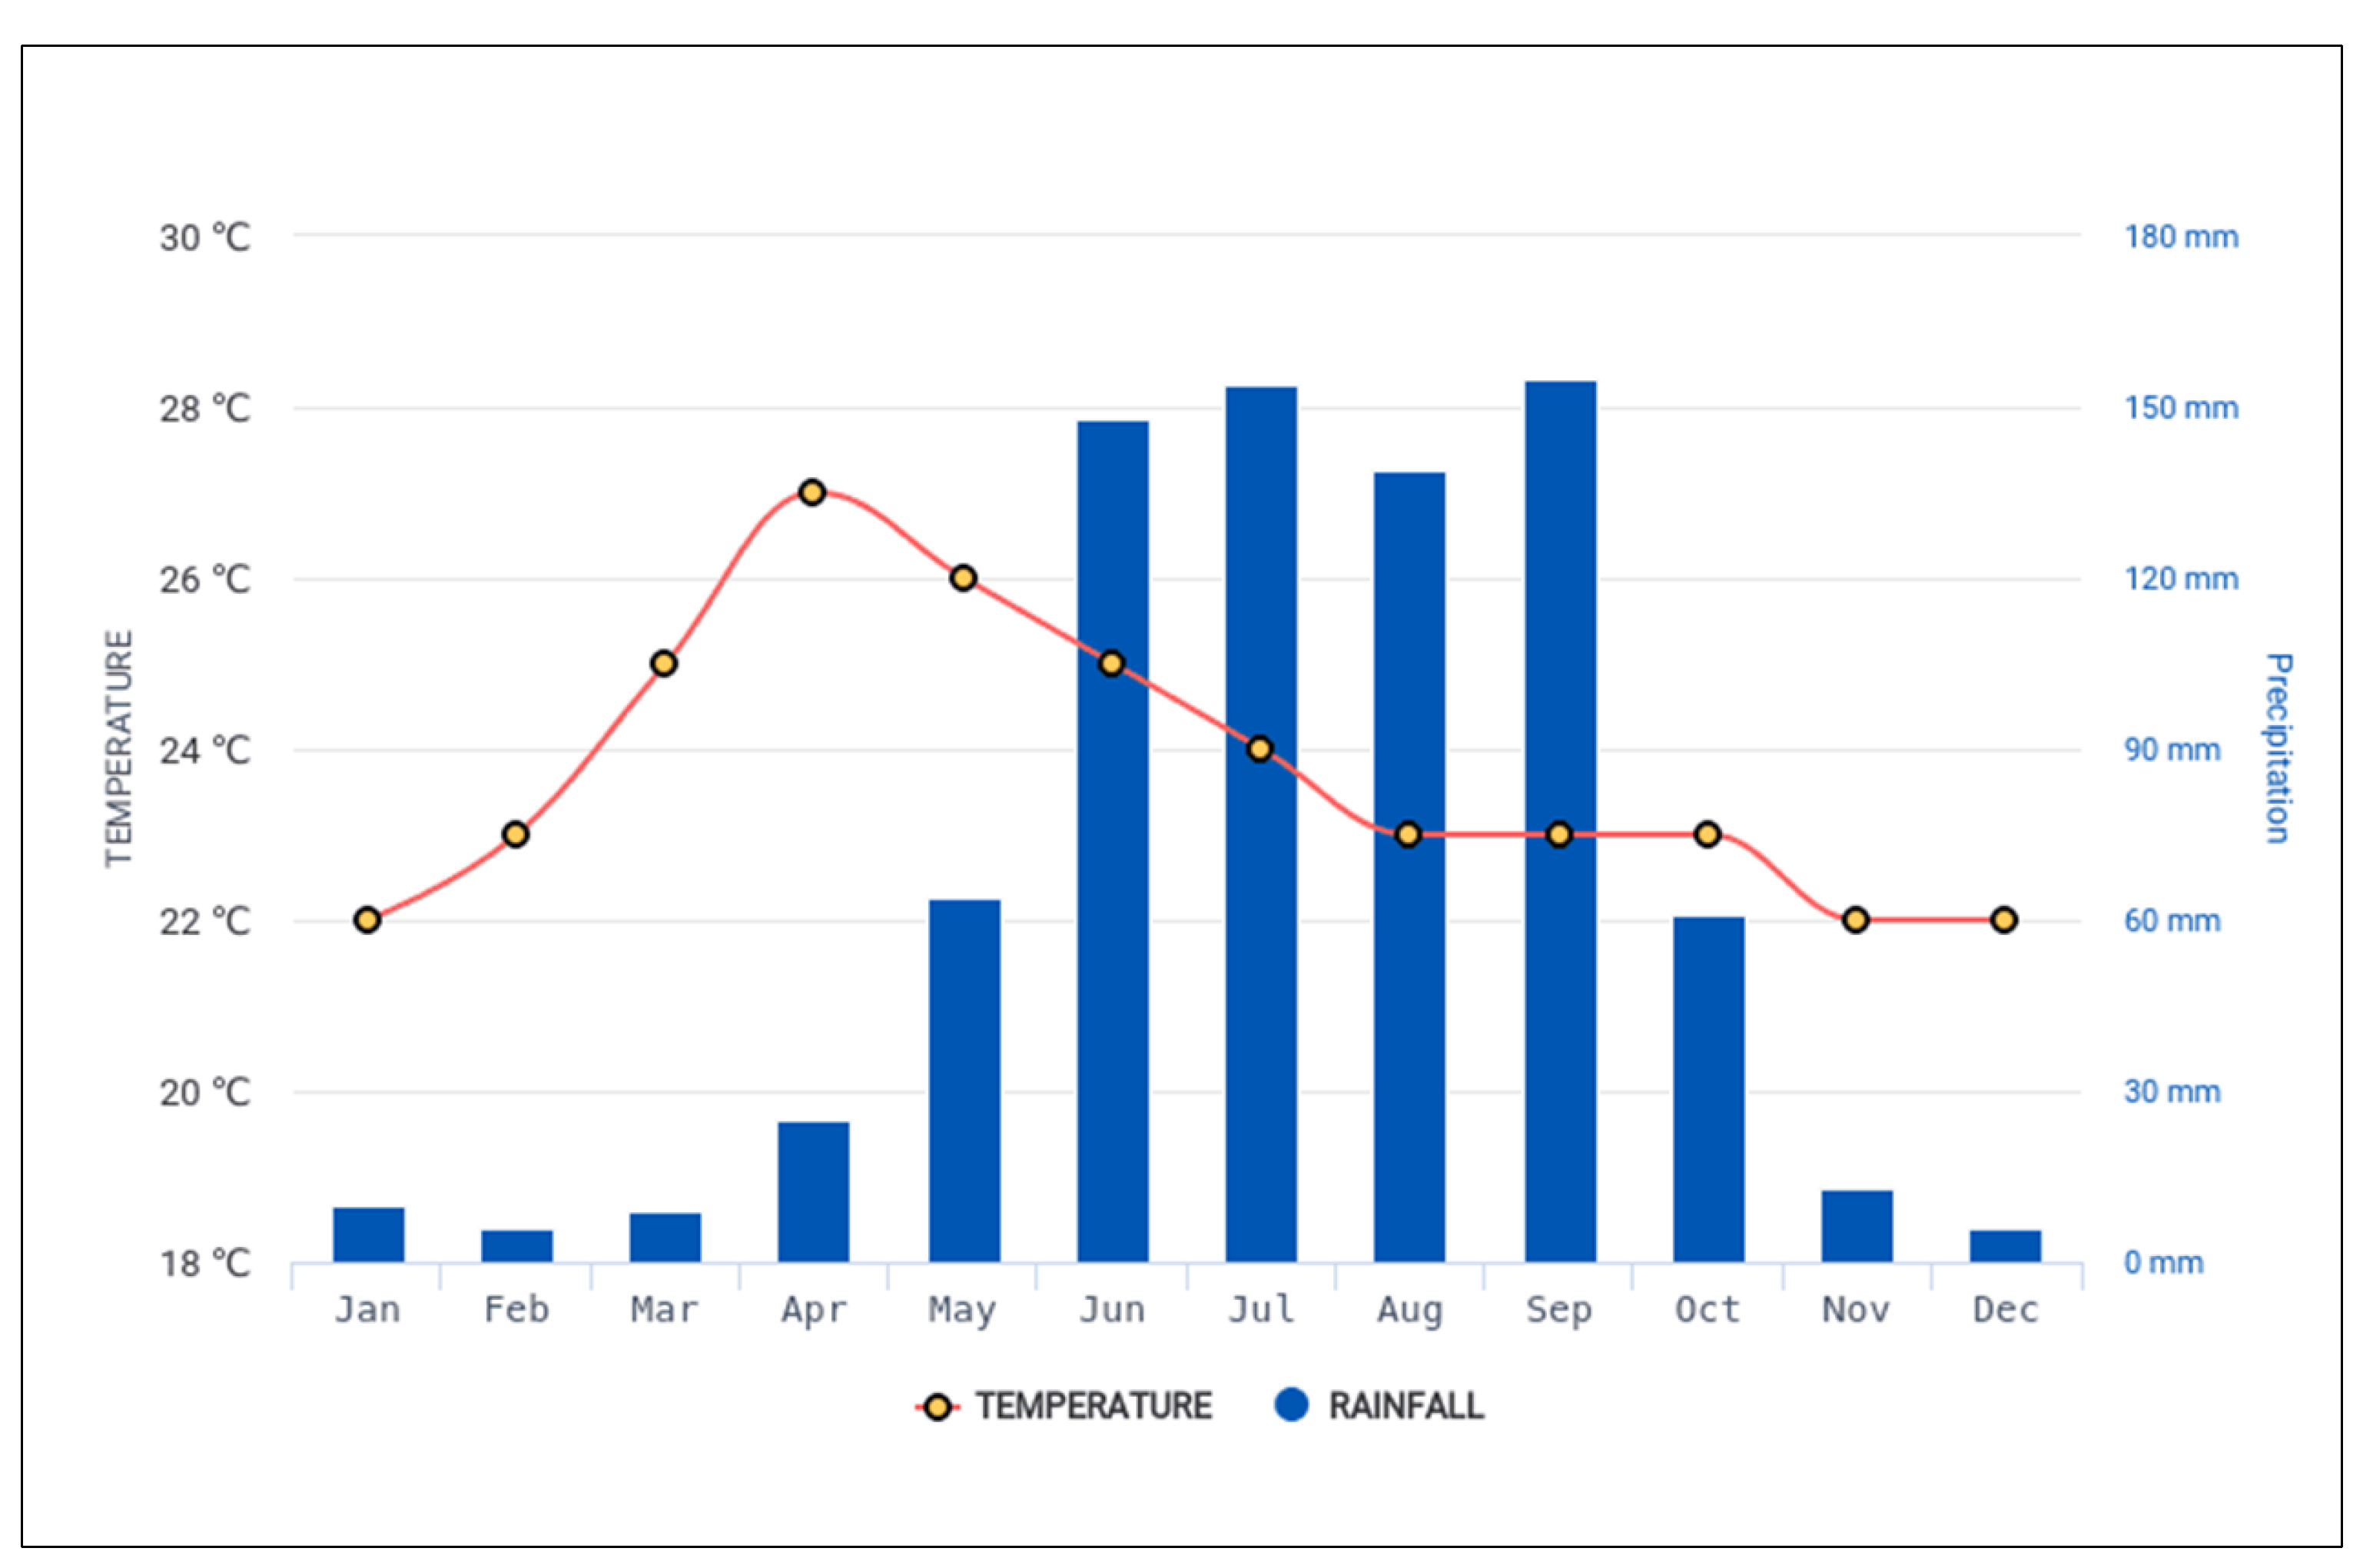
Figure 3 presents the monthly average rainfall and temperature in the period of 1943 to 2018 over Mexico.
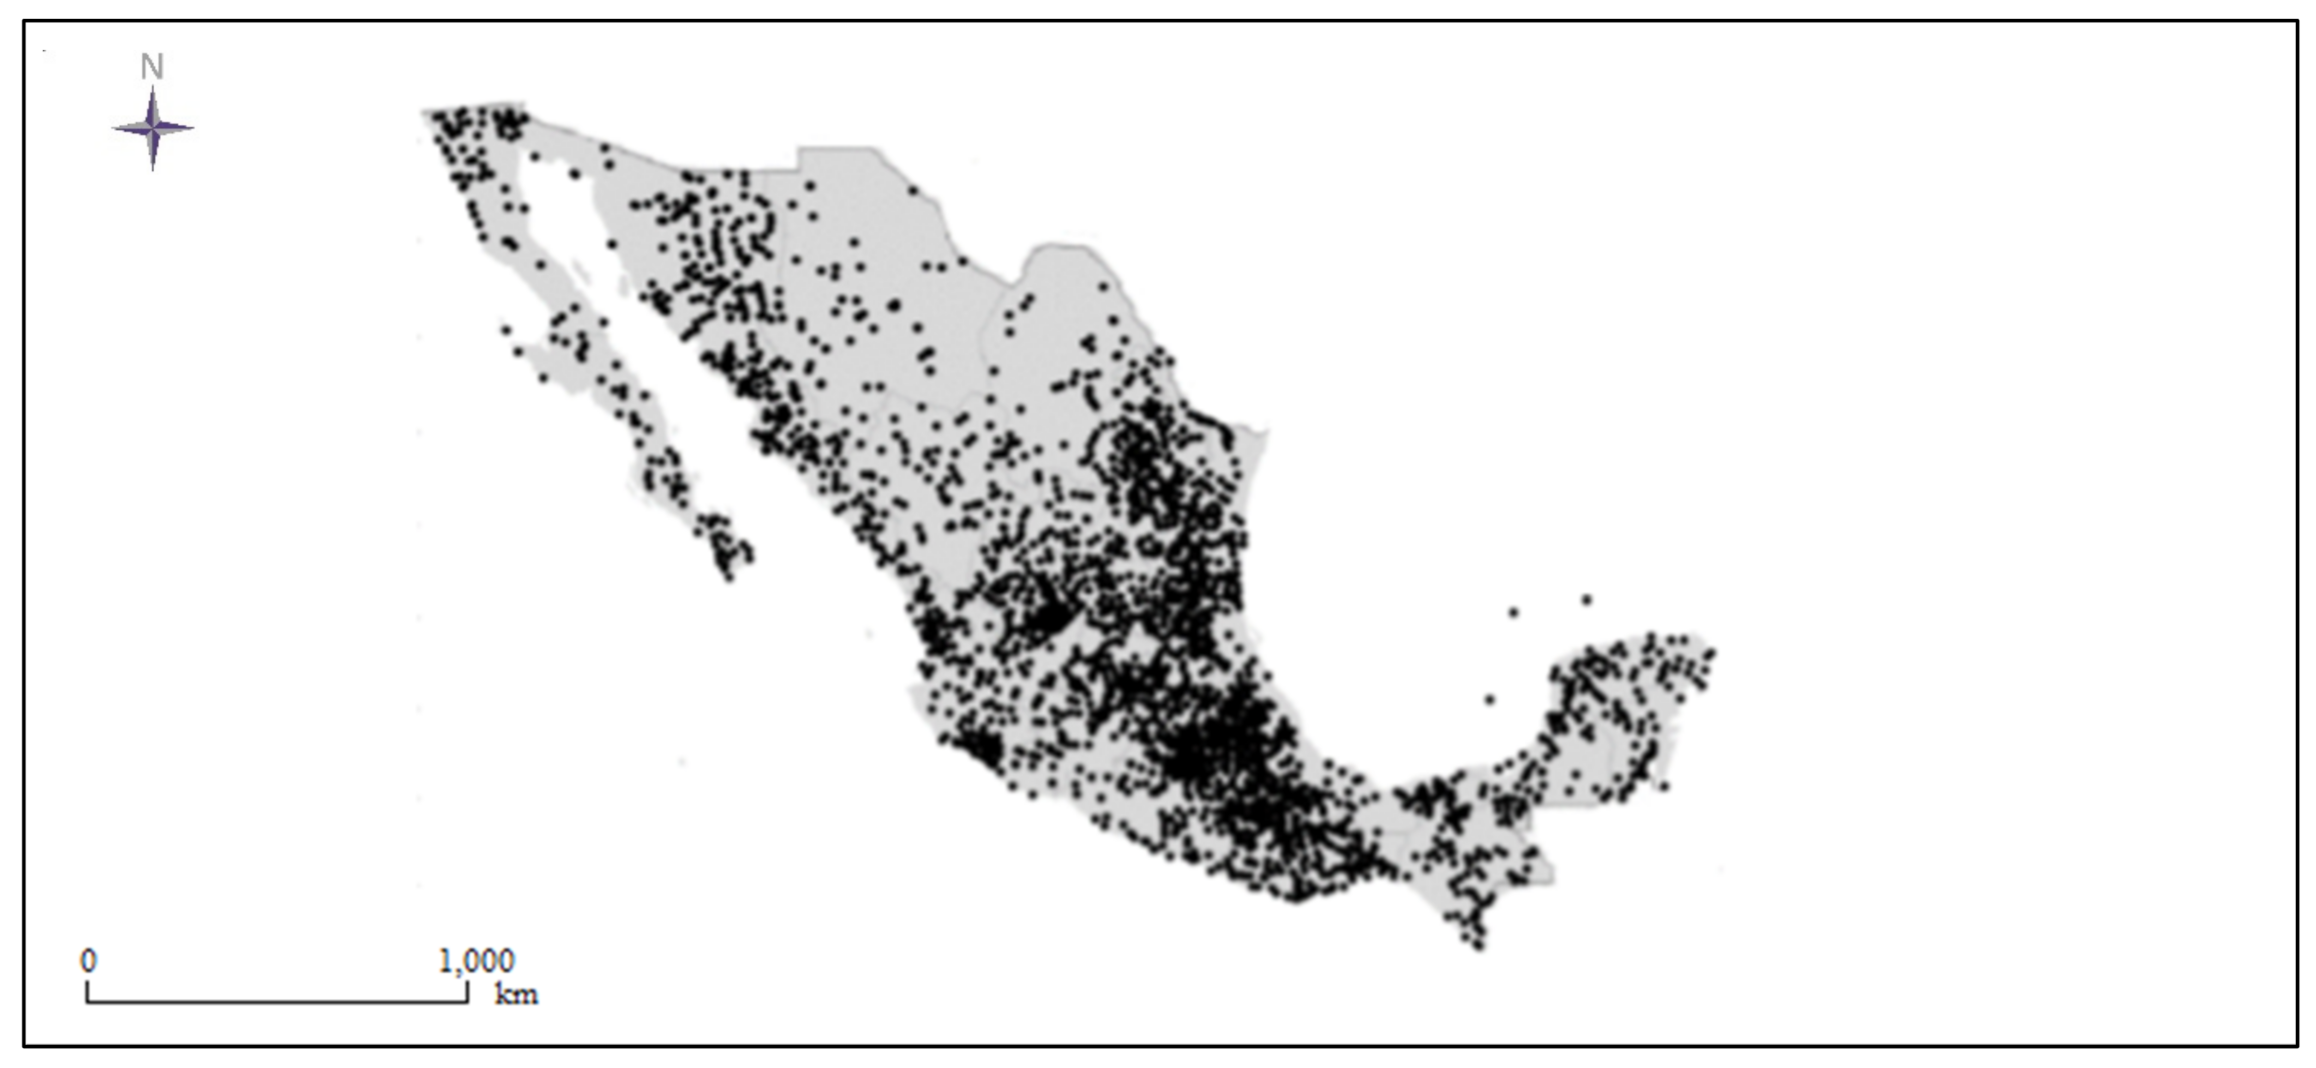
Rain gauge data was applied to provide a ground-based precipitation reference for GPM satellite data in this study. All rain gauge data in Mexico was collected through the online database provided by the Mexico National Meteorological Service website (
https://smn.conagua.gob.mx/es/) accessed on 18 July 2019, which supply meteorological information and provides a quality-controlled dataset. The dataset consists of 2829 tipping bucket rain gauges, each with a temporal resolution of 24 h (UTC-6). From
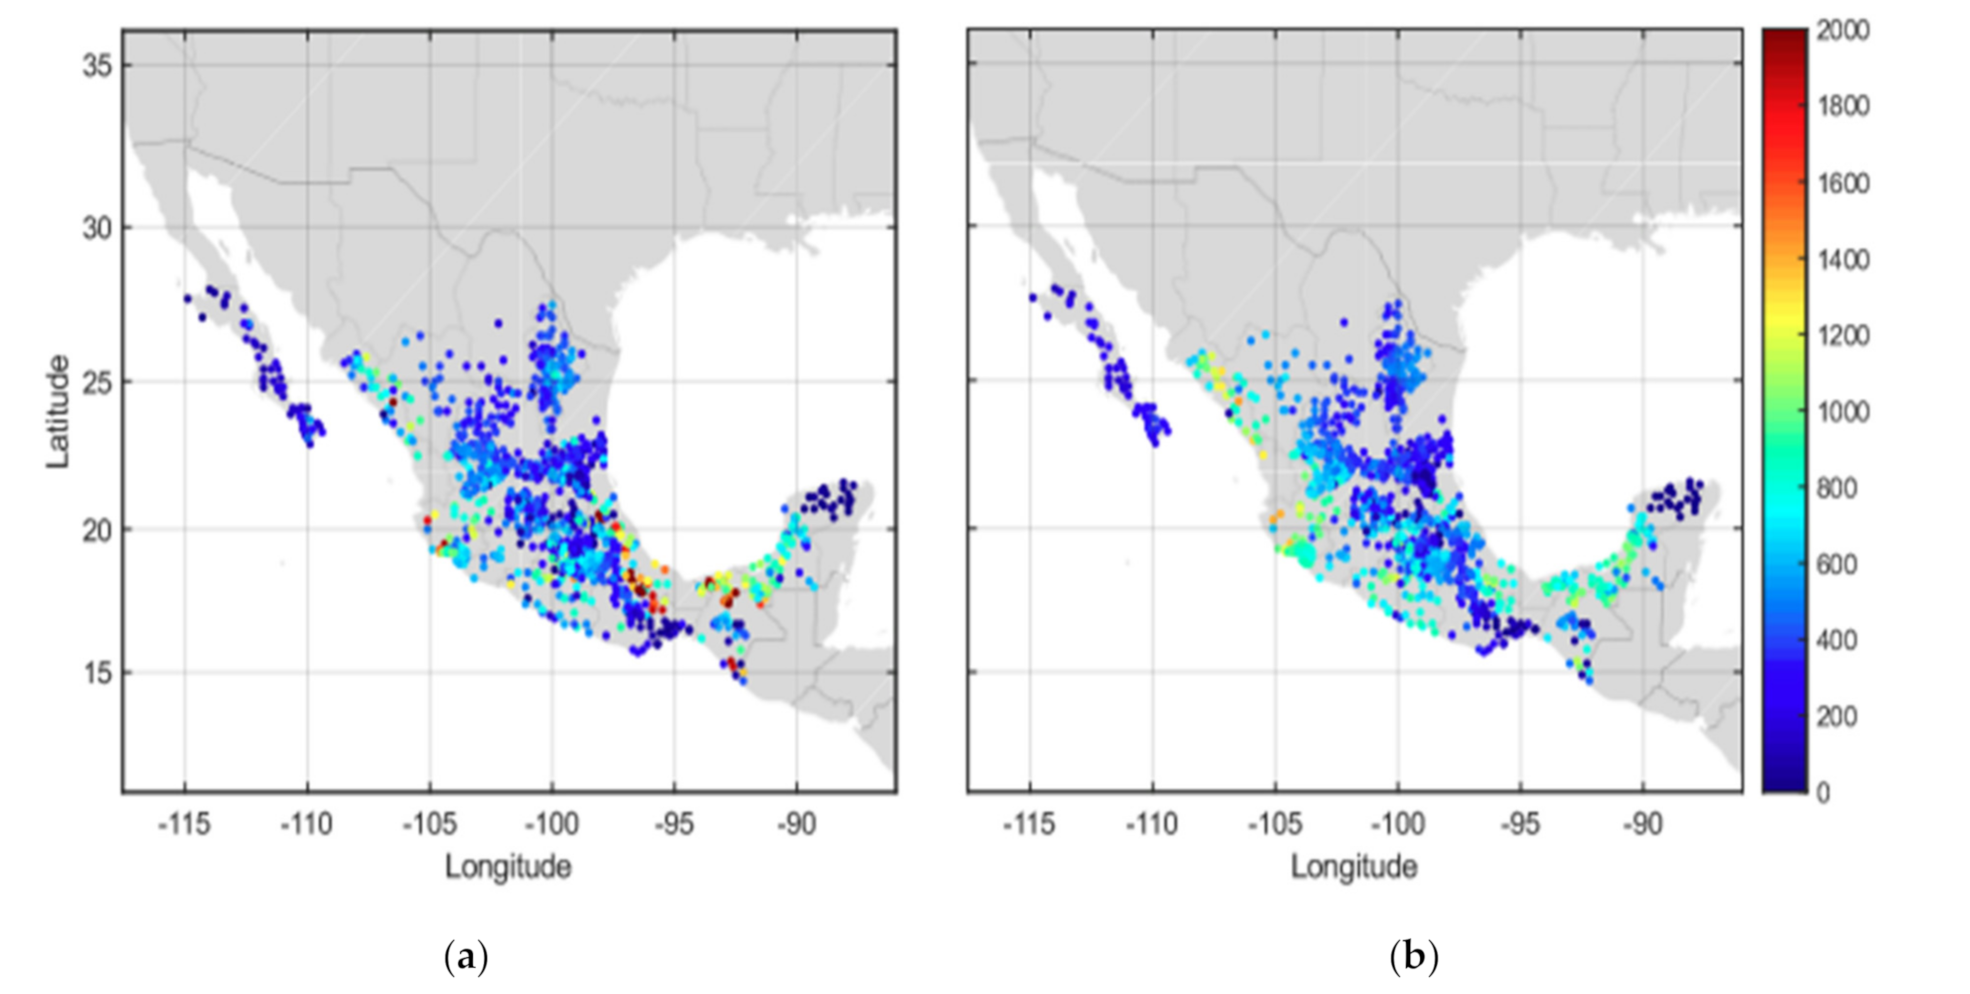
Figure 4 it can be observed that the distribution of rain gauges is uneven, which shows that the stations are accumulated densely in the south and spatially in the north. The reason for this is that the arrangement of rain gauges is based on the levels of precipitation density, so that there are more rain gauge stations in dense precipitation areas. This therefore reflects that southern Mexico receives more rainfall than the north. However, due to the frequency of measurement errors, traditional ground-based rain gauge measurements are not often regarded as a representative over large and high precipitation intensity areas, particularly at fine temporal resolutions. By contrast, satellite-based precipitation measurement has the potential to improve the understanding and forecasting of hydrological systems.
In this study, the GPM-IMERG V5 near-real-time (NRT) run product at 0.1° spatial resolution (around 10 km but varies from the equator to the poles) and 30 min temporal resolution were used. The data were available in an RT-H5 file format (RT indicates real-time and H5 represents an HDF5 file, respectively) and downloaded from the NASA Precipitation Measurement Program website (
http://www.pmm.nasa.gov) accessed on 24 July 2019. In addition, the dataset was translated to the daily time period as to correspond with the rain gauge data set as only daily gauge precipitation data were available. Therefore, a daily period between 8 am to 8 pm local time (UTC-6) was created within the dataset by the MATLAB package. The data period collection of rain gauges and GPM IMERG is shown in
Table 2 below.
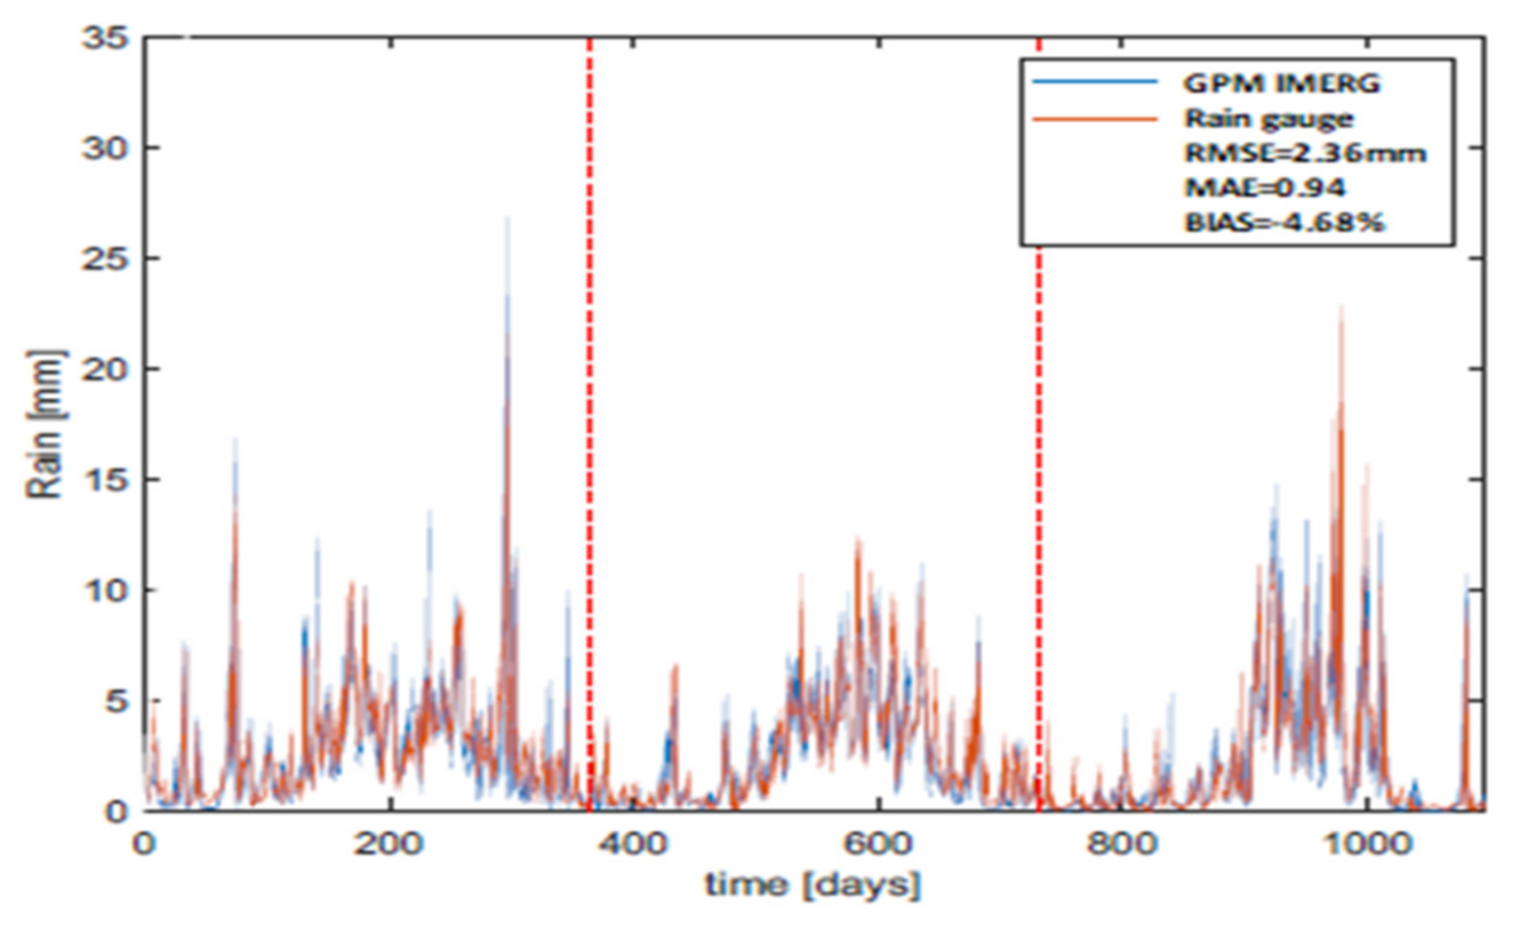
From the table, it can be seen that the same period of data collection of rain gauges and GPM is from 1 June 2014 to 1 March 2018 and the full-year data for both of them are from 2015 to 2017. Therefore, the precipitation data from this period of three years (2015–2017) was used in this analysis. Since the collected data is unstructured from the website, the processing the raw data into structured data takes considerable time for post processing.
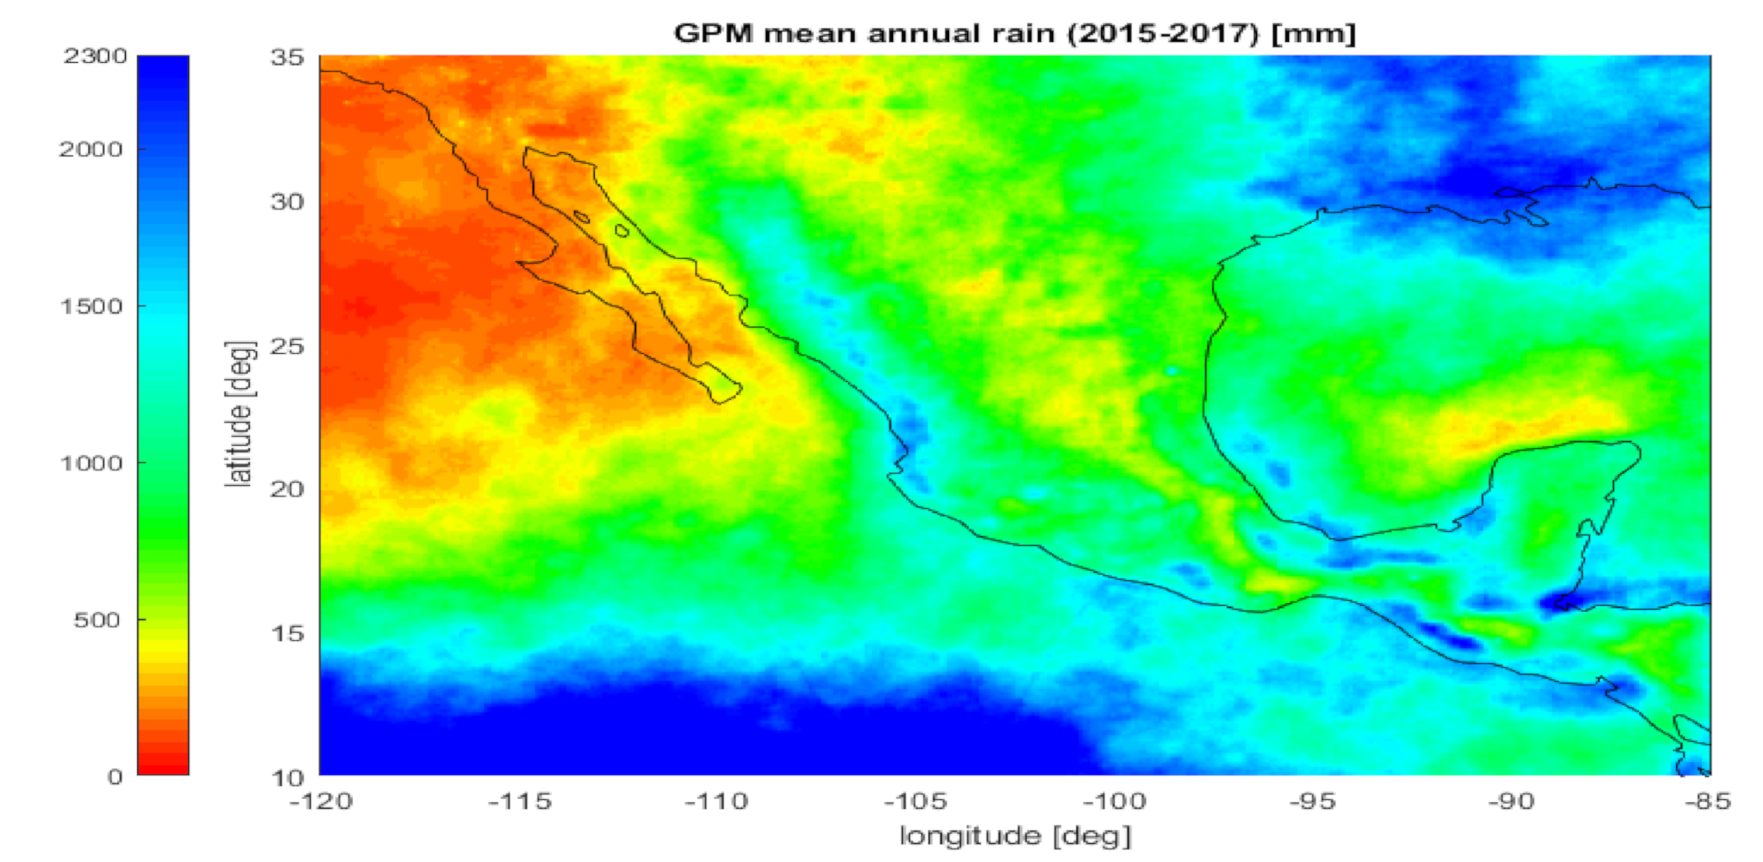
The distribution of mean annual precipitation in Mexico from 2010 to 2015 according to the National Water Commission (
Figure 2), which was estimated by weather radar. In order to give a broad understanding of the quality of the GPM product for measuring precipitation over Mexico,
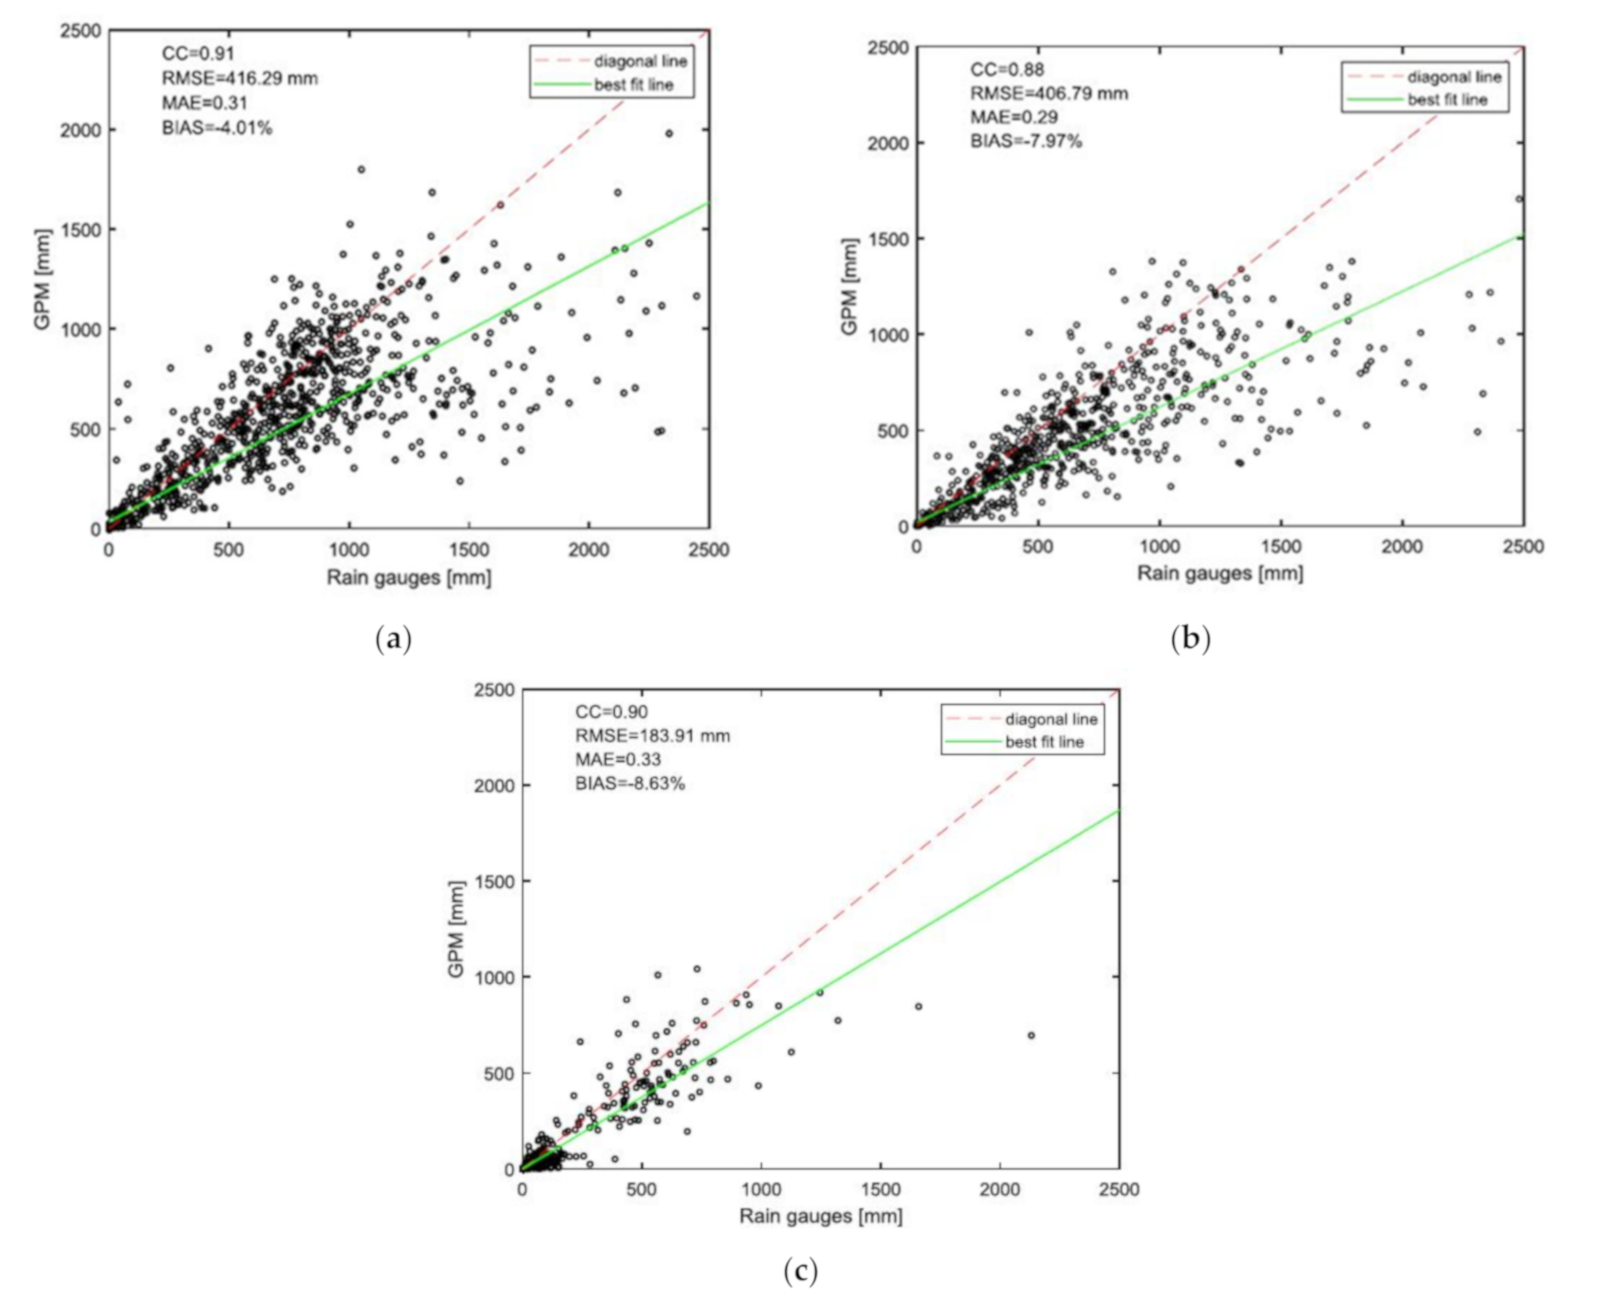
Figure 5 was plotted by MATLAB to present the distribution of the mean annual precipitation estimated using GPM data over a three-year period from 2015 to 2017. By comparing these two graphs, it can be observed that the precipitation distribution estimated by GPM is quite close to the radar precipitation estimation, and the GPM is proven to be able to duplicate the spatial precipitation patterns while showing only slight overestimates in coastal areas. The preliminary analysis indicates that the quality of the GPM data performs well at the national scale.
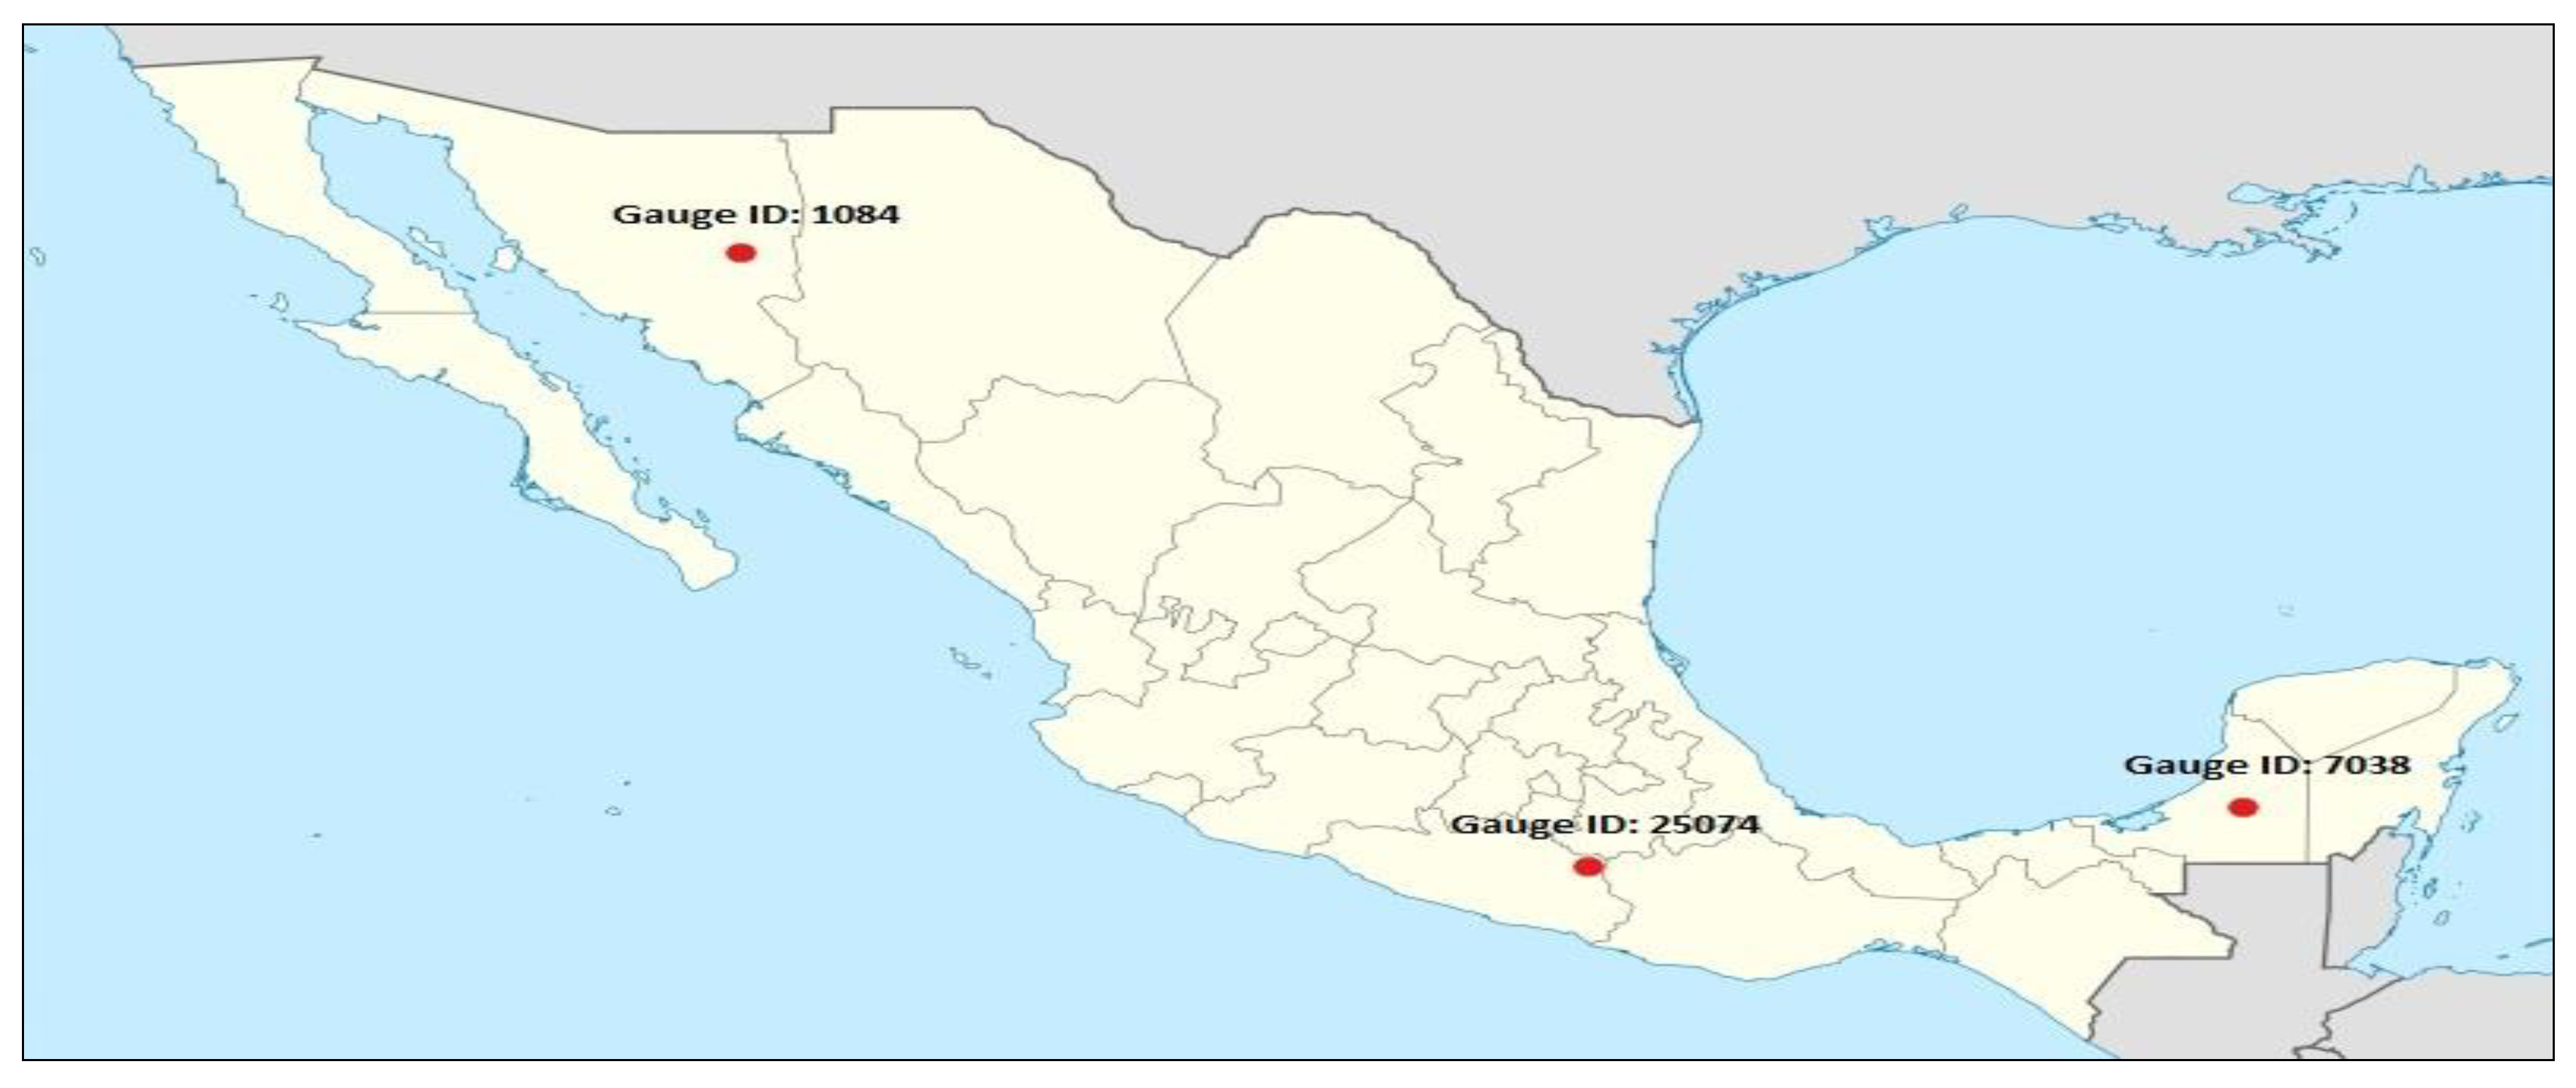
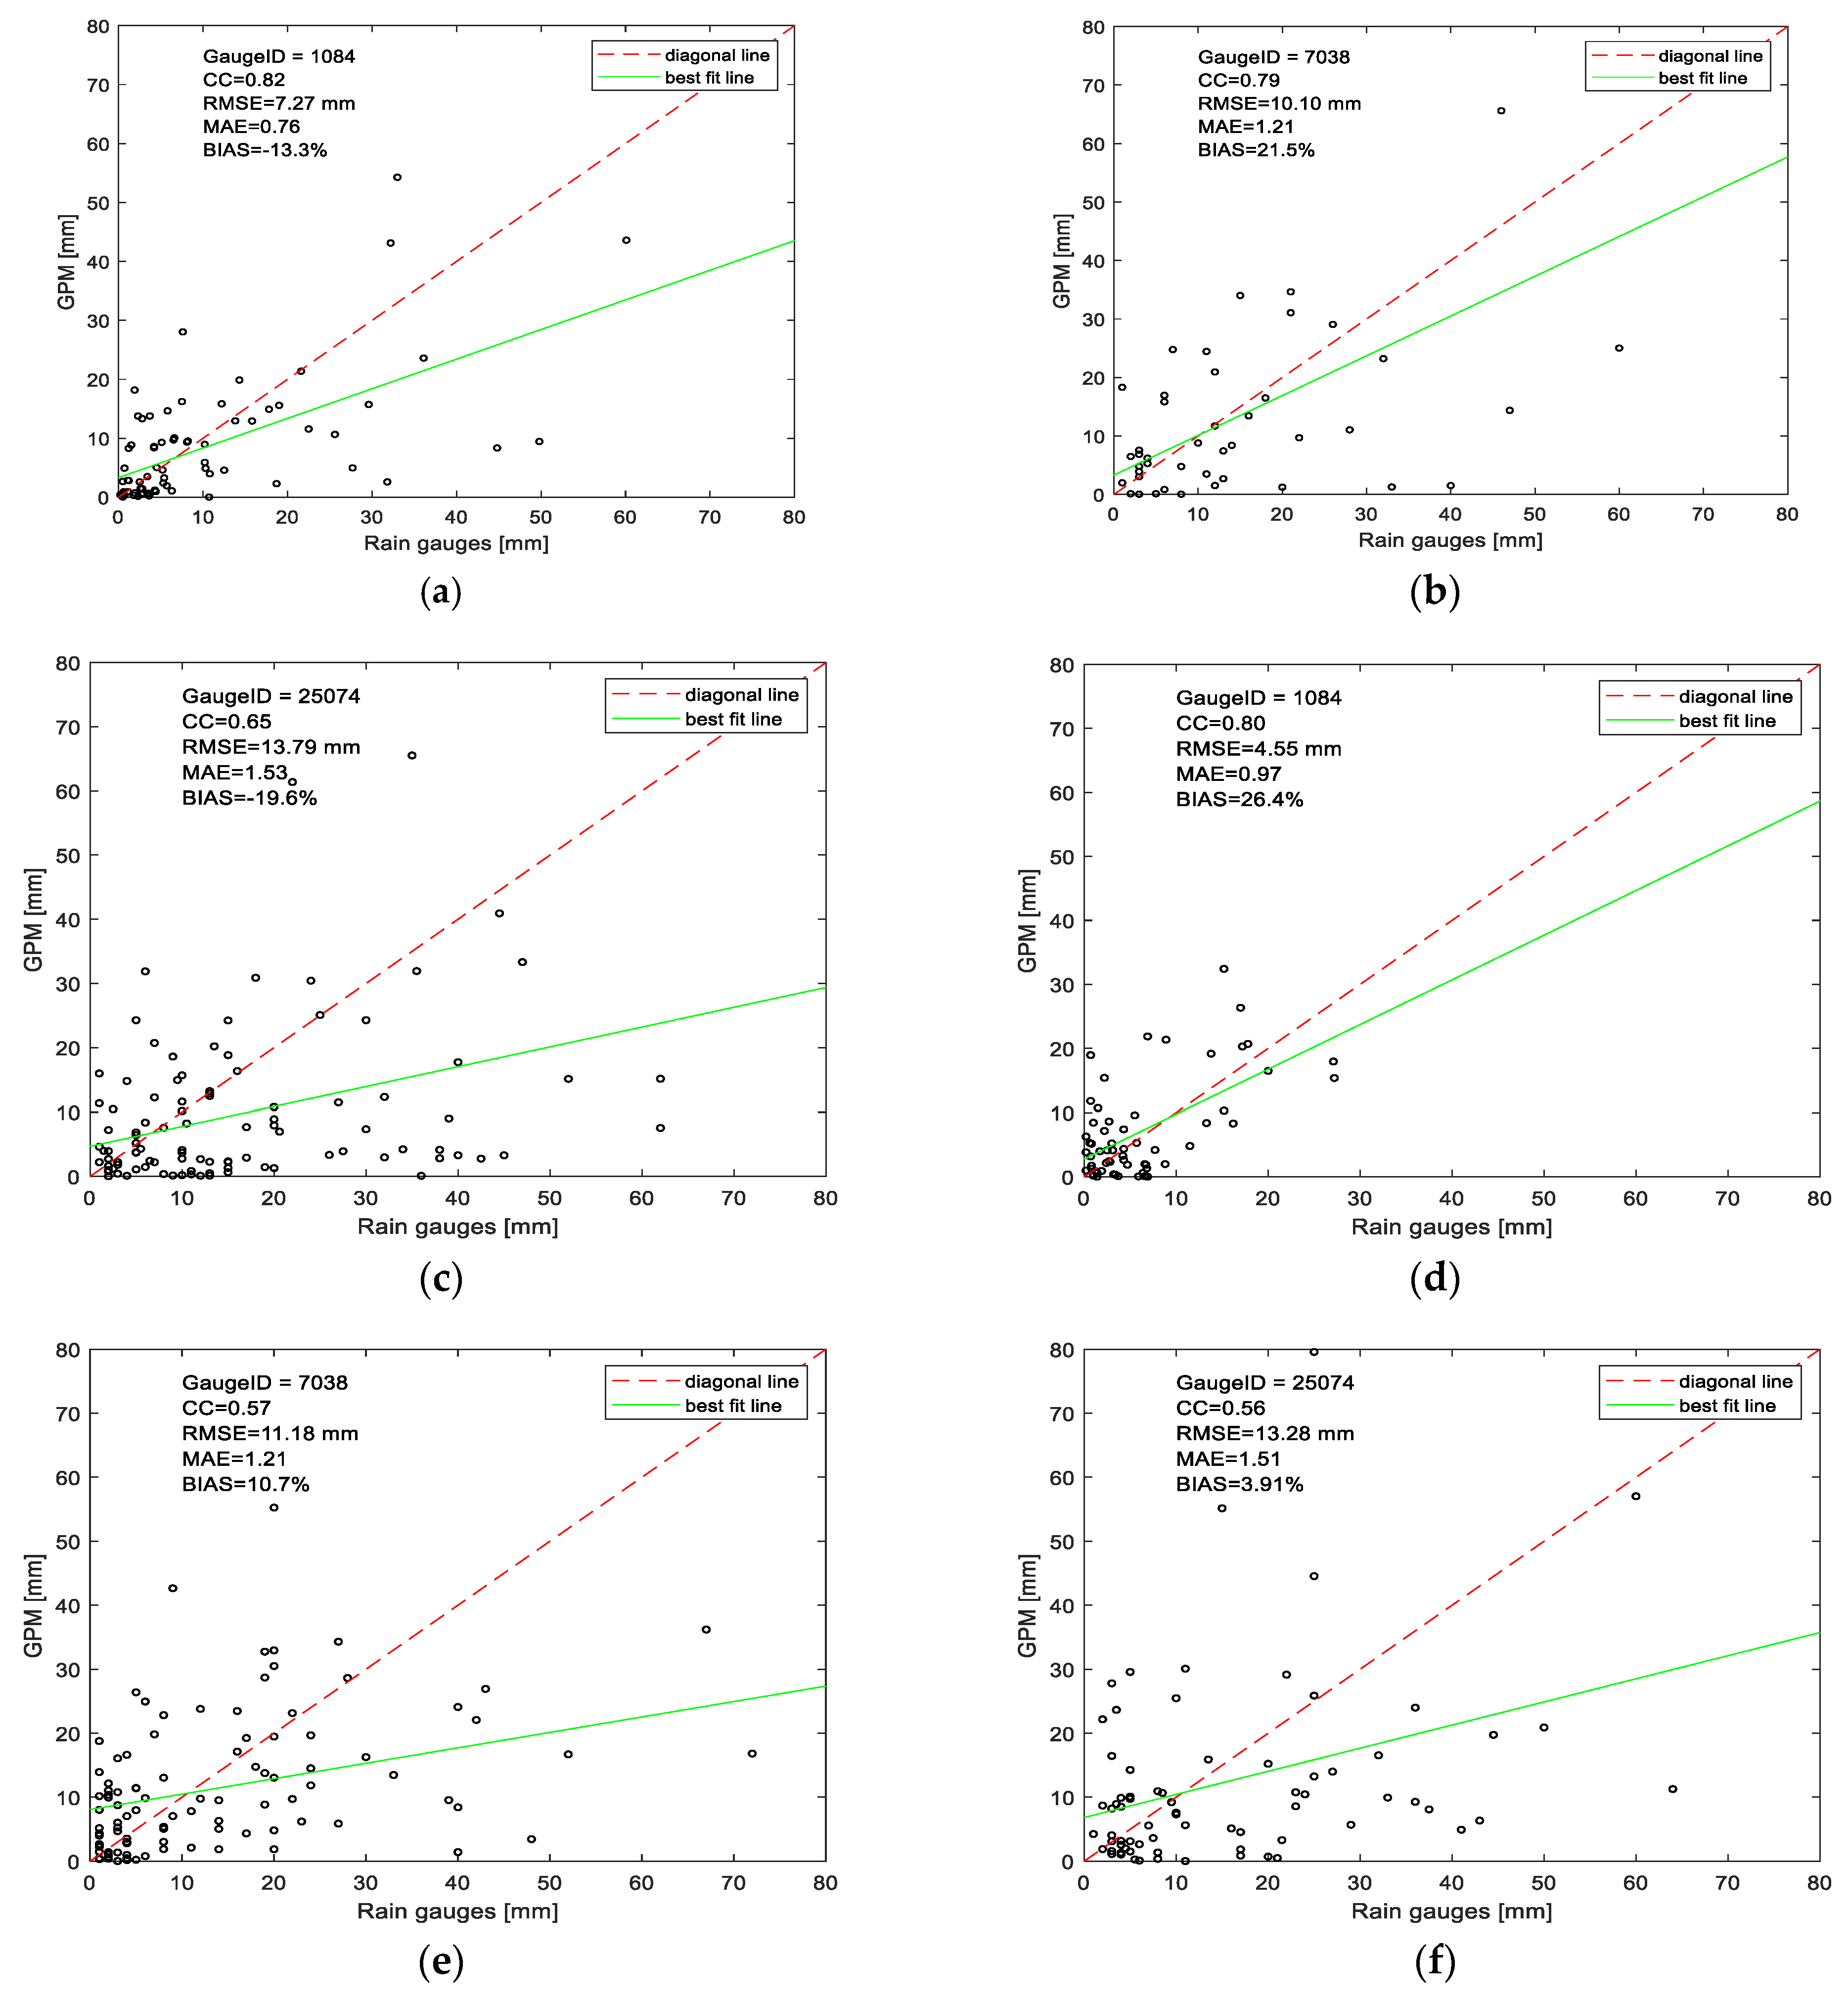
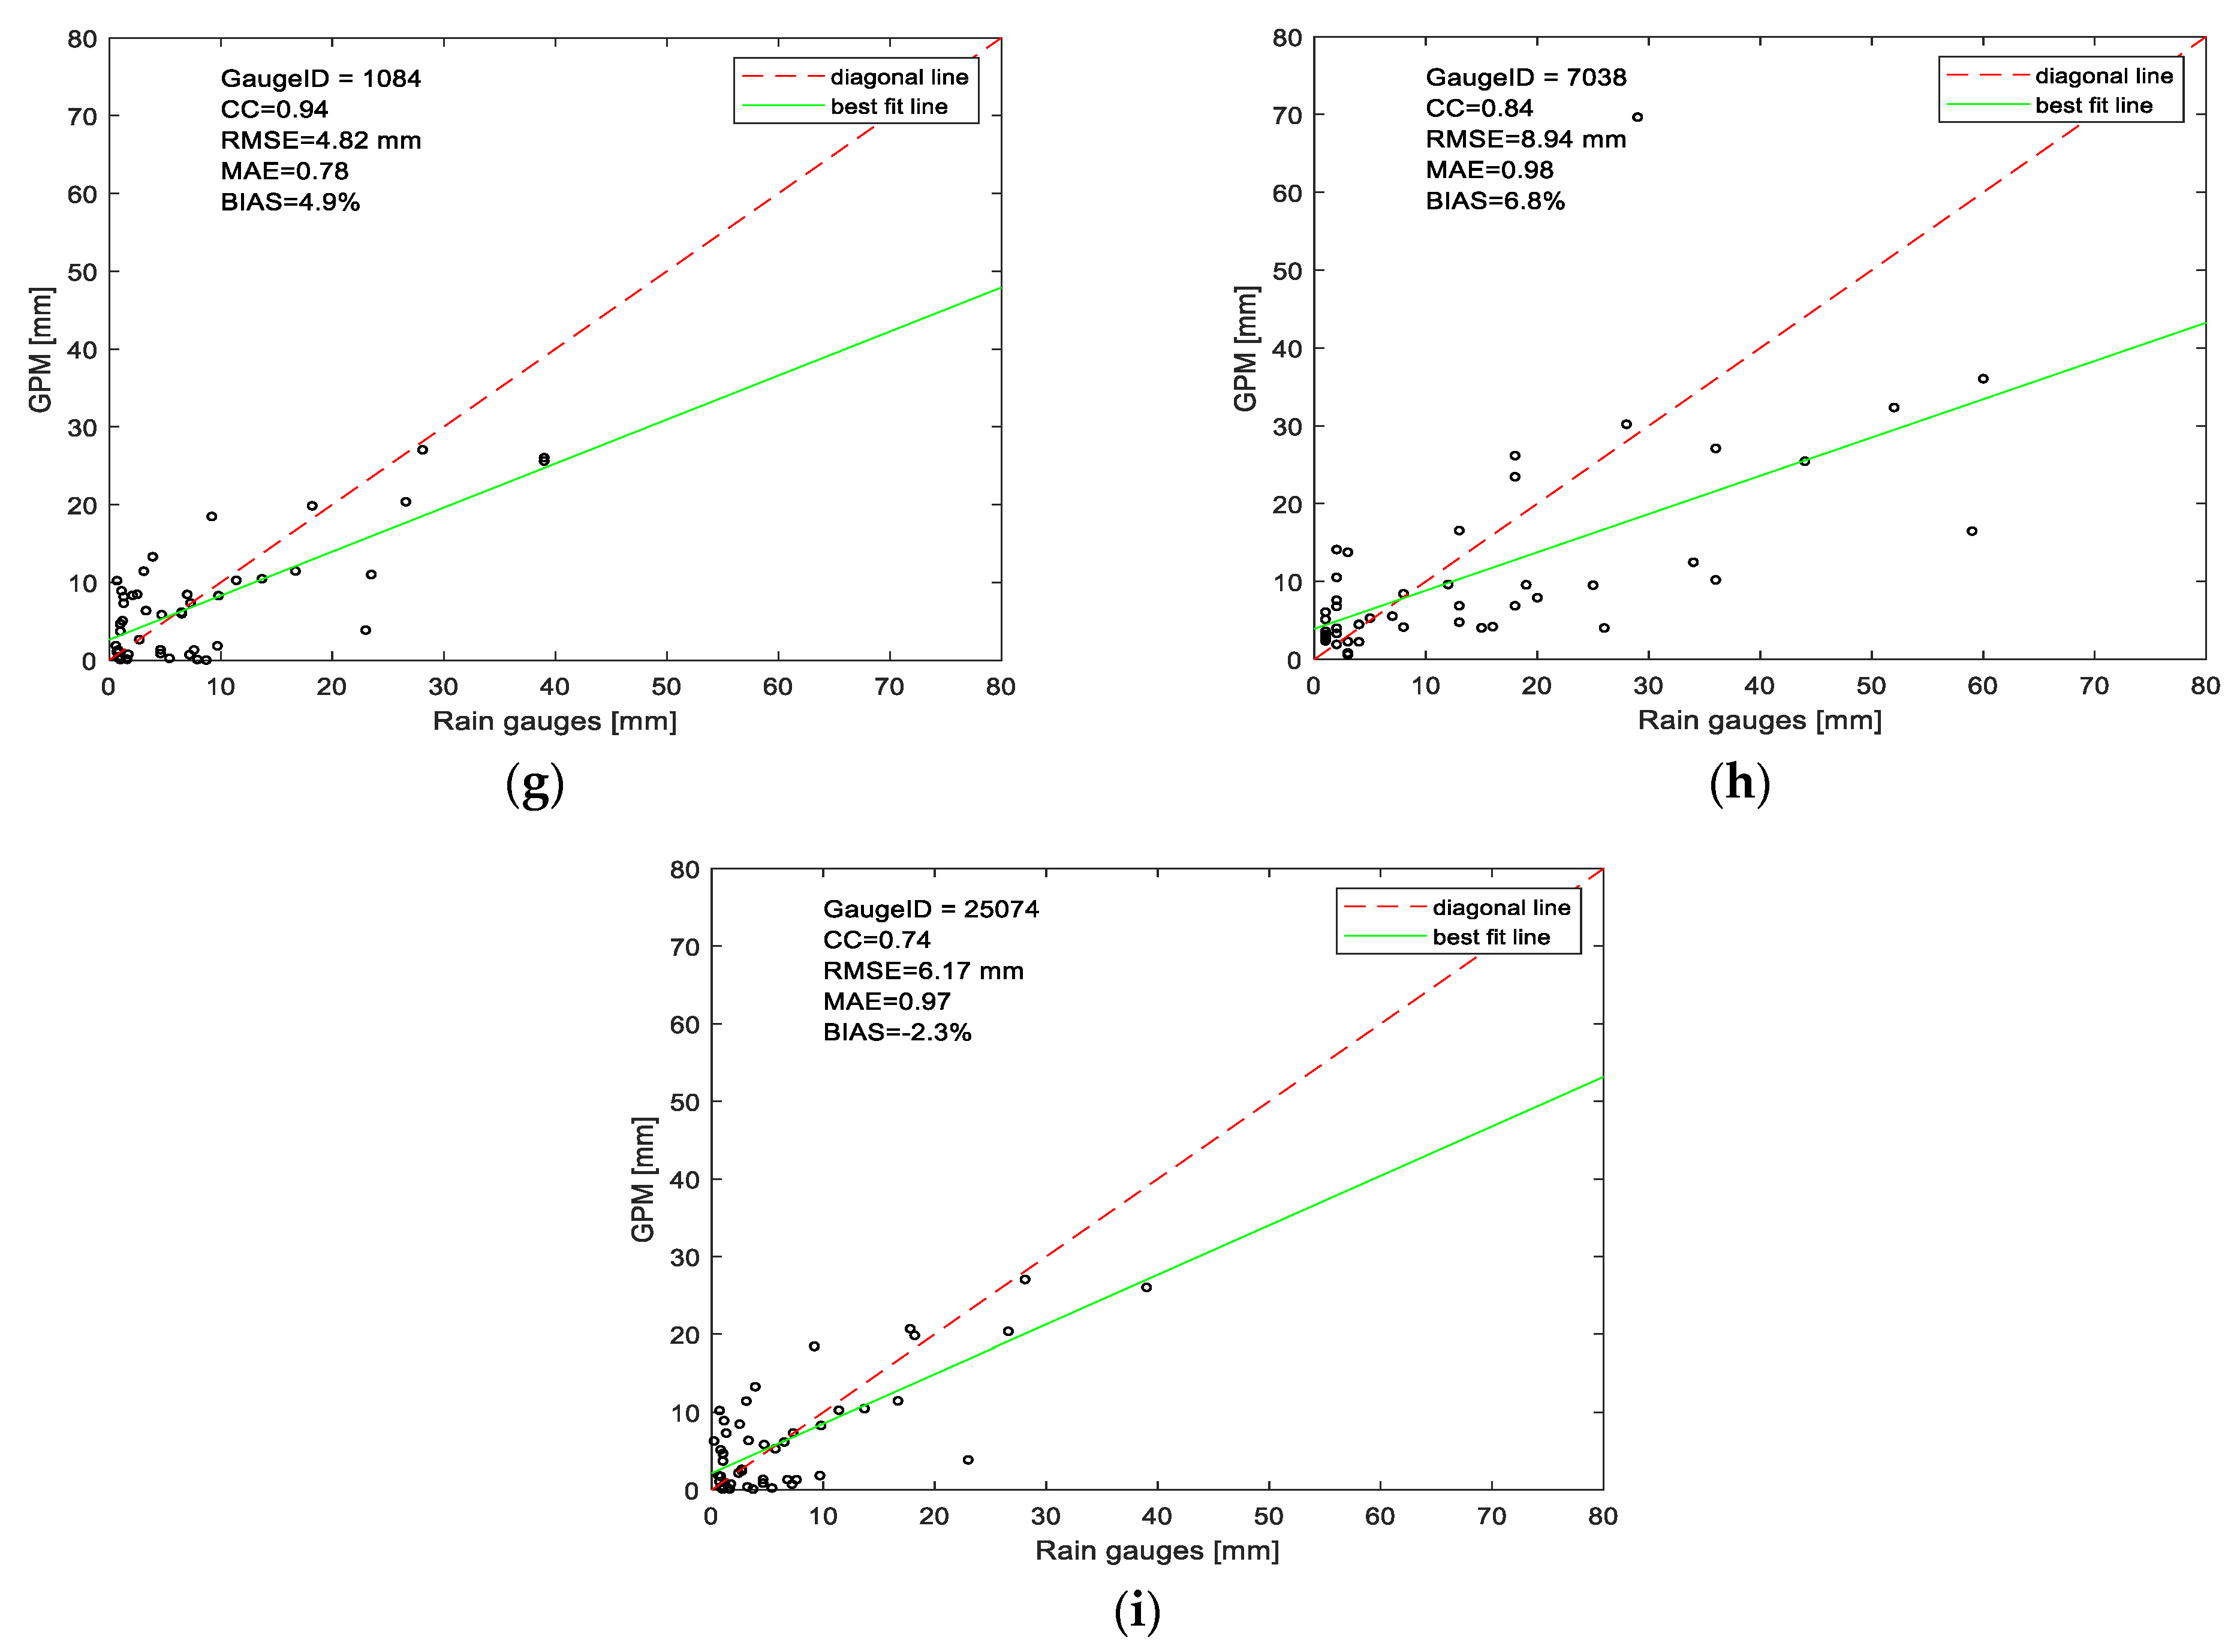
After evaluating the quality of GPM data at the annual and national scales, it was found that the GPM presented a relatively high agreement with rain gauges. It needs to be noted that the rain gauge data with zero was ignored in this study. The next stage of the study investigated the quality of GPM data at the daily scale by using single and multiple gauges. For single gauges, three single rain gauge stations were chosen with different elevations above sea level based on two criteria: (a) the elevation is typical over Mexico, and (b) it has continuous data throughout the three-year period 2015–2017.
Figure 6 presents the location of the selected three rain gauges, which are gauge 1084 at 2032 m elevation, gauge 25074 at 1472 m elevation and gauge 7038 at 226 m elevation. In addition, the climate around gauge 1084 has a dry winter, pleasantly warm during the day and a very hot summer. For gauge 25074, the climate is hot all year round, but the dry season, from November to May, is sunny and it almost never rains. For gauge 7038, the least rainy period runs from February to April, and the driest month is April.
4. Data Processing
In order to detect and evaluate the quality and performance of GPM data, the rain gauge data was applied as a reference for comparison. Several conventional statistical performance metrics were selected, which were the Correlation Coefficient (CC) in Equation (1), the Mean Absolute Error (MAE) in Equation (5) [
46], the Root Mean Square Error (RMSE) in Equation (4) [
47,
48] and the Relative Bias (BIAS) in Equation (6). Firstly, the CC described the agreement between satellite estimates and rain gauge observations, and secondly, the MAE, RMSE and BIAS was applied to describe the error and bias of satellite estimates compared with rain gauge observations [
49]. The relevant equations are as follows [
50,
51]:
Pearson Correlation Coefficient (CC) was calculated as Equation (1):
The Root Mean Square Error (RMSE) was obtained by Equation (4) as:
The Mean Absolute Error (MAE) was obtained by Equation (5) as:
The GPM product overestimates precipitation amounts if MAE value higher than 1, otherwise, the satellite product underestimates the precipitation.
The Relative Bias (BIAS) was obtained by Equation (6) as:
where
PG and
PS represent the actual precipitation value provided by rain gauges and precipitation estimation provided by the satellite product, respectively.
n is regarded as the number of observations.
σS and
σG are standard deviations of GPM satellite precipitation and standard deviations of rain gauge precipitation, respectively.
In addition, in terms of probabilistic statistical indices, the probability of detection (POD), the critical success index (CSI) and the false alarm ratio (FAR) was applied to describe the eventuality of GPM satellite precipitation estimates. POD provides the fraction of precipitation events that the satellite distinguishes among all the actual precipitation events, and FAR provides the fraction of unreal events among all the events GPM satellites detect [
49]. The CSI was essentially obtained by a function of POD and FAR. These equations were as follows [
6,
52]:
The Probability of Detection (POD) as Equation (7) as:
The False Alarm Ration (FAR):
The Critical Success Index (CSI):
where
n11 represents precipitation observed by the rain gauge and GPM satellite simultaneously.
n10 is precipitation observed by the GPM satellite but not observed by the rain gauge, and
n01 is converse to
n10. The perfect values of the evaluation metrics are presented in
Table 3 below [
38,
49]. Moreover, since the expression for precipitation intensity in this study is the collecting of precipitation over a consistent time period, the unit of precipitation is ‘mm’ instead of ‘mm/h’.
7. Conclusions and Summary
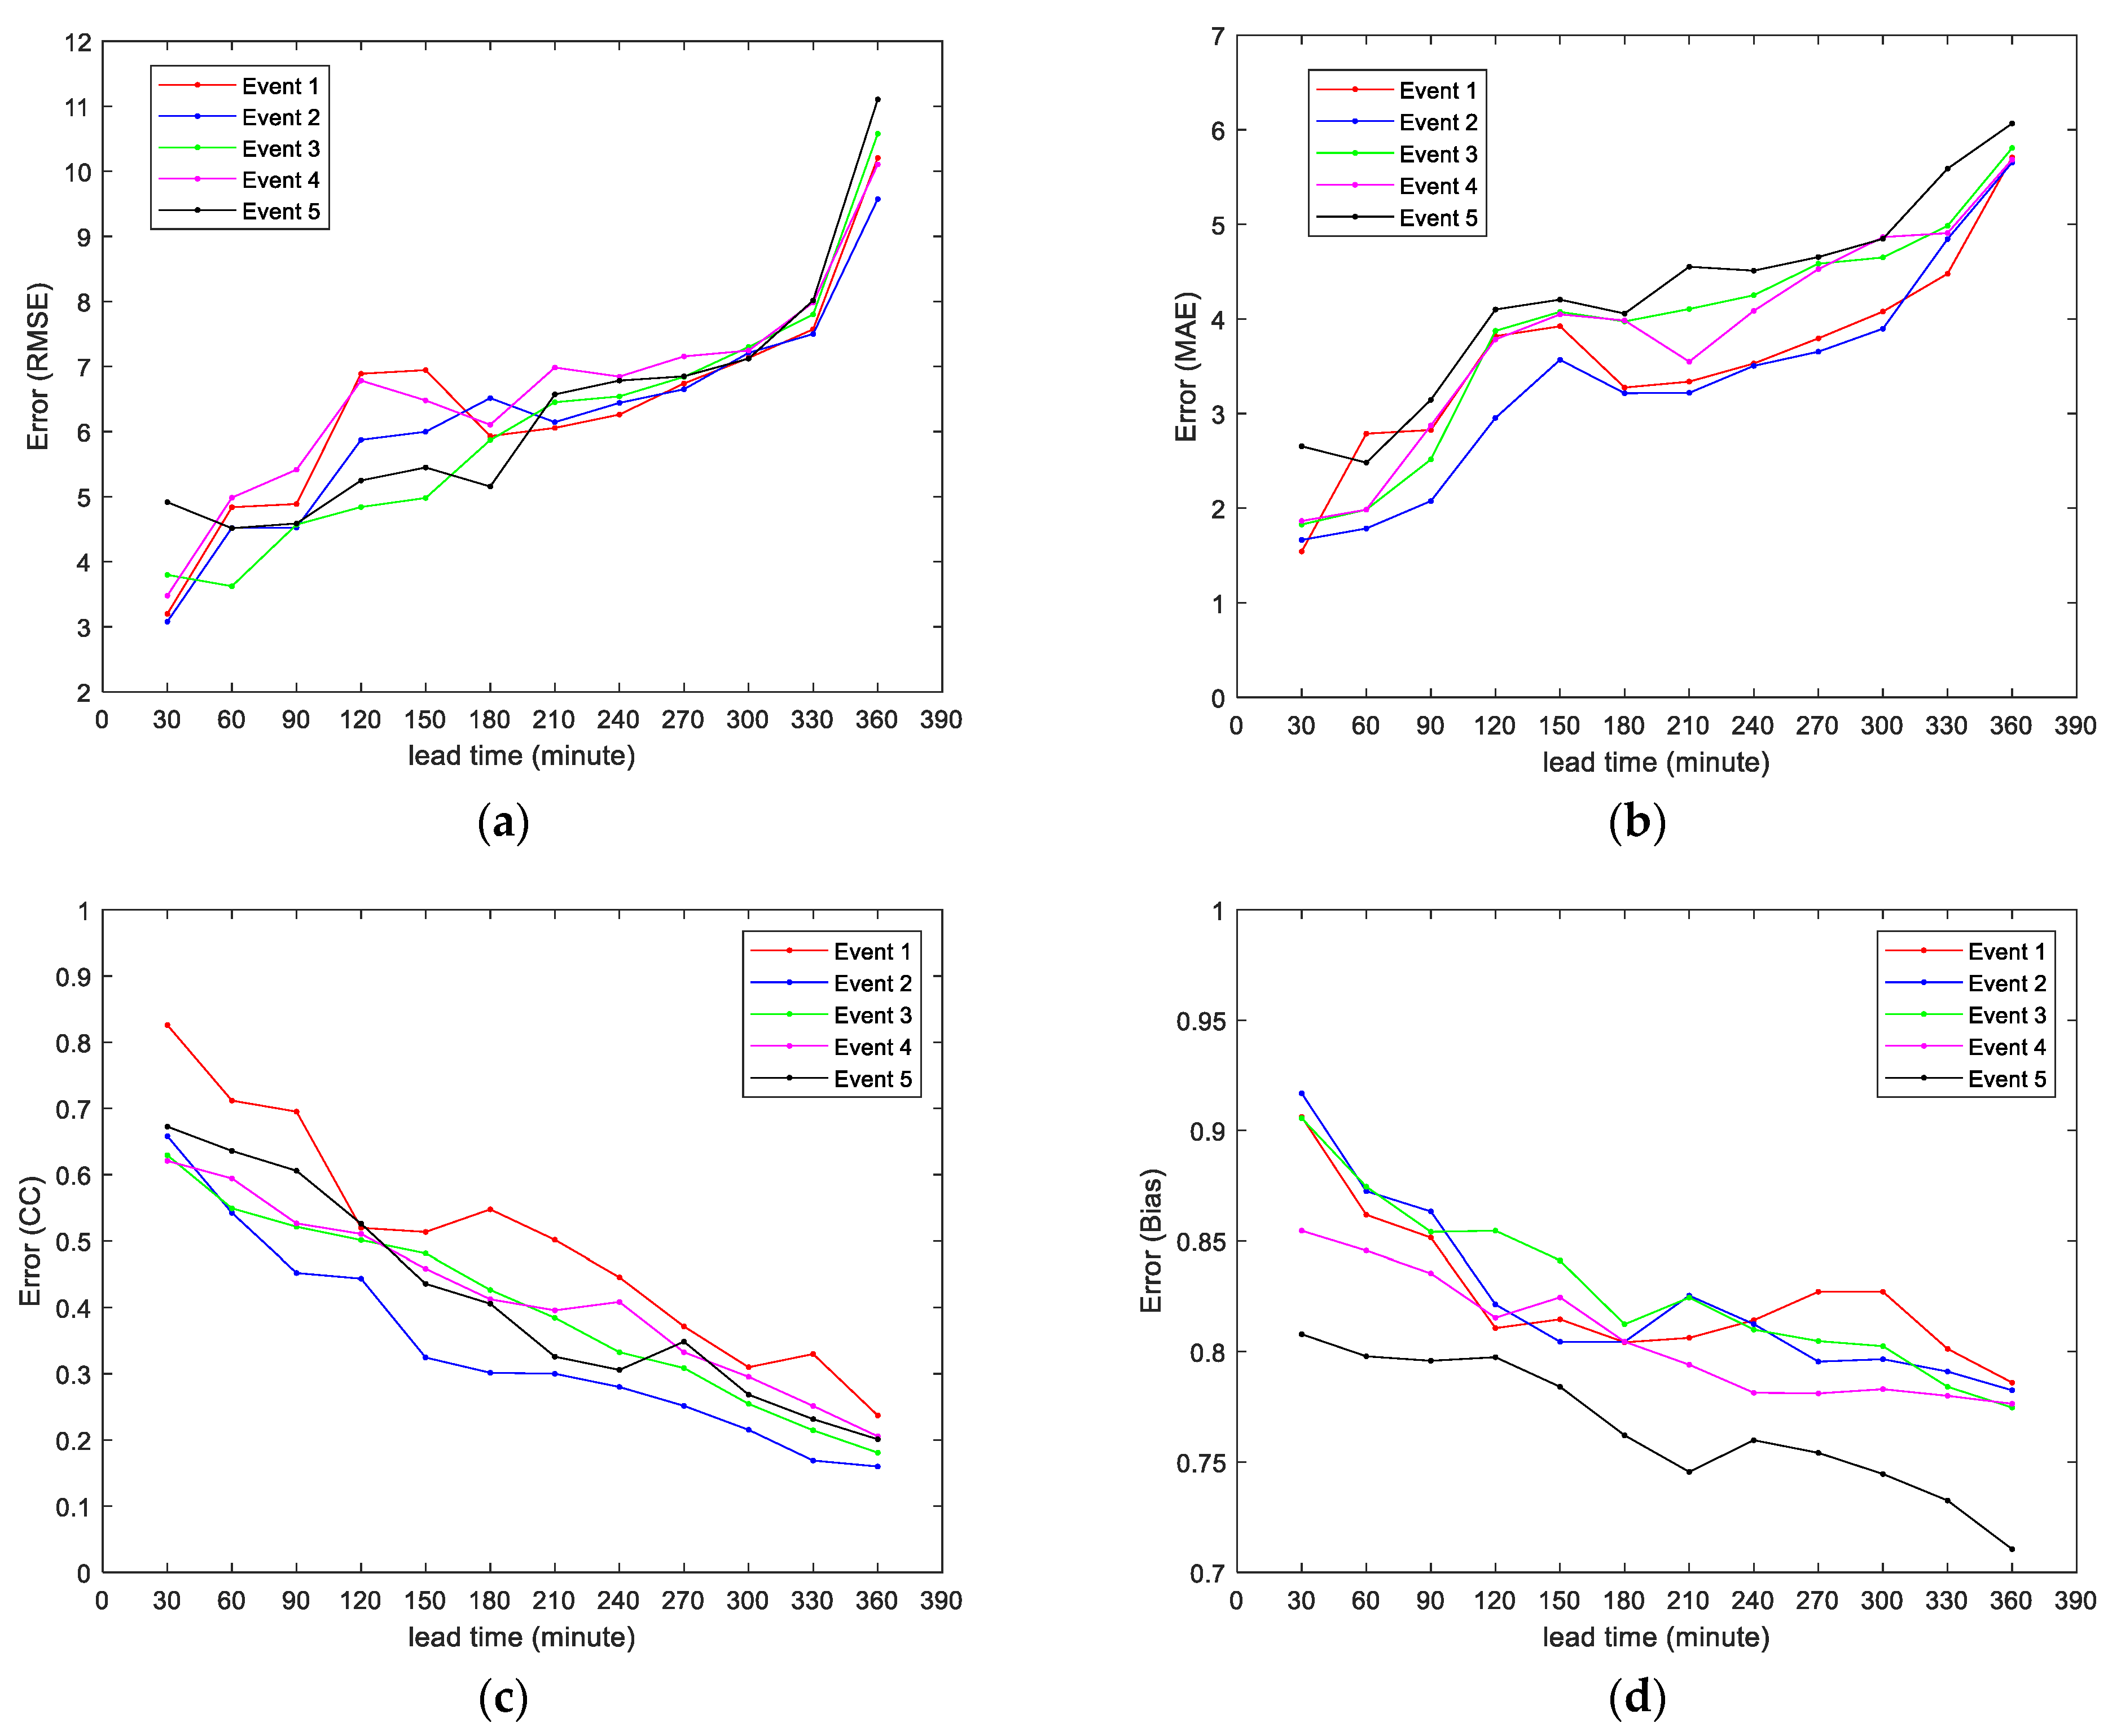
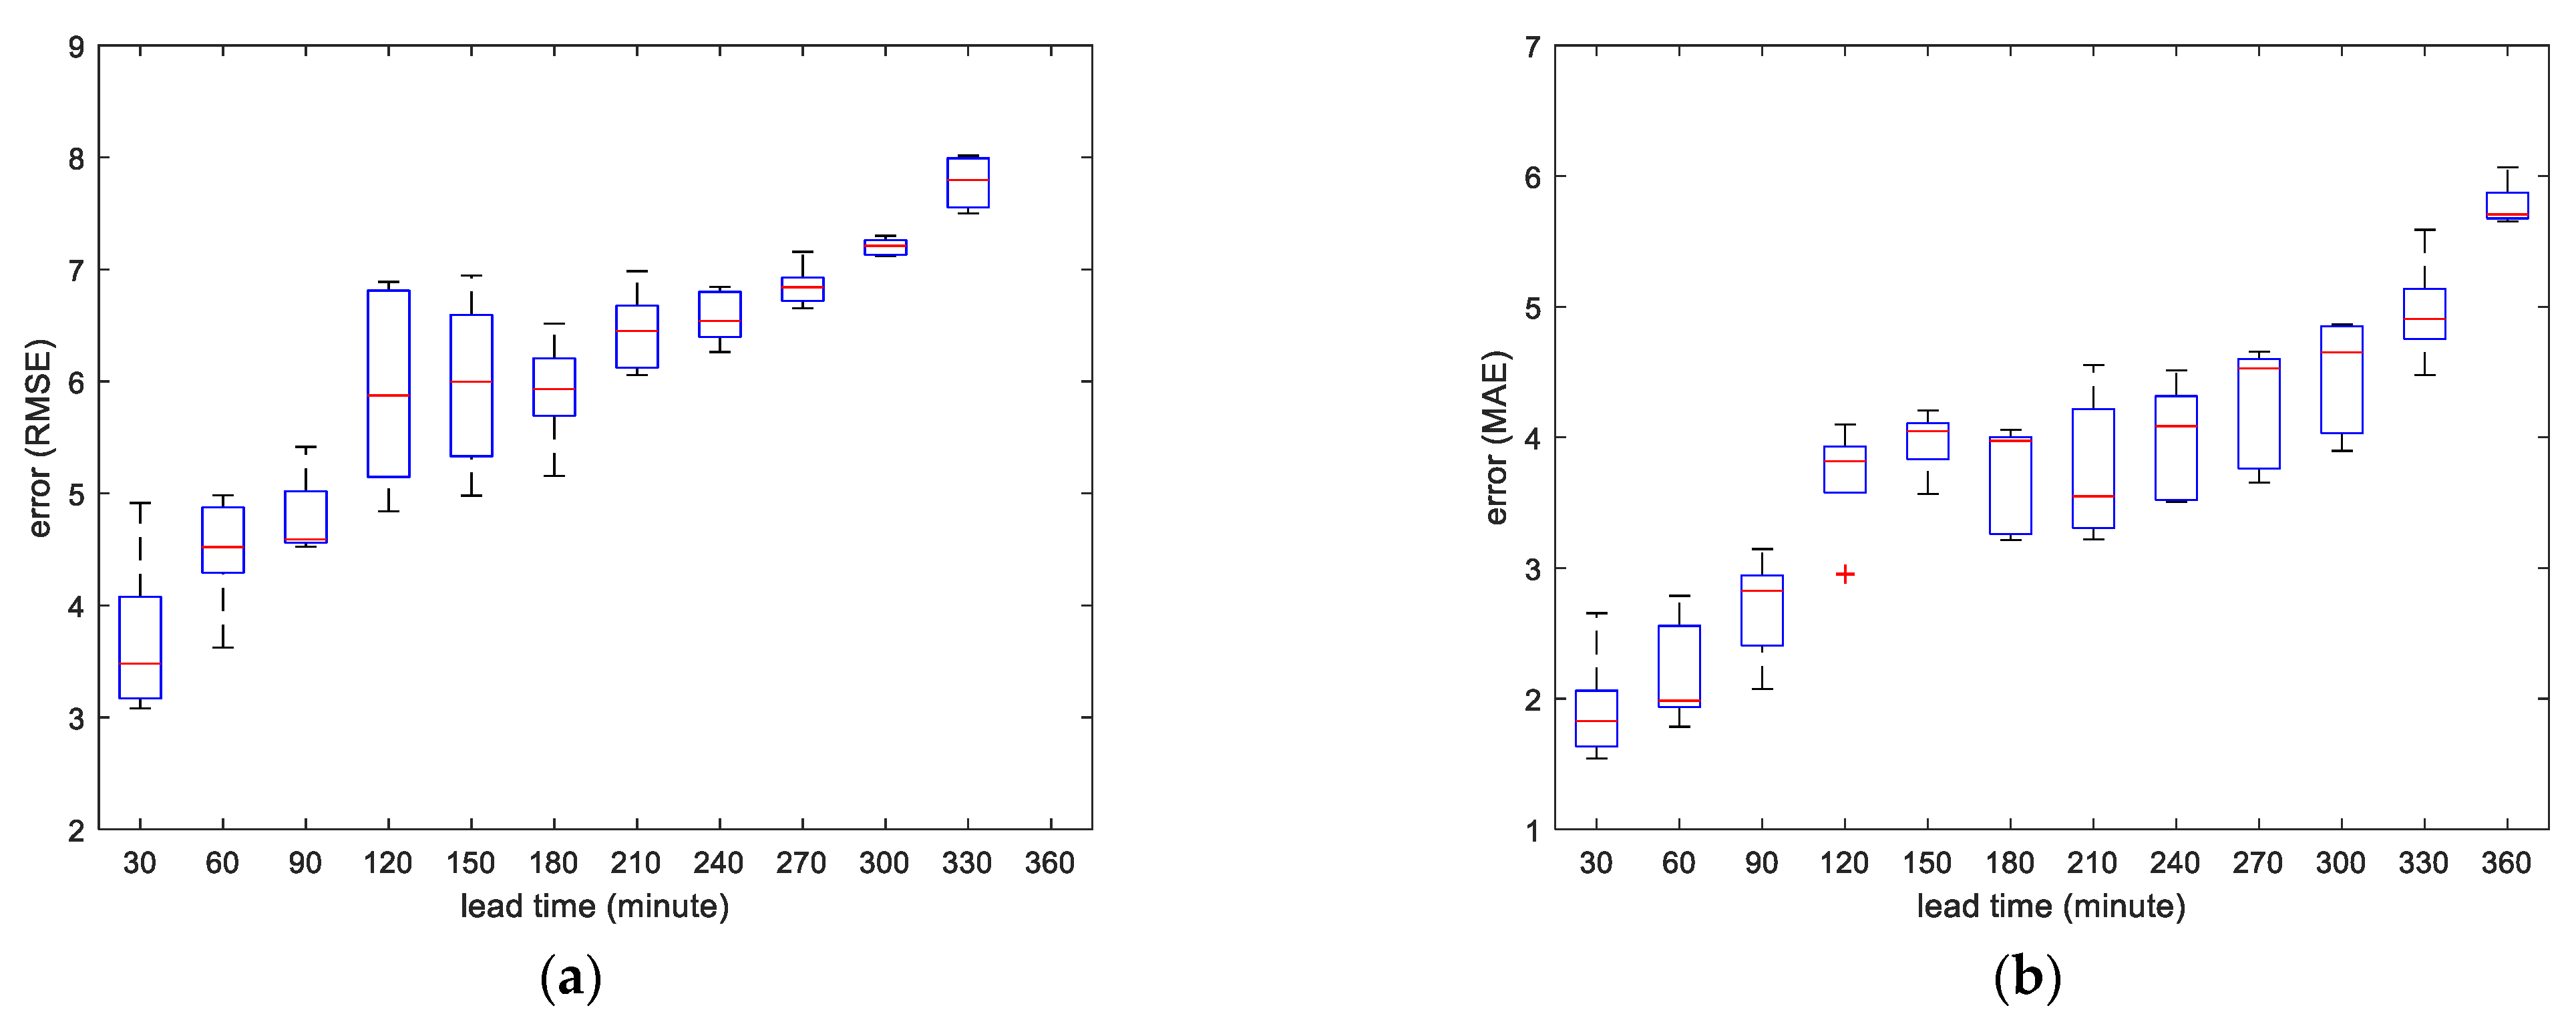
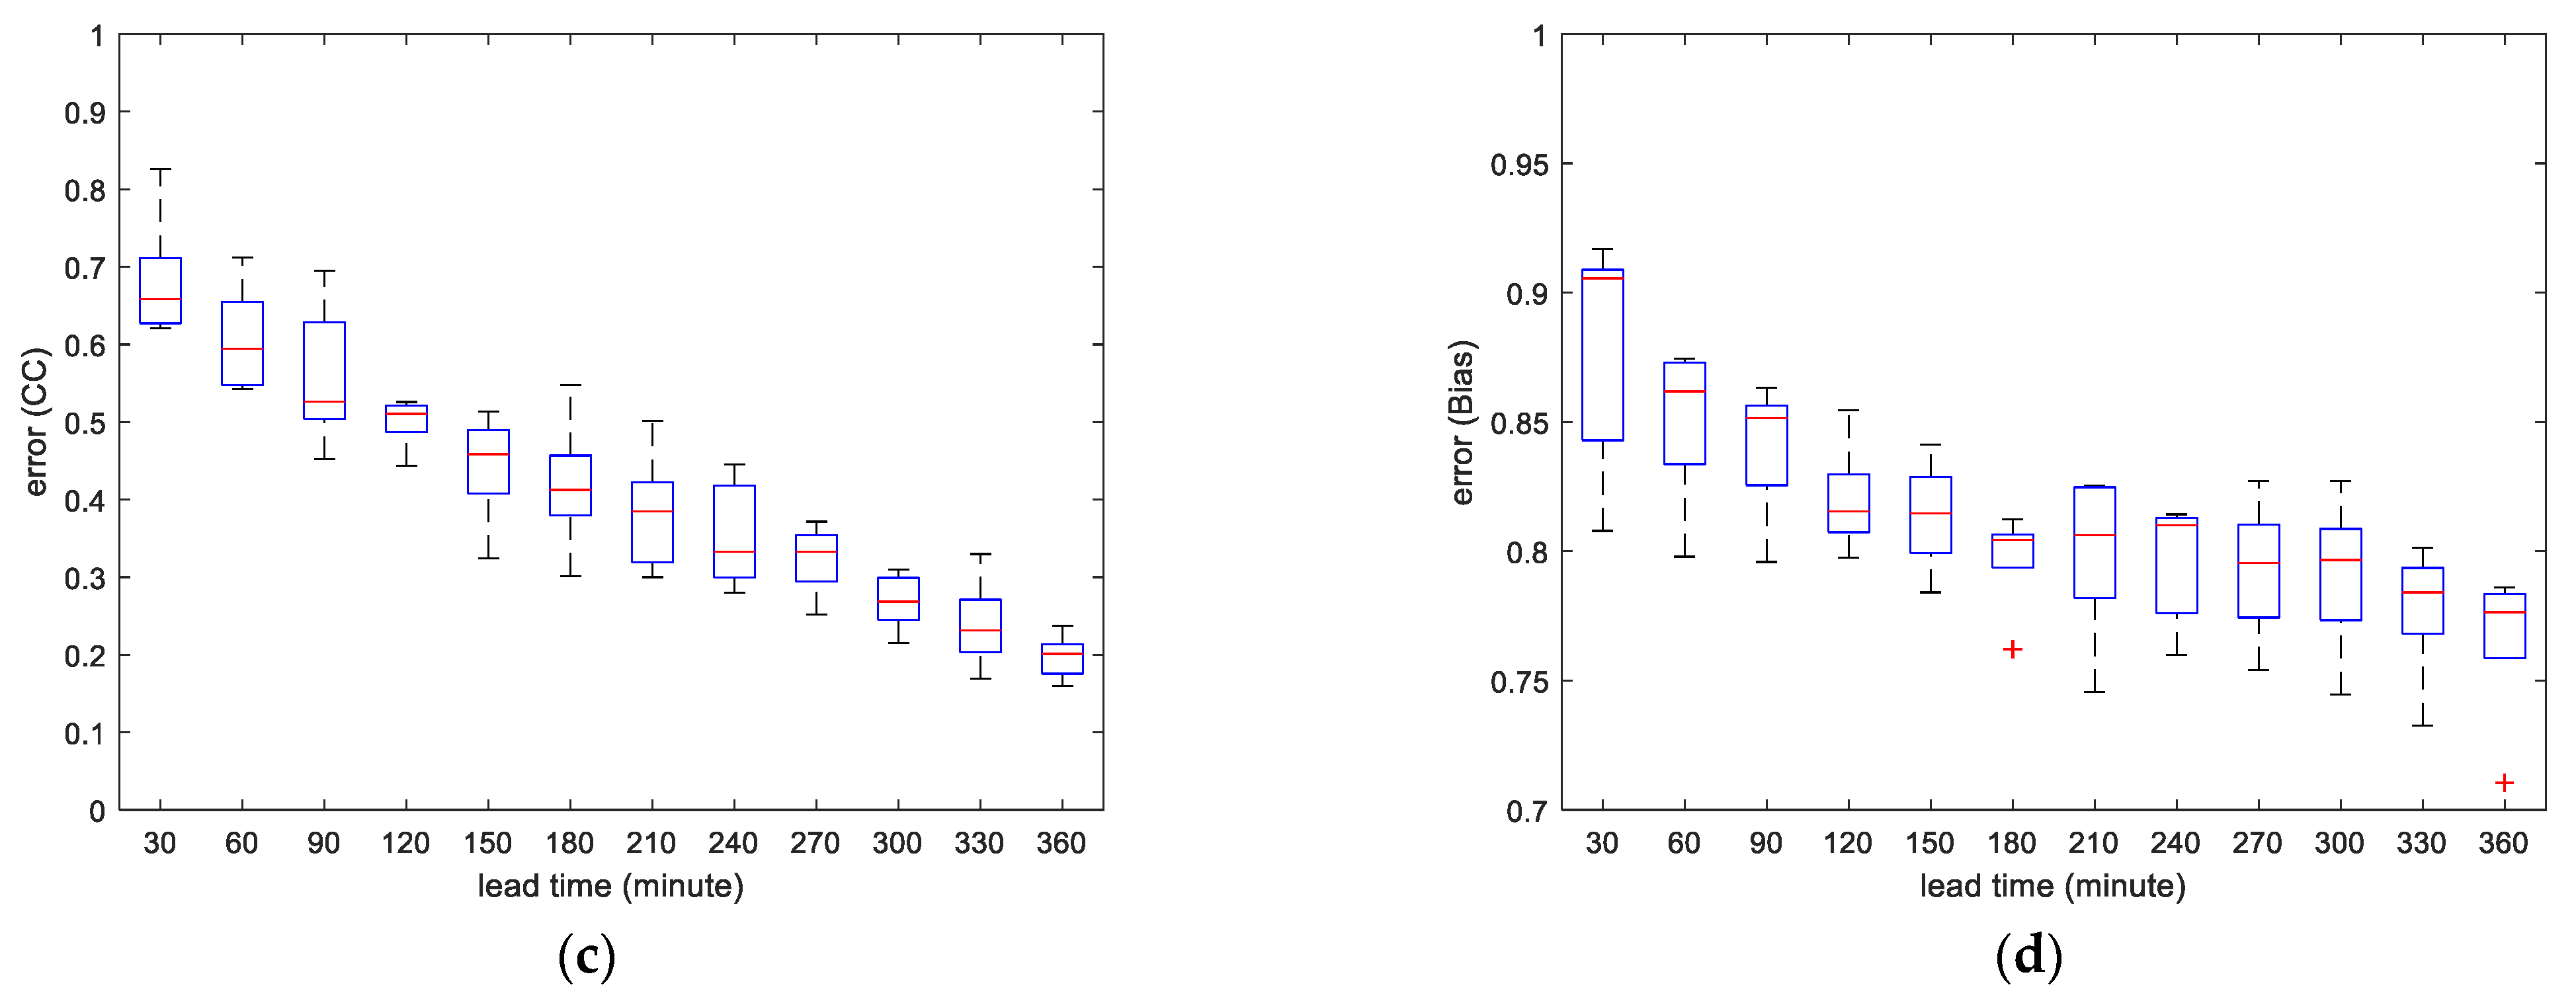
In conclusion, the quality of the GPM IMERG precipitation product at half-hour and 0.1° resolution was evaluated, using daily precipitation observation data from over 2800 rain gauges across Mexico as reference. The STEPS model was applied to explore the potential of the GPM IMERG precipitation product for real-time short-time precipitation nowcasting (forecasting) in this analysis. The analysis was divided into two parts: the first part used rain gauge data as a reference for data quality evaluation, while the second part evaluated the GPM IMERG data. Five events were selected, and the data was applied in the STEPS model to present the nowcasting performance over a relatively short lead time period of 0–6 h. The main conclusions of this study are as follows.
(1) The quality of the GPM IMERG precipitation product at annual and national scales was investigated. The performance of the data was represented by several evaluation metrics, which were RMSE, CC, MAE, BIAS, POD, FAR and CSI. It was found that the GPM IMERG precipitation product showed a slight underestimation over Mexico, with small BIAS evaluations of −7.37% and −6.87% for the annual scale and national scale, respectively, and that fluctuations between over and underestimating at the daily scale were due to precipitation intensity and latitude. The quality of GPM IMERG data improved at the national scale, with the lowest estimated error.
(2) The GPM IMERG product is able to reproduce a mostly consistent distribution of precipitation at the annual scale. The overall results show the GPM precipitation data in high agreement with the data from the rain gauges and provides better precipitation observations in remote areas, with great CC and POD values.
(3) The nowcasting model was applied to explore the potential of GPM precipitation data for precipitation real-time short-term nowcasting and forecasting. The performance of precipitation nowcasting was examined by the RMSE, CC, BIAS and MAE metrics. The errors between the STEPS nowcasts and GPM observed precipitation were estimated and plotted. Results from a comparison of each event showed qualitatively similar trends. The accuracy and quality of precipitation nowcasting generally decreased as the lead time increased, and the nowcasting quality reduced rapidly when the lead time reached 120 min (CC < 0.5). Therefore, the precipitation nowcasting performance by using GPM data is acceptable in Mexico beyond 2 h, after which the errors in the forecasts tend to increase very rapidly.
8. Future Studies and Shortcomings
For future studies, the quality of IMERG should be improved to provide more precise half-hourly precipitation estimates, especially for territories with dry climates, as well as high latitudes and altitudes. Correspondingly, more studies are required to assess the performance of GPM IMERG against other satellite and reanalysis products to find the advantages and limitations of the GPM satellite. Furthermore, other precipitation specific properties such as spatial and temporal heterogeneity, spatial and temporal intermittence, extreme variability and multi-fractal comparisons is necessary to overcome substantial uncertainties rainfall estimations [
57,
58,
59]. Cristiano et al. [
60] also depicted in their review that the rainfall variability may need wider range of conditions and scenario based in observational datasets for urban hydrological basins, which need proper analysis for development of better hydrological response system with higher sensitivity.
For nowcasting, in order to obtain better precipitation nowcasting results, the precipitation data of GPM IMERG product and rain gauge can be blended, such as kriging with external drift and the double-kernel smoothing methods. The characteristics of uncertainty and error of new generation of geosynchronous satellite products launched by the National Aeronautics and Space Administration (NASA) as GPM IMERG and National Oceanic and Atmospheric Administration (NOAA) will open new perspective for nowcasting and data assimilation. Moreover, such products should be further explored to encourage the application and development of products such as IMERG and geostationary lightning mapper sensors, respectively, and their associative algorithms in the recent era. This forecasting technique is extremely important especially for issuing flash flood warnings several hours in advance. Heavy rainfall is especially frequent in the Yangtze River delta area of southern China. In the future, more case studies can be conducted in this area in order to enhance the accuracy of nowcasting and forecasting precipitation models.


 ,
, 


