Review

A Review of Climate Change Impacts on the USA-Mexico Transboundary Santa Cruz River Basin

by
Eylon Shamir
1,*,
Elia M. Tapia-Villaseñor
2,
Mary-Belle Cruz-Ayala
3 and
Sharon B. Megdal
4
1
Hydrologic Research Center, 11440 West Bernardo Court, Suite 375, San Diego, CA 92127, USA
2
Departamento de Geología, Universidad de Sonora, Hermosillo 83000, Mexico
3
Arid Lands Resource Sciences, The University of Arizona, Tucson, AZ 85719, USA
4
Water Resources Research Center, The University of Arizona, Tucson, AZ 85719, USA
*
Author to whom correspondence should be addressed.
Water 2021, 13(10), 1390; https://doi.org/10.3390/w13101390
Submission received: 24 April 2021 / Revised: 9 May 2021 / Accepted: 10 May 2021 / Published: 16 May 2021
(This article belongs to the Special Issue Advances in Transboundary Aquifer Assessment)

Abstract

:
In the parched Upper Santa Cruz River Basin (USCRB), a binational USA–Mexico basin, the water resources depend on rainfall-triggered infrequent flow events in ephemeral channels to recharge its storage-limited aquifers. In-situ data from the basin highlight a year-round warming trend since the 1980s and a concerning decline in average precipitation (streamflow) from 1955–2000 to 2001–2020 by 50% (87.6%) and 17% (63%) during the winter and summer, respectively. Binational sustainable management of the basins water resources requires a careful consideration of prospective climatic changes. In this article we review relevant studies with climate projections for the mid-21st century of four weather systems that affect the region’s precipitation. First, the North American Monsoon (NAM) weather system accounts for ~60% of the region’s annual rainfall. The total NAM precipitation is projected to decline while heavy rainfall events are expected to intensify. Second, the frequency of the pacific cold fronts, the region’s prevalent source of winter precipitation, is projected to decline. Third, the frequency and intensity of future atmospheric rivers, a weather system that brings winter rainfall to the region, are projected to increase. Fourth, the frequency and intensity of large eastern pacific tropical cyclones (TC) are expected to increase. On rare occasions, remnants of TC make their way to the USCRB to cause storms with considerable impact on the region’s water resources. In contrast to the high confidence projections for the warming trend to persist throughout the mid-21st century, the precipitation projections of these four weather systems affecting the region encompass large uncertainties and studies have often reported contradicting trends. An added source of uncertainty is that the USCRB is located at the periphery of the four rain-bearing weather systems and small mesoscale changes in these weather systems may have accentuated impacts on their edges. Despite the high uncertainty in the projections of future precipitation, the early 21st century drying trend and the projected mid-21st century decline in precipitation events serve as a pressing call for planning and actions to attain sustainable water resources management that reliably satisfies future demands.

1. Introduction

Water supply in the Upper Santa Cruz River Basin (USCRB), a binational United States of America (USA)–Mexico basin, relies on a relatively storage-limited aquifer system that is recharged primarily during occasional rain-triggered flow events in ephemeral desert channels. Because of the region’s scarce water resources and the added complexity that requires bridging binational regulatory and policy differences in order to manage the shared aquifer, the region was selected for the USA−Mexico Transboundary Aquifer Assessment Program (TAAP), a program that aims to improve the knowledge base of transboundary aquifers between the United States and Mexico [1,2,3,4]. In order to consider a sustainable water resources plan for the USCRB that addresses binational needs, a comprehensive impact assessment of future climatic changes on the region’s water resources is needed. However, identifying quantitative future climate projections for the region that should be used for hydrological impact assessments is challenging. This is because of the region’s complex and variable climate, which includes two very different rainy seasons (i.e., winter and summer). Winter (November–March) rain is caused by cold fronts from the Pacific Ocean that yield widespread stratiform rainfall events while summer rain (July–September) is triggered by the North American Monsoon (NAM) weather system that brings intense, brief, and local rainfall events.
The Southwest chapter of the USA Fourth National Climate Assessment (hereinafter, Fourth Assessment) [5] provides projections for the mid-21st century that, when being interpreted for the USCRB, are uncertain and point to conflicting trends. For the winter, the Fourth Assessment projects an increase in the frequency of high-pressure weather systems that would trigger longer durations of dry spells, while also projecting an increase in the frequency of rain-bearing atmospheric rivers to hit the Pacific Ocean’s eastern shore. For the summer, although the Fourth Assessment projects an increase in extreme daily precipitation due to a warmer atmosphere that can hold larger amount of water vapor, it also states that the projected total summer precipitation is uncertain. The Fourth Assessment’s future projections, which cover the entire domain of southwest USA, are clearly too general and insufficient as a quantitative projection to be used for hydrologic impact assessment in the USCRB. In addition, because the USCRB is located at the periphery of both the winter and summer rain-bearing weather systems (as we will further discuss), the region is very sensitive to small changes in these prevailing weather systems. The challenge of climate models to represent the weather at the periphery of these rain-bearing weather systems is an added source of uncertainty to the future climate projections of the USCRB.
In order to conduct a quantitative hydrologic impact assessment, time series of projected future precipitation and surface temperature are needed. These time series are commonly available from dynamic simulations of coupled atmospheric-ocean global climate models (GCMs). The GCMs are often simulated in a spatial resolution that is too coarse to represent the salient regional climatic features and therefore the GCMs’ simulations require additional spatial downscaling. The uncertainty in the future rainfall and temperature projections for the USCRB is demonstrated in Figure 1. In this figure, the projected mid-21st century (2040–2069) changes in total winter (DJF) and summer (JJA) precipitation and temperature for the study region are shown. These projections are from 20 statistically downscaled CMIP5 Global Climate Models (GCM) with Representative Concentration Pathway 4.5 and 8.5 (RCP 4.5 and RCP 8.5), which are future greenhouse gas (GHG) concentration trajectories [6]. The simulated projections all agree on the warming trends and the warmer projections are seen for RCP 8.5, which is the higher GHG concentration scenario. Concerning precipitation, the average projected changes for both GHG concentration trajectories suggest a future with a slightly (less than <5%) wetter summer and dryer winter. However, there is a large spread and contradicting trends among the GCM projections, pointing to wetter and/or dryer winters and/or summers. The uncertainty in the projected precipitation is even larger when considering GCMs that are dynamically downscaled using Regional Climate Models (RCM) [7,8]. Furthermore, the projected changes in future precipitation are highly magnified as precipitation transforms to runoff and streamflow that is eventually recharged into the aquifers [7,9,10].
In view of this large uncertainty, our objective in this paper is to review and synthesize the current knowledge on climate change trends in precipitation and temperature that are relevant to the USCRB.

2. Study Area

The Santa Cruz River flows southward from its origin in the San Raphael Valley in south-central Arizona to cross the international border into the state of Sonora, Mexico. Flowing ~60 km into Mexico, the river initially flows south, bends west, and then bends again to the north and crosses the international border back into the USA, about 8 km east of the city of Nogales, Arizona. From its border crossing, the river flows in a general northward direction to its confluence with the Gila River, which is a tributary of the Colorado River that drains much of southern Arizona and parts of western New Mexico. Our region of interest is the Upper Santa Cruz River Basin (USCRB) (Figure 2), which is composed of the drainage area of the river’s headwater in the San Rafael Valley USA (470 km2), the Mexican portion of the basin (1122 km2), and the USA Santa Cruz Active Management Area (1791 km2).
Based on Scott et al., (2012) [12], about 60% of the water in the USCRB is consumed by municipal demand (12.8 and 20.9 MCM/Yr in USA and Mexico, respectively) to primarily supply the twin cities of Nogales, Sonora (~220,000 people) and Nogales, Arizona (~20,000 people), the two largest population centers in the USCRB. The remaining ~40% of the water is consumed by irrigated agriculture (13.2 and 7.4 MCM/Yr in USA and Mexico, respectively). The main source of water supply in the basin comes from relatively shallow alluvial aquifers with limited storage capacity. These aquifers that are also known as the Transboundary Santa Cruz Aquifer system are composed of the Santa Cruz River Aquifer and Nogales Aquifer in Mexico, and the aquifer system of the Santa Cruz Active Management Area and San Rafael Valley in USA. The aquifers are being recharged through infiltration during occasional and highly variable rainfall-driven streamflow events in the ephemeral channels of the Santa Cruz River and its tributaries (e.g., [13,14]). The relatively limited storage of the aquifers and their dependence on streamflow events for recharge makes the region’s water resources availability tightly linked to the local prevailing climate and its variability (e.g., [9,15,16,17]).

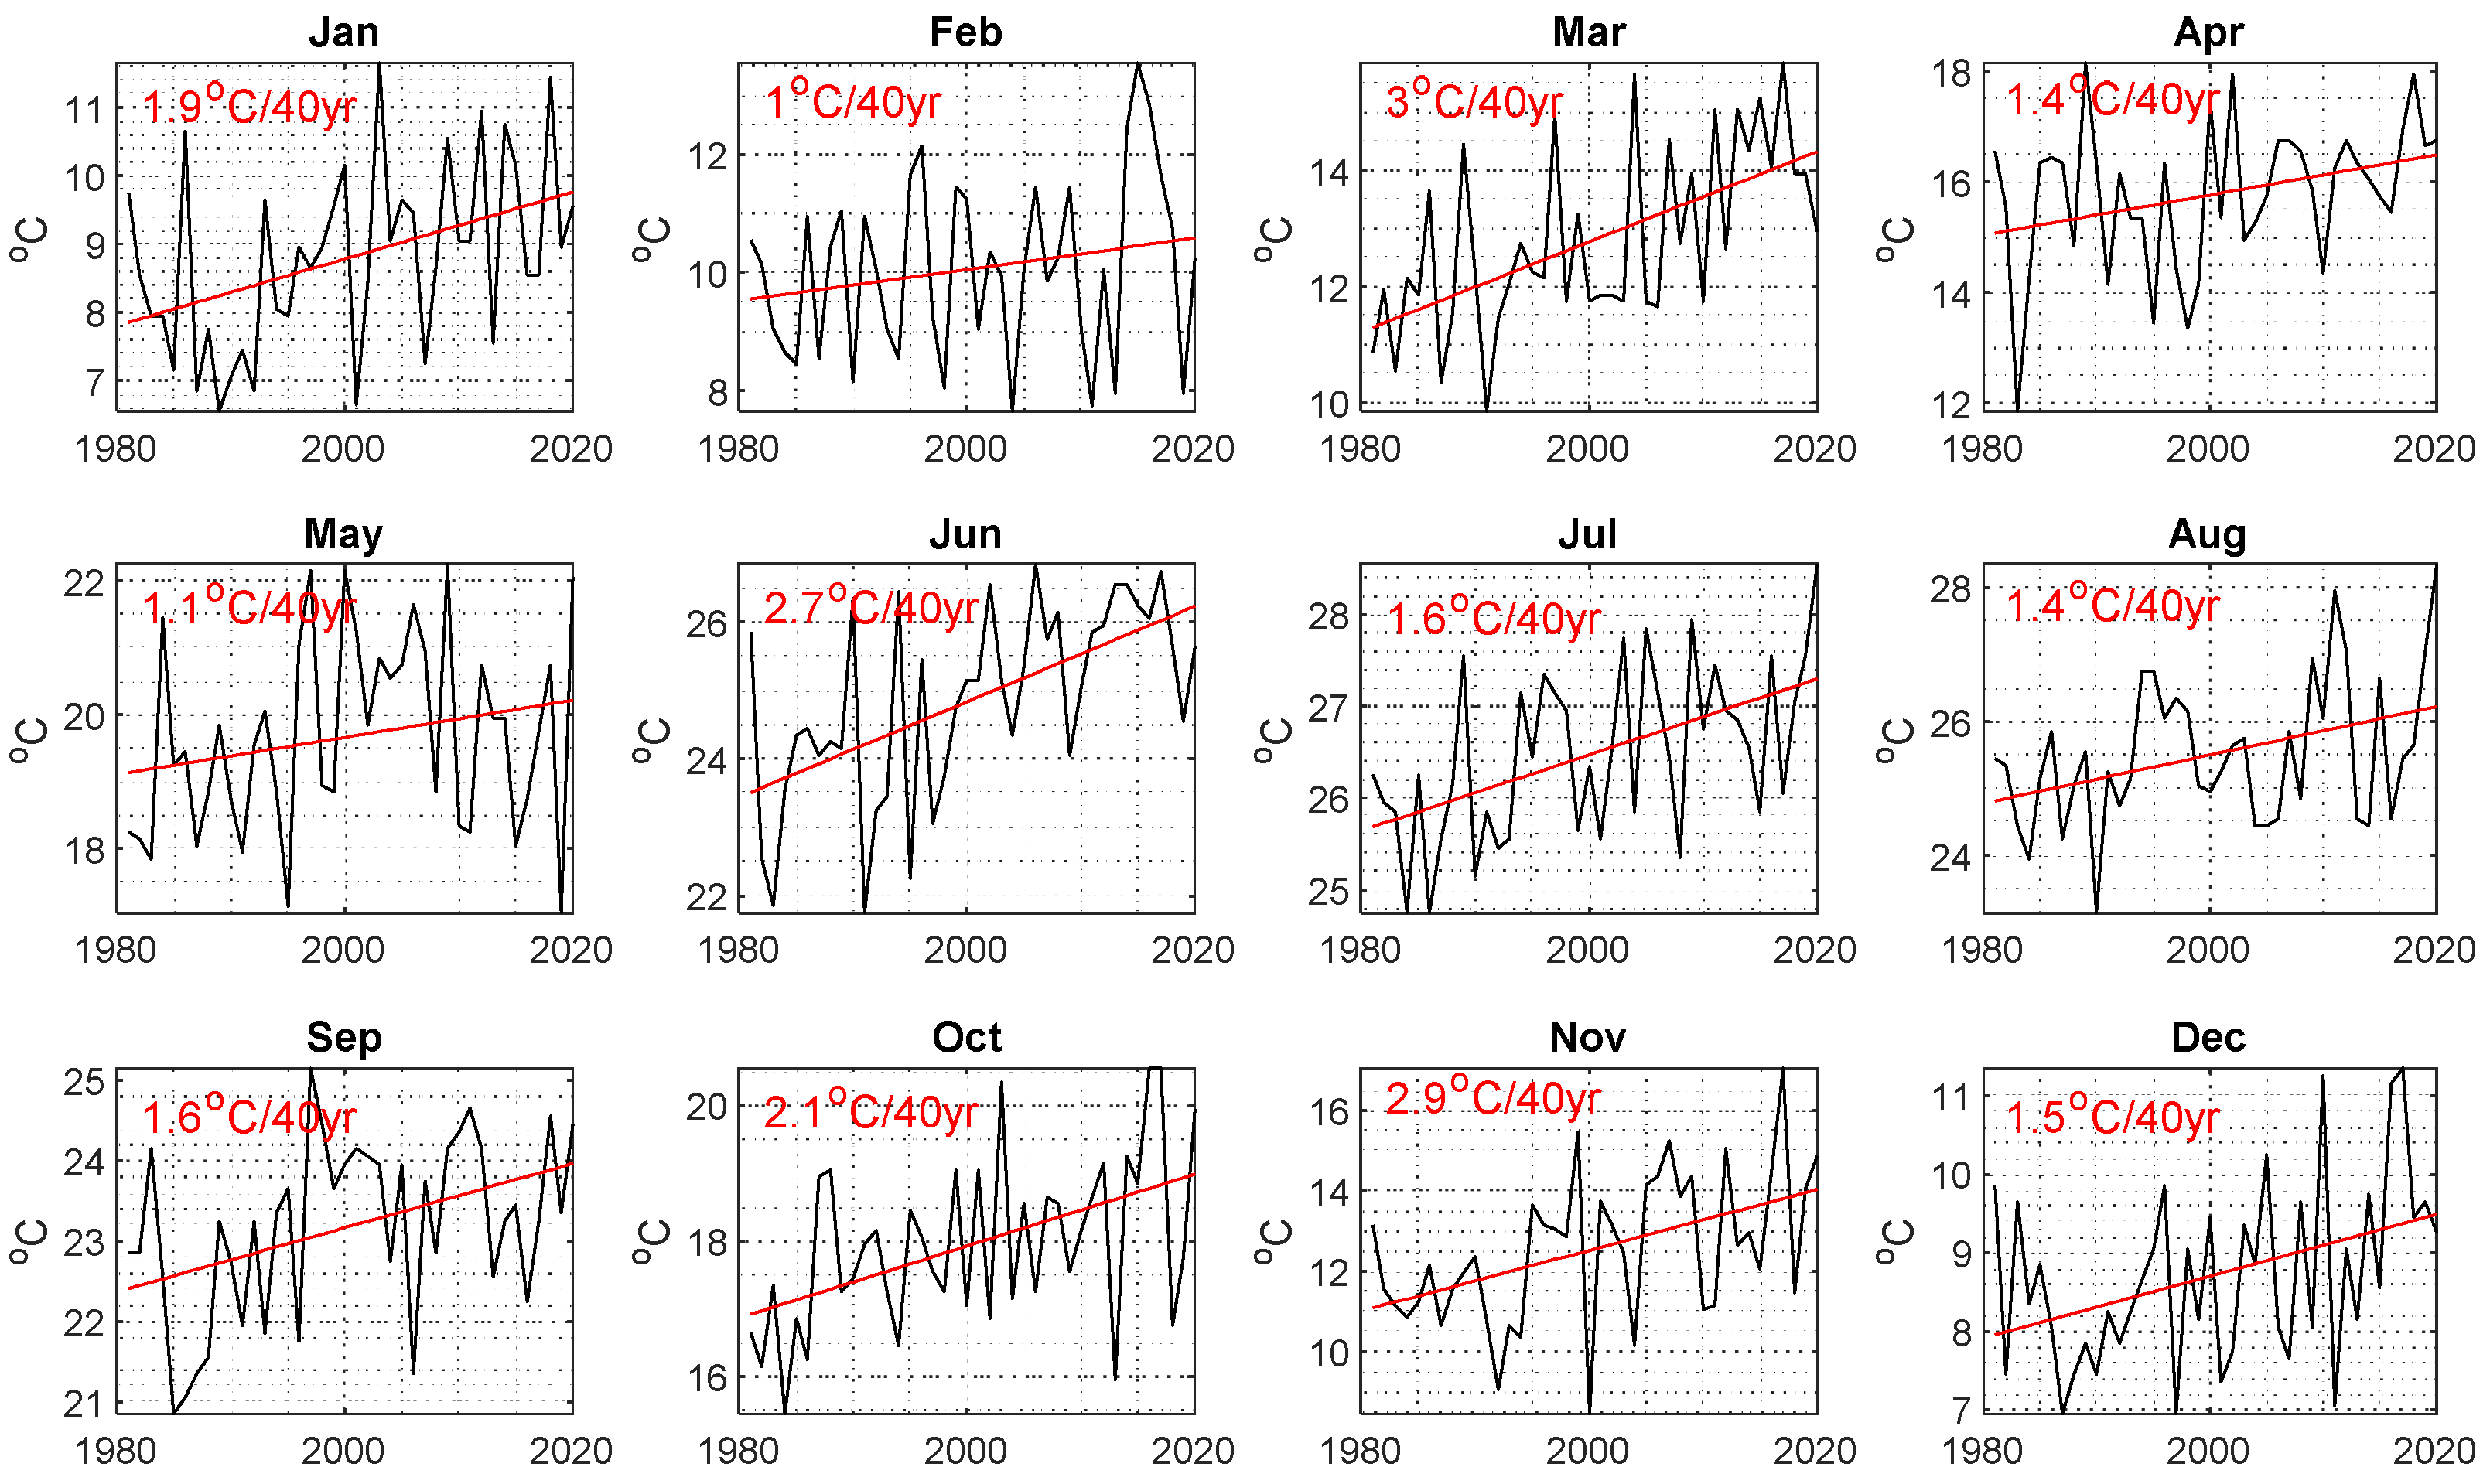
3. Climate and Historical Trends

The climate at the USCRB is classified as hot semi-arid according to Köppen-Geiger, with an extremely hot summer (average daytime temperature is about 40 °C) and a mild winter (average daytime temperature is about 15 °C). The monthly 1980–2020 average temperature in Figure 3, confirms the reported warming trend that the southwest USA has been experiencing (e.g., [5,18]). This warming is seen for all months with linear trends ranging from 1 °C to 3 °C in 40 years. There is a consensus and high confidence among various climate projections that this historical warming trend will persist in the future (e.g., Figure 1; [5,18]). This near-surface warming leads to an increase in vapor pressure deficit, which is likely to increase the potential evapotranspiration (ET). Potential ET (PET) is the ET that would occur if a sufficient water source were available. However, because the USCRB is already a region with a limited moisture supply in which the PET largely exceeds the Actual ET (AET), changes in the AET due to the prospective future increase in PET may be negligible. In a study conducted at the Mexican part of the USCRB, the annual AET was estimated as 90–95% of the annual precipitation [19]. In this region, most of the rainfall either quickly evaporates from the soil back to the atmosphere or runs off as surface flow. With the absence of open water surfaces in the USCRB, such as lakes, reservoirs and perennial sections of the river channels, the only perennial source of moisture available for ET is the sedimentary aquifer underlining the river channels, which is tapped by the roots of the riparian vegetation. Serrat-Capdevila et al., (2011) [20], who studied the riparian aquifer of the San Pedro River, a river east of the USCRB with similar geographical and climatological features, found that although PET is projected to increase, the riparian AET rates during the growing season will remain unchanged because of transpiration regulation by the stomata. They also suggested that the future warming trend would prolong the duration of the growing season, a change that may slightly increase the total annual AET.
The AET response to the warming atmosphere is often complex and dependent on processes such as changes of the region’s land cover (e.g., [21]), physiological adaption of the plants to carbon intake and regulation of transpiration (e.g., [20]), and complex atmospheric mesoscale processes that may even cause for the warming to decrease the AET (e.g., [22]). Another response to the warming that may be important in the USCRB is the anthropogenic change in water demand. In summary, the impact of the existing and projected warming trends on water resources in the USCRB is yet unclear and it is likely secondary in its importance to prospective changes in the precipitation regime.
In Figure 4, the summer and winter precipitation from a gauge near the city of Nogales, Arizona and observed streamflow from a hydrometric station on the Santa Cruz River, less than a 1 km north of the border crossing from Sonora to Arizona, are shown for the 1937–2020 and 1955–2020 water years, respectively. While the average summer precipitation during these years (259 mm) was more than twice as much as the winter (115 mm), the average winter streamflow (8.5 MCM) was only about 7% smaller than the summer streamflow (9.15 MCM). Clearly, the inter-annual averages of the seasonal values by themselves are insufficient descriptors of the statistical characteristics of these highly variable and positively skewed seasonal precipitation and streamflow time series. The differences between the winter and summer, as well as changes in the statistical distributions as the rainfall transforms into streamflow, point to the complex and seasonal-dependent hydrological processes of the region, which must be considered for water resources assessment.
An alarming drying trend of a sizeable decline in the early 21st century is shown in Figure 4 and Table 1. This drying trend is seen when comparing the early 21st century (2001–2020) to the average historical record from the 20th-century of streamflow (1937–2000) and precipitation (1955–2000) for both winter and summer seasons. The average decline from 1955–2000 to 2001–2020 in summer precipitation is 10%, and the reduction in winter precipitation is 33%. These declines are substantially larger at the streamflow record (65% and 78% for summer and winter flow, respectively). The 10-year moving averages that are shown in Figure 4 shows that both for summer and winter the precipitation and streamflow are below the inter-annual averages since about 2000. Although dry seasons were seen in the historical records, the consequence of having both dry winters and summers is shown when looking at the total annual 10-year moving average (blue), which indicates that the 2001–2020 period is the dryer period in the observed record.
We used the agnostic non-parametric Kolmogorov–Smirnov test to examine the null hypothesis, stating that the seasonal precipitation and streamflow during the early 21st- century (2001–2020) and the 20th-century (1955–2000 and 1937–2000 for the precipitation streamflow, respectively) can be considered as statistical samples that were taken from the same seasonal population. Except for summer precipitation, the null hypothesis was rejected at 1% significance level for the summer precipitation and for both winter and summer streamflow. The rejected null hypothesis implies that the statistical distributions of the early 21st century (2001–2020) seasonal hydrometeorological time series are significantly different than the distributions of the historical data that are available from the 20th century. While the reduction in the precipitation is most likely attributed to climatic factors, the intensified reduction of the streamflow during the early 21st century should be further investigated to understand whether this reduction can entirely be attributed to climatic factors, or whether other factors such as changes in land cover, land use, and/or water resources management are responsible for this reduction as well.
The significant change in winter precipitation, as seen in Table 1, are also seen in two other in-situ stations from the region (i.e., USC000026282 in Patagonia (1980–2020) and USC000028865 in Tumacacori (1965–2020)). In these two stations the null hypothesis was rejected in a significant levels of 0.01 and 0.05 for the Patagonia and Tumacacori stations, respectively. A streamflow analysis of the Lochiel hydrologic station (USGS 09480000), a station on the Santa Cruz at the border crossing from Arizona to Sonora, showed a significant decrease in 2001–2020 streamflow when compared to 1950–2000 during both summer and winter seasons. We note that data from the Lochiel hydrologic station were missing during 2014–2019.

4. Summer

Summer rainfall in the USCRB is mainly driven by the North American Monsoon (NAM) climate system that triggers localized convective cells, which often produce thunderstorms and intense short-lived rainfall events. The NAM starts in early June along the western slopes of the Sierra Madre Occidental in southern Mexico and later expands northward to reach the USCRB by early July, lasting until early September. A high-pressure, subtropical ridge forming over northwest Mexico in June causes hot and dry weather, with southwesterly winds in Arizona. As summer progresses, the subtropical ridge normally moves northward until its center of circulation is located over west Texas and New Mexico. This northward movement of the sub-tropical ridge alters the low-level winds in Arizona to a southerly or southeasterly direction. The southerly-southeasterly wind direction combined with the daytime surface low pressure (thermal low) caused by the intense heating of the desert ground, conveys pulses of low-level moist air from the Gulf of California and the eastern Pacific to the region. The Gulf of California moisture surges—which is a major source for the low-level moisture transport into Arizona and Sonora [23]—are triggered by tropical easterly waves and passing tropical cyclones (e.g., [24]). Additional upper-level moisture is transported by easterly winds aloft from the Gulf of Mexico (e.g., [25]). This combination of a seasonally warm land surface and ample atmospheric maritime moisture is conducive to the development of local convective clouds that produce afternoon isolated thunderstorms followed by local and short-lived intense precipitation events. From mid-September the NAM withdraws as the southwestern ridge decays and retreats southward (e.g., [25]).
We present the 1981–2020 climatological spatial extent of the NAM’s precipitation in Figure 5a–c. Inspecting these climatological maps, we outline the core of the NAM to be in western and southeast Mexico as the areas with precipitation exceeding 500 mm (a) and a relatively small inter-annual variability (coefficient of variation (CV) smaller than 0.3 (c)). Our study area (demarked with purple dots) that received an average of about ~200 mm per summer with a CV greater than 0.3 is noticeably situated at the northern edge of the NAM weather system. However, as the contribution of the NAM to the total annual precipitation quickly diminishes northward of the study region (Figure 5b), the NAM precipitation accounts, on average, for ~60% of the annual precipitation at the USCRB. The increase of the precipitation inter-annual variability in the NAM’s northern boundaries is attributed to the variability in the strength and latitudinal position of the subtropical ridge and the low-level moisture surges from the Gulf of California (e.g., [26,27]).
The NAM’s onset and rainfall amount are influenced by Sea Surface Temperature (SST) anomalies that shape the land-sea thermal contrast. During El Niño–Southern Oscillation’s (ENSO) El Niño (La Niña) phase, periods when the SST of the eastern Pacific Ocean near the equator are warmer (colder) than normal, later (earlier) monsoon onset in southwestern USA was observed [29]. Moreover, dry summers in the northern edge of the NAM system tend to follow wet winters that are associated with El Niño phase [29]. However, in the USCRB, ENSO indices were found to have a weak association with summer rainfall [16,30].

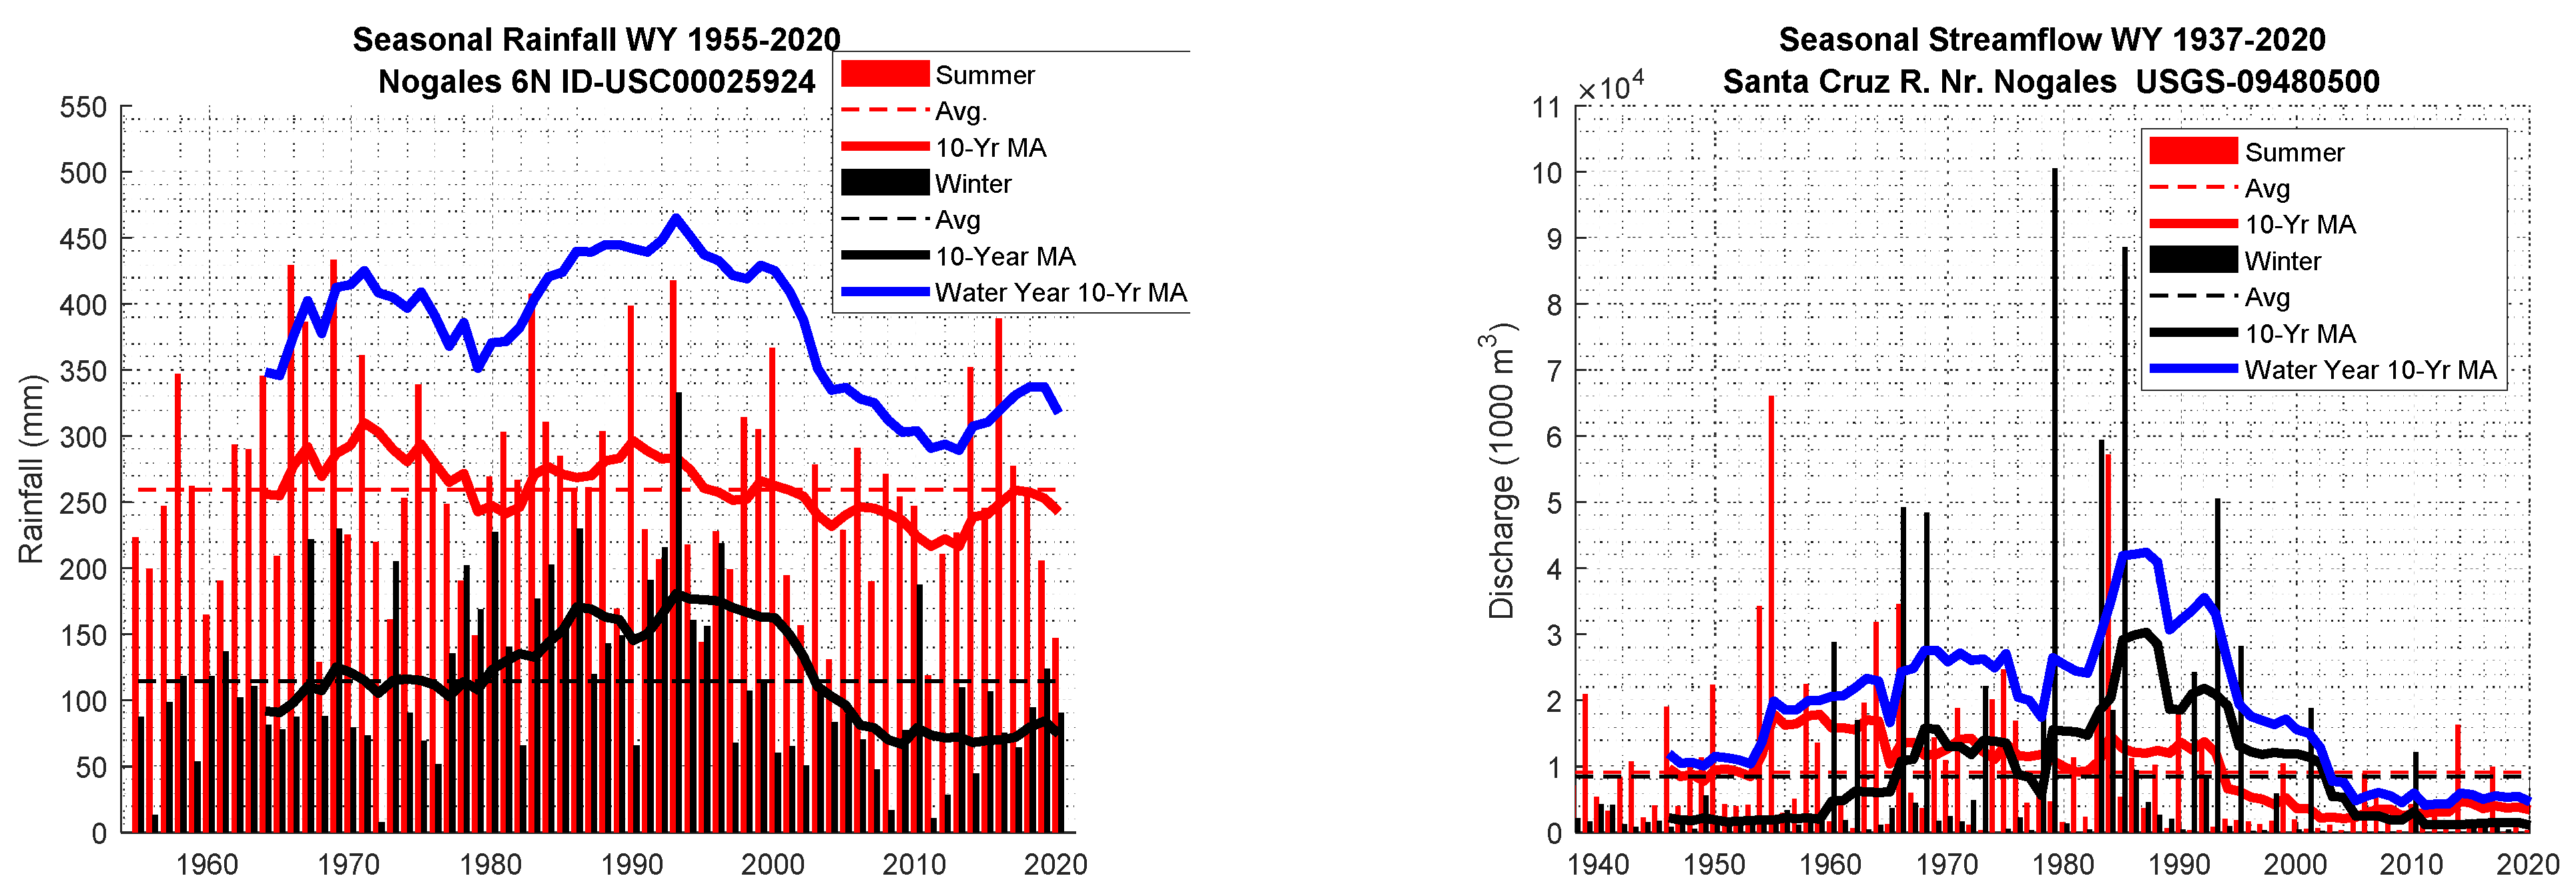
4.1. Historical Changes

As seen in Figure 3 and as reported by previous studies, an apparent positive trend in summertime temperatures have been observed in recent decades in the southwestern USA (e.g., [5,18,31]). This warming can potentially trigger two competing processes that may affect the NAM precipitation regime. On the one hand, higher terrestrial temperatures that increase vapor pressure may enhance convective activity to produce more intense rainfall events. On the other hand, the warming SST may decrease the contrast between the land and sea to reduce the maritime moisture transport and increase atmospheric stability that suppresses convection activity [32]. Although we observed a reduction in the total summer rainfall in the USCRB (Figure 4; Table 1), studies on historical changes of NAM precipitation characteristics asserted, at times, contradicting conclusions. These studies are commonly based on regional analyses of either daily to seasonal precipitation observations (e.g., [27]), or high-resolution atmospheric model simulations (e.g., [31,33,34]). The interpretation of the trends from these studies to Northern Mexico–Southern Arizona (NMSA) and in particular to the USCRB, is challenging because of the region’s high inter-annual variability within the NAM weather system. Moreover, these analyses are often deficient in representing the small temporal and spatial scale of NAM precipitation events, typical to the study region. A recent study by Demaria et al., (2019) [35] analyzed 1961–2017 sub-daily precipitation in the densely gauged Walnut Gulch Experimental Watershed (149 km2) in southeastern Arizona (about 150 km northeast of the Santa Cruz river at its border crossing from Sonora to the USA). Attempting to represent the region’s rainfall small spatiotemporal scale, they reported intensification of NAM precipitation starting at the mid-1970s. Studies conducted in the USCRB indicated several observed changes in the region’s hydrologic regime, such as a reduction in summer streamflow volume, a reduction in the number of summer streamflow occurrences [30,36] and a reduction in the duration of baseflow [17]. These reductions increased the monthly inter-annual variability of streamflow since the 1970s (e.g., [30]). Again, we point to the results shown in Table 1 of ~63% reduction in average summer streamflow from 1937-2000 to 2001–2020. With respect to precipitation, the analysis presented in Table 1 indicates a 17% reduction in total summer precipitation, which agrees with Shamir et al., (2007a) [37], who reported a reduction in the number of summer precipitation events.

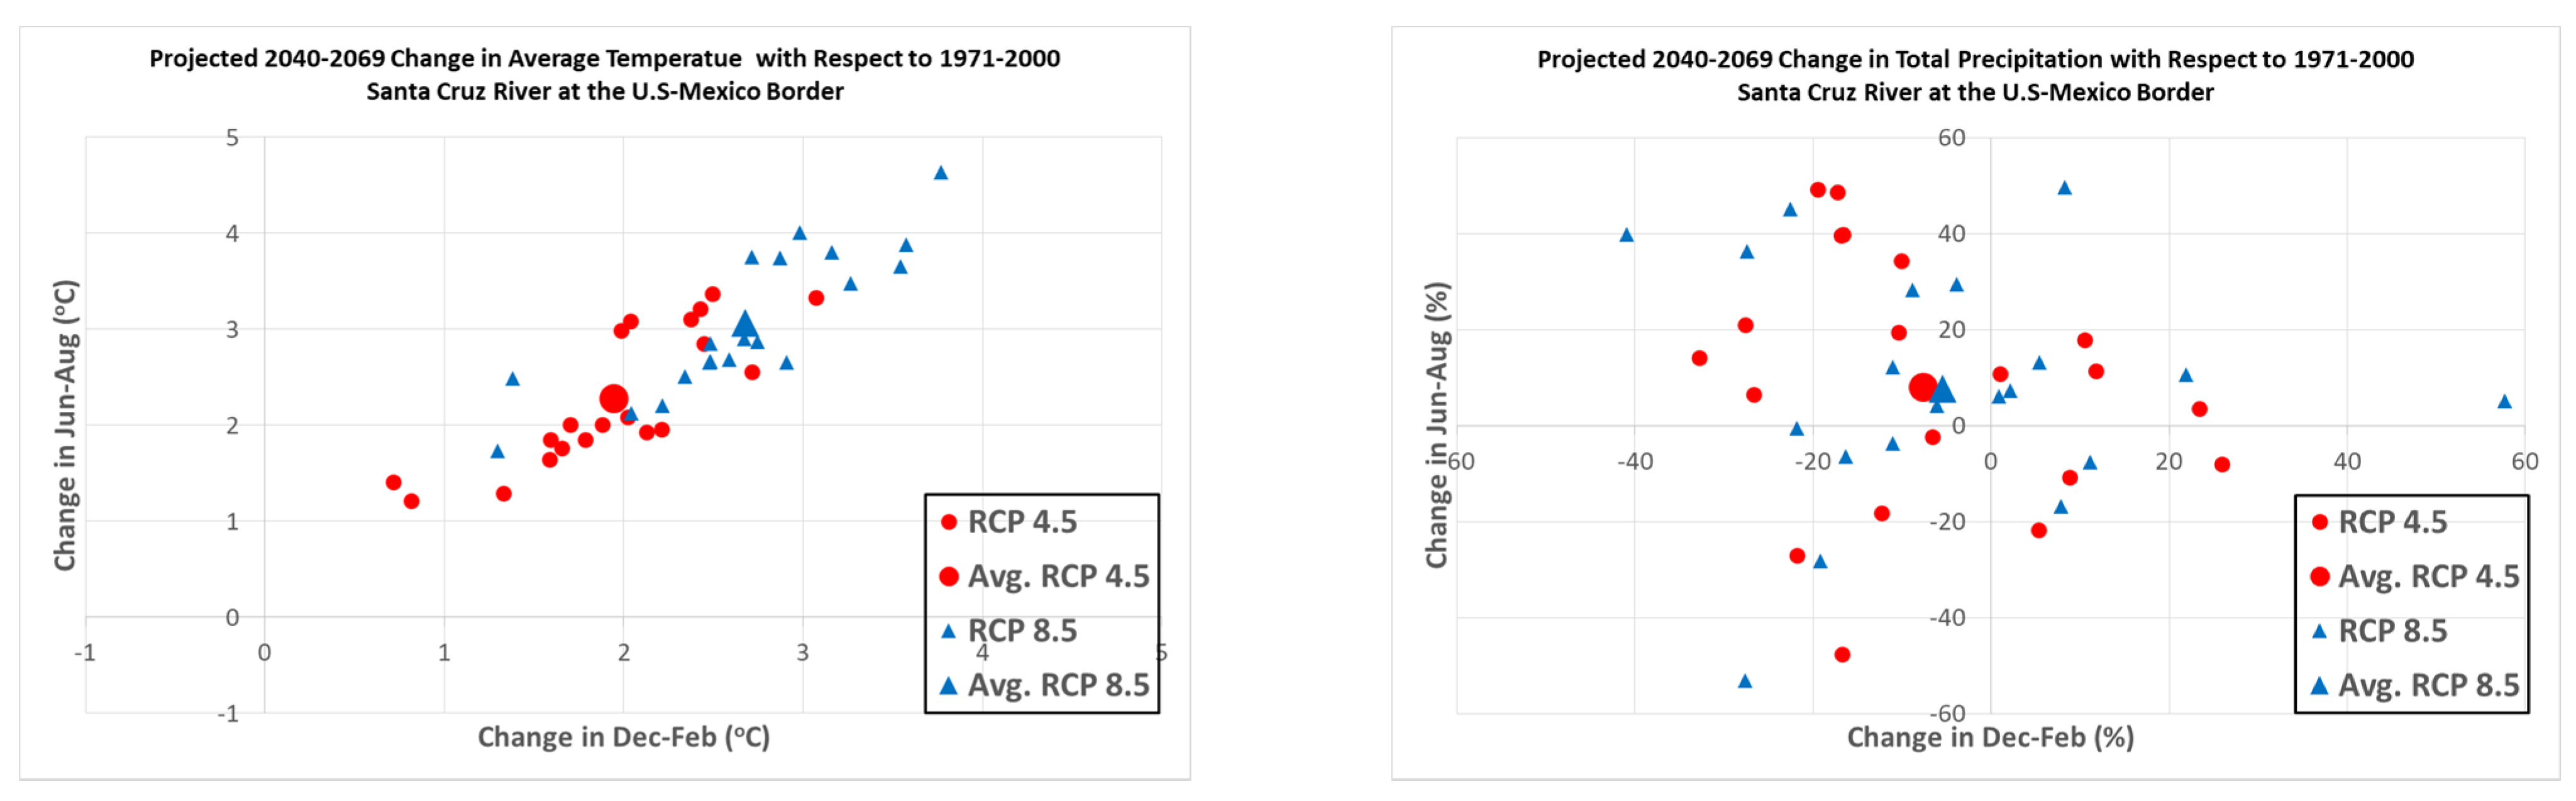
4.2. Future Projections

The future of the NAM weather system is an active study area and recent detailed reviews have been presented by Wang et al. (2021) [26] and Pascale et al. (2019) [32]. In the following, we attempt to review the findings that are relevant to the USCRB. Almost all future climate projections agree that the increase in atmospheric moisture associated with the warming of the atmosphere will increase the intensity of the extreme rainfall events (e.g., [5,26,32]). However, future NAM projections are uncertain mainly because the horizontal resolution of the GCMs is often too coarse to adequately represent the complex topography of the NAM’s region and the regional (mesoscale) atmospheric processes that control the NAM convective storms. Some important processes for assessing the NAM characteristics and their simulations that are challenged by the GCMs include the location and characteristics of the North American subtropical high pressure, the regional wind patterns, the near-surface onshore flow into NMSA, and the northward low-level jets along the Gulf of California (e.g., [23,38,39,40,41]). Furthermore, GCM biased simulations of NAMs’ teleconnections, such as SST in the North Atlantic and the Pacific, often leads to unrealistic easterly low-level moisture flux across the Caribbean region, which affect the simulations of the NAMs precipitation (e.g., [42]).
Several studies that analyzed CMIP5 GCMs, reported an expected future seasonality shift of the NAM with no significant change in the total seasonal precipitation. This seasonal shift is expressed as a delay of the NAM’s onset at the beginning of the summer (June–July) due to increased atmospheric stability and increased precipitation during the late summer (September–October) [43,44,45]. Geil et al., (2013) [41] evaluated the skill of 21 CMIP5 GCMs to simulate the NAM system. They identified several GCMs that failed to simulate NAM characteristics. Among the well-performing GCMs, large differences in their future projections with contradicting trends were identified. They also concluded that all the evaluated GCMs, because of simulated SST biases, simulated excessive precipitation in September and failed to effectively simulate the retreat of the seasonal NAM (as also reported by Colorado Ruiz et al., 2018 [46]). Correcting for the GCM’s SST biases, Pascale et al., (2017) [42] projected a reduction in NAM rainfall over the Southwestern U.S. that is attributed to an increase in the atmospheric stability due a uniform warming of the SST, which dampens the convective activity. Bukovsky et al., (2013 and 2015) [39,40] evaluated four CMIP3 GCMs that were dynamically downscaled by six different RCMs. When RCMs were used to downscale the historical reanalysis data, various atmospheric patterns of the NAM were simulated with high skill, but all simulations showed a dry bias over Arizona. Bukovsky et al. (2013) [39] concluded that except from one GCM, all other GCMs provided reasonably adequate boundary conditions to the RCMs during the summer season. All the RCM simulations suggested an overall trend of decrease NAM precipitation. However, the RCMs were varied in their skill to simulate the NAM’s climatological regional features. Based on the best-performing GCM-RCM, a slight but significant trend for drying summers by mid-21st century across the southwestern USA, with increased frequency and intensity of heavy precipitation events, was projected (Bukovsky et al., 2015) [40].
Castro et al. (2017) [38] implemented a dynamically downscaled high horizontal resolution (3 km) RCM with a convective permitting scheme in order to skillfully simulate the thermodynamic conditions during extreme NAM rain events. These extreme rain events are infrequent late summer events of organized monsoon thunderstorms over relatively large geographic areas, bringing large amounts of rainfall (e.g., [47]). Castro et al., (2017) [38] observed a fewer severe, strong, and organized convective summer events in the southwest USA over the past sixty years. However, this frequency reduction was accompanied by increase in the intensity of these severe events. Their analysis points to a future that is consistent with the trends of the historical record. We note that the organized severe thunderstorms events that are documented in Castro et al., (2017) [38], Maddox et al., (1995) [47] and the 27–31 July 2006 event that brought heavy rainfall to Santa Catalina Mountains and the lower Santa Cruz River [48] had not caused exceptional storm events in the USCRB. As of now, we are unaware of an extreme summer event in the USCRB that was the result of well-organized convective complexes.
In summary, most studies point to a future with warmer temperature during the NAM season. With respect to precipitation, the studies remain uncertain. Some studies reported a seasonal shift but these observed projected shifts may be associated with GCM simulations’ biases in SST. An agreed upon projection points to an overall decrease in total seasonal precipitation but an increase in rainfall intensity during large events. A major caveat of these projections is that the results of most studies are dominated by the core region of the NAM system, while the USCRB, which is at the fringe of the NAM, experiences much higher inter-annual variability than in the core.

5. Winter

The 1981–2020 climatological spatial extent of winter precipitation (Figure 5d–f) displays the importance contribution of the winter season (~50%) to the annual precipitation (d). However, as was shown for the summer precipitation, the USCRB is located at the southeast edge of the winter weather system, which is shown by the region’s large inter-annual variability (f). This large inter-annual variability, which makes the region sensitive to subtle changes, is likely to increase the uncertainty of future winter precipitation projections.
In recent years, winter storms in the region are broadly classified into two categories: Pacific cold fronts and Atmospheric Rivers. The Pacific cold fronts are large-scale low-pressure cold front systems approaching from the Pacific Ocean. These storms bring high winds and cloudy skies that cause persistent rain over large areas. The frequency of these storms is closely associated with SST in the Pacific Ocean. During El Niño years, the southwest experiences wetter winters because the upper-level, subtropical, westerly jet stream over California and Baja California (Mexico) is displaced southward, a displacement that transports onshore moisture to the southwest. During La Niña years, the northward displacement of the subtropical jet stream brings dryer winters in the southwest (e.g., [49,50]).
Specifically, in the USCRB, Shamir (2017) [16] reported that during 1949–2016 most years with September–October ENSO3.4 anomalies greater than 1.5 °C experienced above-normal winter rainfall. On the other hand, during most of the strong September-October La Niña conditions (ENSO3.4 < −1 °C), excluding one year, the winter rainfall was below normal. Winter rainfall had no clear association with neutral years that experienced September-October ENSO3.4 anomalies between −1 and 1.5 °C. It is interesting to note that during strong El Niño years the streamflow at the Upper Santa Cruz River was not always above normal. However, during all strong La Niña years the annual streamflow was below normal. Although the ENSO phases show a firm association with winter precipitation, the wettest years and the largest inter-annual variability were observed during the neutral ENSO years.
Atmospheric Rivers (ARs) are a middle latitude synoptic phenomenon that transports high water vapor concentration from the tropical ocean to the land through a relatively long and narrow corridor. Although ARs are a year-round phenomenon, summer ARs are prevalent in high latitudes and do not affect the precipitation in NMSA. During 1988–2011, an average of seven ARs-related rainfall events per year penetrated inland to hit Arizona causing about half of the largest winter streamflow events [51]. The region in Arizona that is most impacted by ARs is the Salt and Verde watersheds, draining the Central Highlands and Mogollon Rim (e.g., [52]). In the USCRB, about 10% of the largest annual flow events and 38% of the winter flow events are attributed to ARs [51] and about 10–15% of the cool season precipitation during 1998–2008 are caused by ARs [53]. The ARs that reach the USCRB are ARs with a northeastward trajectory that make landfall along the Baja California Peninsula, south of the U.S.–Mexico border (32.5° N Latitude). These are about 8% of the cool season ARs that hit the eastern Pacific coast [54]. Water vapor concentration near the coast in these southern ARs are typically smaller than those ARs farther to the north. The southern ARs often deplete their moisture over the mountains of Southern California and the Baja California Peninsula while about half maintain their AR properties as they penetrate to the lower Colorado River basin [54]. The association of ARs with ENSO is still inconclusive. Some evidence exists for ARs to be more pronounced during El Niño and neutral ENSO conditions [55].

Future Projections

Most studies projecting increased probability of drier winters attributed to the projected widening of the high-pressure subtropical Hadley cell, which in turn will displace the moisture carrier subtropical jet stream northward (e.g., [18,56]). Some studies also point to an expected increase in the frequency of winter’s prolonged dry spells during the 21st century in the Southwest [57]. However, AR related storms in the USCRB are a small fraction of the ARs to hit the Pacific coast, they constitute a substantial portion of the region’s winter precipitation. The projected AR changes stated by the Fourth Assessment [5] is that for higher GHG concentration trajectories (RCP 8.5), AR frequency, and intensity in the mid-21st century is projected to increase. This has been the general agreement since the analysis of selected CMIP3 GCMs by Dettinger et al., (2011) [58]. Increase in atmospheric water vapor holding capacity due to increasing temperature is the main driver for the projection of significant increases in AR frequency and magnitude (e.g., [58,59,60,61]). The magnitude and characteristics of these projected changes are still a vibrant research topic. Warner et al., (2015) [60] who analyzed 10 CMIP5 GCMs using RCP 8.5, projected an increase in winter-average precipitation along the southern offshore transect of 11%–18% when comparing 1970–1999 to 2070–2099. In their analysis, however, the southernmost sampling site was just offshore the Santa Barbara’s coast (35 °N Latitude), about 2 degrees north of the U.S.–Mexico border.
Gershunov et al. (2019) [62] compared 1951–2000 to 2051–2100 of selected five well-performing statistically downscaled CMIP5 GCMs using RCP 8.5 trajectories. In general, an agreement among the GCMs about the ARs hitting the Eastern Pacific Coast, projected positive linear trends in their intensity (~10%), frequency (~20%), and duration (~20%). Taking a spatial perspective, it appears that the projected increase in AR intensity is shown north of 33° latitude while in Baja California Peninsula this increase is less than 5%. The largest increase in AR contribution to annual precipitation is projected for Northern Baja California Peninsula coast (>20%). This increase in potential AR contribution to annual precipitation along the coast is diminished to ~5% in the USCRB region. The large reduction in the impact of the ARs may also be attributed to the relatively large portion of summer contribution to the annual rainfall in the USCRB, which is not the case in the coastal regions.
Since AR s are commonly formed immediately south of the subtropical jet stream, the projected future poleward shift of the jet stream is expected to reduce the AR frequencies in the south and increase them in the north. However, studies of GCM projections point to significant uncertainty with respect to shifts in future ARs. While some support the hypothesis of a northward shift in AR frequencies, which will reduce the frequency of ARs hitting south of the U.S.–Mexico border [63], others do not support this projected shift [59,60,61].

6. Tropical Storms

Northeastern pacific tropical cyclones (TC), which are prevalent during May-November, often transport surges of moisture from the Gulf of California to enhance the NAM activity in the region. About half of the Gulf of California moisture surges to the southwest are associated with TCs in the eastern Pacific. These surges yield more precipitation than non-TC surges [24]. Ritchie et al. (2011) [64] reported that, during 1992–2005, an average of about three TC per year affected the NAM precipitation in NMSA. In the USCRB, about 10% of the summer precipitation was attributed to TC moisture and in 1992 about 30–40% were attributed to TC.
Although relatively infrequent events, during autumn months (September–October) the eastern north Pacific TC can potentially bring torrential rainfalls with substantial contribution to the USCRB water resources. In the hydrometric station (USGS 09480500) on the Santa Cruz River at the Sonora–Arizona border crossing, at least two of the largest instantaneous flow events recorded since 1930 were associated with remnants of TC events (880 m3/s on 9 October 1977 from Hurricane Heather; 484 m3/s on 4 August 1974; and; 459 m3/s on 2 October 1983 from Hurricane Octave). Most TC in the northeastern Pacific travel in a northwest trajectory, rarely cross the 25° N, to weaken and eventually dissipate over the cold Pacific water. Occasionally, later in the season (September–October), a storm may shift to a northward trajectory towards NMSA or southern California. These storms, upon their landfall, weaken to a tropical depression (winds lower than 35 knots). When accompanied with a stable middle-latitude upper-level trough over the eastern Pacific, these tropical depressions can funnel a large quantity of tropical moisture to NMSA region. These storms that bring torrential precipitation to the region have a recurrence interval of five years.
At present, despite clear evidence for warming oceans and atmosphere, there is no clear evidence for detectable changes in northeast Pacific TC activity (e.g., [65]). Future projections of global and regional TC have been an active research topic that suffers from the limited skill of many GCMs in simulating TC climatological features, mainly because of their relatively coarse horizontal resolution [66]. In a recent review of the expected TC changes in the northeastern Pacific Ocean the following was suggested: the frequency of TC events would decrease (median 5%; with range from 90% of the projections of 30–20%), frequency of large TC (4–5 Saffir-Simpson Scale) would increase (~35%, 10–100%), average TC intensity would increase (6%, 3–10%), and TC rainfall rate would increase (20%, 5–30%). Furthermore, there were no clear indications for projected systematic changes in the TC tracks and locations [66].
Although future changes in TC characteristics may have a substantial impact on the water resources in the USCRB, using the projected regional changes to comprehend the rare TC events that affect the USCRB is clearly thus far problematic.

7. Previous Climate Assessment Studies in the Region

In a study over the state of Sonora Mexico, Magaña et al. (2012) [67], who analyzed 20 CMIP3 statistically downscaled scenarios, projected a 10–25% decrease in annual precipitation for 2040−2099. However, although most models showed a decreasing trend, the magnitude of the average projected precipitation change is smaller than the variability among the GCMs. Several other climate assessments that were conducted in the USCRB and NMSA are based on projected CMIP3 and CMIP5 downscaled simulations of selected GCMs that were found to adequately simulate climatic indicators of southwest USA [68]. Dominguez et al., (2010) [68] graded CMIP3 GCMs with respect to their performance in simulating monthly temperature and precipitation climatology over southwest USA (i.e., the states of Arizona, New Mexico, Utah, and Colorado). In addition, they assessed the GCMs skill to simulate ENSO teleconnection with winter precipitation and the location of the subtropical jet stream. Among the CMIP3 GCMs, they identified the Max Planck Institute ECHAM5 and the UK Met Office HadCM3 as the best performing GCMs. These GCMs projected amplification of the La Niña conditions that is accompanied with drying trends in winter precipitation.
Following the recommendations of Dominguez et al. (2010) [68], Ajami et al., (2012) [69], in a study at the San Pedro River, reported an average change in annual precipitation of 14–7% projected for 2050–2099. This projected change in precipitation transforms to a decline in the aquifer recharge rate of 15–27%, with higher sensitivity to changes in winter precipitation. Another study from the San Pedro River Basin, which used a multi-model approach of 17 statistically downscaled CMIP3 GCMs with four different emission scenarios, projected 17–30% changes in average annual precipitation [70]. Evaluating the impact of the changes in precipitation on the recharge of the San Pedro aquifer, they estimated a substantial decline in the recharge rate through 2100. Nevertheless, this projected decline in the groundwater recharge includes a large variation among the GCMs that ranged from 100% to 30%. Meixner et al. in their 2016 synthesis of previous studies for the San Pedro River basin, which is mainly based on the two mentioned above studies, projected an average decline in groundwater recharge of 10–20%.
Shamir et al. (2015) [9] used dynamically downscaled 35 km simulations of the two CMIP3 GCMs recommended by Dominguez et al., (2010) [68] using an A2 emission scenario (model configuration is described in Castro et al., 2012 [23]) to assess the future climate impact on water resources in the shallow aquifers on the American side of the Santa Cruz River. Their analysis reveals that a dominant climatic change element with direct impact on water resources is the occurrence rate of three seasonal wetness categories (i.e., wet, medium, or dry) in both the winter and summer rainy seasons. They reported for the mid-21st century (2041–2070) a clear trend for drying summers that is expressed by an expected increase (decrease) in the occurrence frequency of dry (wet) summers. For the winter, they reported an expected increase in the frequency of both dry and wet winter seasons, implying a lower chance of experiencing a moderate winter. They provided a probability assessment given different management schemes of the aquifer. They concluded that the projected changes in precipitation would introduce challenges for the City of Nogales, Arizona to meet water demand, a long-term increase in cumulative water deficit, and a general decrease in the aquifer recharge rate to the aquifer.
The impacts of the CMIP5 version of the GCMs that were recommended by Dominguez et al., (2010) [68] on the USCRB water resources were assessed by Shamir and Halper, (2019) [7] and Tapia et al., (2020) [15]. These studies used dynamically downscaled simulations at 25 km of RCP 8.5 emission scenario [38]. Projected CMIP5 precipitation changes from the two selected models provided contradicting results. The downscaled simulations of the Hadley GCM expected a wetter mid-21st century (2020–2059) in the USCRB, expressed by the frequency of dry and wet winters to increase and the frequency of dry summer to decrease and wet summer to increase. On the other hand, the MPI dynamically-downscaled simulations points to a much dryer mid-21st century with projections for an increase in the frequency of dry winters and summers, and a decrease in frequency of wet winters and summers. The projected changes in the seasonal frequency of the wetness categories were compared with statistically downscaled simulations of the same models to find similar but substantially weaker trends. In their study, Shamir and Halper [7] provided a probabilistic perspective to represent the variability and known sources of uncertainties. Herein we use the distributions’ median to report the range of the projected changes. The dry (wet) projections of the MPI (HAD) expect a −15% (7.5%) annual change in precipitation that is transformed to a −22% decline (13% increase) in streamflow and a 15% increase (7.3% decrease) in water supply for the City of Nogales, Arizona expected to be substituted from a different source.
Tapia et al. (2020) [16] used the same precipitation projections to evaluate the impact on water resources to the effluent dominant region of the USCRB. In this region of the USCRB, the impact of the projected median change on the region’s water deficit would increase (decrease) for the MPI (HAD) by about 4.5 MCM/year, which is about 22% of the annual groundwater withdrawal in this region.

8. Summary

In this review, we summarize the current state-of-knowledge of future climatic changes in the binational USCRB that are thought to be relevant for the region’s water resources. In the USCRB water resources replenishment is primarily depends on rainfall-triggered streamflow in ephemeral channels that recharge the alluvial aquifers. This aquifer recharge in the region is contingent on highly variable and different winter and summer rainy seasons. Since the USCRB is located at the geographical edge of these weather systems, small future changes in their cores may prompt unforeseen consequences in the USCRB. Observations of local in-situ data from the basin for 1980–2020 reveals a warming trend for all months, since the 1980s. While the warming trend is in agreement with other previous reports (e.g., [5,18]), we also observed an alarming declining trend in summer and winter precipitation in the USCRB that is likely not explained by the observed inter-annual variability. The declines in average precipitation from 1955–2000 to 2001–2020 of 50% in the winter and 17% in the summer were accentuated by reductions in streamflow on the Santa Cruz River of 87.6% and 63%, respectively.
Our review of projected climate in the region points to an overall agreement that the historical warming trend will highly-likely to continue in the future. Nevertheless, the impact of this future warming on the region’s water resources is yet unclear. To synthesize the future projected precipitation for the region, we reviewed climate studies that addressed four rain-bearing weather systems that influence the USCRB (i.e., summer North American Monsoon, winter cold fronts, atmospheric rivers, and tropical cyclones). Although highly uncertain, most studies reported that for the mid-21st century the total summer NAM precipitation is expected to decline with the expectation for intensification of the large events. For the winter, the Pacific cold fronts’ frequency and intensity are projected to decline due to SST warming that will displace the subtropical jet poleward to resemble a La Niña like conditions. On the other hand, the frequency and the intensity of future ARs that will likely to hit the USCRB in the winter are projected to increase. Although rare, TC remnants can cause very significant rain events for replenishing the region’s water resources. While the frequency of TC in the eastern Pacific are expected to decrease, the rain rate and the frequency of large TC are expected to increase by mid-21st century.
We note that the general projection statements listed above are highly uncertain and many studies of projected future precipitation reported ranges of projected changes that often have contradicting trends.
Although large uncertainty is associated with the projected future precipitation, many of the possible outcomes carry large risk, as the majority of the projections suggest a dryer future. Because non-linear processes dominate the hydrologic response in desert environment, the prospective drying will likely to intensify when rainfall is transformed to runoff and eventually recharged into the aquifers. Thus, even small changes in the precipitation regime can introduce severe ramifications to the region’s water resources. In addition to the projected climatic and hydrologic uncertainties an added complication for sustainable water resources management is the inter-dependency of the water systems on both sides of the international border, in which an action on one side of the border influences water availability on the other side. Clearly, sustainable water management in a border setting requires collaboration. A first step for a collaborative transboundary effort is an advancement of the knowledge base, which is the aim of this manuscript. As a final point, given the projected uncertain future and the worrisome observed historical trends, we stress the urgency and the severe risk of water shortages that the region may potentially undergo. This urgent risk for water shortages calls for proactive and collaborative binational planning to achieve a sustainable transboundary aquifer system.
Such a binational effort can be supported by the International Boundary and Water Commission (IBWC), a USA–Mexico joint commission that is responsible for applying the boundary and water treaties between the two countries and settling differences that may arise in their application. Although in its mission statement, the IBWC does not explicitly mention sustainable management of water resources as an objective, it issued in the past several binding interpretations (hereinafter referred to as Minutes) to the 1944 Water Treaty regarding the utilization of waters of the Colorado River, Tijuana River, and Rio Grande that addressed binational collaborative management schemes. Some examples of Minutes that are relevant to the USCRB are the groundwater pumping limits within eight kilometers of the Arizona–Sonora border near San Luis (Minute 242) and the conveyance, treatment, and disposal of the Ambos Nogales’ sewage (Minutes 206, 227, 276, and 294). Minute 323, signed in 2017, is the first IBWC Minute that addresses binational adaptation strategies for allocating water resources during water scarcity periods. The Minute specifies cooperative measures and a contingency plan during years of water scarcity in the Colorado River basin. These Minutes can provide a framework for collaborative water resources management in the USCRB to ensure sustainable conditions and provide mitigation measures that address the projected climatic changes.

Author Contributions

Conceptualization, E.S., E.M.T.-V., M.-B.C.-A., and S.B.M.; supervision, S.B.M. and E.M.T.-V.; methodology E.S., E.M.T.-V., and M.-B.C.-A.; validation, E.S.; formal analysis, E.S.; investigation, E.S. and M-.B.C-.A.; resources, E.S. and M-.B.C-.A.; data curation, E.S. and M.-B.C.-A.; writing—original draft preparation, E.S.; writing—review and editing, E.M.T.-V., M.-B.C.-A., and S.B.M.; visualization, E.S. and E.M.T.-V.; project administration, S.B.M.; funding acquisition, S.B.M. All authors have read and agreed to the published version of the manuscript.

Funding

This work was funded by the U.S. Geological Survey (funding authorized by P.L. 109–448) Award Number G17AC00439 for the Transboundary Aquifer Assessment Program.

Institutional Review Board Statement

Not applicable.

Informed Consent Statement

Not applicable.

Data Availability Statement

Not applicable.

Acknowledgments

The authors would like to acknowledge the Transboundary Aquifer Assessment Program (TAAP) and the administrative support of the Water Resources Research Center, University of Arizona.

Conflicts of Interest

The authors declare no conflict of interest. The funders had no role in the design of the study; in the collection, analyses, or interpretation of data; in the writing of the manuscript, or in the decision to publish the results.

Abbreviations

The following abbreviations are used in this article:
AETActual Evapotranspiration
ARAtmospheric River
CMIP3 or 5Coupled Model Intercomparison Project (CMIP) phase 3 or 5
ENSOEl Niño and the Southern Oscillation
ETEvapotranspiration
GCMGlobal Climate Model
GHGGreen House Gas
IBWCInternational Boundary and Water Commission
MCMMillion Cubic Meter
NAMNorth American Monsoon
NMSANorthern Mexico and Southern Arizona
PETPotential Evapotranspiration
RCPRepresentative Concentration Pathway
RCMRegional Climate Model
SSTSea Surface Temperature
TCTropical Cyclone
USCRBUpper Santa Cruz River Basin

References

  1. IBWC. Joint Report of the Principal Engineers Regarding Joint Cooperative Process. United States-Mexico for the Transboundary Aquifer Assessment Program. 2009. Available online: Wrrc.arizona.edu/sites/wrrc.arizona.edu/files/images/Joint-Report-TAAP-8-19-09.pdf (accessed on 13 May 2021).
  2. Megdal, S.B.; Scott, C.A. The Importance of Institutional Asymmetries to the Development of Binational Aquifer Assessment Programs: The Arizona-Sonora Experience. Water 2011, 3, 949–963. [Google Scholar] [CrossRef] [Green Version]
  3. Callegary, J.; Megdal, S.; Villaseñor, E.T.; Petersen-Perlman, J.; Sosa, I.M.; Monreal, R.; Gray, F.; Noriega, F.G. Findings and lessons learned from the assessment of the Mexico-United States transboundary San Pedro and Santa Cruz aquifers: The utility of social science in applied hydrologic research. J. Hydrol. Reg. Stud. 2018, 20, 60–73. [Google Scholar] [CrossRef]
  4. Tapia-Villaseñor, E.; Megdal, S. The U.S.-Mexico Transboundary Aquifer Assessment Program as a Model for Transborder Groundwater Collaboration. Water 2021, 13, 530. [Google Scholar] [CrossRef]
  5. Garfin, G.M.; Gonzalez, P.; Breshears, D.; Brooks, K.; Brown, H.E.; Elias, E.; Gunasekara, A.; Huntly, N.; Maldonado, J.K.; Mantua, N.J.; et al. Chapter 25: Southwest. Impacts, Risks, and Adaptation in the United States. In The Fourth National Climate Assessment; U.S. Global Change Research Program: Washington, DC, USA, 2018; Volume 2, pp. 1101–1184. [Google Scholar]
  6. Abatzoglou, J.T.; Brown, T.J. A comparison of statistical downscaling methods suited for wildfire applications. Int. J. Clim. 2011, 32, 772–780. [Google Scholar] [CrossRef]
  7. Shamir, E.; Halper, E. The Role of Downscaling Methodology in Projected Climate Change Impacts on Water Resources in Arid Environments; U.S. Department of Interior, Bureau of Reclamation Research and Development Office: Denver, CO, USA, 2019.
  8. Shamir, E.; Halper, E.; Modrick, T.; Georgakakos, K.P.; Chang, H.-I.; Lahmers, T.M.; Castro, C. Statistical and dynamical downscaling impact on projected hydrologic assessment in arid environment: A case study from Bill Williams River basin and Alamo Lake, Arizona. J. Hydrol. X 2019, 2, 2589–9155. [Google Scholar] [CrossRef]
  9. Shamir, E.; Megdal, S.B.; Carrillo, C.; Castro, C.L.; Chang, H.-I.; Chief, K.; Corkhill, F.E.; Eden, S.; Georgakakos, K.P.; Nelson, K.M.; et al. Climate change and water resources management in the Upper Santa Cruz River, Arizona. J. Hydrol. 2015, 521, 18–33. [Google Scholar] [CrossRef] [Green Version]
  10. Meixner, T.; Manning, A.H.; Stonestrom, D.A.; Allen, D.M.; Ajami, H.; Blasch, K.W.; Brookfield, A.E.; Castro, C.L.; Clark, J.F.; Gochis, D.J.; et al. Implications of projected climate change for groundwater recharge in the western United States. J. Hydrol. 2016, 534, 124–138. [Google Scholar] [CrossRef] [Green Version]
  11. Abatzoglou, J.T. Development of gridded surface meteorological data for ecological applications and modelling. Int. J. Clim. 2013, 33, 121–131. [Google Scholar] [CrossRef]
  12. Scott, C.; Megdal, S.; Oroz, L.; Callegary, J.; Vandervoet, P. Effects of climate change and population growth on the transboundary Santa Cruz aquifer. Clim. Res. 2012, 51, 159–170. [Google Scholar] [CrossRef]
  13. CONAGUA. Actualización de la Disponibilidad Media Anual de Agua en el Acuífero Río Santa Cruz (2615) Estado de Sonora. Diario Oficial de la Federación (DOF). 2020. Available online: https://sigagis.conagua.gob.mx/gas1/sections/Edos/sonora/sonora.html (accessed on 17 May 2021).
  14. Arizona Department of Water Resources. Groundwater Flow Model of the Santa Cruz Active Management Area Along the Santa Cruz River and Nogales Wash from the International Border to Tubac; Arizona Department of Water Resources: Phoenix, AZ, USA, 2020.
  15. Tapia-Villaseñor, E.M.; Shamir, E.; Megdal, S.B.; Petersen-Perlman, J.D. Impacts of Variable Climate and Effluent Flows on the Transboundary Santa Cruz Aquifer. JAWRA J. Am. Water Resour. Assoc. 2020, 56, 409–430. [Google Scholar] [CrossRef]
  16. Shamir, E. The value and skill of seasonal forecasts for water resources management in the Upper Santa Cruz River basin, southern Arizona. J. Arid. Environ. 2017, 137, 35–45. [Google Scholar] [CrossRef]
  17. Nelson, K. Risk Assessment of Pumping Impacts on Simulated Groundwater Flow in the Santa Cruz Active Management Area; ADWR Modeling Report No. 21; Arizona Department of Water Resources: Phoenix, AZ, USA, 2010.
  18. Garfin, G.; Jardine, A.; Merideth, R.; Black, M.; LeRoy, S. Assessment of Climate Change in the Southwest United States: A Report Prepared for the National Climate Assessment; A report by the Southwest Climate Alliance; Island Press: Washington, DC, USA, 2013. [Google Scholar]
  19. Minjárez Sosa, I.; Monreal Saavedra, R.; Grijalva Noriega, F.J.; Ochoa Granillo, J.A.; Tapia Villaseñor, E.M.; Rangel Medina, M.; Montijo González, A. Actividades Hidrogeológicas en el Acuífero Río Santa Cruz, Estado de Sonora, Primera Etapa; Conagua: Hermosillo, Sonora, 2011. [Google Scholar]
  20. Serrat-Capdevila, A.; Scott, R.L.; Shuttleworth, W.J.; Valdés, J.B. Estimating evapotranspiration under warmer climates: Insights from a semi-arid riparian system. J. Hydrol. 2011, 399, 1–11. [Google Scholar] [CrossRef]
  21. Villarreal, M.L.; Norman, L.M.; Webb, R.H.; Turner, R.M. Historical and Contemporary Geographic Data Reveal Complex Spatial and Temporal Responses of Vegetation to Climate and Land Stewardship. Land 2013, 2, 194–224. [Google Scholar] [CrossRef]
  22. Shilo, E.; Ziv, B.; Shamir, E.; Rimmer, A. Evaporation from Lake Kinneret, Israel, during hot summer days. J. Hydrol. 2015, 528, 264–275. [Google Scholar] [CrossRef]
  23. Castro, C.L.; Chang, H.-I.; Dominguez, F.; Carrillo, C.; E Schemm, J.; Juang, H.-M.H. Can a Regional Climate Model Improve the Ability to Forecast the North American Monsoon? J. Clim. 2012, 25, 8212–8237. [Google Scholar] [CrossRef] [Green Version]
  24. Higgins, R.W.; Shi, W. Relationships between Gulf of California Moisture Surges and Tropical Cyclones in the Eastern Pacific Basin. J. Clim. 2005, 18, 4601–4620. [Google Scholar] [CrossRef]
  25. Adam, D.K.; Comrie, A.C. The North American Monsoon. Bull. Am. Meteorol. Soc. 1997, 78, 2197–2214. [Google Scholar] [CrossRef] [Green Version]
  26. Wang, B.; Biasutti, M.; Byrne, M.P.; Castro, C.; Chang, C.; Cook, K.; Fu, R.; Grimm, A.M.; Ha, K.; Hendon, H. Climate Change Assessment. Bull. Am. Meteorol. Soc. 2021, 102, E1–E19. [Google Scholar] [CrossRef]
  27. Arriaga-Ramírez, S.; Cavazos, T. Regional trends of daily precipitation indices in northwest Mexico and southwest United States. J. Geophys. Res. Space Phys. 2010, 115, 14111. [Google Scholar] [CrossRef]
  28. Abatzoglou, J.T.; Dobrowski, S.Z.; Parks, S.A.; Hegewisch, K.C. TerraClimate, a high-resolution global dataset of monthly climate and climatic water balance from 1958–2015. Sci. Data 2018, 5, 170191. [Google Scholar] [CrossRef] [Green Version]
  29. Castro, C.L.; McKee, T.B.; Pielke, R.A. The Relationship of the North American Monsoon to Tropical and North Pacific Sea Surface Temperatures as Revealed by Observational Analyses. J. Clim. 2001, 14, 4449–4473. [Google Scholar] [CrossRef]
  30. Shamir, E.; Meko, D.M.; Graham, N.E.; Georgakakos, K.P. Hydrologic Model Framework for Water Resources Planning in the Santa Cruz River, Southern Arizona. JAWRA J. Am. Water Resour. Assoc. 2007, 43, 1155–1170. [Google Scholar] [CrossRef]
  31. Chang, H.-I.; Castro, C.L.; Carrillo, C.M.; Dominguez, F. The more extreme nature of U.S. warm season climate in the recent observational record and two “well-performing” dynamically downscaled CMIP3 models. J. Geophys. Res. Atmos. 2015, 120, 8244–8263. [Google Scholar] [CrossRef]
  32. Pascale, S.; Carvalho, L.M.V.; Adams, D.K.; Castro, C.L.; Cavalcanti, I.F.A. Current and Future Variations of the Monsoons of the Americas in a Warming Climate. Curr. Clim. Chang. Rep. 2019, 5, 125–144. [Google Scholar] [CrossRef]
  33. Luong, T.M.; Castro, C.L.; Chang, H.-I.; Lahmers, T.; Adams, D.K.; Ochoa-Moya, C.A. The More Extreme Nature of North American Monsoon Precipitation in the Southwestern United States as Revealed by a Historical Climatology of Simulated Severe Weather Events. J. Appl. Meteorol. Clim. 2017, 56, 2509–2529. [Google Scholar] [CrossRef]
  34. Castro, C.L.; Pielke, R.A.; Adegoke, J.O.; Schubert, S.D.; Pegion, P.J. Investigation of the Summer Climate of the Contiguous United States and Mexico Using the Regional Atmospheric Modeling System (RAMS). Part II: Model Climate Variability. J. Clim. 2007, 20, 3866–3887. [Google Scholar] [CrossRef] [Green Version]
  35. DeMaria, E.M.C.; Hazenberg, P.; Scott, R.L.; Meles, M.B.; Nichols, M.; Goodrich, D. Intensification of the North American Monsoon Rainfall as Observed From a Long-Term High-Density Gauge Network. Geophys. Res. Lett. 2019, 46, 6839–6847. [Google Scholar] [CrossRef] [Green Version]
  36. Thomas, B.E.; Pool, D.R. Trends in streamflow of the San Pedro River, southeastern Arizona, and regional trends in precipitation and streamflow in southeastern Arizona and southwestern New Mexico. Prof. Paper US Geol. Surv. 2006, 1712, 79. [Google Scholar]
  37. Shamir, E.; Wang, J.; Georgakakos, K.P. Probabilistic Streamflow Generation Model for Data Sparse Arid Watersheds. JAWRA J. Am. Water Resour. Assoc. 2007, 43, 1142–1154. [Google Scholar] [CrossRef]
  38. Castro, L.C.; Chang, H.; Leuthold, M.; Luong, T.; Carrillo, C.; Mazon, J.; Stutler, J.; Jares, M.; Lahmers, T.; Cassell, W. Assessing Climate Change Impacts for DoD Installations in the Southwest United States during the Warm Season; University of Arizona Tucson United States: Tucson, AZ, USA, 2017; p. 128. [Google Scholar]
  39. Bukovsky, M.S. Temperature Trends in the NARCCAP Regional Climate Models. J. Clim. 2012, 25, 3985–3991. [Google Scholar] [CrossRef]
  40. Bukovsky, M.S.; Carrillo, C.M.; Gochis, D.J.; Hammerling, D.M.; McCrary, R.R.; Mearns, L.O. Toward Assessing NARCCAP Regional Climate Model Credibility for the North American Monsoon: Future Climate Simulations. J. Clim. 2015, 28, 6707–6728. [Google Scholar] [CrossRef]
  41. Geil, K.L.; Serra, Y.L.; Zeng, X. Assessment of CMIP5 Model Simulations of the North American Monsoon System. J. Clim. 2013, 26, 8787–8801. [Google Scholar] [CrossRef]
  42. Pascale, S.; Boos, W.R.; Bordoni, S.; Delworth, T.L.; Kapnick, S.B.; Murakami, H.; Vecchi, G.A.; Zhang, W. Weakening of the North American monsoon with global warming. Nat. Clim. Chang. 2017, 7, 806–812. [Google Scholar] [CrossRef]
  43. Maloney, E.D.; Camargo, S.J.; Chang, E.; A Colle, B.; Fu, R.; Geil, K.L.; Hu, Q.; Jiang, X.; Johnson, N.C.; Karnauskas, K.B.; et al. North American Climate in CMIP5 Experiments: Part III: Assessment of Twenty-First-Century Projections. J. Clim. 2014, 27, 2230–2270. [Google Scholar] [CrossRef]
  44. Torres-Alavez, A.; Cavazos, T.; Turrent, C. Land–Sea Thermal Contrast and Intensity of the North American Monsoon under Climate Change Conditions. J. Clim. 2014, 27, 4566–4580. [Google Scholar] [CrossRef]
  45. Cook, B.; Seager, R.D. The response of the North American Monsoon to increased greenhouse gas forcing. J. Geophys. Res. Atmos. 2013, 118, 1690–1699. [Google Scholar] [CrossRef] [Green Version]
  46. Colorado-Ruiz, G.; Cavazos, T.; Salinas, J.A.; De Grau, P.; Ayala, R. Climate change projections from Coupled Model Intercomparison Project phase 5 multi-model weighted ensembles for Mexico, the North American monsoon, and the mid-summer drought region. Int. J. Clim. 2018, 38, 5699–5716. [Google Scholar] [CrossRef]
  47. Maddox, R.A.; Mccollum, D.M.; Howard, K.W. Large-Scale Patterns Associated with Severe Summertime Thunderstorms over Central Arizona. Weather. Forecast. 1995, 10, 763–778. [Google Scholar] [CrossRef] [Green Version]
  48. Magirl, C.S.; Webb, R.H.; Griffiths, P.G.; Schaffner, M.; Shoemaker, C.; Pytlak, E.; Yatheendradas, S.; Lyon, S.W.; Troch, P.A.; Desilets, S.L.E.; et al. Impact of recent extreme Arizona storms. Eos Trans. Am. Geophys. Union 2007, 88, 191–193. [Google Scholar] [CrossRef] [Green Version]
  49. Redmond, K.T.; Koch, R.W. Surface Climate and Streamflow Variability in the Western United States and Their Relationship to Large-Scale Circulation Indices. Water Resour. Res. 1991, 27, 2381–2399. [Google Scholar] [CrossRef]
  50. Sheppard, P.R.; Comrie, A.C.; Packin, G.D.; Angersbach, K.; Hughes, M.K. The climate of the US Southwest. Clim. Res. 2002, 21, 219–238. [Google Scholar] [CrossRef] [Green Version]
  51. Kim, S. An Assessment of Atmospheric Rivers as Flood Produces in Arizona. Master’s Thesis, Hydrology and Water Resources, University of Arizona, Tucson, AZ, USA, 2015; 134p. [Google Scholar]
  52. Neiman, P.J.; Ralph, F.M.; Moore, B.J.; Hughes, M.; Mahoney, K.M.; Cordeira, J.M.; Dettinger, M.D. The Landfall and Inland Penetration of a Flood-Producing Atmospheric River in Arizona. Part I: Observed Synoptic-Scale, Orographic, and Hydrometeorological Characteristics. J. Hydrometeorol. 2013, 14, 460–484. [Google Scholar] [CrossRef]
  53. Rutz, J.J.; Steenburgh, W.J. Quantifying the role of atmospheric rivers in the interior western United States. Atmos. Sci. Lett. 2012, 13, 257–261. [Google Scholar] [CrossRef]
  54. Rutz, J.J.; Steenburgh, W.J.; Ralph, F.M. The Inland Penetration of Atmospheric Rivers over Western North America: A Lagrangian Analysis. Mon. Wea. Rev. 2015, 143, 1924–1944. [Google Scholar] [CrossRef]
  55. Dettinger, M.D. Fifty-Two Years of “Pineapple-Express” Storms Across the West Coast of North America US Geological Survey, Scripps Institution of Oceanography for the California Energy Commission; California Energy Commission: Sacramento, CA, USA, 2004.
  56. Neelin, J.D.; Langenbrunner, B.; Meyerson, J.E.; Hall, A.; Berg, N. California Winter Precipitation Change under Global Warming in the Coupled Model Intercomparison Project Phase 5 Ensemble. J. Clim. 2013, 26, 6238–6256. [Google Scholar] [CrossRef]
  57. Cook, B.I.; Ault, T.R.; Smerdon, J.E. Unprecedented 21st century drought risk in the American Southwest and Central Plains. Sci. Adv. 2015, 1, e1400082. [Google Scholar] [CrossRef] [PubMed] [Green Version]
  58. Dettinger, M.D. Climate Change, Atmospheric Rivers, and Floods in California - A Multimodel Analysis of Storm Frequency and Magnitude Changes1. JAWRA J. Am. Water Resour. Assoc. 2011, 47, 514–523. [Google Scholar] [CrossRef]
  59. Gao, Y.; Lu, J.; Leung, L.R.; Yang, Q.; Hagos, S.; Qian, Y. Dynamical and thermodynamical modulations on future changes of landfalling atmospheric rivers over western North America. Geophys. Res. Lett. 2015, 42, 7179–7186. [Google Scholar] [CrossRef]
  60. Warner, M.D.; Mass, C.F.; Salathé, E.P. Changes in Winter Atmospheric Rivers along the North American West Coast in CMIP5 Climate Models. J. Hydrometeorol. 2015, 16, 118–128. [Google Scholar] [CrossRef]
  61. Payne, A.E.; Magnusdottir, G. An evaluation of atmospheric rivers over the North Pacific in CMIP5 and their response to warming under RCP 8.5. J. Geophys. Res. Atmos. 2015, 120, 11–173. [Google Scholar] [CrossRef] [Green Version]
  62. Gershunov, A.; Shulgina, T.; Clemesha, R.E.S.; Guirguis, K.; Pierce, D.W.; Dettinger, M.D.; Lavers, D.A.; Cayan, D.R.; Polade, S.D.; Kalansky, J.; et al. Precipitation regime change in Western North America: The role of Atmospheric Rivers. Sci. Rep. 2019, 9, 1–11. [Google Scholar] [CrossRef]
  63. Shields, C.A.; Kiehl, J.T. Atmospheric river landfall-latitude changes in future climate simulations. Geophys. Res. Lett. 2016, 43, 8775–8782. [Google Scholar] [CrossRef]
  64. Ritchie, E.A.; Wood, K.M.; Gutzler, D.S.; White, S.R. The Influence of Eastern Pacific Tropical Cyclone Remnants on the Southwestern United States. Mon. Weather. Rev. 2011, 139, 192–210. [Google Scholar] [CrossRef]
  65. Knutson, T.; Camargo, S.J.; Chan, J.C.L.; Emanuel, K.; Ho, C.-H.; Kossin, J.; Mohapatra, M.; Satoh, M.; Sugi, M.; Walsh, K.; et al. Tropical Cyclones and Climate Change Assessment: Part I: Detection and Attribution. Bull. Am. Meteorol. Soc. 2019, 100, 1987–2007. [Google Scholar] [CrossRef] [Green Version]
  66. Knutson, T.; Camargo, S.J.; Chan, J.C.L.; Emanuel, K.; Ho, C.-H.; Kossin, J.; Mohapatra, M.; Satoh, M.; Sugi, M.; Walsh, K.; et al. Tropical Cyclones and Climate Change Assessment: Part II: Projected Response to Anthropogenic Warming. Bull. Am. Meteorol. Soc. 2020, 101, E303–E322. [Google Scholar] [CrossRef]
  67. Magaña, V.; Zermeño, D.; Neri, C. Climate change scenarios and potential impacts on water availability in northern Mexico. Clim. Res. 2012, 51, 171–184. [Google Scholar] [CrossRef]
  68. Dominguez, F.; Cañon, J.; Valdes, J. IPCC-AR4 climate simulations for the Southwestern US: The importance of future ENSO projections. Clim. Chang. 2010, 99, 499–514. [Google Scholar] [CrossRef]
  69. Ajami, H.; Meixner, T.; Dominguez, F.; Hogan, J.; Maddock, T. Seasonalizing mountain system recharge in semi-arid basins—climate change impacts. Groundwater 2012, 50, 585–597. [Google Scholar] [CrossRef]
  70. Serrat-Capdevila, A.; Valdés, J.B.; Pérez, J.G.; Baird, K.; Mata, L.J.; Maddock III, T. Modeling climate change impacts–and uncertainty–on the hydrology of a riparian system: The San Pedro Basin (Arizona/Sonora). J. Hydrol. 2007, 347, 48–66. [Google Scholar] [CrossRef]
Figure 1. Projected 20402069 changes, as compared with 1971-2000, of average temperature and average precipitation relative changes (percent) in December-February (X-axis) and June-August (Y-axis). The projections are from twenty 4-km statistically downscaled CMIP5 GCMs with RCP 4.5 and RCP 8.5 emission scenarios. The downscaling is based on the Multivariate Adaptive Constructed Analogs procedure [6] using meteorological data and interpolation method as described in Abatzoglou, (2013) [11]. The dataset was retrieved from https://climate.northwestknowledge.net/MACA/index.php (accessed on 13 May 2021).
Water 13 01390 g001
Figure 2. Map of the study region.
Water 13 01390 g002
Figure 3. Average 1981–2020 monthly temperature from the Santa Cruz River near the border crossing from Sonora to Arizona. Data are available from the 4 km monthly climatological gridded surface meteorological dataset [11]. The estimated linear trend are shown as red lines and the estimated monthly rate of change over 40 years are indicated at the top left of the panels.
Water 13 01390 g003
Figure 4. Observed summer (July–September) and winter (November–March) 1955–2020 precipitation (mm) from a rain gauge near Nogales, Arizona (USC00025924) and 1937–2020 streamflow (1000 m3) on the Santa Cruz River near the border crossing from Sonora to Arizona (USGS-09480500). The inter-annual averages are indicated as horizontal solid lines. The seasonal and the water year (blue) 10-year moving averages are indicated as solid lines.
Water 13 01390 g004
Figure 5. Average 1981–2020 summer and winter precipitation ((a) and (d) for summer and winter, respectively), their portion from the average annual precipitation ((b) and (e) for summer and winter, respectively), and their inter-annual variability represented by the coefficient of variation for locations with average seasonal rainfall that exceed 100 mm ((c) and (f) for summer and winter, respectively). The purple dots demark the Santa Cruz River at its crossing of the international border from Sonora Mexico to Arizona U.S. The dataset is from the global monthly 4 km TerraClimate dataset [28].
Water 13 01390 g005
Table 1. Observed average summer and winter precipitation (mm) in USC-00025924 and streamflow (MCM) in USGS-09480500. The square parentheses indicate the percent reduction of the averages for the precipitation and streamflow respectively from 1955–2000 and 1937–2000 to 2001–2020.
SummerWinter
Precipitation (mm)
1955–2000259 115
2001–2020233 (10%)* 77 (33%)
Streamflow (MCM)
1937–20009.28.5
2001–2020* 3.2 (65%) * 1.9 (78%)
* Null hypothesis in which the 2001–2020 is from the same distribution as 1955–2000 and 1937–2000 for the precipitation and the streamflow, respectively was rejected at 1% significance level using the non parametric Kolmogorov-Smirnov test.
Publisher’s Note: MDPI stays neutral with regard to jurisdictional claims in published maps and institutional affiliations.

