Article

Changes in Water Environment in Erhai Lake and Its Influencing Factors

1
State Key Laboratory of Information Engineering in Surveying, Mapping and Remote Sensing, Wuhan University, Wuhan 430079, China
2
Faculty of Resources and Environmental Science, Hubei University, Wuhan 430062, China
*
Authors to whom correspondence should be addressed.
Water 2021, 13(10), 1362; https://doi.org/10.3390/w13101362
Submission received: 23 March 2021 / Revised: 10 May 2021 / Accepted: 11 May 2021 / Published: 14 May 2021
(This article belongs to the Special Issue Water and the Ecosphere in the Anthropocene)

Abstract

:
In recent years, the rapid development of the population, agriculture, and tourism around Erhai Lake has caused increasing environmental problems, which have seriously affected the ecological status of the lake. This study analyzed changes in water volume and quality in Erhai Lake, based on statistical data from 2000 to 2019, combined with climate, land-use type, and socioeconomic data, as well as the influencing factors of water environmental changes in the Erhai Lake basin. The main conclusions include: the water storage of Erhai Lake increased by 3.8 × 10⁶ m3 year−1, from 2000 to 2019. The monthly variation in water volume showed a trend of first decreasing and then increasing, in which it increased from August to December and decreased from January to July. The change in water volume was mainly affected by climate factors. From 2000 to 2019, the nitrogen concentration in Erhai Lake showed an increasing trend, and the changes in water quality were closely related to human activities. In the northern part of the basin, agricultural nonpoint source pollution was the main factor affecting water quality, while in the southern part of the basin, economic development, accelerated urbanization, and tourism were the main factors affecting water quality.

1. Introduction

As an important part of the natural ecosystem, lakes have multiple functions, such as regulating and storing runoff, water supply and irrigation, regulating the climate and environment, and maintaining the balance of the ecosystem, all of which have important impacts on human survival and development [1]. In recent decades, climate warming and increased human activities have caused many problems for the lake water environment, which have led to lake water ecological degradation, and caused serious environmental problems worldwide [2,3,4,5]. The study of the lake water environment is not only related to the sustainable development of lake basins but also the strategic need to realize the sustainable development of the regional ecological economy and national security and stability.
Climate change can potentially have a large impact on the global water cycle by modifying precipitation and evaporation patterns [6,7]. Precipitation is the main supplement to the water volume of inland lakes, and its fluctuations will affect the water volume of lakes [8]. With the increase in temperature, the evaporation of plants and land will increase, the water consumption of crops will increase, and the water resources will change [9]. With the rapid development of China’s economy, the acceleration of industrialization and urbanization, the trade-off between human and environmental needs has gradually become more prominent, and human activities have become a factor that cannot be ignored when intervening in lake ecosystems. Studies have shown that human activities such as changing land use [10], economic development [11], building water conservancy projects [8], and combined sewer overflow [12] can change the ecological environments of lakes in a relatively short period. Quantitative assessment of the impact of human activities on the water environment has attracted the attention of many scholars. Human activities involve several aspects of the economy and society that, in turn, are modulated by a wide range of factors. However, due to the limitations of traditional statistical survey methods, the acquisition of socioeconomic parameters often has some shortcomings, such as a large error, considerable time requirements, and a lack of spatial information. As an important data source for measuring the spatial and temporal characteristics of human activity intensity, remote sensing and other spatial data have shown great potential in acquiring land-use information and ecological environmental parameter information [13,14,15].
Erhai Lake is the core of China’s National Nature Reserve, a scenic spot, and the main drinking water source of Dali city. In recent years, with the rapid development of social economy, the shortage of water resources and the decline in water quality in Erhai Lake are prominent [16]. This lake is considered to be in the representative preliminary eutrophic stage [17,18]. Huang et al. showed that changes in precipitation and temperature affected the water volume of Erhai Lake [19]. With the acceleration of urbanization, human activities have gradually become an important factor affecting the water quality of Erhai Lake in recent years. Li et al. studied the impact of human activities on water quality by estimating the net nitrogen input of human activities in the Erhai Lake basin [20]. Wang et al. and Ying et al. showed that the impact of human activities on the Erhai Lake environment is mainly manifested in agricultural nonpoint source pollution caused by unreasonable human farming methods and excessive fertilization [21,22]. Yang et al. showed that topdressing activities would lead to the eutrophication of Erhai Lake [23]. Sun et al. [24] showed that tourism activities and development caused pollution to the seawater environment of Erhai Lake. At present, how to comprehensively use multisource spatiotemporal data and other types of ecological–economic–social development data to quantitatively measure the intensity of human activity and analyze its temporal and spatial distribution law is still scarce.
Based on the statistical data, this study analyzed the water volume and water quality changes in Erhai Lake from 2000 to 2019, analyzed the human activities in the basin with the help of land-use type, social and economic data, and discussed the influencing factors of Erhai Lake environmental changes, the results provide theoretical support for the sustainable development of the Erhai Lake basin.

2. Study Area and Data
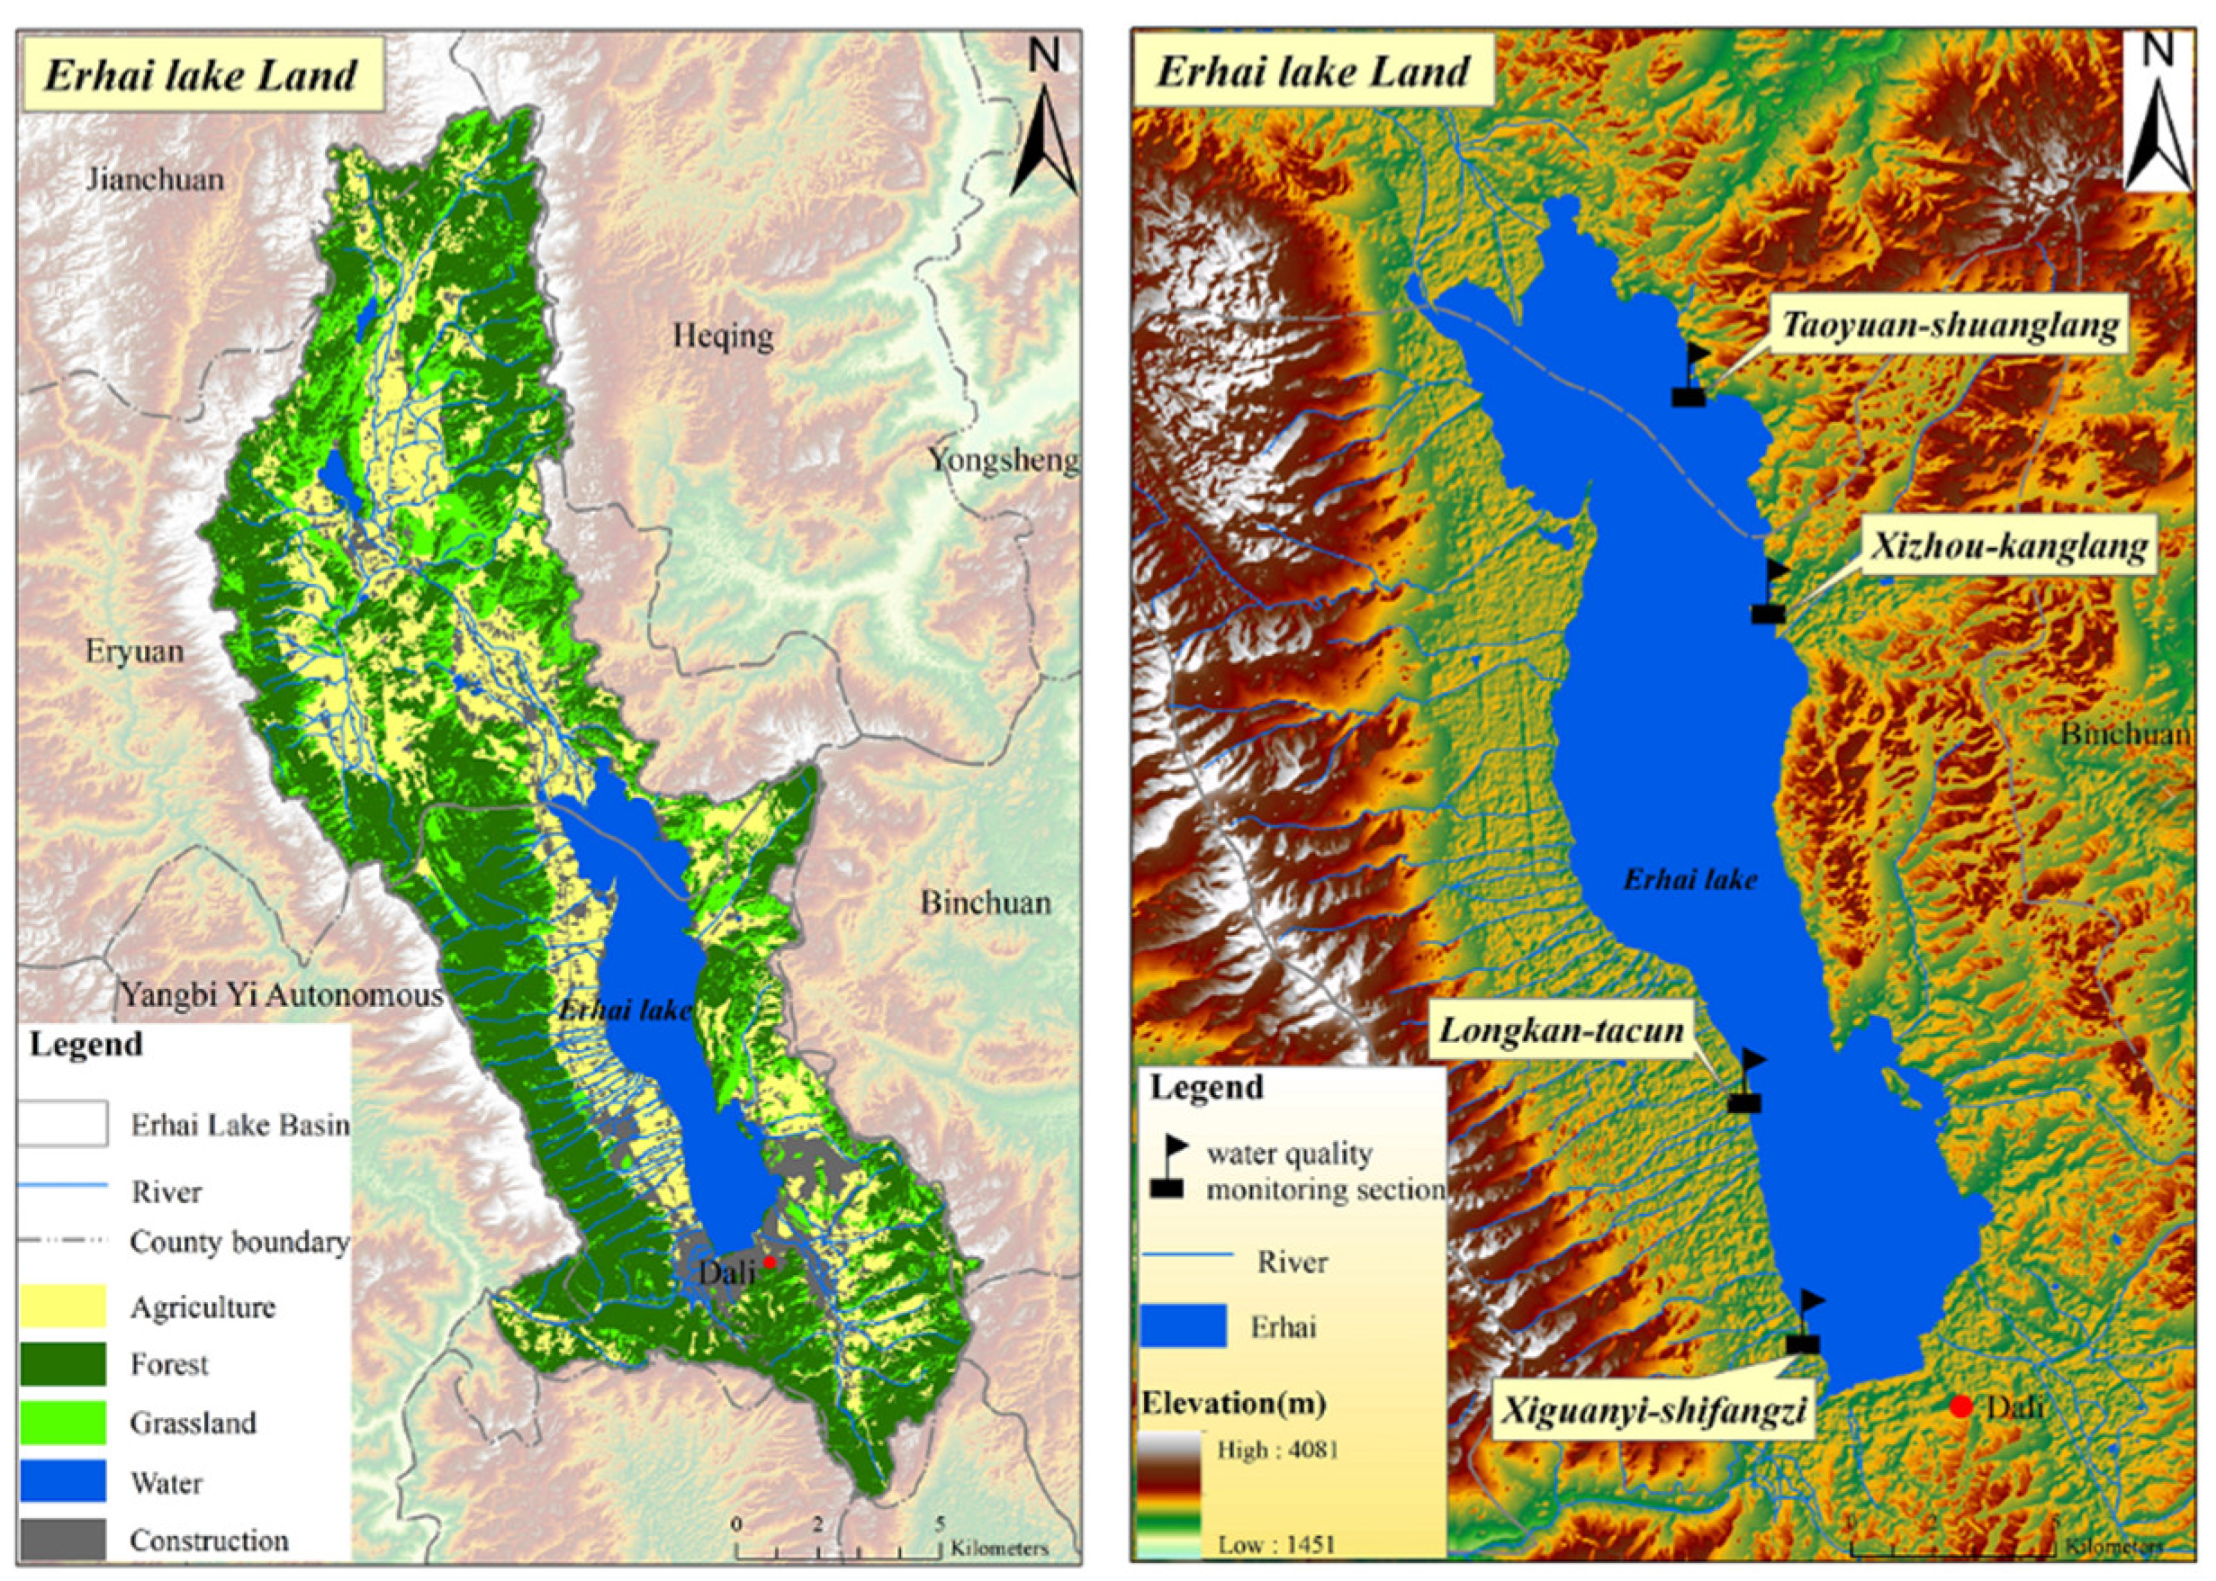
2.1. Study Area

The Erhai Lake basin (25°25′–26°16′ N, 99°32′–100°27′ E) is located in the Bai Autonomous Prefecture of Dali city, Yunnan Province, China (Figure 1). The basin includes the urban area of Dali city and Eryuan County. The basin area is approximately 2565 km2, and the lake area is approximately 250 km2. The Erhai Lake basin belongs to the mid-subtropical southwest monsoon climate zone, which is affected by the Indian Ocean climate. The annual average precipitation is 994.2 mm, and the precipitation is unevenly distributed throughout the year. Approximately 85.6% of the precipitation is concentrated from May to October, and the multiyear average temperature is 14.6 °C.

2.2. Data

The data used in this study included remote sensing image data, meteorological station data, and statistical data; the data list is shown in Table 1.
The gross domestic product (GDP) and population spatial distribution data came from the China Resource and Environmental Science and Data Center. The GDP and population distribution data have a spatial resolution of 1 km, and the unit is ten thousand yuan/square kilometer and person/square kilometer, respectively. The temporal period for the selected data was 2000, 2005, 2010, and 2015.
Precipitation and temperature data come from weather stations. The land-use type data selected were GlobeLand30, with a resolution of 30 m donated by China to the United Nations.
The year-end (December) water volume, water use structure, and wastewater discharge data of Erhai Lake came from the Dali Water Resources Bulletin. The spatial distribution data of water quality can obtain only the nitrogen concentration, and nitrogen has always been the primary pollutant affecting the water quality of Erhai Lake [25]; thus, the total nitrogen (TN) concentration was used as the water quality data for Erhai Lake. We collected annual and monthly TN concentrations in Erhai Lake, as well as TN concentration data from four water quality monitoring sections.

3. Methods

3.1. Correlation Analysis

Correlation analysis is a statistical method to deal with the relationship between variables. We used correlation analysis to study the relationship between various factors, Table 2 shows the variables that need to calculate the correlation. The correlation analysis formula is as follows:
r ab = i = 0 n ( a i a - ) ( b i b - ) i = 0 n ( a i a - ) 2 i = 0 n ( b i b - ) 2
where rab is the correlation coefficient between variables a and b, ai and bi are the values of variables a and b in the i-th year, a is the average value of variable a in the study period, b - is the average value of variable b in the study period, and n is the study period. We tested the significance of correlation analysis results, p < 0.05 indicated a significant correlation, and p < 0.01 indicated an extremely significant correlation.

3.2. Land-Use Transfer Matrix

GlobeLand30 contains 7 primary types: cultivated land, forest, grassland, shrubland, wetland, water body, and man-made surface. We merged shrubs and forests, wetlands and water, and artificial ground as construction land. Finally, the land-use types are divided into five types: cultivated land, forest, grassland, water, and construction land.
The land-use transfer matrix is the main method to quantitatively study the changes in the areas devoted to specific land uses and to highlight mutual conversions among different land uses. We used the land-use transfer matrix to analyze the land-use changes in the Erhai Lake Basin from 2000 to 2020.
The data reflect the structural characteristics and change direction of land-use types in the study area. The specific calculation formula is as follows:
S ij = [ S 11 S 12 S 21 S 22 S 1 n S 2 n S n 1 S n 2 S nn ]
where i and j represent the land-use types of the Erhai Lake basin in 2000 and 2020, respectively; n represents the total number of land-use types; and sij is the total area transformed from class i to class j in the study period.

4. Results

4.1. Dynamic Change in Water Volume

Figure 2 shows the change in water volume of Erhai Lake at the end of each year from 2000 to 2019. The figure shows that the average water volume of Erhai Lake at the end of the 20 years was 2.81 billion m3, the maximum water volume at the end of the year was 2.94 billion m3 (2010), the minimum water volume at the end of the year was 2.52 billion m3 (2003), and the ratio between the maximum value and the minimum value was 1.17. During the study period, the annual end-of-year water volume of Erhai Lake showed an upward fluctuating trend, with a change trend of 3.8 × 10⁶m3 year–1. The interannual change kurtosis was 1.447, which was steeper than the normal distribution, indicating that the end-of-year water volume fluctuation of Erhai Lake contained more extreme values, with a skewness of −1.013, indicating that the extreme values were distributed to the left of the mean value, and the data on the left side were more discrete.
The average monthly water volume of Erhai Lake from 2000 to 2019 showed that the annual cycle of monthly water storage of Erhai Lake (Figure 3) oscillated from a minimum value in July (2.62 × 10⁹ m3) to a maximum value in November (2.981 × 10⁹ m3), with an average of 2.788 × 10⁹ m3. During the year, the water volume first decreased and then increased; specifically, it decreased from January to July and increased from August to December.

4.2. Dynamic Change in Water Quality

4.2.1. Time Change

From 2000 to 2019, the annual average TN concentration in Erhai Lake showed a fluctuating upward trend (Figure 4a), with a change trend of 0.0075 mg/L year–1. The average value was 0.52 mg/L, the minimum value appeared in 2000 (0.33 mg/L), and the maximum value appeared in 2006 (0.66 mg/L). Regarding the interannual change trend, there was an upward trend from 2000 to 2003, a downward trend from 2004 to 2014, an upward trend from 2015 to 2019, and a large fluctuation range from 2004 to 2010.
Figure 4b shows the monthly variation trend of the TN concentration in Erhai Lake from 2000 to 2019. The figure shows that the TN concentration was highest in August (0.620 mg/L) and lowest in April (0.475 mg/L). The TN concentration showed an upward trend from May to August and a downward trend from September to April. The TN concentration was highest in August.

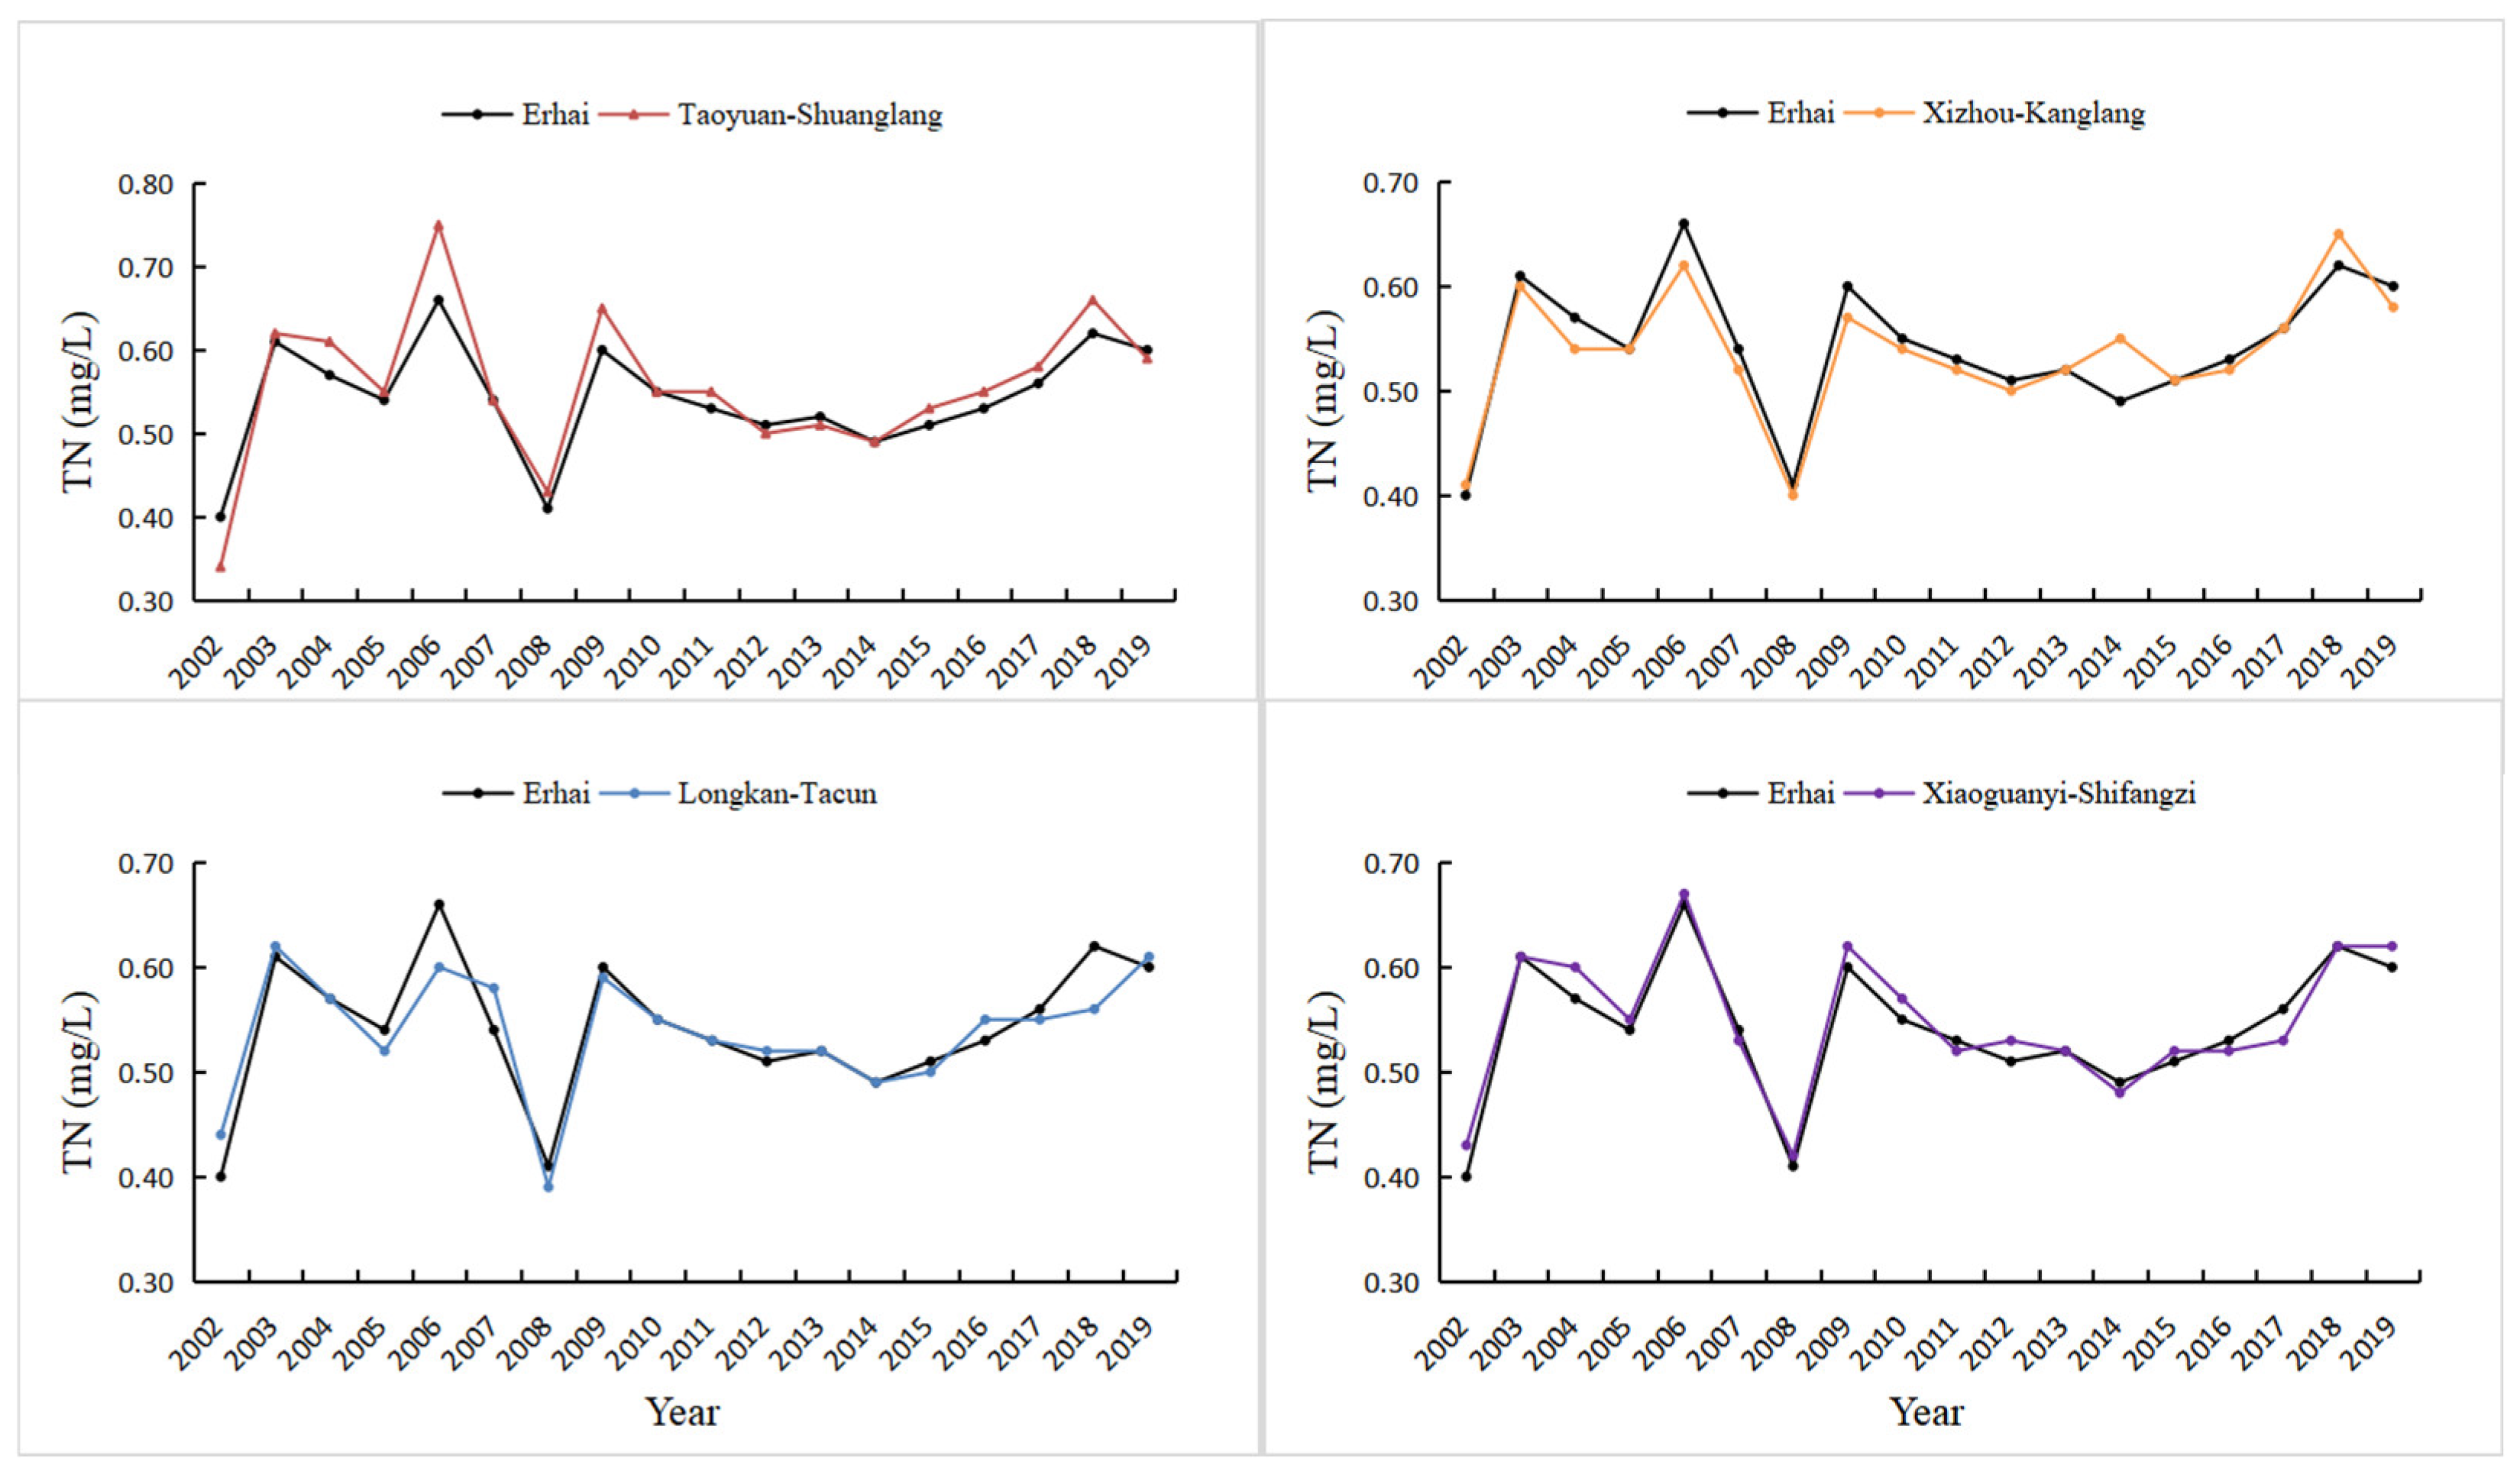
4.2.2. Spatial Change

Figure 5 shows the variation in the TN concentration in Erhai Lake and its sections in the north–south direction from 2002 to 2019. The figure shows that from 2002 to 2019, the mass concentration of TN in the four sections of Erhai Lake first increased, then fluctuated and decreased, and then increased, which was basically consistent with the variation trend of the TN concentration in the whole lake. The average annual TN concentration in the four sections ranged from 0.34 mg/L to 0.75 mg/L, and the maximum and minimum values appeared in the Taoyuan-Shuanglang section. Spatially, the TN concentrations of the Taoyuan–Shuanglang section in the north and the Xiaoguanyi–Shifangzi section in the south were higher than the average value for Erhai Lake, while the TN concentrations of the Xizhou–Kanglang section and Longkan-Tacun section in the middle were lower than the average value for Erhai Lake.

4.3. Influence of Precipitation and Temperature on Water Environment

4.3.1. Precipitation Change

From 2000 to 2019, the average annual precipitation of Erhai Lake presented a fluctuating upward trend (Figure 6a), with a change trend of 2.939 mm/year, and the average annual precipitation over 20 years was 949.54 mm, with a minimum annual precipitation of 613.2 mm in 2006 and a maximum annual precipitation of 1282.2 mm in 2008. According to the change in annual precipitation and the trend of the sixth-order principal value function in the Erhai basin, the interannual variation in precipitation could be divided into five periods. Specifically, 2000–2002, 2008–2012, and 2016–2019 were periods with more precipitation, and the average precipitation in these periods was higher than the average precipitation for many years. There was less precipitation in 2003–2007 and 2013–2015, and the average precipitation in these periods was lower than the average precipitation for many years.
From 2000 to 2019, the average monthly precipitation reached a maximum (215.1 mm) in August and a minimum (12.0 mm) in December (Figure 6b). Regarding the change trend, the increasing trend of precipitation was not obvious from January to April, but it increased significantly from May to August and decreased significantly from September to December. The seasonal variation in precipitation in the Erhai Lake basin was obvious. The precipitation was mainly distributed from May to October (flood season and wet season), accounting for 87% of the annual precipitation. The precipitation from November to April (dry season) accounted for only 13% of the annual precipitation.

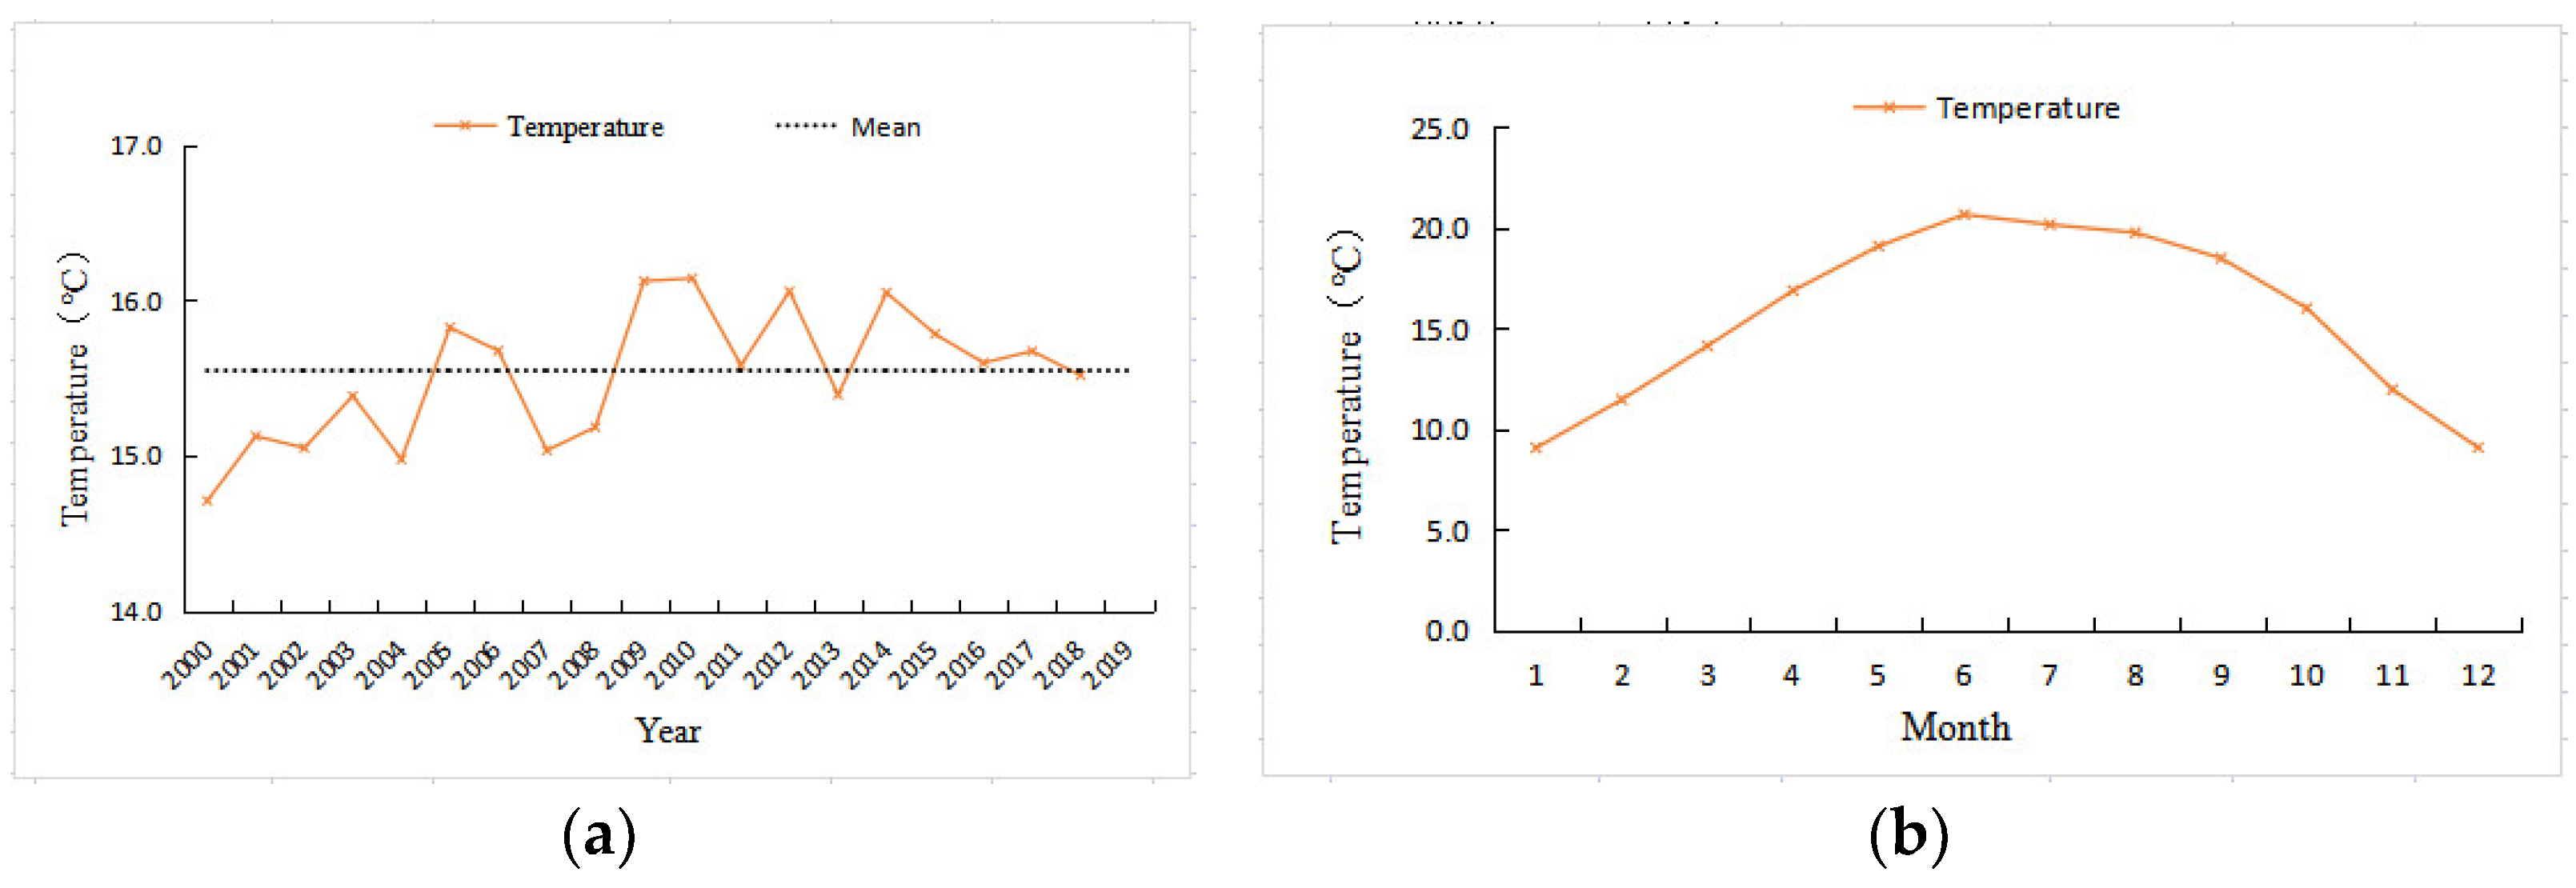
4.3.2. Temperature Change

From 2000 to 2019, the annual average temperature of Erhai Lake showed a fluctuating upward trend (Figure 7a), with a change trend of 0.043 °C/year. The average annual temperature for 20 years was 15.55 °C. The minimum annual temperature appeared in 2000 at 14.71 °C, and the maximum annual average temperature appeared in 2010 at 16.14 °C. According to the annual average temperature change in the Erhai Lake basin and the trend of the sixth-order principal value function, the interannual variation in the average annual temperature was mainly divided into two periods. During 2000–2007, there was a low average annual temperature, and the average annual temperature during this period was lower than the multiyear average. During 2008–2019, there was a high annual average temperature, and the average annual temperature during this period was higher than the multiyear average.
The monthly average temperature from 2000 to 2019 reached a maximum value (20.65 °C) in June and a minimum value (9.04 °C) in November. In terms of the change trends, the average temperature showed a clear increasing trend from January to June and a clear decreasing trend from July to December (Figure 7b).

4.3.3. Relationship between Changes in Climate Factors and Water Environment

The interannual fluctuation in water volume in the Erhai Lake basin was greatly affected by precipitation (Table 3). There was a significant positive correlation between water volume and annual precipitation from 2000 to 2019, with a correlation coefficient of 0.577 (p < 0.01). There was no significant correlation between the water volume at the end of the year and the annual average temperature, with a correlation coefficient of −0.113. The correlation coefficients were −0.759 (p < 0.01) and −0.841 (p < 0.01), respectively, indicating that the seasonal fluctuation in water volume was greatly affected by climate factors.
On the annual scale, there was no significant correlation between precipitation, temperature and TN concentration. On the monthly scale, there was a significant positive correlation between TN concentration and precipitation, and the correlation coefficient was 0.833 (p < 0.01).

4.4. Impact of Human Activities on Water Environment

4.4.1. Changes in Human Activities

From 2000 to 2020, the change in land-use types in the Erhai Lake basin was mainly as follows (Table 4): cultivated land and construction land increased, and forest land, grassland, and water areas decreased. Cultivated land and construction land increased by 7.21 and 80.26 km2, respectively, while forest, grassland and water areas decreased by 25.22, 58.96, and 3.30 km2, respectively. The increased cultivated land was mainly converted from forest and grassland, and the increased construction land was mainly converted from cultivated land and forest. The increase in cultivated land was concentrated in the north of the basin, and the increase in construction land was mainly concentrated in the area around Erhai Lake and in the south of Erhai Lake.
Figure 8 shows the spatial distribution and changes in GDP in the Erhai Lake basin from 2000 to 2015. The figure shows that the GDP distribution in the basin was low in the north and high in the south. Dali city had the highest GDP, followed by the Erhai Lake area, while the northern part of the basin had a lower GDP.
During the study period, the GDP growth trend was significant, and the growth rate remained at approximately 10%. Spatially, the rate of GDP growth in the southern part of the Erhai Lake basin was greater than that in the northern part. Specifically, the GDP around Erhai Lake and the urban area of Dali increased the most. This result is related to the growth of tourist arrivals and the economic development of Dali in recent years.
Figure 9 shows the distribution of the population in the Erhai Lake basin. The distribution characteristics of the population in the Erhai Lake basin were similar to those of GDP, both of which were low in the north and high in the south. The population distribution on both sides of the river in the north was higher than that in other areas, and Dali city in the south had the largest population. During the study period, the population in the north of the basin showed a decreasing trend, while the population in the south showed a significant increasing trend. Additionally, the increase around Dali city was the most obvious, which was related to the acceleration of economic development and urbanization.
There were great differences in the economic development and population scale between the northern and southern regions of the Erhai Lake basin, and the degree of human activities in the south was stronger than that in the north. The human activities in the northern part of the basin were mainly related to agricultural farming, while the human activities in the southern part of the basin were mainly related to urban expansion, economic development, and tourism.

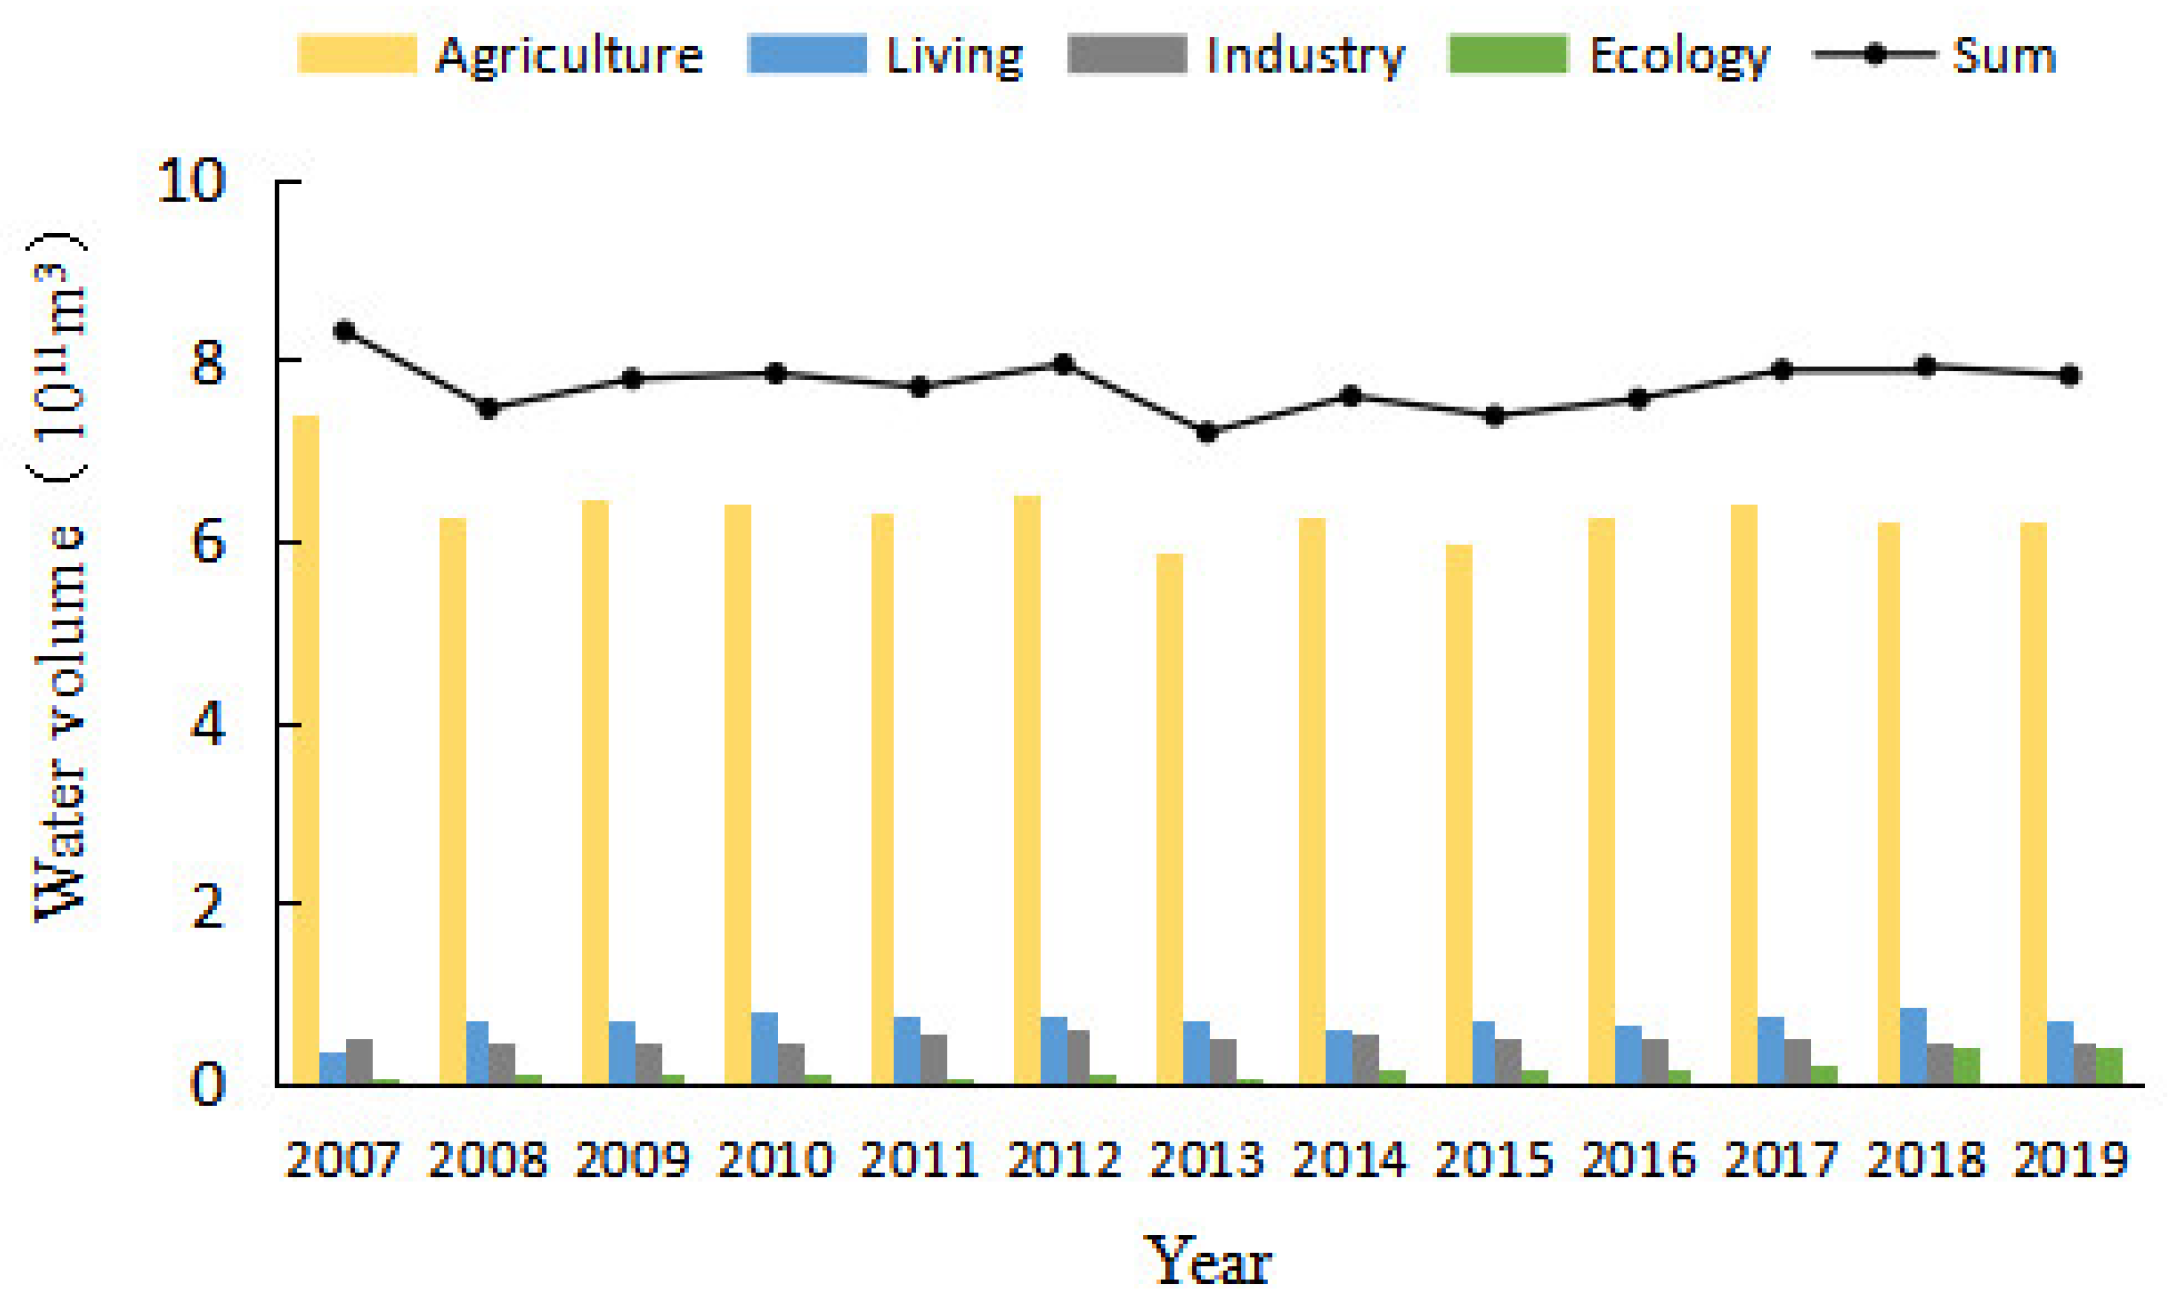
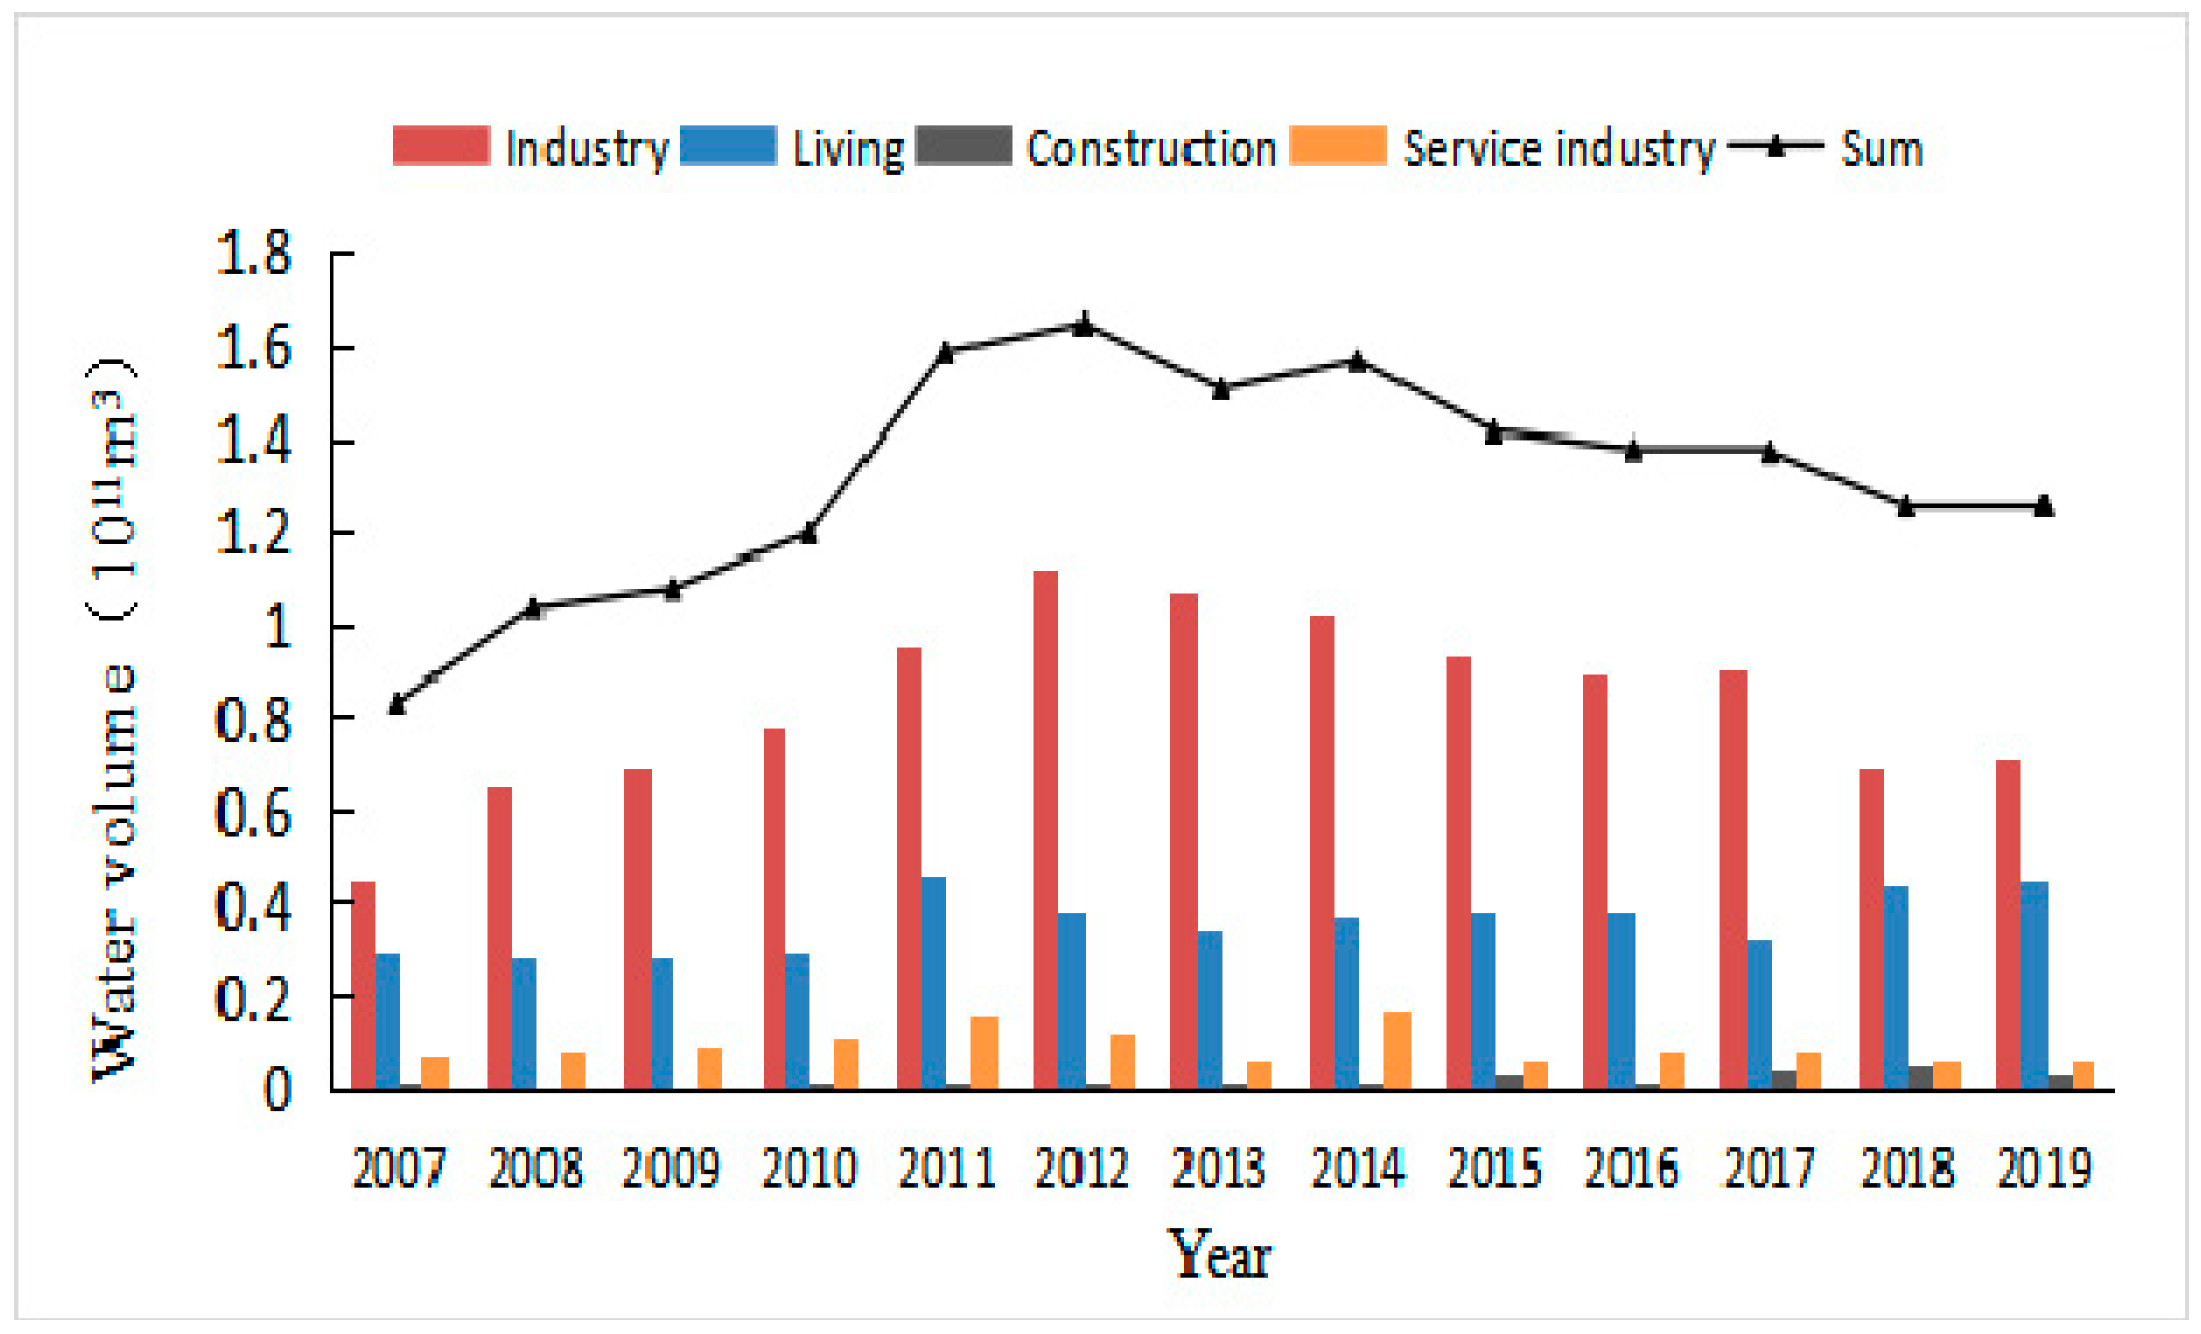
4.4.2. Impact on Water Resources

The water consumption structure and trend of the Erhai Lake basin from 2007 to 2019 are shown in Figure 10, which shows that the total water consumption of the Erhai Lake basin fluctuated and decreased slowly, and the change trend was 1.12 billion m3/year. The total water consumption was greatly affected by agricultural water consumption, and the trend of total water consumption was basically consistent with that of agricultural water consumption. The Erhai Lake basin is dominated by agriculture, and the proportion of agricultural water (farmland irrigation, water supplementation for forest and fruit and fish ponds, livestock industry) is relatively high. Agricultural water consumption accounted for approximately 83% of the total water consumption. From 2007 to 2019, agricultural water consumption showed a slow downward trend, with a change trend of 5.1 billion m3/year. Living water consumption (urban domestic water consumption and rural domestic water consumption) was ranked second, accounting for approximately 9% of the total water consumption. From 2007 to 2019, living water consumption showed a fluctuating upward trend, with a change trend of 1.33 billion m3/year. Industrial water consumption (industry and construction industry) accounted for approximately 9%. From 2007 to 2019, living water consumption showed a fluctuating downward trend, with a change trend of 0.01 billion m3/year. The consumption of eco-environmental supplemental water (Urban and rural greening, Prevent the lake from shrinking) was the lowest, accounting for approximately 2% of the total water consumption. From 2007 to 2019, the consumption of eco-environmental supplemental water showed a significant upward trend, with a change trend of 2.65 billion m3/year.
There was no significant negative correlation between water consumption and total water consumption from 2007 to 2019, and the correlation coefficient was −0.22. The correlation coefficient between water volume and agricultural water consumption was 0.163, the correlation coefficient between water volume and living water consumption was −0.324, the correlation coefficient between water volume and industrial water consumption was −0.126, and the correlation coefficient between water volume and eco-environmental supplemental water consumption was −0.658 (p < 0.05). The change in Erhai Lake water was less affected by the total water consumption of the basin (Table 5).
Compared with 2000, the water area decreased in 2019. From the results of land-use changes, we can see that during the study period, the reduced waters were mainly transformed into grassland and construction land. In recent years, tourism in Erhai Lake has developed rapidly. The reclamation of lakes and land and the construction and reconstruction of housing have resulted in more towns around Erhai Lake; thus, the lake area was reduced. However, the trend of vegetation swamps in the shallow water area of Erhai Lake is becoming increasingly serious, decreasing the water area.

4.4.3. Impact on Water Quality

The structure and trend of wastewater discharge in the Erhai Lake basin from 2007 to 2019 are shown in Figure 11, which shows that the total wastewater discharge in the Erhai Lake basin presented a fluctuating upward trend, with a change trend of 2.7 billion m3/year. Wastewater discharge was greatly affected by industry, and the total wastewater discharge was basically consistent with the trend of industrial wastewater discharge. The industrial wastewater discharge in the Erhai Lake basin accounted for 64% of the total wastewater discharge. During the period of 2007–2019, the industrial wastewater discharge showed an obvious upward trend, with a change trend of 1.57 billion m3/year. Living wastewater discharge was ranked second, accounting for approximately 24% of the total wastewater discharge. During 2007–2019, living wastewater discharge showed a slow increasing trend, with a change trend of 1.03 billion m3/year. The service industry accounted for 7.2% of the total wastewater discharge. The wastewater discharge of the service industry showed a downward trend from 2007 to 2019, with a change trend of 0.21 billion m3/year. Construction wastewater discharge accounted for 1.8% of the total wastewater discharge. From 2007 to 2019, construction wastewater discharge showed a significant increasing trend, with a change trend of 0.32 billion m3/year.
The spatial distribution of the TN concentration in Erhai Lake was as follows: the northern part had the highest concentration, followed by the southern part, and the central part had the lowest concentration. Within the same section, the nearshore point had a higher concentration, and the lake center point had a lower concentration. The northern part of the basin was dominated by agricultural development, which is polluted by agricultural nonpoint sources and has a high TN concentration. The southern part has a large population distribution and has experienced rapid economic development in recent years; thus, the region is affected by living sewage and industrial development, and the TN concentration is relatively high. Compared with the lake center point, the nearshore point had a higher nitrogen concentration because the nearshore point was more affected by living sewage and agricultural nonpoint sources.

5. Discussion

5.1. Influencing Factors of Water Volume Change

From 2000 to 2019, the annual fluctuation in Erhai water was large, but the overall change was not obvious. The relationship between water volume and annual precipitation is positive (+0.577), whereas the relationship between water volume and monthly precipitation is negative (−0.759). The water resources of Erhai Lake mainly come from precipitation, so there was a significant positive correlation between the interannual variation trend of water volume and the precipitation variation trend. On the monthly scale, the water volume of Erhai Lake is greatly affected by the water regime of the basin. The precipitation in Erhai Lake is mainly distributed from May to October (Figure 7); however, during the flood season (May–October), the amount of water flowing out of Erhai Lake is relatively large, accounting for 64.9% of the total outflow. The dry season (January–April, November-December) accounts for 35.1% of the total outflow [26]. Additionally, as the peak tourist season around Erhai Lake is from May to August, this directly increases the consumption of living and industrial water. Therefore, although summer rainfall is abundant, the volume of Erhai Lake shows a downward trend.
With the development of tourism and the economy, the urbanization process of the Erhai Lake basin has accelerated in recent years, the population growth trend is obvious, and living water consumption has shown an increasing trend. Agricultural irrigation is the main way to consume freshwater resources in Erhai Lake. The change in cultivated land area was small from 2007 to 2019. At the same time, agricultural water consumption was affected by crop structure, irrigation methods, irrigation project construction, water-saving measures, water supplemental area of fruit and fish ponds, livestock scale, and other factors; thus, the fluctuation of agricultural water consumption was small. Erhai Lake is the main water source of Dali city and its surrounding towns. In recent years, with the ecological construction and protection of Erhai Lake and the implementation of the strictest water resources management system, high water consumption enterprises (such as cement plants) have developed rapidly. As a result, industrial water consumption has been controlled, showing a significant downward trend. With a deeper emphasis on the ecological environment, the consumption of ecological compensation water has increased each year. This is confirmed in the research of Zhou [27].

5.2. Influencing Factors of Water Quality Change

During the study period, the TN concentration in Erhai Lake showed an increasing trend, and the interannual fluctuation of pollutant concentration was less affected by climate factors, while the monthly fluctuation was mainly positively correlated with the monthly precipitation. This result was because although the summer precipitation was higher, the pollutant concentration increased significantly due to the lower amount of water. The concentrations of pollutants are high in summer and low in winter. The average water temperature in summer is approximately 19–22 °C, which is conducive to the growth of phytoplankton, while the lower water temperature in winter inhibits the growth of phytoplankton. Additionally, the exchange capacity of water bodies is stronger in winter, and the concentration of pollutants is significantly reduced.
Human activities have a significant impact on water quality in the Erhai Lake basin, and there is a significant correlation between wastewater discharge and pollutant concentration. During the study period, the construction land area, GDP value, and population in the Erhai Lake basin showed significant increasing trends. As an important feature of the urbanization and economic development of Erhai Lake, the population and industrial agglomeration have a serious impact on the water supply environment with rapid economic development [28]. The discharge intensity of living and construction wastewater caused by the increase in the number of urban residents and the expansion of the urban area increased the number of backward facilities that pose great pressure on water quality protection. Industrial agglomerations mean there is an expansion in the production scale, and the increase in production will promote the discharge of a large amount of pollution, increasing the load pressure into the lake [29]. However, Dali’s tourism industry has developed rapidly in recent years. According to official statistics, in 2017, it received 42.22 million tourists from home and abroad, with a total tourism income of 64.775 billion yuan, values that were up 9.4% and 21.2% year over year, respectively [30]. The rapid development of tourism has resulted in the rapid increase in river basin pollution, which makes it difficult to improve the water quality of rivers entering the lake. Additionally, the rapid urbanization brought by the development of tourism facilities has led to an increase in urban building area, an increase in impervious underlying surfaces such as cement, and an acceleration of sewage entering the water body [24]. Spatially, human activities have different ways of interfering with the basin. In Dali city and the area around Erhai Lake in the south of the basin, human activities are mainly manifested in urban expansion, economic development, and tourism activities. In the northern part of the basin, the economic and population growth is slow, the intensity of regional agricultural production is increasing, the use of chemical fertilizers and pesticides is excessive, the utilization of livestock manure resources is low, and the contradiction of the low phosphorus utilization efficiency in the production process leads to the accumulation of surplus phosphorus in the soil or phosphorus that is moved through runoff, leaching, and erosion into the water body, which aggravates the eutrophication of the water body [31].

5.3. Future Work

This study comprehensively considers land-use type, water use structure, population, and GDP data to analyze the impact of human activities on the water environment, the results show that human activities have less impact on the volume of Erhai Lake but a greater impact on water quality. Wu et al. conducted an empirical analysis of 22 lakes in China and found that the intensity of human activities in the past 15 years has a significant positive correlation with the nutritional status of lakes [32]. This is consistent with the results of this study. Current research on the pollution of Erhai Lake is mostly focused on agricultural nonpoint source pollution. This study believes that economic development and tourism activities are also important factors influencing water pollution. Yang et al. also showed that the rapid development of population and social economy are the main factors affecting pollution in the Erhai Lake basin [33].
In this study, many factors were considered to evaluate the impact of human activities on the water environment of Erhai Lake, but the evaluation system of human activities was not constructed, and the analysis of the impact of human activities on the water environment was still in a semiquantitative state. On the other hand, the scope of human activities is wide, this paper only selected some socioeconomic factors and statistical data analysis, which may have a certain impact on the results.

6. Conclusions

In this study, the evolution of the Erhai Lake basin was analyzed in 2000–2019, through the comparison of water volume and water quality data with information on climatic conditions and human activities, as well as the reasons for the changes in the Erhai water environment. The main conclusions are as follows:
(1)
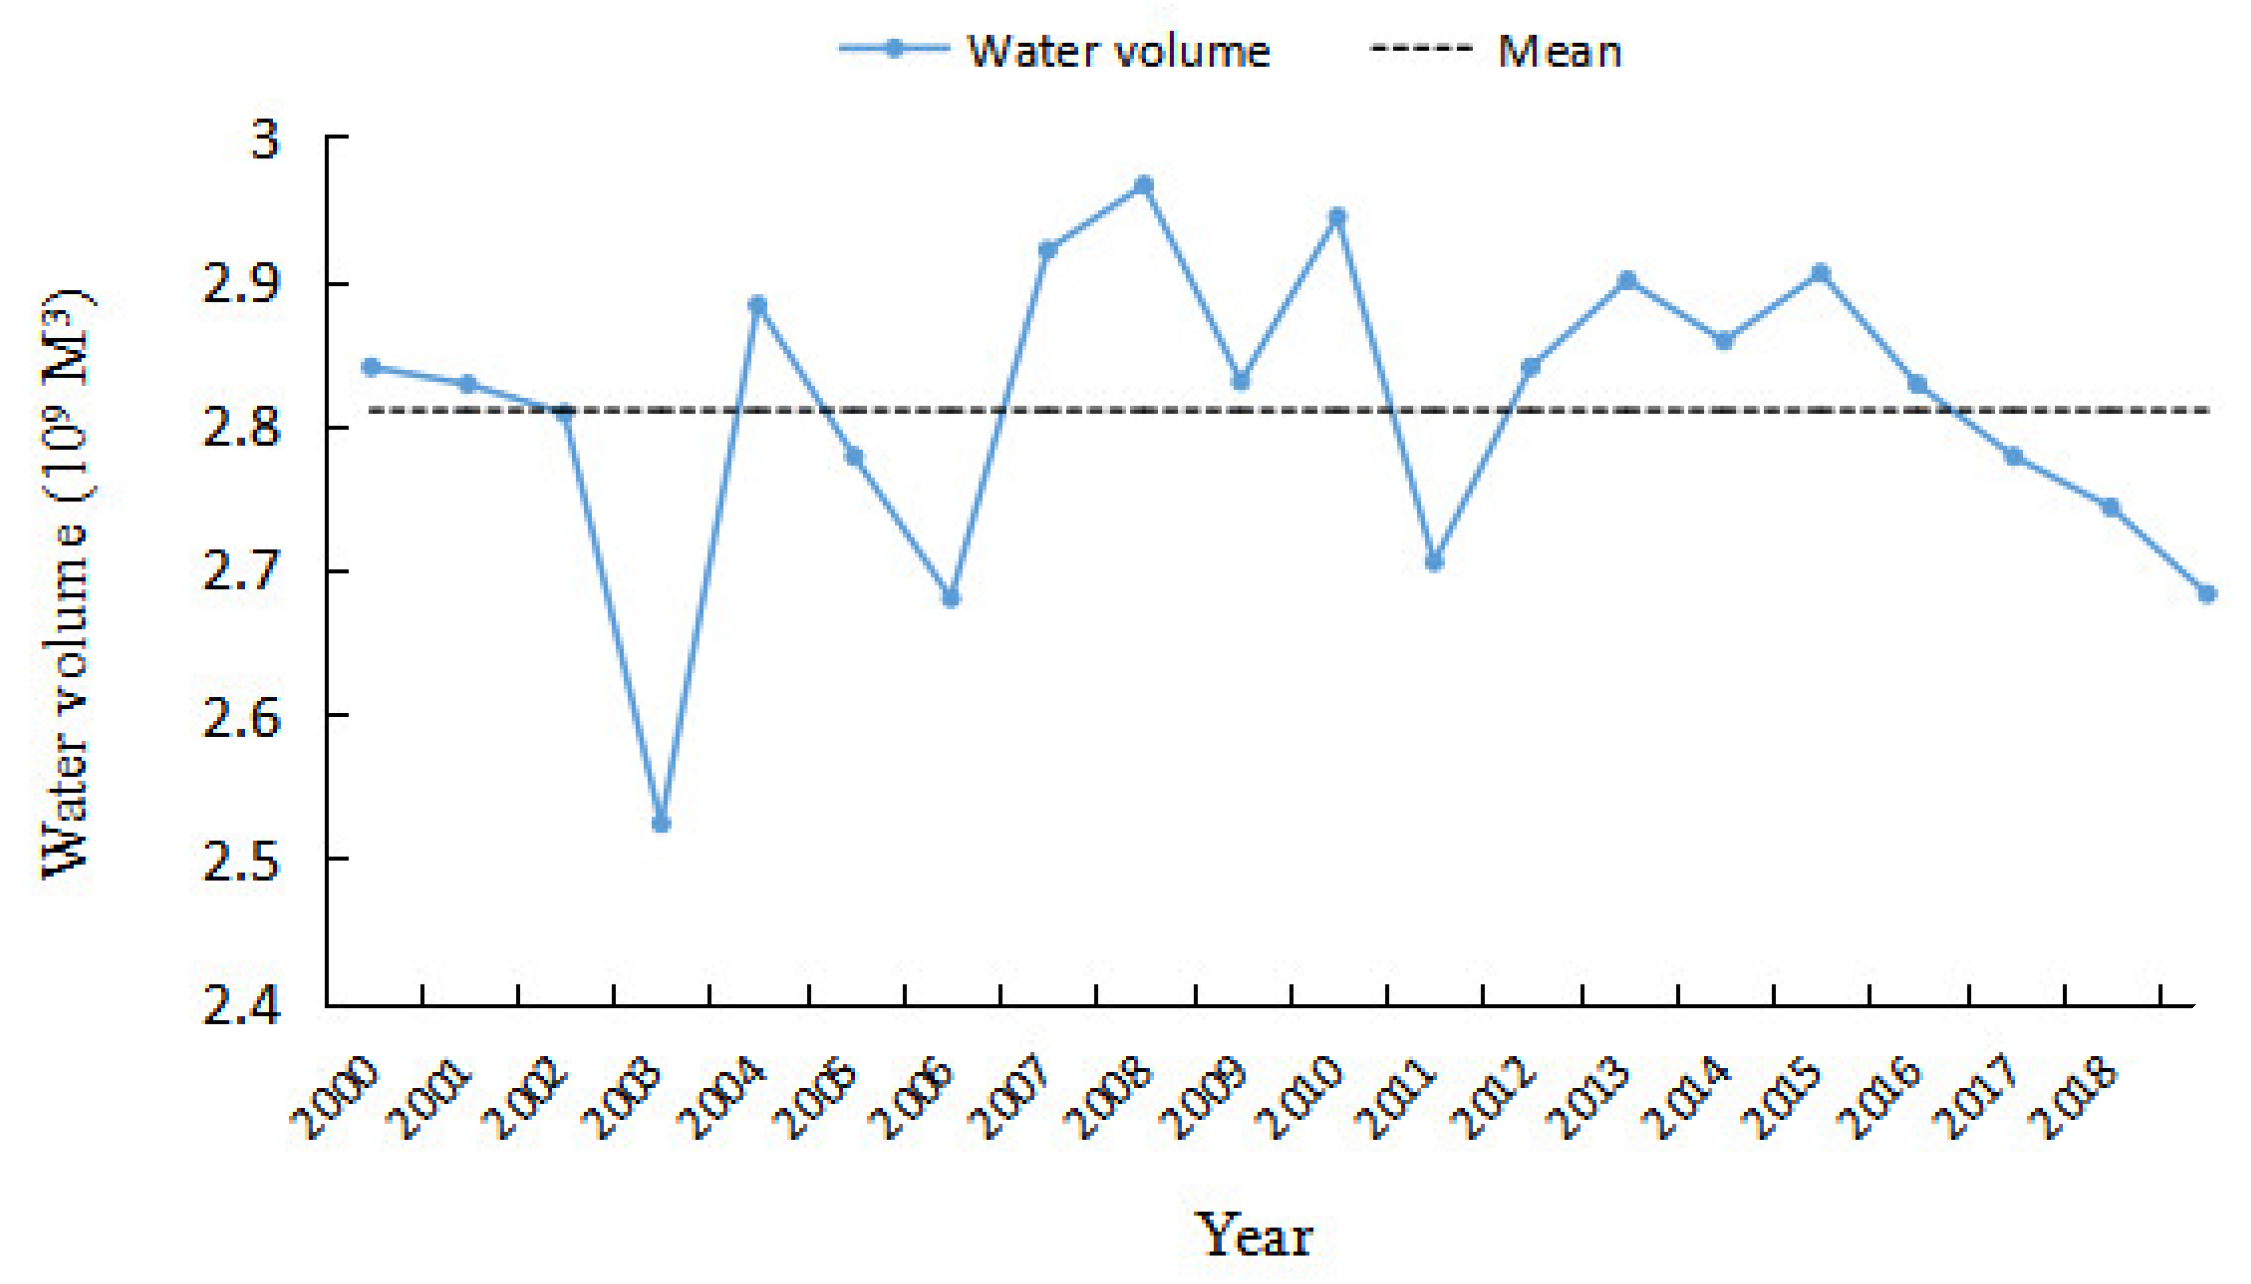
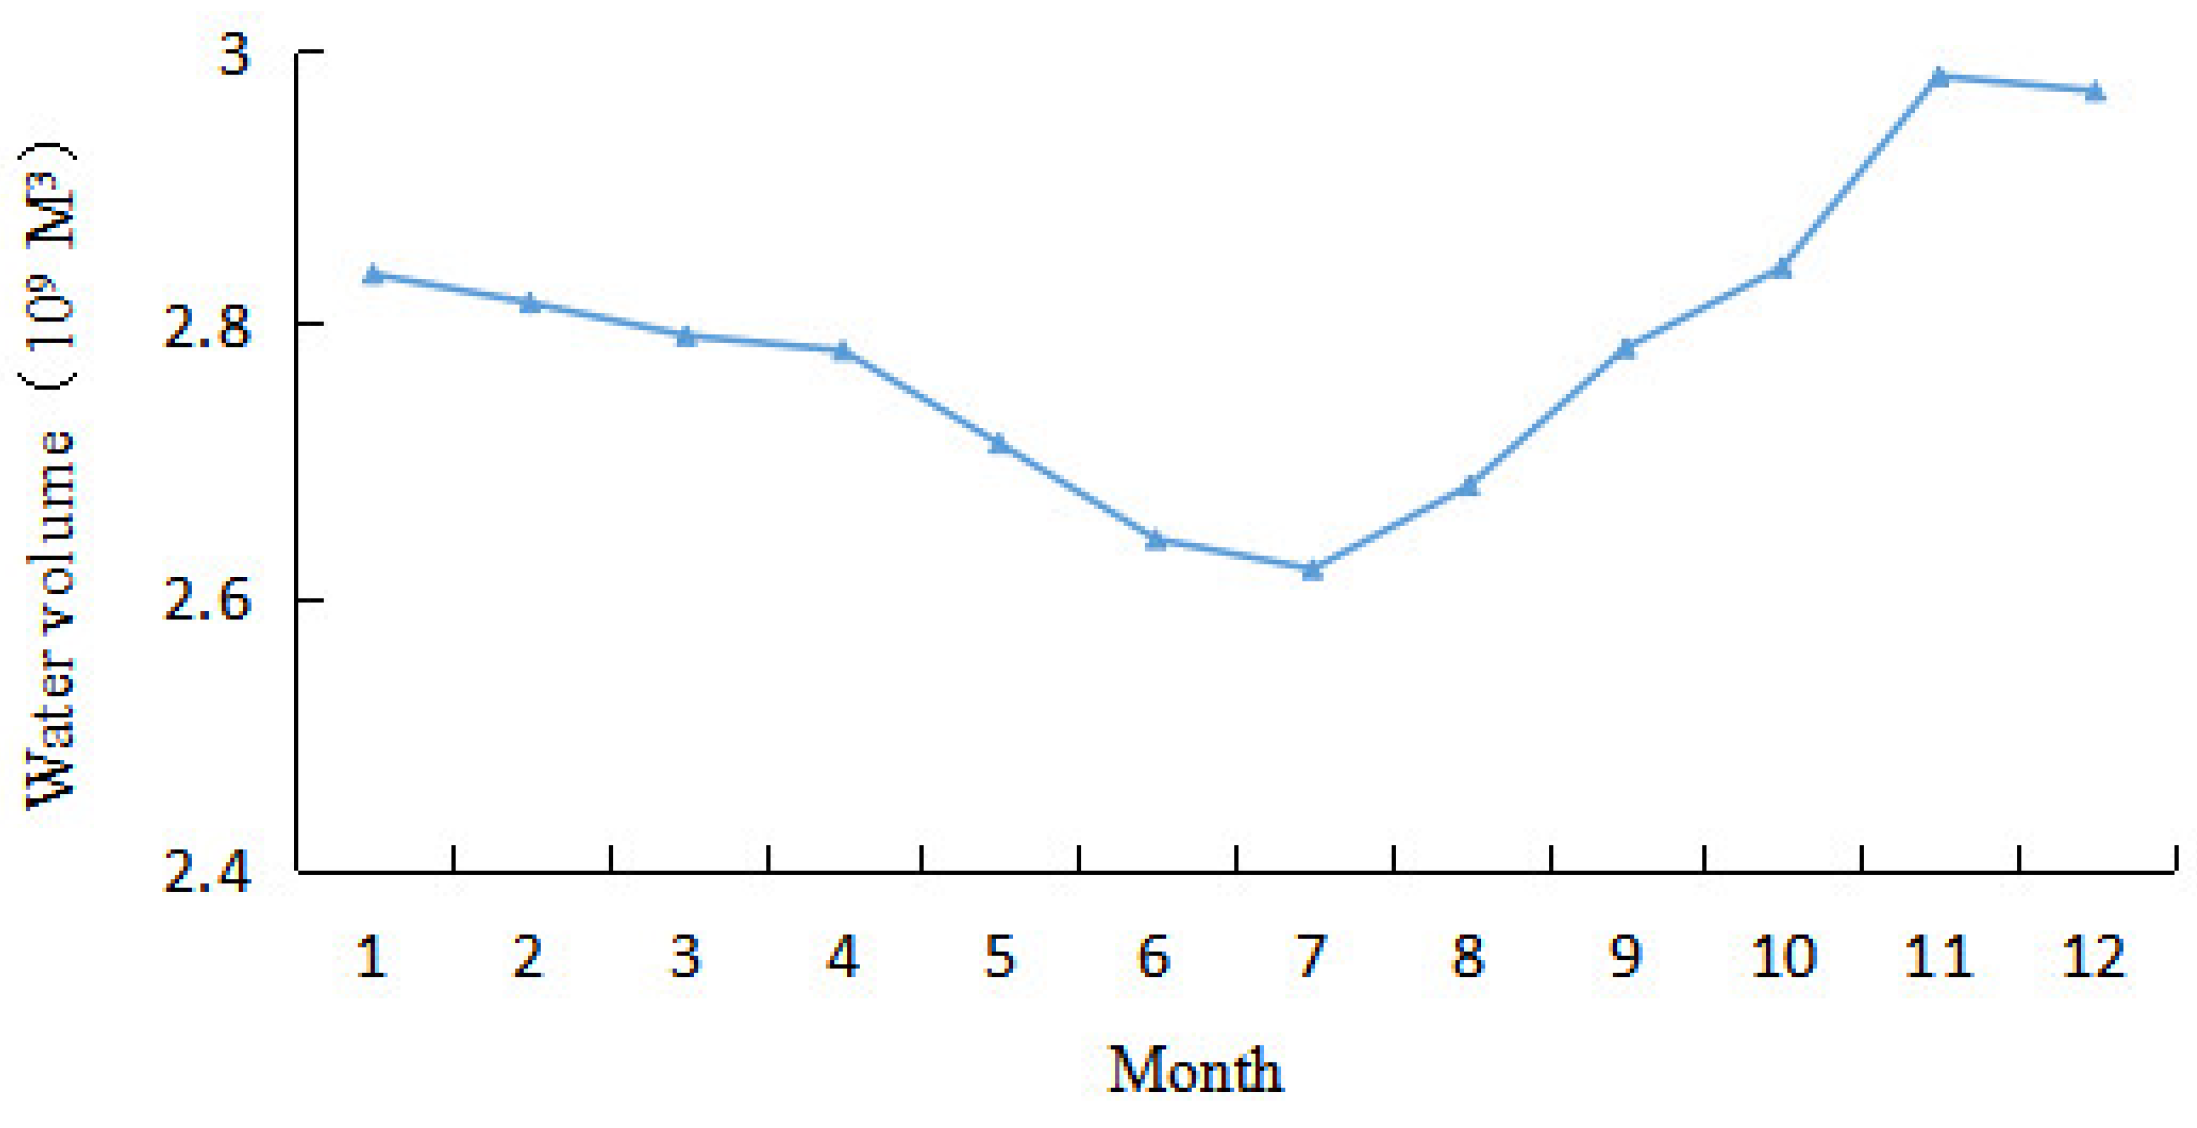
From 2000 to 2019, the water volume of Erhai Lake fluctuated greatly, showing an overall upward trend, with a change trend of 3.8 × 10⁶m3 year−1. The annual change in water volume showed a trend of first decreasing and then increasing. It increased from August to November and decreased from December to July.
(2)
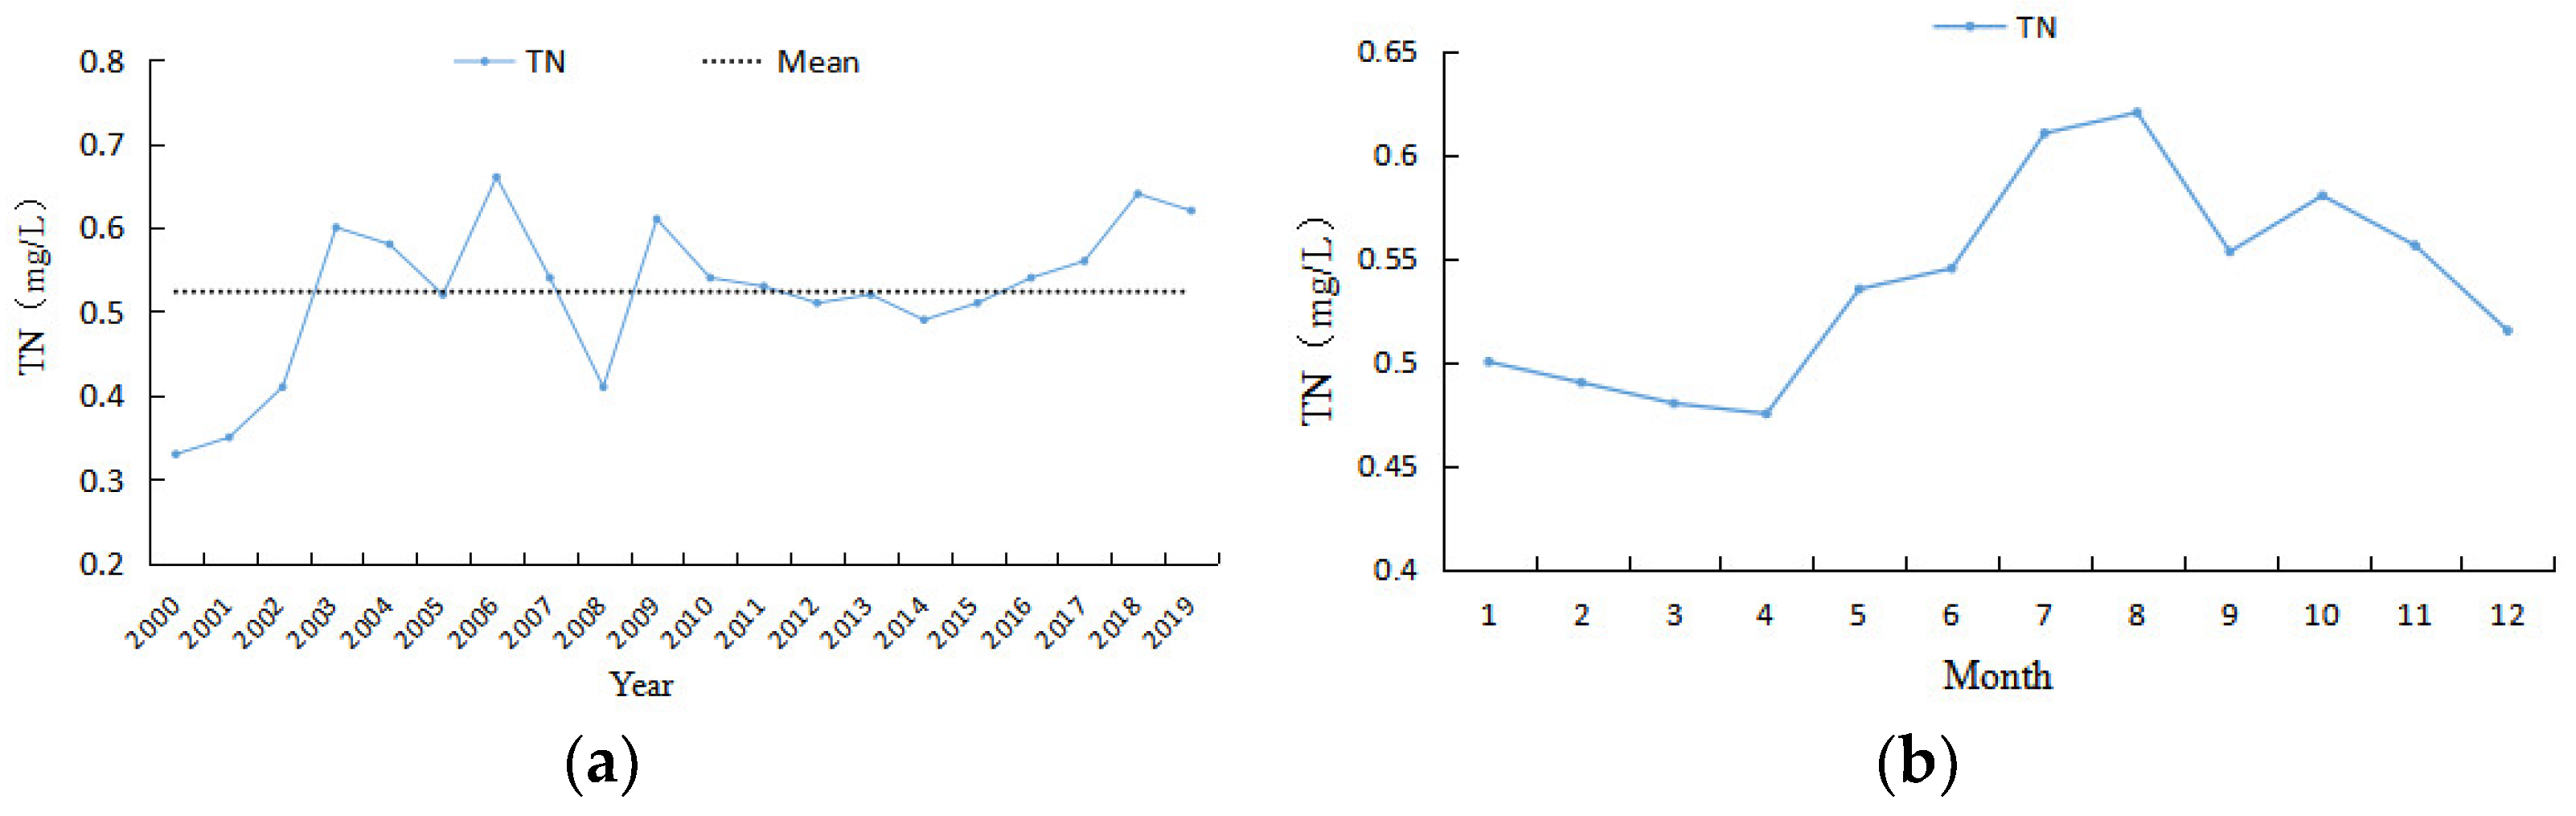
From 2000 to 2019, the TN concentration in Erhai Lake showed an increasing trend. Among the monthly variations, the nitrogen concentration reached the highest value in August, and the value from August to December was higher than that from January to July. Spatially, the concentration of TN was the highest in the north, followed by that in the south, and it was lowest in the middle. In the same section, the concentration of TN was higher at the nearshore point and lower at the lake center point.
(3)
The interannual variation in Erhai Lake water was mainly affected by annual precipitation, and there was a significant positive correlation between precipitation and water volume (p < 0.05), with a correlation coefficient of 0.577. Monthly water volume was affected by climate factors and river water regimes. During the study period, the water consumption of the Erhai Lake basin showed a downward trend, and the impact of water consumption on water volume was small.
(4)
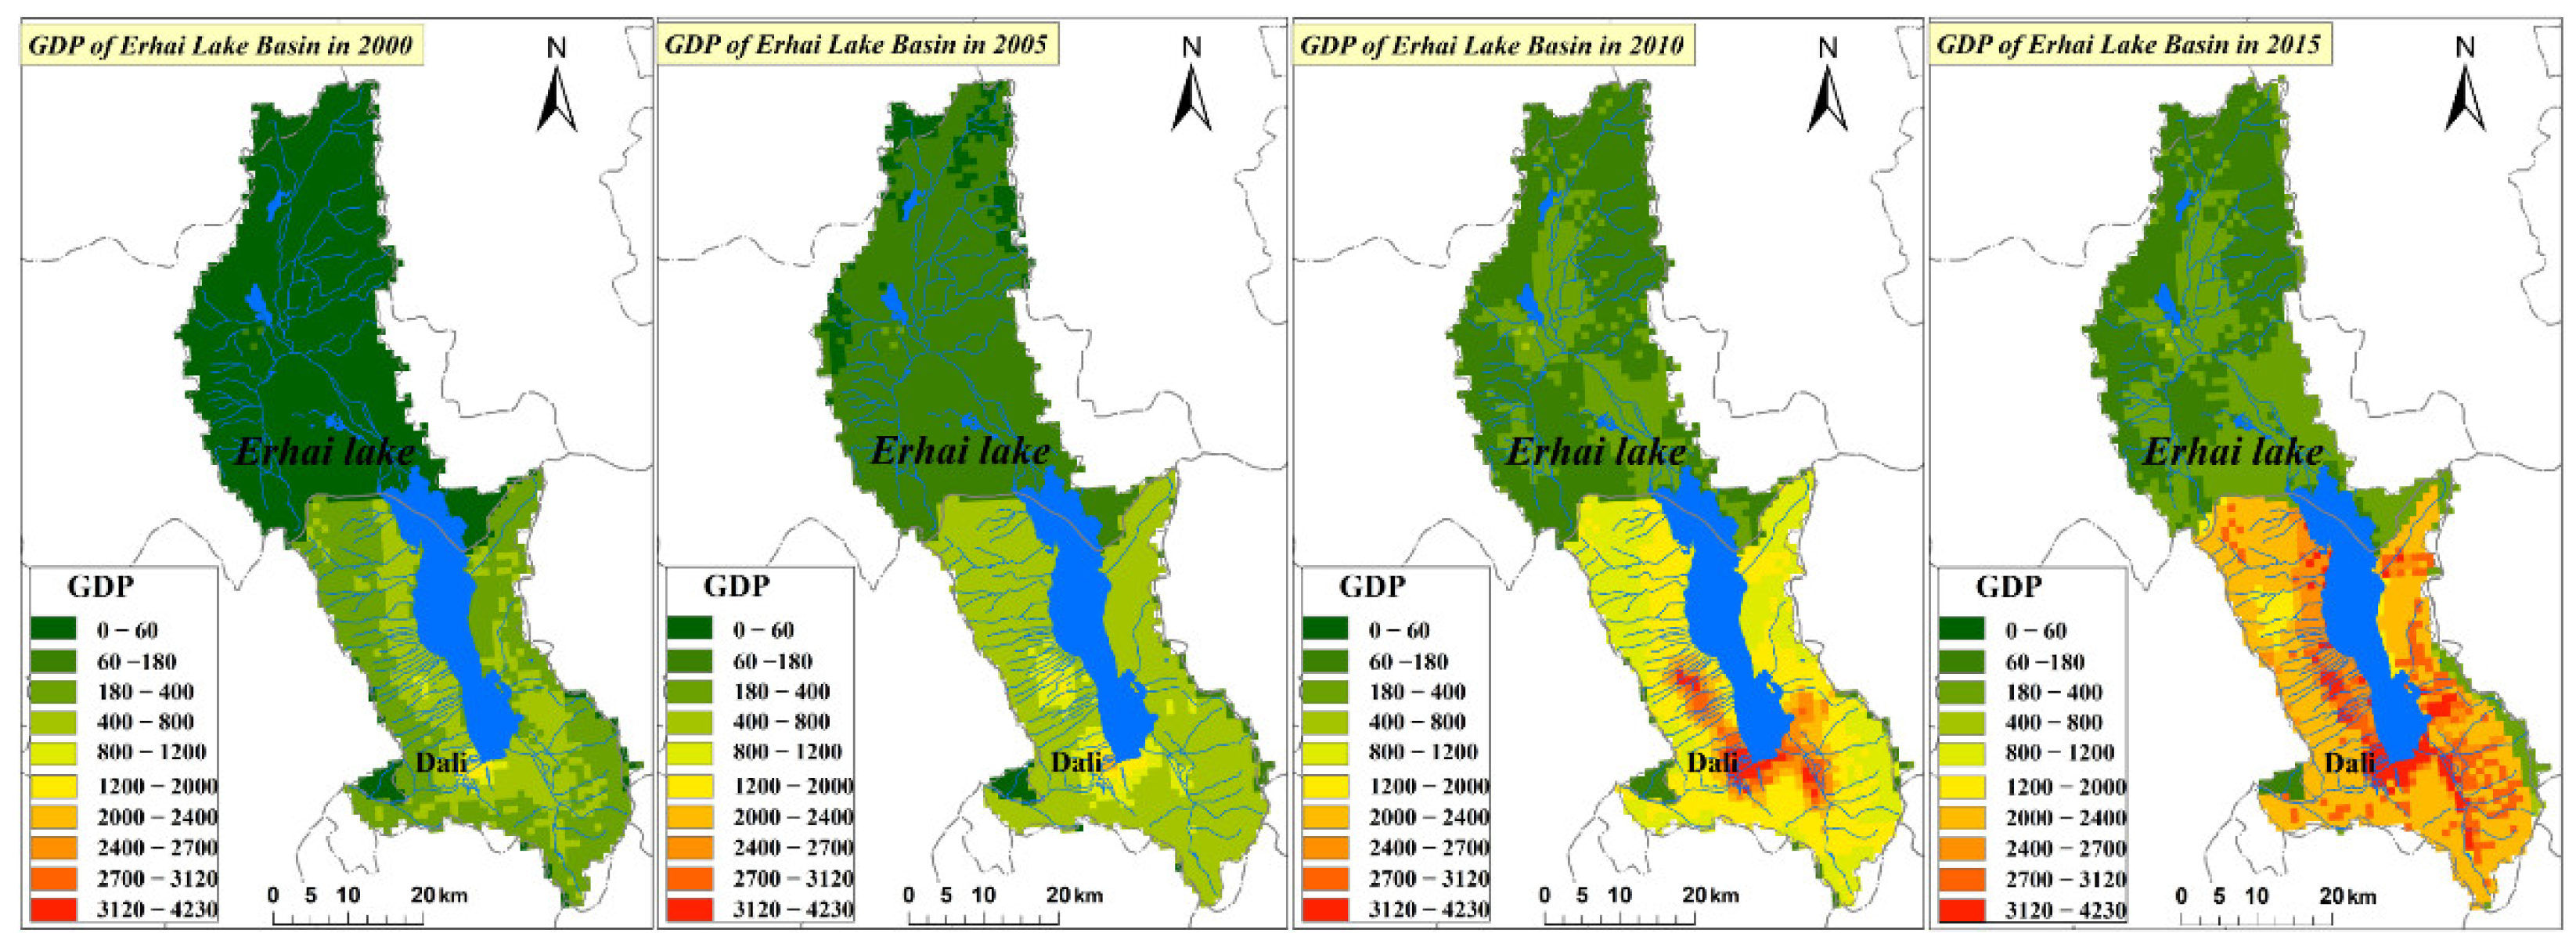
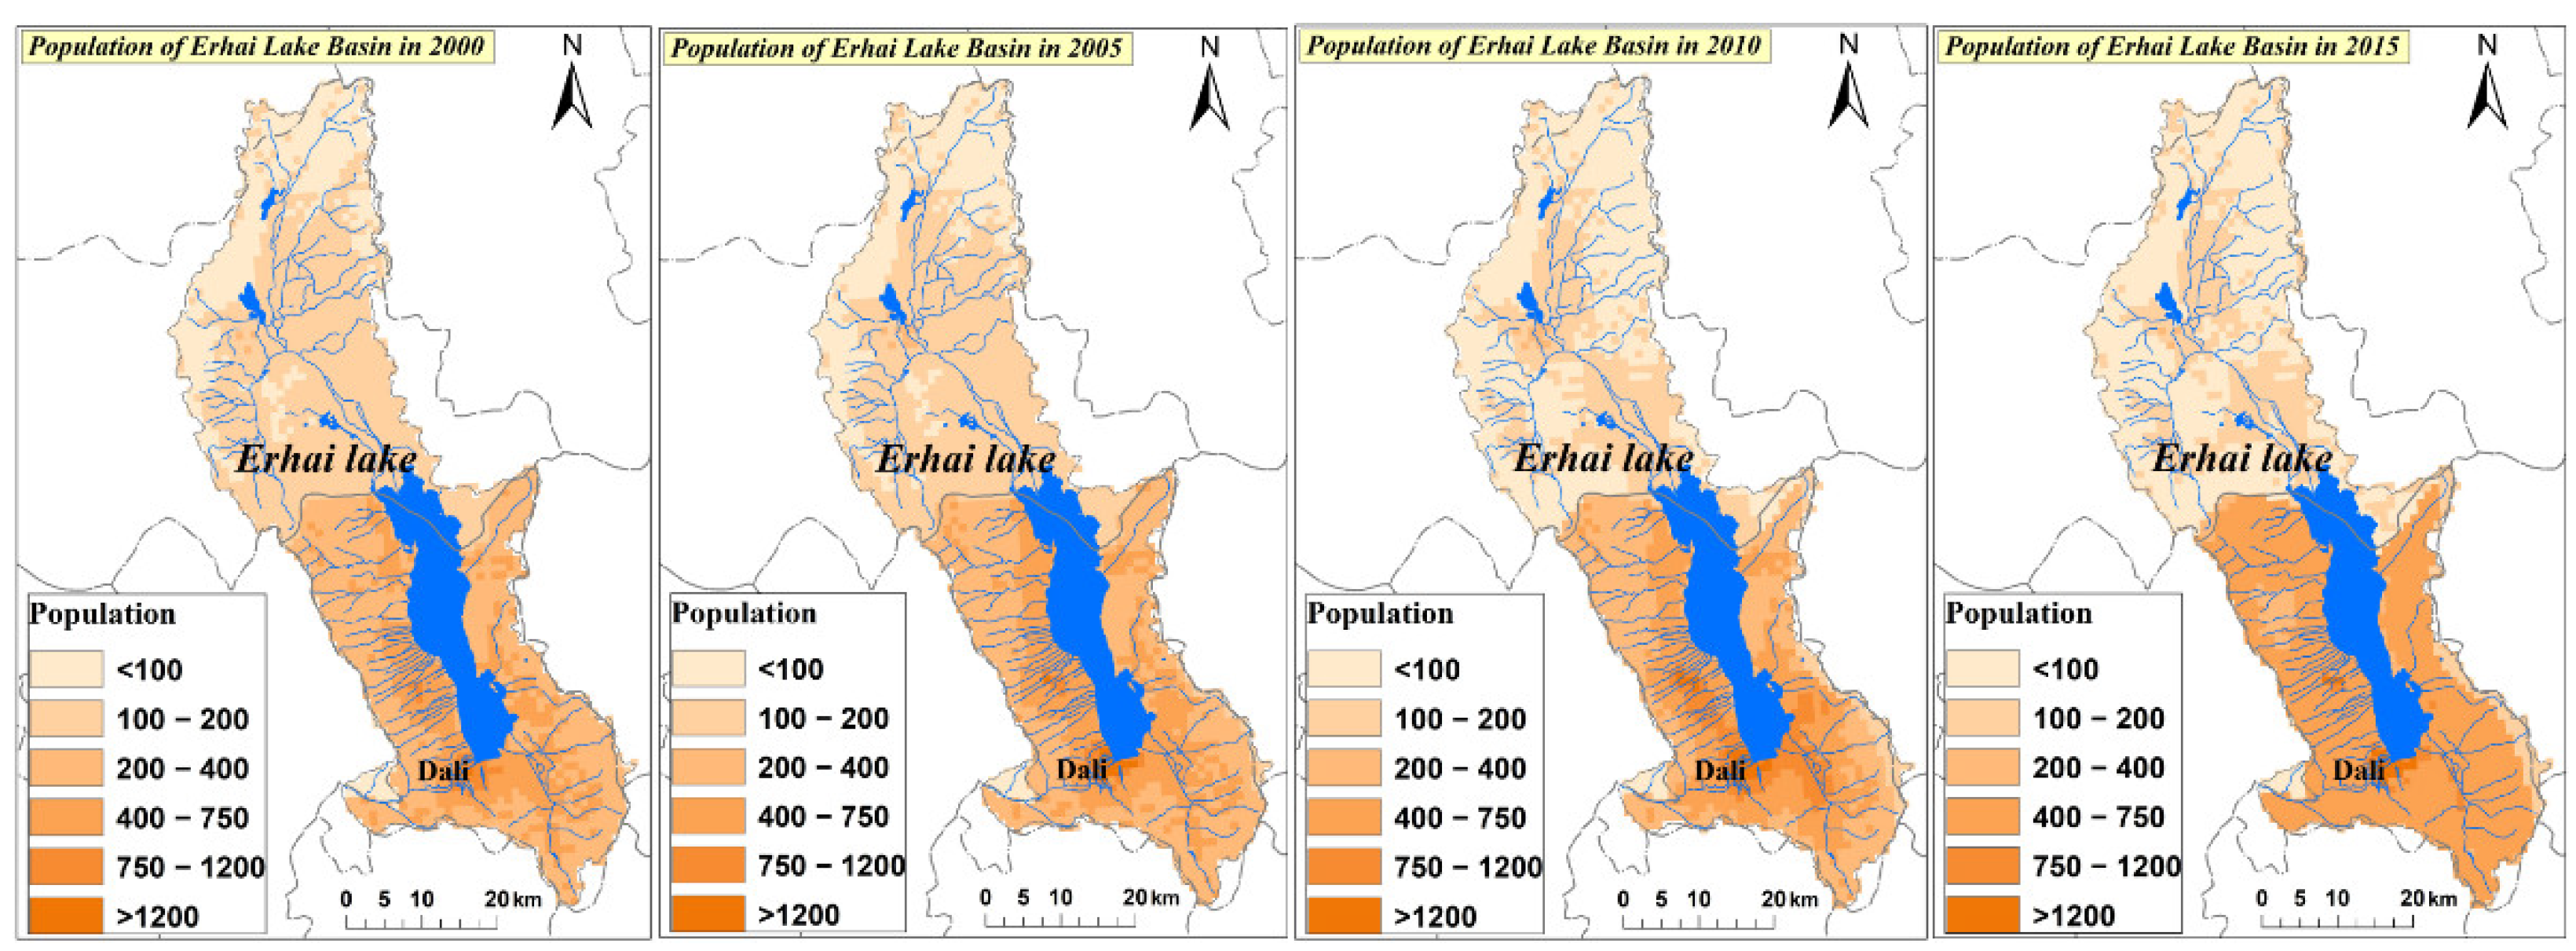
From 2000 to 2019, the change in land-use types in the Erhai Lake basin was mainly manifested by the increase in agricultural and construction land, the increase in agricultural land was mainly distributed in the north of the basin, the increase in construction land was distributed around Erhai Lake and Dali city, and the GDP and population increased significantly in the area where the construction land increased. In the north of the basin, human activities were mainly manifested as agricultural development, while in the south, human activities were mainly reflected by the acceleration of economic growth and urbanization.
(5)
The correlation between water quality change and climate factors was small, and the correlation between water quality change and human activities was large. In the northern part of the basin, agricultural nonpoint source pollution was the main factor affecting water quality, while in the southern part of the basin, economic development, accelerated urbanization, and tourism were the main factors affecting water quality.

Author Contributions

The authors undertook different tasks for this paper. L.Z. wrote the paper. Z.A. analyzed the data. X.C. provided direction to the research work. H.L. designed the research and revised the paper. All authors have read and agreed to the published version of the manuscript.

Funding

This research was financially supported by the National Key Research and Development Program of China (2018YFC1506500) and National Natural Science Foundation of China (41971402).

Institutional Review Board Statement

Not applicable.

Informed Consent Statement

Not applicable.

Data Availability Statement

Data developed in this study will be made available on request to the corresponding authors.

Acknowledgments

This research was financially supported by the National Natural Science Foundation of China (41971402) and the National Key Research and Development Program of China (2018YFC1506500).

Conflicts of Interest

The authors declare no conflict of interest. The funders had no role in the design of the study; in the collection, analyses, or interpretation of data; in the writing of the manuscript, or in the decision to publish the results.

References

  1. Yang, G.S.; Ma, R.H.; Zhang, L.; Jiang, J.H.; Yao, S.C.; Zhang, M.; Zeng, H.A. Lake status, major problems and protection strategy in China. Lake Sci. 2010, 22, 799–810. [Google Scholar]
  2. Bryant, M. Global climate change and potential effects on Pacific salmonids in freshwater ecosystems of southeast Alaska. Clim. Change 2009, 95, 169–193. [Google Scholar] [CrossRef]
  3. Li, L.; Wang, W. The response of lake change to climate fluctuation in north Qinghai-Tibet Plateau in last 30 years. J. Geogr. Sci. 2009, 19, 131–142. [Google Scholar]
  4. Hinkel, K.M.; Jones, B.M.; Eisner, W.R.; Cuomo, C.J.; Beck, R.A.; Frohn, R. Methods to assess natural and anthropogenic thaw lake drainage on the western Arctic coastal plain of northern Alaska. J. Geophys. Res. 2007, 112, F02S16. [Google Scholar] [CrossRef] [Green Version]
  5. Smith, L.C.; Sheng, Y.; Macdonald, C.M.; Hinzman, L.D. Disappearing Arctic Lakes. Science 2005, 308, 1429. [Google Scholar] [CrossRef] [Green Version]
  6. Ludwig, F.; Slobbe, E.V.; Cofino, W. Climate change adaptation and integrated water resource management in the water sector. J. Hydrol. 2014, 518, 235–242. [Google Scholar] [CrossRef]
  7. Destouni, G.; Asokan, S.M.; Jarsjö, J. Inland hydro-climatic interaction: Effects of human water use on regional climate. Geophys. Res. Lett. 2010, 37, 389–390. [Google Scholar] [CrossRef]
  8. Feng, L.; Han, X.X.; Hu, C.M.; Chen, X.L. Four decades of wetland changes of the largest freshwater lake in China: Possible linkage to the Three Gorges Dam? Remote Sens. Environ. 2016, 176, 43–55. [Google Scholar] [CrossRef]
  9. Xie, Z.; Huete, A.; Cleverly, J.; Phinn, S.; Qin, F. Multi-climate mode interactions drive hydrological and vegetation responses to hydroclimatic extremes in australia. Remote Sens. Environ. 2019, 231, 111270. [Google Scholar] [CrossRef]
  10. Siddique-E-Akbor, A.H.M.; Hossain, F.; Lee, H.; Shum, C.K. Inter-comparison study of water level estimates derived from hydrodynamic–hydrologic model and satellite altimetry for a complex deltaic environment. Remote Sens. Environ. 2011, 115, 1522–1531. [Google Scholar] [CrossRef]
  11. Wang, X.Q.; He, F.; Zhang, B. Study on the relationship between economic growth and environmental degradation of Lijiang cit. Geogr. Res. 2010, 29, 927–934. [Google Scholar]
  12. Sun, C.; Romero, L.; Joseph-Duran, B.; Meseguer, J.; Muñoz, E.; Guasch, R.; Martinez, M.; Puig, V.; Cembrano, G. Integrated pollution-based real-time control of sanitation systems. J. Environ. Manag. 2020, 269, 110798. [Google Scholar] [CrossRef] [PubMed]
  13. Zhao, M.; Cheng, W.M.; Zhou, C.H.; Li, M.C.; Wang, N.; Liu, Q.Y. GDP Spatialization and Economic Differences in South China Based on NPP-VIIRS Nighttime Light Imagery. Remote Sens. 2017, 9, 673. [Google Scholar] [CrossRef] [Green Version]
  14. Yang, X.C.; Yue, W.Z.; Gao, D.W. Spatial improvement of human population distribution based on multi-sensor remote-sensing data: An input for exposure assessment. Int. J. Remote Sens. 2013, 34, 5569–5583. [Google Scholar] [CrossRef]
  15. Zeng, C.Q.; Zhou, Y.; Wang, S.X.; Yan, F.L.; Zhao, Q. Population spatialization in China based on night-time imagery and land use data. Int. J. Remote Sens. 2011, 32, 9599–9620. [Google Scholar] [CrossRef]
  16. Ni, Z.K.; Wang, S.R.; Jin, X.C.; Jiao, L.X.; Li, Y.J. Study on the evolution and characteristics of eutrophication in the typical lakes on Yunnan-Guizhou Plateau. Acta Sci. Circumstantiae 2011, 31, 2681–2689. [Google Scholar]
  17. Wang, S.; Zhang, L.I.; Ni, L.; Zhao, H.; Jiao, L.; Yang, S.; Guo, L.; Shen, J. Ecological degeneration of the Erhai Lake and prevention measures. Environ. Earth Sci. 2015, 74, 3839–3847. [Google Scholar] [CrossRef]
  18. Shang, X.; Wang, X.; Zhang, D.; Chen, W.; Chen, X.; Kong, H. An improved SWATbased computational framework for identifying critical source areas for agricultural pollution at the lake basin scale. Ecol. Model. 2012, 226, 1–10. [Google Scholar] [CrossRef]
  19. Huang, H.J.; Wang, Y.P.; Li, Q.H. Climatic Characteristics over Erhai Lake Basin in the Last 50 Years and the impact on Water Resources of Erhai Lake. Meteorol. Mon. 2013, 34, 436–442. [Google Scholar]
  20. Li, Y.; Liu, H.B.; Lei, Q.L.; Hu, W.L.; Wang, H.Y.; Zhai, L.M.; Ren, T.Z.; Lian, H.S. Impact of Human Activities on Net Anthropogenic Nitrogen Inputs ( NANI) at Township Scale in Erhai Lake Basin. Environ. Sci. 2018, 39, 4189–4198. [Google Scholar]
  21. Wang, T.S.; Zheng, H. Analysis of Land Use and Landscape Pattern Change in Erhai Lake during Rapid Urbanization. Ecol. Econ. 2016, 32, 181–185. [Google Scholar]
  22. Ying, Y.Z.; Chu, Z.S.; Zhao, M.; Li, Z.K.; Ye, B.B.; Jin, X.C. Spatial and temporal changes in water quality in aquatic-terrestrial ecotone of Lake Erhai. China Environ. Sci. 2011, 31, 1192–1196. [Google Scholar]
  23. Yang, S.; Chen, X.; Lu, J.; Hou, X.; Xu, Q. Impacts of agricultural topdressing practices on cyanobacterial bloom phenology in an early eutrophic plateau lake, China. J. Hydrol. 2021, 594, 125952. [Google Scholar] [CrossRef]
  24. Sun, J.X.; Chen, J.; Huang, X.B. The bargain between subjects and rights negotiation in the tourism environmental governance issue of Erhai in Dali. Sci. Geogr. Sin. 2020, 40, 1468–1475. [Google Scholar]
  25. Zhang, Y.J.; Li, C.W.; Hu, B.B. Impact of a“source-sink” landscape pattern in an urbanized watershed on nitro⁃gen and phosphorus spatial variations in rivers: A case study of Yuqiao reservoir watershed, Tianjin, China. Acta Ecol. Sin. 2017, 37, 2437–2446. [Google Scholar]
  26. Ma, W.; Zhou, Y.; Su, J.G.; Jiang, R.C.; Hu, X.Q. Study on the hydrodynamic characteristics and transporation and diffusion of pollutants in Erhai lake. J. China Inst. Water Resour. Hydropower Res. 2021, 19, 1672–3031. [Google Scholar]
  27. Zhou, Z.D. Research on the calculation method of runoff of the Erhai ecological water demand and ecological needs. Annu. Meet. Yunnan Water Conserv. Soc. 2015, 6, 734–739. [Google Scholar]
  28. Xiao, Z.Y.; Shen, Z.C. The temporal and spatial evolution of population & industrial agglomeration and environmental pollution and the relevance analysis. J. Arid Land Resour. Environ. 2019, 33, 1–8. [Google Scholar]
  29. Verhoef, E.T.; Nijkamp, P. Externalities in urban sustainability: Environmental versus localization-type agglomeration externalities in ageneral spatial equilibrium model of a single-sector monocentric industrial city. Ecol. Econ. 2002, 40, 157–179. [Google Scholar] [CrossRef] [Green Version]
  30. Zhang, H.X. Analysis of Temporal and Spatial Changes of Total Nitrogen of Erhai Lake from 1985 to 2019. Environ. Sci. Surv. 2020, 39, 4–10. [Google Scholar] [CrossRef]
  31. Xiang, S.; Wu, Y.; Lv, X.J.; Gao, S.J.; Chu, Z.S.; Pang, Y. Characteristics and Spatial Distribution of Agricultural Non-Point Source Pollution in Erhai Lake Basin and Its Classified Control Strategy. Res. Environ. Sci. 2020, 33, 2474–2482. [Google Scholar]
  32. Wu, F.; Zhang, J.Y.; Deng, X.Y.; Ling, Y.Z. Influencing factors of lake eutrophication in China—A case study in 22 lakes in China. Ecol. Environ. Sci. 2012, 21, 94–100. [Google Scholar]
  33. Yang, K.L.; Ge, X.Y.; Dong, L.M. The Research between Social-Economic Development and Pollution Control of Erhai Lake. Ecol. Econ. 2011, 12, 37–40. [Google Scholar]
Figure 1. Location of the Erhai Lake basin and Erhai.
Water 13 01362 g001
Figure 2. Changes in the water volume of Erhai Lake in December from 2000 to 2019.
Water 13 01362 g002
Figure 3. Average monthly water volume change in Erhai Lake from 2000 to 2019.
Water 13 01362 g003
Figure 4. (a) Annual and (b) monthly TN concentration in Erhai Lake, from 2000 to 2019.
Water 13 01362 g004
Figure 5. TN concentration of Erhai Lake and its sections in the north-south direction from 2002 to 2019.
Water 13 01362 g005
Figure 6. (a) Annual and (b) monthly precipitation in Erhai Lake, from 2000 to 2019.
Water 13 01362 g006
Figure 7. (a) Annual and (b) monthly temperature in Erhai Lake, from 2000 to 2019.
Water 13 01362 g007
Figure 8. Spatial distribution of Erhai Lake GDP from 2000 to 2015 (unit: 104 yuan).
Water 13 01362 g008
Figure 9. Spatial distribution of the population in Erhai Lake from 2000 to 2015 (unit: 104).
Water 13 01362 g009
Figure 10. Water use structure and trend for Erhai Lake from 2007 to 2019.
Water 13 01362 g010
Figure 11. The structure and trend of wastewater discharge in the Erhai Lake basin from 2007 to 2019.
Water 13 01362 g011
Table 1. Data and sources used in the study.
TypeTimeProductSource
GlobeLand302000, 2020Global land cover with 30 m spatial resolutionhttp://www.globallandcover.com/, accessed on 9 October 2020.
Meteorological data2000–2019Monthly precipitation and average temperature at meteorological stationshttp://data.cma.cn/, accessed on 9 October 2020.
Statistical data2007–2019December water volume, water use structure, wastewater discharge datahttp://www.dali.gov.cn/dlrmzf/c102607/common_list.shtml, accessed on 9 October 2020.
TN concentration2000–2019Annual and monthly TN concentrationhttp://www.cnemc.cn/, accessed on 9 October 2020.
GDP, population spatial distribution data2000, 2005, 2010, 20151 km spatial resolutionhttp://www.resdc.cn/Default.aspx, accessed on 9 October 2020.
Table 2. Correlation analysis factor.
Factor aFactor b
Annual precipitationwater volume
Annual average temperaturewater volume
Monthly precipitationwater volume
Monthly average temperaturewater volume
Annual precipitationTN concentration
Annual average temperatureTN concentration
Monthly precipitationTN concentration
Monthly average temperatureTN concentration
water consumptionwater volume
Table 3. Correlation coefficients of climatic factors, water volume, and pollutant concentration of Erhai Lake.
Water VolumeTN Concentration
Annual precipitation0.577 (p < 0.01)−0.09
Annual average temperature−0.113 −0.049
Monthly precipitation−0.759 (p < 0.01)0.644 (p < 0.05)
Monthly average temperature−0.841(p < 0.01)0.372
Table 4. Land-use change in the Erhai Lake basin from 2000 to 2020 (km2).
2020
2000Land-use typeCultivated landForestsGrasslandWaterConstruction landSum
Cultivated land49,992.752343.332576.43215.01682261,949.52
Forests3666.33114,568.656472.7166.061921.59126,695.34
Grassland6253.296825.5126,571.0612.51206141,723.37
Water163.53300.6989.8225,536.0694.1426,184.24
Construction land2595.15134.91117.4524.9310,180.7113,053.15
Sum62,671.05124,173.0935,827.4725,854.5721,079.44269,605.62
Table 5. Correlation coefficient between different water consumption and water volume.
TotalAgriculturalLivingIndustrialEco-Environmental Supplemental
Water volume−0.220.163−0.324−0.126−0.658 (p < 0.05)
Publisher’s Note: MDPI stays neutral with regard to jurisdictional claims in published maps and institutional affiliations.

