An Innovative Approach to Determine Coastal Scenic Beauty and Sensitivity in a Scenario of Increasing Human Pressure and Natural Impacts due to Climate Change


 ,
,  and
and 
Abstract
1. Introduction
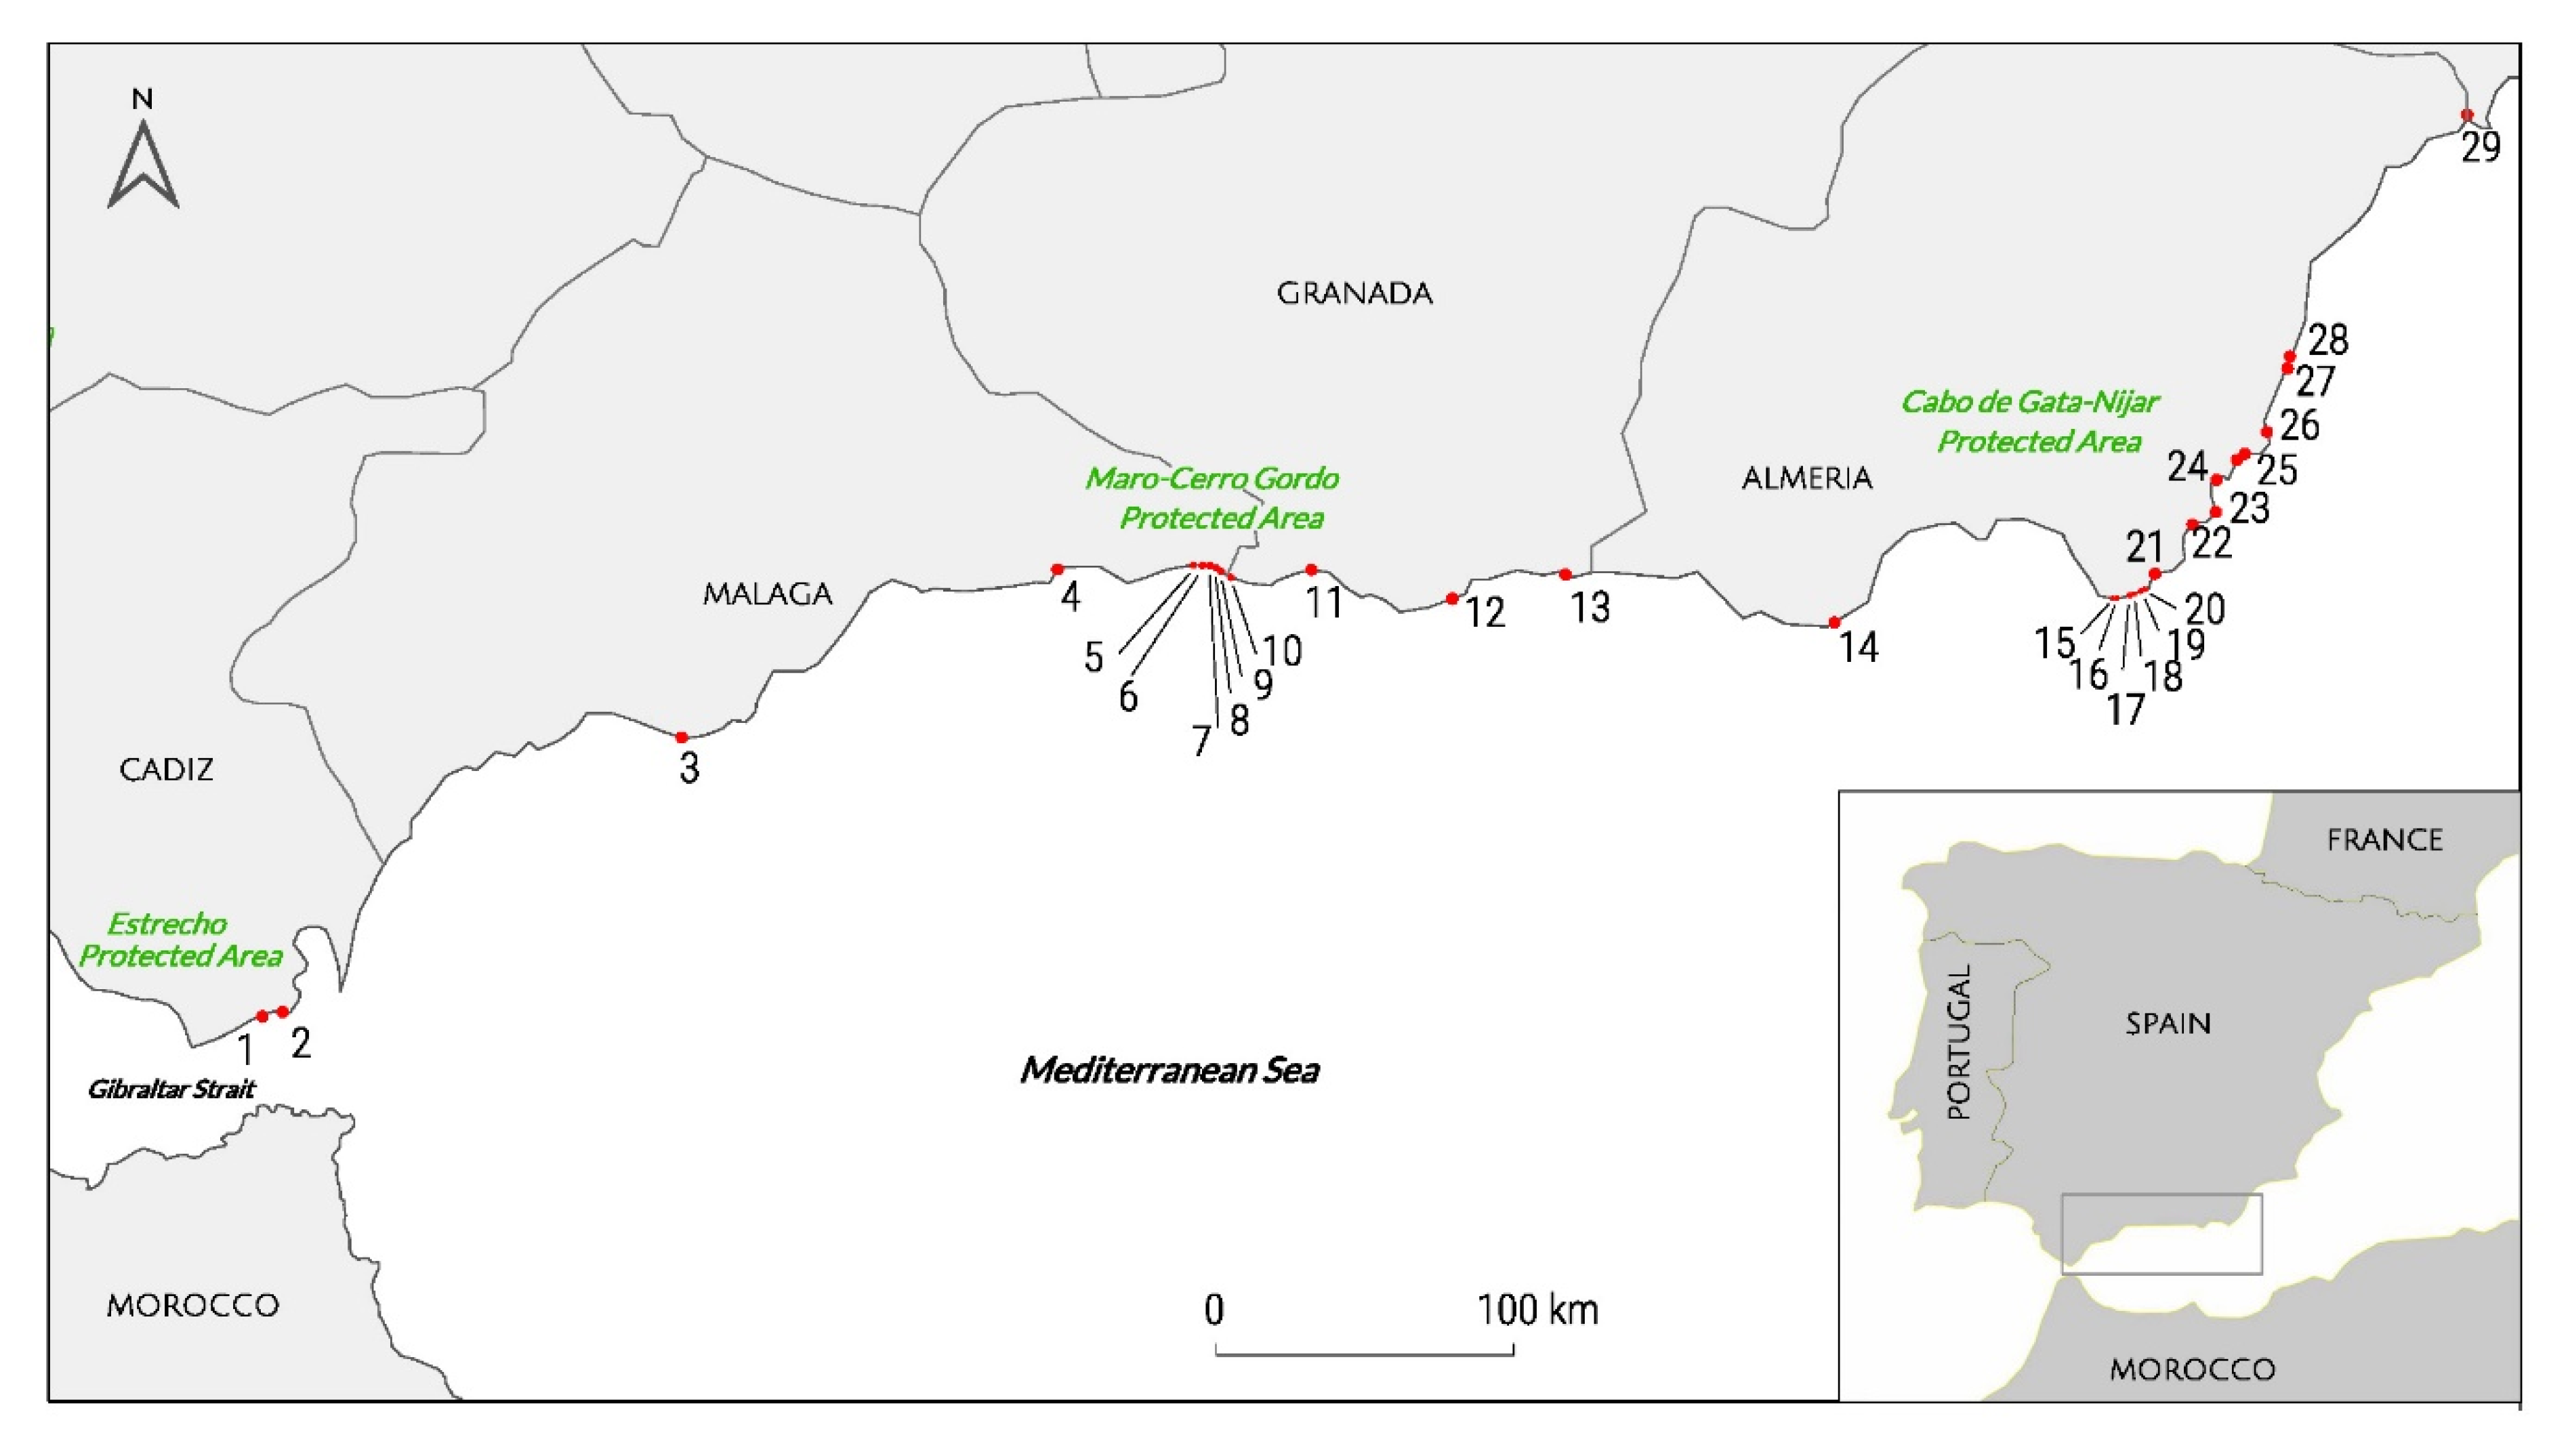
2. Study Area
3. Methods
3.1. Coastal Landscape Determination and Enhancement
3.2. Determination of Scenic Sites Sensitivity Processes
- -
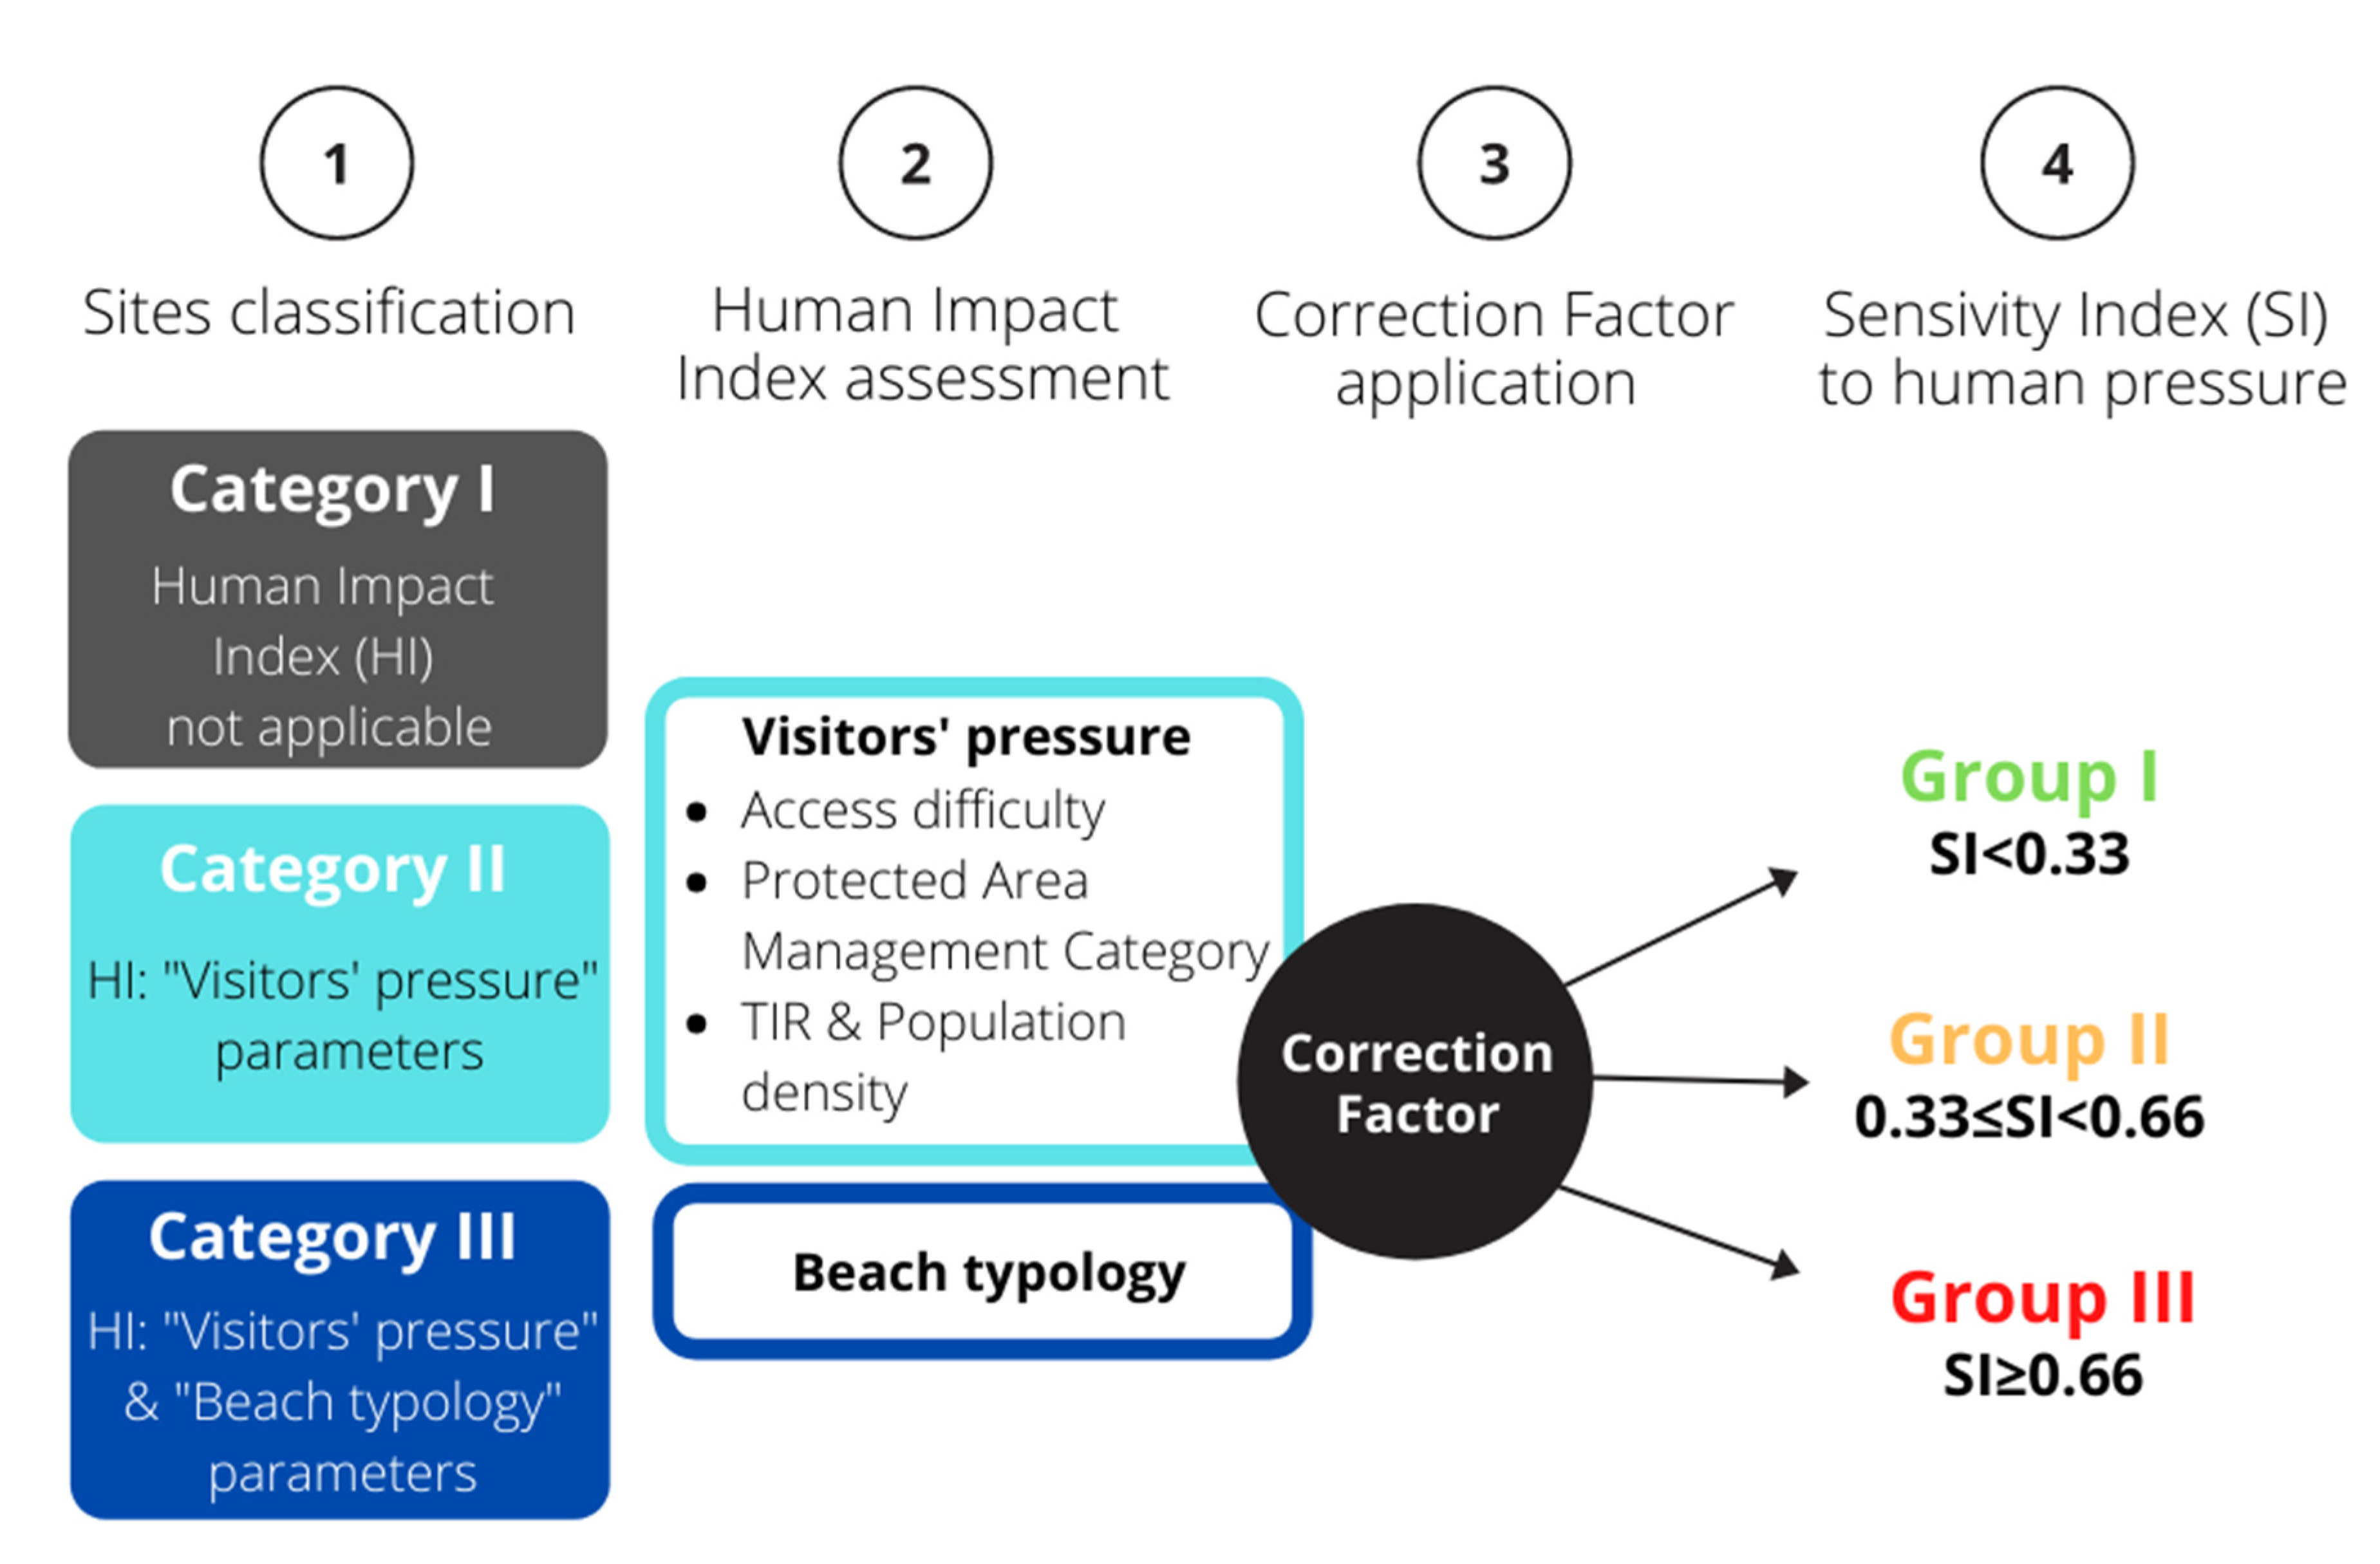
- In a first step, the sites investigated were divided into 3 categories according to their own physical characteristics (Figure 5).
- -
- In a second step, an “Erodibility index” (EI) was proposed in order to calculate the level of sensitivity to natural processes of sites belonging to each category, Table 2.
- -
- In a third step, a “Correction Factor” (CF) was applied to predict future relevance of energetic factors in a Climate Change scenario.
- -
3.2.1. Determination of Categories Concerning Natural Processes
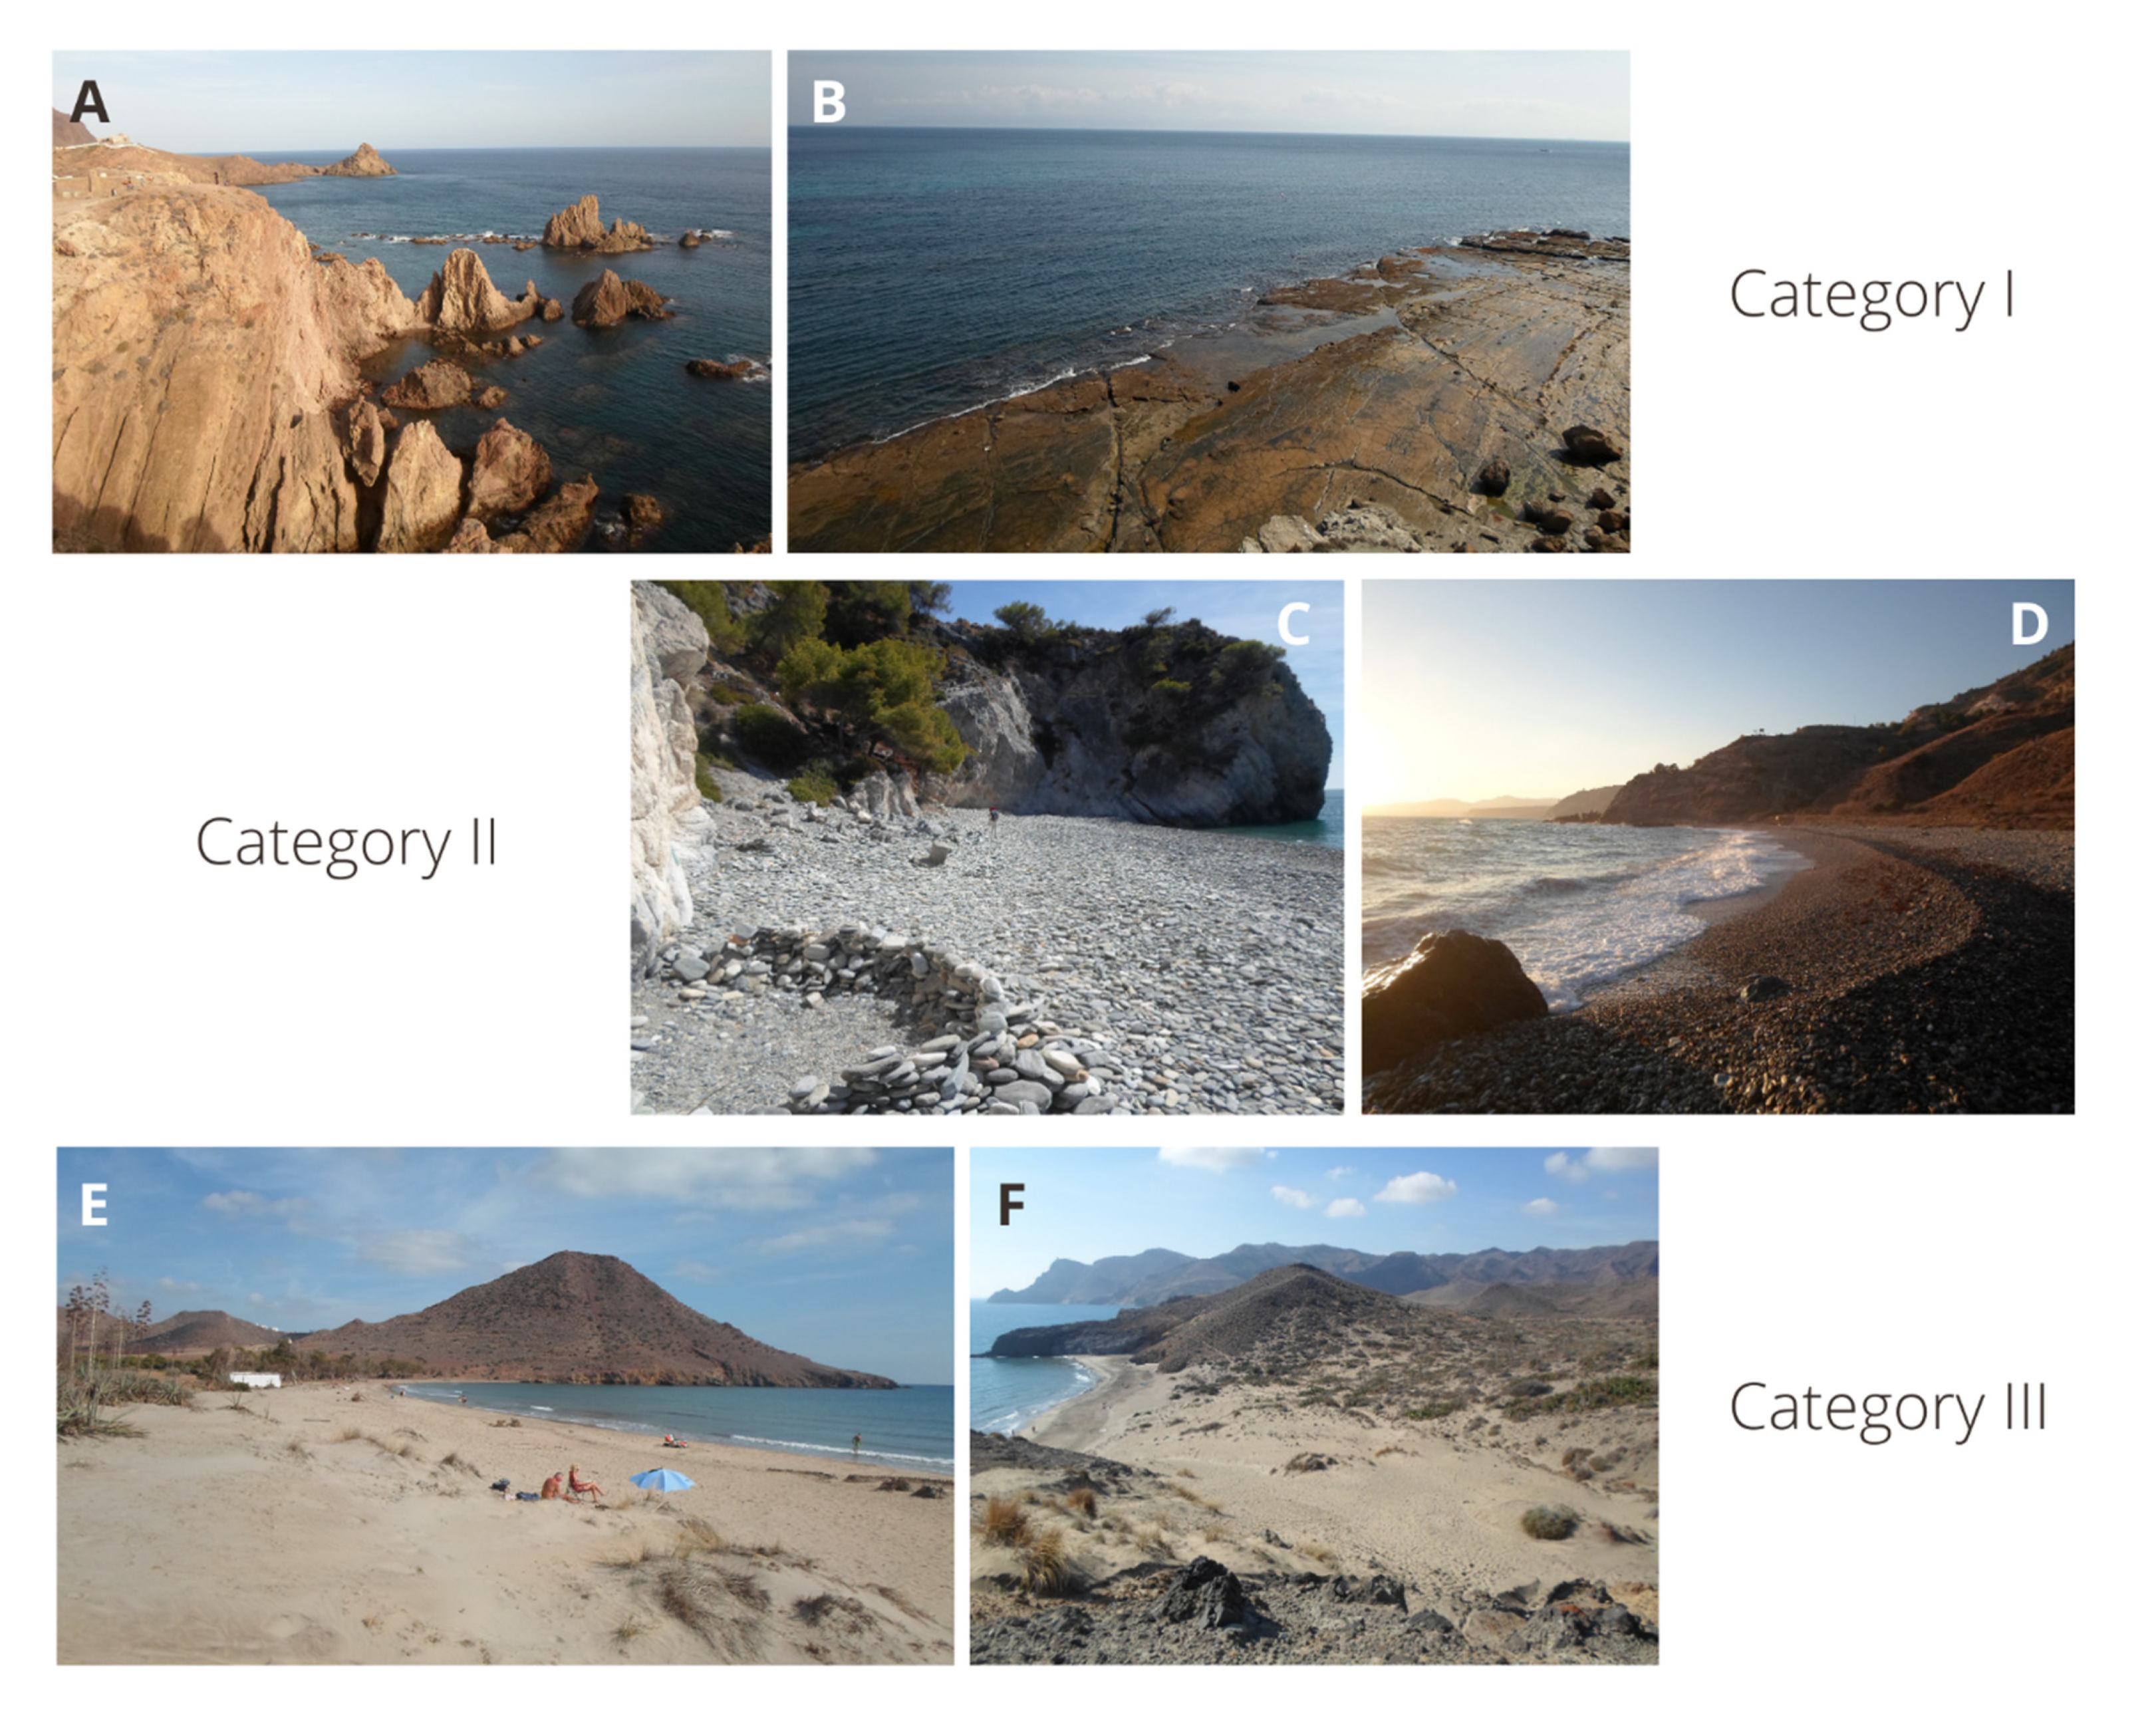
- Category I. “No sensitive” sites (neither “Beach face” or “Dunes” parameters are present), e.g., Arrecife de las Sirenas at Cabo de Gata in Almeria province (Figure 6A) or rocky shore platform close to Ensenada del Tolmo at Gibraltar Strait in Cadiz province, Andalusia, Spain (Figure 6B). No further investigation regarding their sensitivity to natural processes is required.
- Category II. “Sensitive” sites that show “Beach face” but no “Dunes” parameters, e.g., Cantarrijan (Figure 6C) or pebble beaches, such as Cala del Pino (Figure 6D), both in the Maro-Cerro Gordo protected area in Granada province (Andalusia, Spain). To estimate each site’s tradability value, the “Beach face” parameter is considered by taking into account beach width (as a multiple of the Imminent Collapse Zone, ICZ), sediment grain size and rock shore platform (width and location, Table 3).
- Category III. “Very sensitive” sites with “Beach face” and “Dunes” parameters (points 4–6 and 10; CSES), e.g., Los Genoveses or Barronal (Figure 5 and Figure 6E,F), Almeria Province, Andalusia, Spain. The Erodibility Index is calculated by considering 2 sub-indexes: (i) “Beach face” (as above), and “Dunes” parameters, the latter considers dune height, width, vegetation cover and presence of washovers (Table 4). Sites with only remnants of dunes will be not considered as Category III (rated 2; point 10).
3.2.2. Determination of the Erodibility Index
- (a)
- “Beach face” parametersIn order to semiqualitatively determine erodibility of sites classed in Category II, the following 4 physical parameters (see details in Table 3 and Figure 5) were chosen since the presence/absence and characteristics of these parameters determine the erodibility of a beach environment.
- (1)
- Dry beach width as a multiple of the ICZThe ICZ is the area subject to imminent erosion, adjacent to the coastline, within a landward distance equal to 10 feet (3 m) plus five times the average annual erosion trend [48]. Predictions of the future coastline position can be based on coastal changes which have occurred over recent decades [48]. In detail, according to [49,50], shoreline position records calculated for medium- (10–60 years) or long-term (>60 years) time spans, usually by means of aerial photos and satellite images, are needed to derive a reliable trend because the longer is the investigated time span the lower is the effect of seasonal variations and the influence of individual storms on shoreline evolution [51,52].
- (2)
- Sediment Grain SizeThe size of gravel and boulders restricts their transport and hence a boulder or a cobble coast is much more stable than a sandy beach [53]. In this paper, assessment values regarding sediment size relevance were modified from [54]. A rate of 3 refers to the coexistence of sediments ranging from fine sand to pebbles and, at places, to the presence of a “seagrass berm”, a common feature composed by Posidonia’s debris on Mediterranean beaches.
- (3,4)
- Rocky shore width and locationIs common to observe a rocky shore platform at the base of most cliffs or in front of many beaches, at about the mid-tide elevation location; this form is also called wave-cut platform or wave-cut bench. Such surfaces may measure from a few metres to hundreds of metres [55]. They are the results of long erosion processes and, at the same time, represent a natural defence for beaches, dissipating wave energy and reducing cliff’s recession rates [55,56,57]. Two parameters were chosen to assess the resilience of rock-shore platforms:
- (i)
- WidthUnderstanding the relationship between platform width and exposure of wave energy is complex [53]. The lack of a clear relationship reflects the strong influence that geology has in determining morphological characteristics. However, it is clearly demonstrated that increasing width would attenuate wave energy and, hence, reduces back beach/dune erosion rate. Trenhaile [58] considers that the width of rocky shore is determined by the intensity of the erosional processes, the resistance of the rocks, and the length of time that the processes have operated. Width values presented herein were modified from [58].
- (ii)
- LocationAccording to its location, e.g., in the foreshore or dry beach, the rocky shore effects on wave energy is different; in this case the values proposed by [56] were considered.
- (b)
- “Dunes” parametersDunes constitute natural sea defence, and a synergy exits between them and the beach, the dunes acting as a sediment reservoir to sustain the natural dynamic equilibrium between erosion and accretion processes. They also constitute a relevant aesthetic component in scenery assessment. Thus, in order to determine the erodibility of sites with beach and dunes parameters (Category III), 8 physical parameters were chosen and divided into 2 subindex categories: 4 “Beach face” parameters (previously described for Category II) and 4 “Dunes” parameters (Table 4 and Figure 6).
- (1)
- Mean Dune HeightThis was evaluated by considering dune crest height—classified following the range proposed by Gracia et al. [59], from embryo dunes lower than 1 m height (rated 5) to a system superior to 6 m (rated 1).
- (2)
- Mean Dune WidthClassified following the values proposed by Gracia et al. [59], width ranging from <25 m (rated 1) to >100 m (rated 5). This parameter can be evaluated during field surveys or detailed available topographic maps/models.
- (3)
- Vegetation Succession Continuity
- (4)
- Percentage of washoversDune ridge continuity is often interrupted by washover fans that constitute hot spots sensible to coastal erosion and are linked to washover processes that can greatly affect the capacity of resilience of this system; in fact, if the dunes are eroded or fragmented, their resilience and storm-protection function are greatly dismounted or even totally lost [63,64,65].
3.2.3. Determination of the “Correction Factor” for Natural Processes
- (a)
- Forcing variables
- (1)
- Waves’ characteristics
- (i)
- Significant Wave HeightThis is traditionally defined as the average wave height (Hs, from trough to crest) of the highest third (33.33%) of the waves in a given sample period, and in this paper it will be assessed following the model and intervals used by Jones and Monismith [67]. At the global level, the European Centre for Medium-Range Weather Forecasts (ECMWF) [68] provides a good database service with real-time and archive forecasts, analyses, climate reanalyses, reforecasts and multimodel datasets. In Spain, for example, wave data along the coast can also be obtained from the official online website “Puertos del Estado” (“Ports of the State”) [69] through virtual buoys and stations collecting real-time weather [64]. Autonomous systems for specific regions, such SAPO –Autonomous Wave Forecast System of Balearic Islands [70]—can be used too for assessing this parameter.
- (ii)
- Angle of wave approach to coastlineThe degree of littoral exposition to wave fronts affects its sensitivity to storms impacts and erosion processes. It has been considered according to specific studies on sand coast exposure carried out by [65]. As for the determination of Hs, weather forecast reports can be used to assess the angle of wave approach.
- (2)
- Tidal RangeA high tidal range is associated with stronger tidal currents, which favour erosion and sediment transport [71,72]. Accordingly, macrotidal coasts (>4 m) will be more sensitive to erosion than those with smaller tidal ranges. However, a diversity of studies, e.g., [73,74,75], support the opposite view, i.e., a microtidal coastline is essentially always near high tide and, therefore, always at the greatest risk of significant storm impact. It is not unlikely that sea level during a storm surge event at macrotidal coasts is significantly lower than the high-tide level, which would increase the possibility of reduced flood risk [76]. This last approach is used in this paper and the tidal ranges used are “Microtidal” (<2 m), “Mesotidal” (2–4 m) and “Macrotidal” (>4 m) environments. Regarding the case studies in Andalusia, they are all located in a microtidal environment.
- (b)
- Regional trendsRegional trends, linked to global Climate Change processes, such as Sea Level Rise (SLR) and Storm Surge (SS) at regional scales are also used as correction factors. Studies, such as those of Morim et al. [77] and Vousdoukas et al. [78], agreed that an increase in planet temperature will also alter ocean waves along more than 50% of the world’s coastlines with significant implications for coastal flooding and erosion processes. At a European scale, extreme water levels due to relative SLR can be further enforced by an increase in the extreme SS level, which can exceed 30% of the relative SLR, especially for the high return periods and pathway under the RCP8.5 scenario—the highest greenhouse gas emissions scenario established by the IPCC—[78]. In addition, an exhaustive review of existing papers and reports can be used for assessing both SLR and SS trends at different scales—see below.
- (1)
- Sea Level Rise (SLR)A large and recent dataset on SLR trend is available from the Copernicus Programme [79] or ECMWF [68]. These databases provide data in absolute values that must be corrected, taking into account the local/regional subsidence and continent uplift values. In addition, a lot of the literature that deals with the SLR trend at different scales can be found in [69,80,81,82].
- (2)
- Storm Surge (SS)Dataset on SS level can be found in the European Commission website through the application “Large Scale Integrated Sea Level and Coastal Assessment Tool” (LISCOAST) [83]. Dataset used from LISCOAST corresponds to the RCP4.5 scenario projected to 2099 and an extreme SS level associated with a 50 year return storm. Simulations carried out by previous authors do not include astronomical tidal components or projections of relative SLR [78].
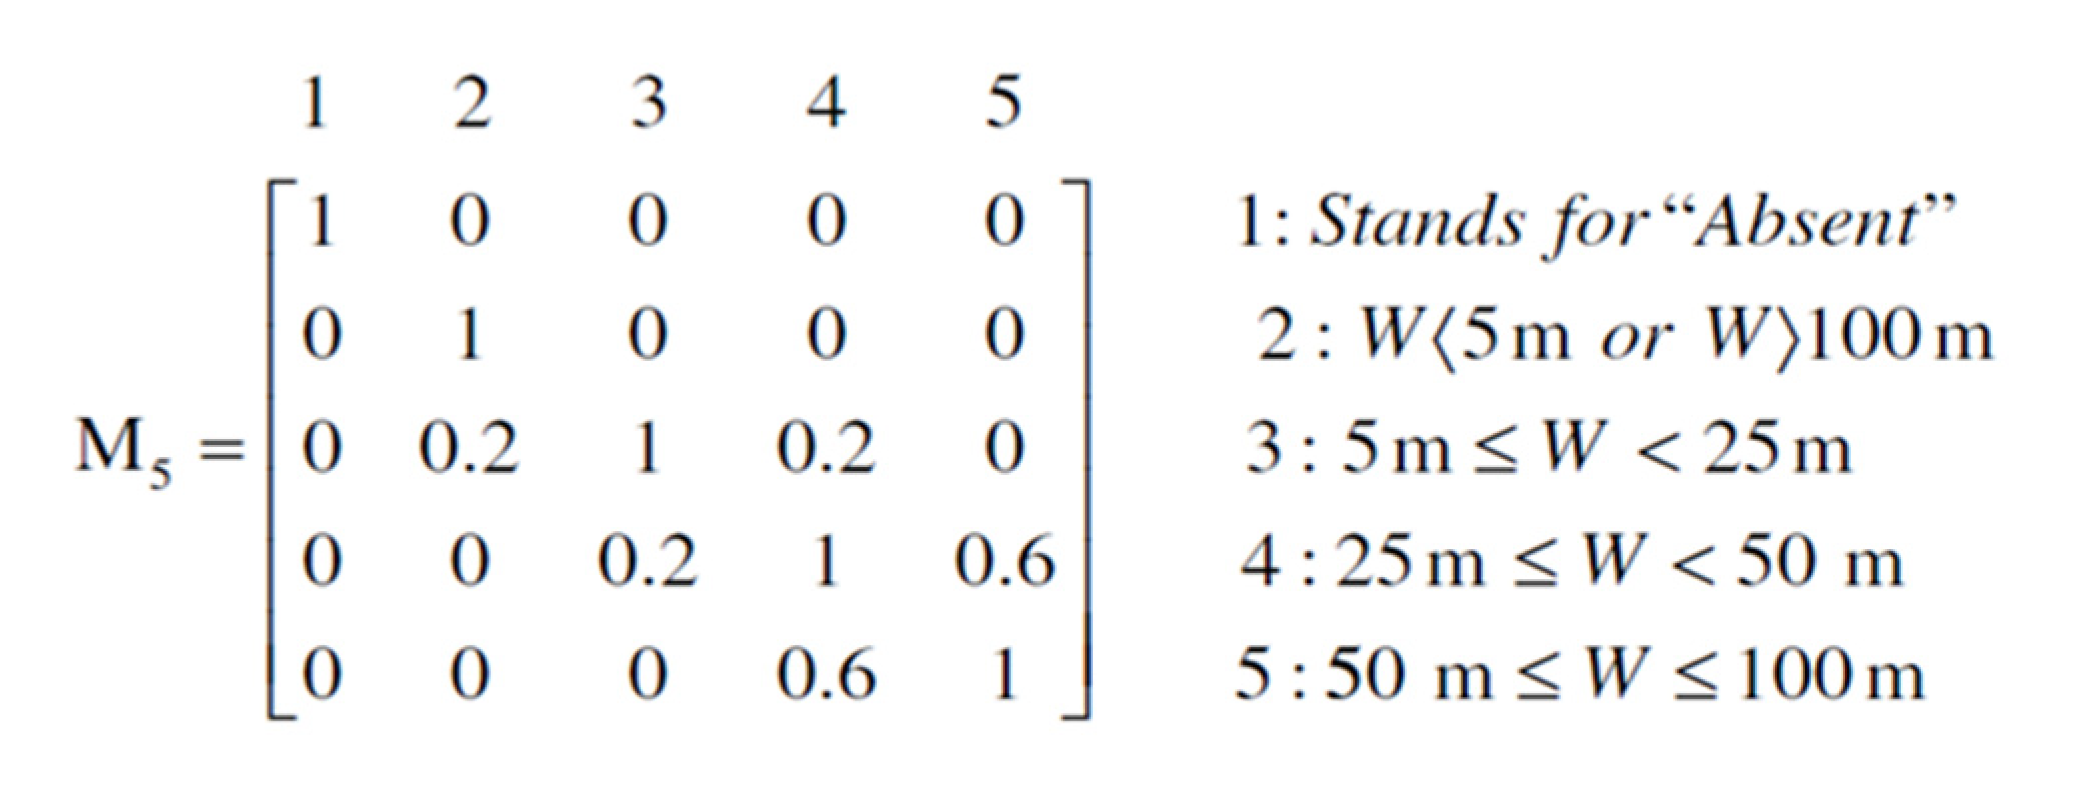
3.2.4. Determination of the “Sensitivity Index”
- Group I: scenic parameters not sensitive to natural processes, < 0.33. Category I sites belong to this group.
- Group II: sites with intermediate values at Erodibility Index and Correction Factor, with a Sensitivity Index ≥ 0.33 and < 0.66.
- Group III: highly sensitive scenic parameters that require special attention from coastal managers, ≥ 0.66.
3.3. Determination of Scenic Sensitivity to Human Pressure
3.3.1. Determination of Categories Concerning Human Impacts
- Category I. Sites with null human disturbance (all Human parameters of Table 1 have very good scores), e.g., Cala Chumbo at Malaga province, located in a Natural Place, which shows top scores (i.e., 5, Table 1) of all the human parameters (only accessible by boat or a 50 minutes’ walk from the nearest car parking, Figure 8A); another example is Punta Sabinar, located in a strict natural reserve at Almeria province. No further investigation regarding their sensitivity to human pressure is required since they are usually located in very natural and isolated areas and/or are under a strong protection feature [29,41].
- Category II. Sites that show very low human impacts mainly linked to “Noise disturbance”, “Litter”, “Sewage discharge evidence”, and of temporally emplaced elements such as litter bins, sun loungers, beach umbrella within the “Utilities” parameter (points 19–21, 26 Table 1), which are essentially related to human affluence and tourist season; e.g., Cala Arena or Ensenada del Tolmo at Cadiz province show high values at human parameters except at “Litter” (Figure 8B). Such sites are usually located in natural areas under any protection feature [29,41].
- Category III. Sites that show some human impacts reflected by medium scores at “Noise disturbance”, “Litter”, “Sewage discharge evidence” but also at “Non-built environment”, “Built environment”, “Access type”, “Skyline” and “Utilities” (points 22–26, Table 1), and linked to land use and beach typology and, therefore, to the protection feature of the site (if any); e.g., Cala El Cañuelo located in a rural environment at Malaga province (Figure 8C). Such sites are usually located in (or at the border of) natural areas, with a low level of protection feature or none [29,41].
3.3.2. Determination of the “Human Impact Index”
- (a)
- Visitors’ pressureCoastal areas are generally the most popular during the summer months. As mentioned previously, pressure due to a high concentration of visitors, in a short period of time, comes with a lot of impacts on fragile coastal ecosystems. Regarding landscape, a large number of visitors directly affect 4 of the 8 components of the CSES parameters, i.e., “Noise disturbance”, “Litter”, “Sewage discharge evidence” and “Utilities” (points 19–21, 26, Table 1), and this essentially depends on the following two parameters:
- (1)
- Access difficultyThe facility of access strongly contributes to a site’s affluence, and sites considered as “remote” demand at least a walk up to 300 m or more therefore distance to walk is a first indicator of access difficulty [23]. The approach proposed in this paper considered the access difficulty according to a difficulty scale presented in Table 7 and used by [29]; e.g., a 300 m walk in a coastal cliff or mountainous context will be quite longer/harder than in a flat coastal plain. Further, a wide diversity of studies, e.g., [22,84], support that “Access difficulty” is an important part of management strategies to regulate and protect sites from overtourism. For example, in Andalusia (Spain), Mooser et al. [29] observed that 30% of sites ranked as Class I required at least a 25 minutes’ walk, and some were only accessible by sea. This parameter is assessed according to field work experience and time walking from the nearest car parking.
- (2)
- Protected Area Management CategoryGenerally, protected coastal areas are sites of large interest for the conservation of natural habitats and ecosystems and of great relevance for research and educational purposes and sensitive tourism. However, it is inordinately complicated to understand the division and categorization of protected areas. In Europe, 685 designation types have been recorded across 39 countries (EEA, 2012). There are many types of site designation each one, showing specific objectives, spatial boundaries and specific governance policies. Certain spatial areas of high environmental value can be covered partly or totally by a number of different designations applied at local, regional, national or international level. An exhaustive analysis of this complexity can be found in the report “Protected Areas in Europe” [85]. It is considered that, among the 8 anthropogenic parameters of the CSES, 4 can be directly related to the management categories of protection: built and nonbuilt environment, access visibility and utilities. Given this context, the method proposed in this paper uses the standard methodology established by the International Union for Conservation of Nature [86], known as the Protected Area Management Category, which ranges from very strict to relatively permissive areas:
- Ia: Strict Nature Reserve;
- Ib: Wilderness Area;
- II: National Park;
- III: Natural Monument or Feature;
- IV: Habitat/Species Management Area;
- V: Protected Landscape/Seascape;
- VI: Protected area with sustainable use of natural resources.
IUCN categories are considered among the best tools for providing a comparative picture of protected areas at an international scale. Finally, local designation type (e.g., at a council level) is also considered (rated 4). - (3)
- Tourist Intensity Rate (TIR) and Population Density (PD)The global tourism industry is extremely concentrated in coastal areas where an increase in building and infrastructure has increased environmental pressure on protected, natural/seminatural territories, and local communities [15]. The following two parameters will be considered to characterize the level of potential stress to which each site may be exposed:
- (i)
- Tourism Intensity Rate (TIR)Known also as the tourism intensity indicator, the TIR is the ratio between the capacity of tourist accommodation in municipalities (number of tourist beds) and their permanent resident population. Quantifying the theoretical increase in the population in times of tourist influx is a clear indicator of tourism pressure [87,88,89].The scale presented in Table 7 was modified from the Geostatistics Information System of Andalusia (SIGEA) [90] and [87]—which carried out this analysis at a local level in 6000 municipalities in mainland France and overseas territories—and has been divided into 3 different levels:
- -
- TIR less than 200 beds per 1000 inhabitants.
- -
- TIR between 200 and 500 beds per 1000 inhabitants.
- -
- TIR > 500 beds per 1000 inhabitants.
For example, a TIR of 1000 means that the destination has a tourist capacity equivalent to the permanent population and the area is, therefore, likely to double its population during summer period. - (ii)
- Population density (PD)“The most significant TIR are located in territories with a low annual population and a high accommodation capacity. However, there can also be significant tourism pressures on the environment without the tourism intensity rate being high.” [87] (p. 8). This is notably the case for destinations with a high population density. Therefore, to complement the TIR, the density of population will be also considered following the standard presented in Table 7.
- (b)
- “Beach typology” parameterDifferent beaches have different users and need different management strategies [91]. Beaches cannot and should not be compared as a whole, but rather considered by their respective typologies. Indeed, on remote and natural beaches, users considered the scenic aspect to be of most importance while, in urban beaches, facilities and car parking aspects were deemed to be the prime factors [91]. Beach rewards, such as the famous Blue Flag, are almost only based on anthropogenic concepts, services proximity, leisure, etc., and not on natural aspects, such scenic beauty, and peace and quiet—showing the limit of the present-day management approach in a coastal context [92,93]. Williams [23] categorized five beach types: resort, urban, village, rural and remote, and proposed the following definitions:
- Remote: These may be defined by difficulty of access, largely by boat or on foot—a walk of up to 300m+. They can be adjacent to either villages or rural areas but rarely with urban areas. They are not supported by public transport and have very limited (<5 if any) temporary summer houses.
- Rural: These would be found outside the urban/village environment. They are not readily accessible by public transport and have virtually no facilities—perhaps a small summer shop, car park and/or toilet. In the Mediterranean context, permanent land-based recreational amenities (such as golf courses) and summer time beach-related recreational facilities (e.g., banana boats, jet skiing etc. which are typical of resorts) may be found.
- Village: These are found outside the main urban environment. They have a small, permanent population reflecting access to organised but small-scale community services (such as a primary school(s), religious centre(s) and shop(s). This also includes "tourist villages" mainly utilized in the summer months as well as "ribbon development" between urban and rural environments.
- Urban: These serve large populations, which have well-established public services, e.g., primary school(s), bank(s), religious centre(s), internet cafes, with a clearly demarcated central business district, and commercial activities, e.g., harbours and marinas. Urban beaches are located within/adjacent the urban area and are, in the main, freely open to the public.
- Resort: Especially in tourist "hot spots" e.g., the Caribbean, Mediterranean, coastal resorts should be located on a beach adjacent to an accommodation complex (hotel/apartment/camp site), where a substantial proportion of beach users are residents and management is the responsibility of the complex. A host of facilities is usually prevalent, e.g., wind surfing, speed boat towing activities (e.g., "rings", "bouncy castles", "bananas") as recreation is the main aim; Club Med epitomises this type of resort.
3.3.3. Determination of the “Correction Factor” for Human Pressure
3.3.4. Determination of the “Sensitivity Index” to Human Pressure
- Group I, < 0.33;
- Group II, 0.33 ≥ < 0.66;
- Group III, ≥ 0.66.
3.4. Determination of the total Sensitivity Index to Natural Processes and Human Pressure
- Group I, SI < 0.33;
- Group II, 0.33 ≥ SI < 0.66;
- Group III, SI ≥ 0.66.
4. Results and Discussions: Case Studies from Andalucía
4.1. Sensitivity to Natural Processes
4.2. Sensitivity to Human Pressure
4.3. Total Sensitivity Index, SI versus “D” value (CSES) and Natural SI versus Human SI
5. Conclusions
Author Contributions
Funding
Acknowledgments
Conflicts of Interest
Appendix A

| Sensitivity Indexes | Indexes and Correction Factor (CF) | Parameters and Trends | Assessment Method | Reference | ||
|---|---|---|---|---|---|---|
| Total Sensitivity Index | Natural processes | Erodibility Index | Beach face | Dry Beach as a Multiple of the ICZ | Aerial photographs and satellites images | [48] |
| Sediment Grain Size | Field work observations * | [54] | ||||
| Rocky shore width and location | [56,58] | |||||
| Dunes (if Category III sites) | Dune Height | [59] | ||||
| Dune Width | Field work observations * or satellite images | [59] | ||||
| Vegetation cover | [59] | |||||
| Washovers | [65] | |||||
| CF | Forcing variables | Significant Wave height and angle of approach | Bibliographic review or analysis of existing data (e.g., ECMWF or Copernicus program) | [65,67] | ||
| Tidal Range | ||||||
| Trends | Sea Level Rise | [13] | ||||
| Storm Surge | [13] | |||||
| Human pressure | Human Impact Index | Visitors’ pressure | Access difficulty | Field work observations | [29] | |
| Protected Area Management Category | Bibliographic review or analysis of existing data | [86] | ||||
| Tourism Intensity Rate and Population Density | Mod. from [87,90] | |||||
| for Category III sites | Beach typology | Field work observations | [23] | |||
| CF | Trend | Evolution of the number of beds in tourist establishments | Bibliographic review or analysis of existing data | Mod. from [90] | ||
References
- Klein, Y.L.; Osleeb, J.P.; Viola, M.R. Tourism generated earnings in the coastal zone: A regional analysis. J. Coast. Res. 2004, 20, 1080–1088. [Google Scholar]
- UNWTO (United Nations World Tourism Organization). Tourism Highlights; UNWTO: Madrid, Spain, 2019. [Google Scholar] [CrossRef]
- UNWTO (United Nations World Tourism Organization). European Union Tourism Trends; UNWTO: Madrid, Spain, 2018. [Google Scholar] [CrossRef]
- Benoit, G.; Comeau, A. A Sustainable Future for the Mediterranean: The Blue Plan’s Environment and Development Outlook; Earthscan: London, UK, 2005; p. 428. [Google Scholar]
- Dodds, R.; Kelman, I. How climate change is considered in sustainable tourism policies: A case of the Mediterranean islands of Malta and Mallorca. Tour. Rev. Int. 2008, 12, 57–70. [Google Scholar] [CrossRef]
- Rangel-Buitrago, N.; Anfuso, G.; Ergin, A.; Williams, A.T. Assessing and Managing the Coastal Scenery: Blue Solutions from Latin America and the Wider Caribbean; GTZ: Berlin, Germany, 2015. [Google Scholar]
- Rangel-Buitrago, N.; Anfuso, G.; William, A.T. Coastal erosion along the Caribbean coast of Colombia: Magnitudes, causes and management. Ocean Coast. Manag. 2015, 114, 129–144. [Google Scholar] [CrossRef]
- Williams, A.T.; Pond, K.; Ergin, A.; Cullis, M.J. The hazards of beach litter. In Coastal Hazards; Finkl, C., Ed.; Springer: New York, NY, USA, 2013; pp. 753 –780 . [Google Scholar]
- Williams, A.T.; Rangel-Buitrago, N.; Pranzini, E.; Anfuso, G. The management of coastal erosion. Ocean Coast. Manag. 2018, 156, 4–20. [Google Scholar] [CrossRef]
- Pranzini, E.; Williams, A.T. Coastal Erosion and Protection in Europe; Routledge/Earthscan: London, UK, 2013. [Google Scholar]
- Hughes, Z.; Duchain, H. Tourism and climate impact on the North American Eastern sea-board. In Disappearing Destinations: Climate Change and Future Challenges for Coastal Tourism; Jones, A., Phillips, M.R., Eds.; CABI: Oxford, UK, 2011; pp. 161–176. [Google Scholar]
- Pilkey, O.H.; Cooper, J.A. The Last Beach; Duke University Press: Durham, UK, 2014. [Google Scholar]
- Eurosion Project, European Commission. Living with Coastal Erosion in Europe; Results from the Eurosion Study; Doody, P., Ferreira, M., Lombardo, S., Lucius, I., Misdorp, R., Niesing, H., Salman, A., Smallegange, M., Eds.; European Commission: Luxembourg, 2005; Available online: http://www.eurosion.org/project/eurosion_en.pdf (accessed on 15 November 2020).
- Millennium Ecosystem Assessment (MEA). Ecosystems and Human Well-Being: Synthesis; Island Press: Washington, DC, USA, 2005; p. 155. [Google Scholar]
- EC (European Commission). Study on Specific Challenges for a Sustainable Development of Coastal and Maritime Tourism in Europe; Final Report; EC (European Commission): Luxembourg, 2016. [Google Scholar] [CrossRef]
- Bird, E. Coastal Geomorphology: An Introduction; John Wiley & Sons: Hoboken, NJ, USA, 2011. [Google Scholar]
- López, M.; Pagán, J.I.; López, L.; Aragonés, L.; Tenza-Abril, A.J.; García-Barba, J. Factors influencing the retreat of the coastline. Int. J. Comput. Methods Exp. Meas. 2017, 5, 649–741. [Google Scholar] [CrossRef]
- Cooper, A.; Anfuso, G.; Del Río, L. Bad beach management: European perspectives. Geol. Soc. Am. Ser. 2009, 460, 167–179. [Google Scholar]
- Anfuso, G.; Pranzini, E.; Vitale, G. An integrated approach to coastal erosion problems in northern Tuscany (Italy): Littoral morphological evolution and cells distribution. Geomorphology 2011, 129, 204–214. [Google Scholar] [CrossRef]
- EGU General Assembly. Coastal Zone Geomorphological Interactions: Natural versus Human-Induced Driving Factors. 2020. Available online: https://meetingorganizer.copernicus.org/EGU2020/session/37494 (accessed on 3 March 2020).
- Ergin, A.; Karaesmen, E.; Micallef, A.; Williams, A.T. A new methodology for evaluating coastal scenery: Fuzzy logic systems. Area 2004, 36, 367–386. [Google Scholar] [CrossRef]
- Williams, A.T.; Micallef, A. Beach Management: Principles and Practices; Earthscan: London, UK, 2009; p. 480. [Google Scholar]
- Williams, A.T. Definitions and typologies of coastal tourism beach destinations. In Disappearing Destinations: Climate Change and Future Challenges for Coastal Tourism; Jones, A., Phillips, M., Eds.; CABI: Wallingford, UK, 2011; p. 296. [Google Scholar]
- Council of Europe. European Landscape Convention; Council of Europe: Florence, Italy, 2000. [Google Scholar]
- Council of Europe. Landscape Facets: Reflections and Proposals for the Implementation of the European Landscape Convention; Council of Europe Publishing: Strasbourg, France, 2012. [Google Scholar]
- UNESCO. Operational Guidelines for the Implementation of the World Heritage Convention; UNESCO Intergovernmental Committee for the Protection of the World Cultural and Natural Heritage: Paris, France, 2016. [Google Scholar]
- Conrad, E. People and landscape, the Pan-European Biological and Landscape Diversity Strategy. Coming in from the cold. In Perspectives on Landscapes Institute of Earth Systems; Conrad, E., Cassar, L.F., Eds.; University of Malta: La Valeta, Malta, 2010; pp. 23–31. [Google Scholar]
- UNEP, Mediterranean Action Program. Protocol on integrated Coastal Zone management in the Mediterranean, Priority Actions Programme, Split. European Treaty, Madrid. 2008. Available online: https://ec.europa.eu/world/agreements/downloadFile.do?fullText=yes&treatyTransId=12967 (accessed on 4 October 2020).
- Mooser, A.; Anfuso, G.; Mestanza, C.; Williams, A.T. Management Implications for the Most Attractive Scenic Sites along the Andalusia Coast (SW Spain). Sustainability 2018, 10, 1328. [Google Scholar] [CrossRef]
- Manno, G.; Anfuso, G.; Messina, E.; Williams, A.T.; Suffo, M.; Liguori, V. Decadal evolution of coastline armouring along the Mediterranean Andalusia littoral (South of Spain). Ocean Coast. Manag. 2016, 124, 84–99. [Google Scholar] [CrossRef]
- Molina, R.; Manno, G.; Lo Re, C.; Anfuso, G.; Ciraolo, G. Storm Energy Flux Characterization along the Mediterranean Coast of Andalusia (Spain). Water 2019, 11, 509. [Google Scholar] [CrossRef]
- Chica Ruiz, J.A.; Barragan, J.M. Estado y Tendencia de los Servicios de los Ecosistemas Litorales de Andalucía; Consejería de Medio Ambiente: Sevilla, Spain, 2011; p. 112. [Google Scholar]
- Rangel-Buitrago, N. (Ed.) Coastal Scenery: Evaluation and Management; Springer: Dordrecht, The Netherlands, 2019; 247p, ISBN 978-3-319-78877-7. [Google Scholar]
- Barbosa de Araújo, M.C.; Da Costa, M.F. Environmental quality indicators for recreational beaches classification. J. Coast. Res. 2008, 1439–1449. [Google Scholar] [CrossRef]
- The Observer Magazine (The Guardian); 06.08.2015, 31. Available online: https://www.theguardian.com/environment/2015/aug/06/listen-and-vote-for-your-favourite-sound-of-british-summer-by-the-sea (accessed on 23 November 2020).
- Williams, A.T. The Concept of Scenic Beauty in a Landscape. In Coastal Scenery; Rangel-Buitrago, N., Ed.; Springer: Berlin, Germany, 2018; pp. 17–42. [Google Scholar]
- Steers, J.A. Coastal preservation and planning. Geogr. J. 1944, 104, 7–27. [Google Scholar] [CrossRef]
- Teale, E.W. Wandering through Winter; Dodd, Mead and Co.: New York, NY, USA, 1966. [Google Scholar]
- Ergin, A.; Williams, A.T.; Micallef, A. Coastal scenery: Appreciation and evaluation. J. Coast. Res. 2006, 22, 958–964. [Google Scholar] [CrossRef]
- Ergin, A. Coastal Scenery Assessment by Means of a Fuzzy Logic Approach. In Coastal Scenery: Evaluation and Management; Rangel-Buitrago, N., Ed.; Springer: Dordrecht, The Netherlands, 2018; pp. 67–106. [Google Scholar]
- Anfuso, G.; Williams, A.T.; Casas Martínez, G.; Botero, C.M.; Cabrera Hernández, J.A.; Pranzini, E. Evaluation of the scenic value of 100 beaches in Cuba: Implications for coastal tourism management. Ocean Coast. Manag. 2017, 142, 173–185. [Google Scholar] [CrossRef]
- Ullah, Z.; Johnson, D.; Micallef, A.; Williams, A.T. From the Mediterranean to Pakistan and back—Coastal scenic assessment for tourism development in Pakistan. J. Coast. Conserv. Manag. 2010, 14, 285–293. [Google Scholar] [CrossRef]
- Williams, A.T.; Sellers, V.; Philips, M.R. An Assessment of UK Heritage Coasts in South Wales: J A Steers revisited. In Proceedings of the 9th International Coastal Symposium, Sunshine Coast, Australia, 20–24 August 2007; pp. 453–458. [Google Scholar]
- Selmi, L.; Coratza, P.; Gauci, R.; Soldati, M. Geoheritage as a Tool for Environmental Management: A Case Study in Northern Malta (Central Mediterranean Sea). Resources 2019, 8, 168. [Google Scholar] [CrossRef]
- Williams, A.T.; Alveirinho-Dias, J.; Garcia Novo, F.; Garcia-Mora, M.R.; Curr, R.H.; Pereira, A. Integrated coastal dune management: Checklists. Cont. Shelf Res. 2001, 21, 1937–1960. [Google Scholar] [CrossRef]
- Rangel-Buitrago, N.; Anfuso, G. Risk Assessment of Storms in Coastal Zones: Case Studies from Cartagena (Colombia) and Cadiz (Spain); Springer: Berlin/Heidelberg, Germany, February 2015. [Google Scholar] [CrossRef]
- Rizzo, A.; Aucelli, P.; Javier Gracia, F.; Anfuso, G. A novelty coastal susceptibility assessment method: Application to Valdelagrana area (SW Spain). J. Coast. Conserv. 2018. [Google Scholar] [CrossRef]
- Crowell, M.; Leikin, H.; Buckley, M. Evaluation of coastal erosion hazards study: An overview. J. Coast. Res. 1999, 28, 2–9. [Google Scholar]
- Douglas, B.C.; Crowell, M.; Leatherman, S.P. Considerations for shoreline position prediction. J. Coast. Res. 1998, 14, 1025–1033. [Google Scholar]
- Galgano, F.A.; Douglas, B. Shoreline position prediction: Methods and errors. Environ. Geosci. 2000, 7, 23–31. [Google Scholar] [CrossRef]
- Dolan, R.; Fester, M.S.; Holme, S.J. Temporal analysis of shoreline recession and accretion. J. Coast. Res. 1991, 7, 723–744. [Google Scholar]
- Crowell, M.; Buckley, M.K. Calculating erosion rates: Using long-term data to increase data confidence. In Coastal Engineering Considerations in Coastal Zone Management; ASCE: New York, NY, USA, 1993. [Google Scholar]
- Healy, T.R.; Stone, K.; Magoon, O.; Edge, B.; Ewing, L.; Short, A.D.; Raney, R.K.S. Encycl. Coast. Sci. 2005, 819–939. [Google Scholar] [CrossRef]
- Short, A.D. Handbook of Beach and Shoreface Morphodynamics; John Wiley & Sons: Chichester, UK, 1999. [Google Scholar]
- Sunamura, T. Processes of sea cliff and platform erosion. In Handbook of Coastal Processes and Erosion; Komar, P.D., Ed.; CRC Press: Boca Raton, FL, USA, 1983. [Google Scholar]
- Sunamura, T. Geomorphology of Rocky Coasts; Wiley: New York, NY, USA, 1992. [Google Scholar]
- Davies, P.; Sunamura, T.; Takeda, I.; Tsujimoto, H.; Williams, A.T. Controls of shore platform width: The role of rock resistance factors at selected sites in Japan and Wales, UK. J. Coast. Res. 2004, SI39, 160–164. [Google Scholar]
- Trenhaile, A.S. The Width of Shore Platforms in Britain, Canada, and Japan. J. Coast. Res. 1999, 15, 355–364. [Google Scholar]
- Gracia, F.J.; Rodríguez-Vidal, J.; Benavente, J.; Cáceres, L.; López Aguayo, F. Tectónica cuaternaria en la Bahía de Cádiz. In Avances en el estudio del Cuaternario; Pallí, L., Roqué, C., Eds.; Univ. de Girona: Girona, Spain, 1999. [Google Scholar]
- Doing, H. Coastal fore-dune zonation and succession in various parts of the world. Vegetation 1985, 61, 65–75. [Google Scholar] [CrossRef]
- Hesp, P.A. Ecological processes and plant adaptations on coastal dunes. J. Arid. Environ. 1991, 21, 165–191. [Google Scholar] [CrossRef]
- Dech, J.P.; Maun, M.A. Zonation of vegetation along a burial gradient on lee slopes of Lake Huron sand dunes. Can. J. Bot. 2007, 83, 227–236. [Google Scholar] [CrossRef]
- Kraus, N.C.; Millitello, A.; Todoroff, G. Barrier breaching processes and barrier spit breach. Stone Lagoon, California. Shore Beach 2002, 70, 21–28. [Google Scholar]
- Molina, R.; Manno, G.; Lo Re, C.; Anfuso, G.; Ciraolo, G. A Methodological Approach to Determine Sound Response Modalities to Coastal Erosion Processes in Mediterranean Andalusia (Spain). J. Mar. Sci. Eng. 2020, 8, 154. [Google Scholar] [CrossRef]
- García Mora, M.R.; Gallego, J.B.; Williams, A.T.; García Novo, F. A coastal dune vulnerability classification. A case study of the SW Iberian Peninsula. J. Coast. Res. 2001, 17, 802–811. [Google Scholar]
- Herbich, J.B.; Haney, J.P. Coastal engineering. In Beaches and Coastal Geology; Encyclopedia of Earth Science; Springer: Boston, MA, USA, 1982. [Google Scholar]
- Jones, N.L.; Monismith, S.G. Modeling the influence of wave-enhanced turbulence in a shallow tide- and wind-driven water column. J. Geophys. Res. 2008, 113, C03009. [Google Scholar] [CrossRef]
- European Centre for Medium-Range Weather Forecasts (ECMWF). Available online: https://www.ecmwf.int/ (accessed on 4 November 2020).
- Puertos del Estado. Prediccion de Oleaje, Nivel del Mar; Boyas y Mareografos. Available online: http://www.puertos.es/en-us/oceanografia/Pages/portus.aspx (accessed on 22 October 2020).
- SOCIB (Sistema de Observación Costero de las Islas Baleares). Autonomous Wave Forecast System (SAPO). Available online: https://www.socib.es/?seccion=modelling&facility=sapo (accessed on 22 October 2020).
- Gornitz, V. Global coastal hazards from future sea level rise. Palaeogeogr. Palaeoclim. Palaeoecol. 1991, 89, 379–398. [Google Scholar] [CrossRef]
- Shaw, J.; Taylor, R.B.; Forbes, D.L.; Ruz, M.H.; Solomon, S. Sensitivity of the coasts of Canada to sea-level rise. Bull. Geol. Surv. Can. 1998, 505, 1–79. [Google Scholar]
- Thieler, E.R.; Hammar-Klose, E.S. National Assessment of Coastal Vulnerability to Future Sea-Level Rise: Preliminary Results for the U.S. Pacific Coast: U.S. Geological Survey 2000. Fact Sheet 076-00. Available online: https://pubs.usgs.gov/dds/dds68/reports/westrep.pdf (accessed on 28 December 2020).
- Pendleton, E.A.; Thieler, E.R.; Williams, S.J.; Beavers, R.S. Coastal Vulnerability Assessment of Padre Island National Seashore (PAIS) to Sea-Level Rise. USGS report 2004, No 2004–1090. Available online: https://pubs.usgs.gov/of/2004/1090/ (accessed on 15 November 2020).
- McLaughlin, S.; Cooper, J. A multi-scale coastal vulnerability index: A tool for coastal managers? Environ. Hazards 2010, 9, 233–248. [Google Scholar] [CrossRef]
- Rosen, P.S. Increasing shoreline erosion rates with decreasing tidal range in the Virginia Chesapeake Bay. Chesap. Sci. 1977, 18, 383–386. [Google Scholar] [CrossRef]
- Morim, J.; Hemer, M.; Wang, X.L.; Cartwright, N.; Trenham, C.; Semedo, A.; Young, I.R.; Bricheno, L.; Camus, P.; Casas-Prat, M.; et al. Robustness and uncertainties in global multivariate wind-wave climate projections. Nat. Clim. Chang. 2019, 9, 711–718. [Google Scholar] [CrossRef]
- Vousdoukas, M.; Voukouvalas, E.; Annunziato, A.; Giardino, A.; Feyen, L. Projections of extreme storm surge levels along Europe. Clim. Dyn. 2016, 47, 3171–3190. [Google Scholar] [CrossRef]
- Copernicus. European Union’s Earth Observation Programme. Available online: https://www.copernicus.eu/en (accessed on 15 November 2020).
- Criado-Aldeanueva, F.; Del Río Vera, J.; García-Lafuente, J. Steric and mass-induced Mediterranean sea level trends from 14 years of altimetry data. Glob. Planet. Chang. 2008, 60, 563–575. [Google Scholar] [CrossRef]
- Tsimplis, M.; Spada, G.; Marcos, M.; Flemming, N. Multi-decadal sea level trends and land movements in the Mediterranean Sea with estimates of factors perturbing tide gauge data and cumulative uncertainties. Glob. Planet. Chang. 2011, 76, 63–76. [Google Scholar] [CrossRef]
- Antonioli, F.; De Falco, G.; Lo Presti, V.; Moretti, L.; Scardino, G.; Anzidei, M.; Bonaldo, D.; Carniel, S.; Leoni, G.; Furlani, S.; et al. Relative Sea-Level Rise and Potential Submersion Risk for 2100 on 16 Coastal Plains of the Mediterranean Sea. Water 2020, 12, 2173. [Google Scholar] [CrossRef]
- EC (European Commission). Large Scale Integrated Sea-level and Coastal Assessment Tool, JRC Data Catalogue. Available online: http://data.jrc.ec.europa.eu/collection/LISCOAST (accessed on 15 October 2020).
- Botero, C.; Cervantes, O.; Finkl, C. Beach Management Tools-Concepts, Methodologies and Case Studies; Coastal Research Library; Springer: Berlin/Heidelberg, Germany, 2018. [Google Scholar] [CrossRef]
- EEA (European Environment Agency). Protected Areas in Europe—An Overview. EEA Report No 5/2012, Luxembourg. 2012. Available online: https://www.eea.europa.eu/publications/protected-areas-in-europe-2012#:~:text=Protected%20areas%20cover%20a%20quarter,according%20to%20the%20latest%20data (accessed on 3 October 2020).
- Dudley, N. (Ed.) Guidelines for Applying Protected Area Management Categories; Gland, Switzerland: IUCN 2008. WITH Stolton, S., P. Shadie and N. Dudley (2013). IUCN WCPA Best Practice Guidance on Recognising Protected Areas and Assigning Management Categories and Governance Types, Best Practice Protected Area Guidelines Series No. 21; IUCN: Gland, Switzerland, 2008; ISBN 978-2-8317-1636-7. Available online: https://portals.iucn.org/library/sites/library/files/documents/PAG-021.pdf (accessed on 11 October 2020).
- Gauche, M. (Ed.) Tourism Intensity at a Local Level: Environmental Pressure or Preservation Factor? The Monitoring and Statistics Directorate (SOeS): Paris, France, 2017; Available online: https://www.statistiques.developpement-durable.gouv.fr/sites/default/files/2018-10/datalab-17-lafonction-touristique-des-territoires...mars2017-anglais.pdf (accessed on 15 October 2020).
- Batista e Silva, F.; Marin Herrera, M.A.; Rosina, K.; Ribeiro Barranco, R.; Freire, S.; Schiavina, M. Analysing Spatiotemporal Patterns of Tourism in Europe at High-Resolution with Conventional and Big Data Sources; Tourism Management 68; 2018; pp. 101–115. Available online: https://daneshyari.com/article/preview/7420766.pdf (accessed on 28 December 2020).
- Băndoi, A.; Jianu, E.; Enescu, M.; Axinte, G.; Tudor, S.; Firoiu, D. The Relationship between Development of Tourism, Quality of Life and Sustainable Performance in EU Countries. Sustainability 2020, 12, 1628. [Google Scholar] [CrossRef]
- SIGEA (Sistema de Información GeoEstadística de Andalucía). Available online: https://www.juntadeandalucia.es/institutodeestadisticaycartografia/SIGEA/index.html (accessed on 15 October 2020).
- Vaz, B.; Williams, A.; Silva, C.; Phillips, M. The importance of user’s perception for beach management. J. Coast. Res. 2009, 1164–1168. Available online: http://www.jstor.org/stable/25737970 (accessed on 24 September 2020).
- Roig-Munar, F.X.; Fraile-Jurado, P.; Peña-Alonso, C. Analysis of Blue Flag Beaches Compared with Natural Beaches in the Balearic Islands and Canary Islands, Spain. In Beach Management Tools-Concepts, Methodologies and Case Studies; Botero, C., Cervantes, O., Finkl, C., Eds.; Coastal Research Library; Springer: Cham, Switzerland, 2018; Volume 24. [Google Scholar] [CrossRef]
- McKenna, J.; Williams, A.T.; Cooper, J.A.G. Blue Flag: Red Herring: Do beach awards encourage the public to visit beaches? J. Tour. Manag. 2011, 32, 576–588. [Google Scholar] [CrossRef]
- UNWTO (United Nations World Tourism Organization). Tourism towards 2030/Global Overview-Advance Edition Presented at UNWTO 19th General Assembly-10 October 2011; UNWTO: Madrid, Spain, 2011. [Google Scholar] [CrossRef]
- Tonazzini, D.; Fosse, J.; Morales, E.; González, A.; Klarwein, S.; Moukaddem, K.; Louveau, O. Blue Tourism. Towards a Sustainable Coastal and Maritime Tourism in World Marine Regions; Eco-Union: Barcelona, Spain, 2019. [Google Scholar]
- Rizzo, A.; Vandelli, V.; Buhagiar, G.; Micallef, A.S.; Soldati, M. Coastal Vulnerability Assessment along the North-Eastern Sector of Gozo Island (Malta, Mediterranean Sea). Water 2020, 12, 1405. [Google Scholar] [CrossRef]
- Losada, I.; Izaguirre, C.; Diaz, P. Cambio climático en la costa española. Oficina Española de Cambio Climático; Ministerio de Agricultura, Alimentación y Medio Ambiente: Madrid, Spain, 2014; p. 133. [Google Scholar]


| No | Physical Parameters | Weight | Rating | |||||
|---|---|---|---|---|---|---|---|---|
| 1 | 2 | 3 | 4 | 5 | ||||
| 1 | Height (m) | 0.02 | Absent | 5 ≤ H < 30 | 30 ≤ H < 60 | 60 ≤ H < 90 | H ≥ 90 | |
| 2 | CLIFF | Slope | 0.02 | <45° | 45–60° | 60–75° | 75–85° | circa vertical |
| 3 | Features * | 0.03 | Absent | 1 | 2 | 3 | Many (>3) | |
| 4 | Type | 0.03 | Absent | Mud | Cobble/Boulder | Pebble/Gravel | Sand | |
| 5 | BEACH FACE | Width (m) | 0.03 | Absent | W < 5 or W > 100 | 5 ≤ W < 25 | 25 ≤ W < 50 | 50 ≤ W ≤ 100 |
| 6 | Colour | 0.02 | Absent | Dark | Dark tan | Light tan/bleached | White/gold | |
| 7 | Slope | 0.01 | Absent | <5° | 5–10° | 10–20° | 20–45° | |
| 8 | ROCKY SHORE | Extent | 0.01 | Absent | <5 m | 5–10 m | 10–20 m | >20 m |
| 9 | Roughness | 0.02 | Absent | Distinctly jagged | Deeply pitted and/or irregular | Shallow pitted | Smooth | |
| 10 | DUNES | 0.04 | Absent | Remnants | Fore-dune | Secondary ridge | Several | |
| 11 | VALLEY | 0.08 | Absent | Dry valley | (<1 m) Stream | (1–4 m) Stream | River/limestone gorge | |
| 12 | SKYLINE LANDFORM | 0.08 | Not visible | Flat | Undulating | Highly undulating | Mountainous | |
| 13 | TIDES | 0.04 | Macro (>4 m) | Meso (2–4 m) | Micro (<2 m) | |||
| 14 | COASTAL LANDSCAPE FEATURES ** | 0.12 | None | 1 | 2 | 3 | >3 | |
| 15 | VISTAS | 0.09 | Open on one side | Open on two sides | Open on three sides | Open on four sides | ||
| 16 | WATER COLOUR & CLARITY | 0.14 | Muddy brown/grey | Milky blue/green | Green/grey/blue | Clear/dark blue | Very clear turquoise | |
| 17 | NATURAL VEGETATION COVER | 0.12 | Bare (<10% vegetation) | Scrub/garigue (marran, gorse) | Wetlands/meadow | Coppices, maquis (±mature trees) | Varity of mature trees | |
| 18 | VEGETATION DEBRIS | 0.09 | Continuous (>50 cm high) | Full strand line | Single accumulation | Few scattered items | None | |
| Human Parameters | ||||||||
| 19 | NOISE DISTURBANCE | 0.14 | Intolerable | Tolerable | Little | None | ||
| 20 | LITTER | 0.15 | Continuous accumulations | Full strand line | Single accumulation | Few scattered items | Virtually absent | |
| 21 | SEWAGE DISCHARGE EVIDENCE | 0.15 | Sewage evidence | Same evidence (1–3 items) | No evidence of sewage | |||
| 22 | NONBUILT ENVIRONMENT | 0.06 | None | Hedgerow/terracing/monoculture | mixed cultivation ± trees/natural | |||
| 23 | BUILT ENVIRONMENT | 0.14 | Heavy Industry | Heavy tourism and/or urban | Light tourism and/or urban | Sensitive tourism and/or urban | Historic and/or none | |
| 24 | ACCESS TYPE | 0.09 | No buffer zone/heavy traffic | No buffer zone/light traffic | Parking lot visible from coastal area | Parking lot not visible from coastal area | ||
| 25 | SKYLINE | 0.14 | Very unattractive | Sensitively designed high/low | Very sensitively designed | Natural/historic features | ||
| 26 | UTILITIES *** | 0.14 | >3 | 3 | 2 | 1 | None | |
| Indexes and Categories | Equations | Parameters |
|---|---|---|
| Erodibility Index (1) for Category II sites (EIC2) | erodibility of beach face parameters natural parameter dry beach evolution sediment grain size Pn3a: rocky shore width Pn3b: rocky shore location : number of natural parameters (3) A: maximum attribute value (5) | |
| Erodibility Index (2) for Category III sites (EIC3) | : Erodibility of dune system parameters | |
| Erodibility of Dune System (3) (EDS) | : dune height dune width Pn6: vegetation cover Pn7: washovers | |
| Natural correction factor (4) (CFN) | c1a: significant wave height c1b angle of wave approach : tidal range c3:sea level rise c4:storm surge | |
| Sensitivity Index to natural processes (5) (SIN) |
| Parameter | Null/Very low (1) | Low (2) | Medium (3) | High (4) | Very High (5) | |
|---|---|---|---|---|---|---|
| Dry Beach as a Multiple of the ICZ [48] | Accretion/ >5 times ICZ | 4 times ICZ | 3 times ICZ | 2 times ICZ | ≤ICZ | |
| Sediment Grain Size modified from [54] | Gravel/pebbles | Medium/ coarse sand or mixed | Fine sand | |||
| Rocky Shore | Width (m) mod. from [58] | >80 | 80–60 | 60–40 | 40–20 | <20 |
| Location [56] | Nearshore | Foreshore | Absent | |||
| Parameter | Null/Very low (1) | Low (2) | Medium (3) | High (4) | Very High(5) |
|---|---|---|---|---|---|
| Dune Height (m) [59] | ≥6 | ≥3 | ≥2 | ≥1 | <1 |
| Dune Width (m) [59] | >100 | >75 | >50 | >25 | <25 |
| Vegetation cover [59] | Complete with fixed dune (forest) | Complete with fixed dune (shrub) | Semicomplete (without fixed dune) | Semicomplete (without embryo dune) | Incomplete or absent |
| Washovers (%) [65] | 0 | ≤5 | ≤25 | ≤50 | ≥50 |
| Correction Factor | Null/Very low (1) | Low (2) | Medium (3) | High (4) | Very High (5) | ||
|---|---|---|---|---|---|---|---|
| Forcing | Wave characteristics | Significant wave height (m) [67] | <0.75 | 0.75–1.5 | >1.5 | ||
| Angle of approach [65] | 10–45° (Oblique) | 0–10° (Subparallel) | 0° (Parallel) | ||||
| Tidal Range | Macrotidal | Mesotidal | Microtidal | ||||
| Trends at regional scale | Sea Level Rise (cm) * [13] | <0 | 0–40 | >40 | |||
| Storm Surge (m) ** [13] | <1.5 | 1.5–3 | >3 | ||||
| Indexes and Correction Factor | Equations | Parameters |
|---|---|---|
| Human Impact Index (6) for Category II sites (HIC2) | Ph: human parameter Ph1: access difficulty Ph2: protected area management category Ph3a: tourism intensity rate : population density : number of human parameters (3) A: maximum attribute value (5) | |
| Human Impact Index (7) for Category III sites (HIC3) | : beach typology | |
| Human Correction Factor (8) (CFH) | c: tourism trend | |
| Sensitivity Index (9) to human processes (SIH) |
| Parameter | Null/Very Low (1) | Low (2) | Medium (3) | High (4) | Very High (5) | |
|---|---|---|---|---|---|---|
| Access difficulty (min.) [29] | >45 or only by sea | 25–45 | 10–25 | 5–10 | <5 | |
| Protected Area Management Category [86] | Ia—Ib | II—III | IV-V-VI | Only local designation | No | |
| Tourism Intensity Rate (TIR) and Population density (PD) | TIR: tourist beds 1000 inhab. mod. from [87] | <200 | 200–500 | >500 | ||
| PD: persons/km2 mod. from [90] | <100 | 100–700 | >700 | |||
| Parameter | Null/Very Low (1) | Low (2) | Medium (3) | High (4) | Very High(5) |
|---|---|---|---|---|---|
| Beach typology [23] | Remote | Rural | Village or Resort |
| Correction Factor | Null/Very Low (1) | Low (2) | Medium (3) | High (4) | Very High(5) |
|---|---|---|---|---|---|
| Evolution of the number of beds in tourist establishments (%) * mod. from [90] | <5 | 5–20 | 20–40 | 40–60 | >60 |
| Sites | Municipality | Prov. | CSES“D”/Class | Natural Processes | Human Pressure | Total SI | Group | ||||||
|---|---|---|---|---|---|---|---|---|---|---|---|---|---|
| NC | EI | SI | G | HC | HI | SI | G | ||||||
| 1. Ensenada del Tolmo | Tarifa | CA1 | 0.84; II | II | 0.17 | 0.27 | I | II | 0.33 | 0.37 | II | 0.32 | I |
| 2. Cala Arena | 0.91; II | II | 0.50 | 0.52 | II | II | 0.42 | 0.44 | II | 0.48 | II | ||
| 3. Cabopino | Marbella | MA2 | 0.73; II | III | 0.44 | 0.53 | II | III | 0.75 | 0.63 | II | 0.58 | II |
| 4. Punta de Vélez * | Velez | 0.77; II | II | 0.50 | 0.55 | II | III | 0.62 | 0.53 | II | 0.54 | II | |
| 5. Caleta de Maro | Nerja | 0.84; II | II | 1.00 | 0.92 | III | III | 0.56 | 0.55 | II | 0.73 | III | |
| 6. Cala Chumbo | 1.02; I | II | 0.46 | 0.52 | II | I | 0.0 | 0.0 | I | 0.26 | I | ||
| 7. Las Alberquillas | 0.95; I | II | 0.50 | 0.55 | II | II | 0.5 | 0.50 | II | 0.52 | II | ||
| 8. Cala del Pino | 0.95; I | II | 0.33 | 0.42 | II | II | 0.5 | 0.50 | II | 0.46 | II | ||
| 9. Cala El Cañuelo | 0.90; I | II | 0.50 | 0.55 | II | III | 0.5 | 0.50 | II | 0.52 | II | ||
| 10. Cantarrijan | Almuñecar | GR3 | 1.07; I | II | 0.33 | 0.42 | II | III | 0.56 | 0.61 | II | 0.51 | II |
| 11. Cala El Cambron | Salobreña | 0.68; II | II | 0.33 | 0.42 | II | III | 0.68 | 0.64 | II | 0.53 | II | |
| 12. La Rijana | Gualchos | 0.89; I | II | 0.38 | 0.45 | II | III | 0.62 | 0.47 | II | 0.46 | II | |
| 13. El Ruso * | Albuñol | 0.96; I | II | 0.67 | 0.67 | III | II | 0.5 | 0.38 | II | 0.52 | II | |
| 14. Punta Sabinar | El Ejido | AL4 | 0.82; II | II | 0.83 | 0.83 | III | I | 0.0 | 0.0 | I | 0.42 | II |
| 15. Cala Arena | Nijar | 0.96; I | II | 0.79 | 0.73 | III | II | 0.33 | 0.37 | II | 0.55 | II | |
| 16. Cala Raja | 1.04; I | II | 0.79 | 0.73 | III | II | 0.33 | 0.37 | II | 0.55 | II | ||
| 17. Cala de la Media Luna | 1.01: I | II | 1.00 | 0.89 | III | II | 0.42 | 0.44 | II | 0.67 | III | ||
| 18. Monsul | 1.19; I | III | 0.44 | 0.47 | II | II | 0.42 | 0.44 | II | 0.46 | II | ||
| 19. Barronal | 1.03; I | III | 0.67 | 0.64 | II | II | 0.33 | 0.37 | II | 0.51 | II | ||
| 20. Cala Grande | 1.09; I | II | 1.00 | 0.89 | III | II | 0.25 | 0.31 | I | 0.60 | II | ||
| 21. Los Genoveses | 1.26; I | III | 0.76 | 0.71 | III | II | 0.42 | 0.44 | II | 0.58 | II | ||
| 22. El Playazo | 1.12; I | II | 0.67 | 0.64 | II | II | 0.42 | 0.44 | II | 0.54 | II | ||
| 23. Cala de San Pedro | 0.85; I | II | 1.00 | 0.89 | III | III | 0.25 | 0.31 | I | 0.60 | II | ||
| 24. Cala del Plomo | 0.91; I | II | 0.92 | 0.89 | III | III | 0.44 | 0.46 | II | 0.67 | III | ||
| 25. Cala de Enmedio | 1.20; I | II | 0.58 | 0.64 | II | II | 0.25 | 0.31 | I | 0.48 | II | ||
| 26. Los Muertos | Carboneras | 0.93; I | II | 0.50 | 0.58 | II | III | 0.25 | 0.44 | II | 0.51 | II | |
| 27. El Sombrerico | Mojacar | 0.88; I | II | 0.42 | 0.52 | II | III | 0.56 | 0.48 | II | 0.50 | II | |
| 28. Bordenares | 0.94; I | II | 0.58 | 0.64 | II | III | 0.56 | 0.48 | II | 0.56 | II | ||
| 29. Los Cocedores * | Pulpi | 0.83; II | III | 0.78 | 0.79 | III | III | 0.62 | 0.72 | III | 0.75 | III | |
Publisher’s Note: MDPI stays neutral with regard to jurisdictional claims in published maps and institutional affiliations. |
© 2020 by the authors. Licensee MDPI, Basel, Switzerland. This article is an open access article distributed under the terms and conditions of the Creative Commons Attribution (CC BY) license (http://creativecommons.org/licenses/by/4.0/).
Share and Cite
Mooser, A.; Anfuso, G.; Williams, A.T.; Molina, R.; Aucelli, P.P.C. An Innovative Approach to Determine Coastal Scenic Beauty and Sensitivity in a Scenario of Increasing Human Pressure and Natural Impacts due to Climate Change. Water 2021, 13, 49. https://doi.org/10.3390/w13010049
Mooser A, Anfuso G, Williams AT, Molina R, Aucelli PPC. An Innovative Approach to Determine Coastal Scenic Beauty and Sensitivity in a Scenario of Increasing Human Pressure and Natural Impacts due to Climate Change. Water. 2021; 13(1):49. https://doi.org/10.3390/w13010049
Chicago/Turabian StyleMooser, Alexis, Giorgio Anfuso, Allan T. Williams, Rosa Molina, and Pietro P. C. Aucelli. 2021. "An Innovative Approach to Determine Coastal Scenic Beauty and Sensitivity in a Scenario of Increasing Human Pressure and Natural Impacts due to Climate Change" Water 13, no. 1: 49. https://doi.org/10.3390/w13010049
APA StyleMooser, A., Anfuso, G., Williams, A. T., Molina, R., & Aucelli, P. P. C. (2021). An Innovative Approach to Determine Coastal Scenic Beauty and Sensitivity in a Scenario of Increasing Human Pressure and Natural Impacts due to Climate Change. Water, 13(1), 49. https://doi.org/10.3390/w13010049