Article

Procedure for Calculating the Calcium Carbonate Precipitation Potential (CCPP) in Drinking Water Supply: Importance of Temperature, Ionic Species and Open/Closed System

1
Department of Environmental Engineering, Technical University of Denmark, Bygningstorvet 115, 2800 Kgs. Lyngby, Denmark
2
AA-Water ApS, Engsvinget 34, 2400 Copenhagen NV, Denmark
3
Formerly Vitens N.V., Oude Veerweg 1, 8019 BE Zwolle, The Netherlands
4
NIRAS A/S, Sortemosevej 19, 3450 Allerød, Denmark
5
HOFOR A/S, Ørestads Boulevard 35, 2300 Copenhagen S, Denmark
*
Author to whom correspondence should be addressed.
Water 2021, 13(1), 42; https://doi.org/10.3390/w13010042
Submission received: 6 November 2020 / Revised: 14 December 2020 / Accepted: 22 December 2020 / Published: 28 December 2020
(This article belongs to the Section Wastewater Treatment and Reuse)

Abstract

:
The calcium carbonate (CaCO3) precipitation potential (CCPP) can predict the potential for corrosion and lime scaling in drinking water systems. CCPP can be calculated by different standards, but none of these consider all of the conditions in drinking water systems where temperatures can reach 100 °C and the water exchanges CO2 with the atmosphere. We provided and demonstrated a procedure for CCPP calculations using the open-source software PHREEQC with the phreeqc.dat database at temperatures relevant for drinking water systems (10–90 °C) and for open systems in equilibrium with atmospheric CO2. CCPP increased by 0.17–1.51 mmol/kg when the temperature was increased from 10 °C to 90 °C and increased by 0.22–2.82 mmol/kg when going from closed to open systems at 10 °C. Thus, CaCO3 precipitation may be underestimated if CCPP is only considered for the lower sample temperature and for closed systems. On the other hand, CCPP10 decreased by 0.006–0.173 mmol/kg when including the ionic species from the German DIN 38404-10 standard in addition to calcium, alkalinity and pH, indicating that all relevant ionic species should be included in CCPP calculations. CCPP values should always be reported with the calculation procedure and temperature to avoid inconsistency in literature.

1. Introduction

Calcium carbonate (CaCO3) precipitation (lime scaling) on surfaces in drinking water systems can reduce the service lifespan and increase the energy consumption of, e.g., waters heaters due to reduced efficiency in heat transfer. In addition, consumers spend time and descaling chemical agents to remove lime scaling from surfaces [1]. To reduce CaCO3 precipitation, some drinking water utilities soften the drinking water by reducing the water hardness (mainly Ca2+ and Mg2+ ions) [2]. On the other hand, water that is too soft can become CaCO3-dissolving (aggressive), which can lead to corrosion, e.g., in the distribution networks and at the consumer [3].
The potential for CaCO3 precipitation in drinking water is not only caused by hardness, but is also affected by pH, alkalinity, temperature and the other ionic species present in the water [4]. The observed CaCO3 precipitation or dissolution in drinking water systems is further affected by, e.g., the presence of nuclei, scaling inhibitors, microbial activity, surface roughness and water velocity [5,6]. The potential for CaCO3 precipitation or dissolution can be determined experimentally by, e.g., the measured calcium carbonate precipitation (MCCP) or “aggressiveness” [7,8], but the resulting water type may not be available during, e.g., planning or designing softening. In such cases, the Calcium Carbonate Precipitation Potential (CCPP) is applicable. The CCPP is defined as the amount of CaCO3 that can theoretically precipitate or dissolve from the water in order to reach equilibrium with a solid CaCO3 phase [9]. Other indicators of CaCO3 saturation, such as the Langelier Saturation Index and Ryznar Index, only predict a thermodynamic driving force for precipitation or dissolution [4,5,9]. A CCPP of zero indicates that the water is in equilibrium with respect to solid CaCO3. If CCPP is negative, the water may dissolve CaCO3, and if CCPP is positive, precipitation of CaCO3 is possible [6].
CCPP is commonly used as a corrosion indicator to predict if drinking water is CaCO3-dissolving in distribution networks, which may corrode cement pipes and remove protective film of CaCO3 in, e.g., iron pipes [10]. On the other hand, water types with a high content of CaCO3 has low pH, which can cause undesired lead and copper release from pipes [2]. Distribution networks are considered closed systems without exchange with atmospheric CO2 [3,11,12]. Lahav and Birnhack (2007) reviewed water quality criteria and recommend a CCPP of 0.03–0.10 mmol CaCO3/L after post-treatment of soft waters to avoid the water to be corrosive [3]. The use of CCPP as an indicator for excess lime scaling is less frequent and must take into account that drinking water heats up in, e.g., showers and kettles. Raalte-Drewes et al. (2004) established a recommended CCPP at 90 °C (CCPP90) of <0.6 mmol/L to prevent extensive CaCO3 precipitation in water heaters [8].
Unfortunately, CCPP is calculated inconsistently in literature. CCPP is calculated iteratively and requires computerized models or spreadsheets [6]. Some studies have not reported the calculation method [3,8,13]. Others have calculated CCPP using software including PHREEQC, MINTEQA2, WATEQ4F, the Tetra Tech RTW model, STASOFT, [6,10,14,15] and AQUACALC that no longer is commercially available [16]. Including complexation is generally agreed to result in a more accurate prediction of the CCPP [4,6,17]. However, whereas some studies have included complexation with, e.g., sulphate (SO42−) and phosphate (PO43−) [9,18], others have considered only calcium, pH, alkalinity and sometimes temperature [3,8,14]. In drinking water systems, water exchanges CO2 with the atmosphere when it is tapped. De Moel et al. (2013) discussed the need for also calculating CCPP with CO2 exchange in open systems but did not propose a procedure for doing so [4]. As far as we are aware, such a procedure has not previously been established in literature.
The inconsistency in reported CCPP values hinders comparison of results across studies and can result in less accurate prediction of effects from drinking water softening. Calculating CCPP in conditions relevant in drinking water systems, including elevated temperatures and CO2 exchange with the atmosphere, will enable the prediction of both CaCO3 dissolution and precipitation, ultimately leading to strengthened decision-making and planning for, e.g., drinking water softening or other treatments altering drinking water mineral composition.

Aim

Our study aimed to provide a consistent procedure and recommendations for calculating CCPP as an indicator of both CaCO3 dissolution and precipitation in drinking water systems in an open-source software, and to demonstrate the influence of temperature, including different ionic species, and exchange with atmospheric CO2. As a foundation for the procedure and to include best practices, we provided a brief overview and evaluation of existing standards for CCPP calculations.

2. Existing Standards and Methods

CCPP calculation standards vary in terms of included solid phases, solubility constants and ionic species (Table 1). The Dutch NEN 6533 standard from 1990 provides a procedure for calculating the saturation index of water with an ionic strength <20 mmol/L and, as such, offers a measurement of the aggressiveness toward CaCO3 [7]. The NEN standard does not provide a procedure for calculating CCPP, but forms the calculation basis for the software AQUACALC, commonly used by Dutch water utilities to calculate CCPP [16]. The U.S. 2330 Standard Method provides an overview of computer software for calculating the saturation index and CCPP in drinking water and wastewater but suggests no specific procedure for calculating the CCPP [6]. The German DIN 38404-10 standard from 2012 describes the calculation of the “Calcitlösekapazität” (also reported as “Dc”) or calcite dissolution in drinking water, which has the opposite sign of CCPP [19]. Crystalline CaCO3 exist in three forms (polymorphs): Calcite, aragonite and vaterite. Calcite is considered the most thermodynamically stable at room temperature and pressure and is most commonly found in fresh water [6,20], and all three standards calculate CCPP based on equilibrium with solid calcite [6,7,19].
The temperature of drinking water varies from abstraction through distribution and at the point of use. Households and industries heat water to varying temperatures for cleaning, showering, cooking, etc. Out of the mentioned standards, only the 2330 Standard Methods is applicable for temperatures >60 °C (Table 1), representing, e.g., water heaters, coffee machines and kettles. The DIN 38404-10 standard was developed to assess if water is CaCO3-dissolving, indicated by the validation data where CCPP is negative for 9 out of 10 water types. The highest temperature included is 60 °C, but de Moel et al. (2013) argued that the DIN 38404-10 is not suitable for calculating CCPP at temperatures >45 °C [4]. Thus, the standard is not applicable for CCPP calculations in a temperature range relevant for drinking water systems. In drinking water systems, the water is furthermore exposed to atmospheric air, which is not considered in any of the standards (Table 1). CO2 exchange with the atmosphere is expected to increase the CCPP, and thereby increase scaling on surfaces, shower heads, tap aerators, etc., due to pH increasing when CO2 is degassed from the water.
The standards also vary in terms of ionic species included. The NEN 6533 standard includes only Ca2+, HCO3 and H+ [7]. The 2330 Standard Methods standard does not specify which ionic species are included, but states that CCPP is overestimated if the ion pair and alkalinity contribution of other species besides HCO3, CO32−, OH and H+ are neglected [6]. DIN 38404-10 is the most comprehensive of the three standards and considers various sulphate and phosphate complexes [19]. Depending on the computer software used, including additional ionic species may require additional programming and hence increase calculation complexity. Mehl and Johansen (2018), e.g., described how a program in the open-source software OpenModelica can be written for CCPP calculations in compliance with the German DIN 38404-10 standard, but excluded PO43− due to programming complexity [17].
None of the standards consider both dissolution and precipitation of CaCO3 in hot water up to 100 °C, and situations in which water exchanges CO2 with the atmosphere. The lack of consideration of high temperatures and of CO2 exchange with the atmosphere, as well as the lack of agreement on which ionic species to include in calculations, hinders a consistent comparison of CCPP values across studies.

3. Materials and Methods

3.1. Selection of Software and Database

We used PHREEQC version 3.4.0-12977 for CCPP calculations [23], which is widely used for groundwater chemistry modelling [24] but is also applicable for CCPP calculations [4,6]. PHREEQC is open-source and is maintained by the U.S. Geological Survey [23]. The Supplementary Materials includes example PHREEQC input files.
The PHREEQC database specifies which elements, ionic species, thermodynamic constants and solid phases are included in the CCPP calculations. It furthermore specifies how activity constants are calculated. We used the phreeqc.dat database for CCPP calculations, which contains solubility data for calcite and aragonite from Plummer and Busenberg (1982) that are valid for temperatures relevant in a drinking water system ranging from 0 °C to 90 °C [22]. Visscher and Vanderdeelen (2012) critically reviewed CaCO3 solubility data from 99 studies, including the data from Plummer and Busenberg (1982). The data from Plummer and Busenberg (1982) passed an initial screening and was used in 2 empirical models together with solubility data from other studies [25]. None of the data points from Plummer and Busenberg (1982) showed unacceptable deviation from the empirical models indicating that the data complies with other solubility data [25]. The solubility data from Plummer and Busenberg (1982) is also used in the 2330 Standard Methods, which also include the CaCO3 mineral vaterite. To comply with the 2330 Standard Methods, the PHREEQC database must include vaterite. The NEN 6533 standard uses solubility constants from Jacobson and Langmuir (1974) that were only determined at temperatures <50 °C. Its validity was recently questioned [4,21] and we do not recommend using it for CCPP calculations.
The phreeqc.dat database uses the Debye Hückel expression to calculate activity coefficients, similarly to the DIN 38404-10 standard [19,23]. This is applicable for water with an ionic strength <0.1 (unitless), which is the case for most fresh water [24]. The phreeqc.dat database allows for all the ionic species from the DIN 38404-10 standard to be included in the calculations. In addition to the complexes included in the DIN 38404-10 standard, phreeqc.dat includes CaHSO4+ as well as complexation with sodium (NaSO4, NaHCO3, NaCO3, NaF and NaOH) and potassium (KSO4 and KOH). Stimela.dat is a database file developed for the Stimela modelling platform at Delft University of Technology and is an extension of phreeqc.dat which includes vaterite [4]. We observed that CCPP deviated with ≤0.01 mmol/kg between phreeqc.dat and stimela.dat, indicating only a limited effect of including vaterite. Consequently, we used phreeqc.dat to avoid using an external database.

3.2. Selected Water Types

We selected 5 example water types representing a wide range of CCPP (both under- and oversaturated with calcite) and mineral compositions from Northern Europe (Table 2). The water types include untreated groundwater (“Frederiksberg”), drinking water produced from groundwater (“Thorsbro”), drinking water softened with pellet softening (“Brøndbyvester”), drinking water softened by reverse osmosis (“Lekkerkerk”) and surface water (“Ülemiste”). The Frederiksberg drinking water treatment plant (DWTP) is operated by Frederiksberg Forsyning in Denmark. We included groundwater from an abstraction well (“FF3 DGU 201.5311”). The groundwater is very hard (6.3 mmol/L) and contains iron (0.07 mmol/L) since the water is untreated. The Thorsbro and Brøndbyvester DWTPs are operated by the Greater Copenhagen Utility (HOFOR), and the treatment process consists of aeration followed by rapid sand filtration. At the Brøndbyvester DWTP, the water is softened with pellet softening (NaOH and CO2 addition) prior to aeration resulting in a water hardness of 1.98 mmol/L, whereas the hardness in drinking water from Thorsbro DWTP is 4.60 mmol/L. Lekkerkerk DWTP is operated by the Dutch utility Oasen. Riverbank-infiltrated groundwater is treated with reverse osmosis before being mixed with another groundwater type, which is then filtered with rapid sand filtration and granular activated carbon. The Lekkerkerk drinking water has a hardness of 1.33 mmol/L. Finally, we included drinking water with a hardness of 2.02 mmol/L produced from surface water at the Estonian DWTP Ülemiste operated by Tallinna Vesi. The water from lake Ülemiste is mechanically filtered prior to ozonation and coagulation followed by sand filtration and chlorination [26].

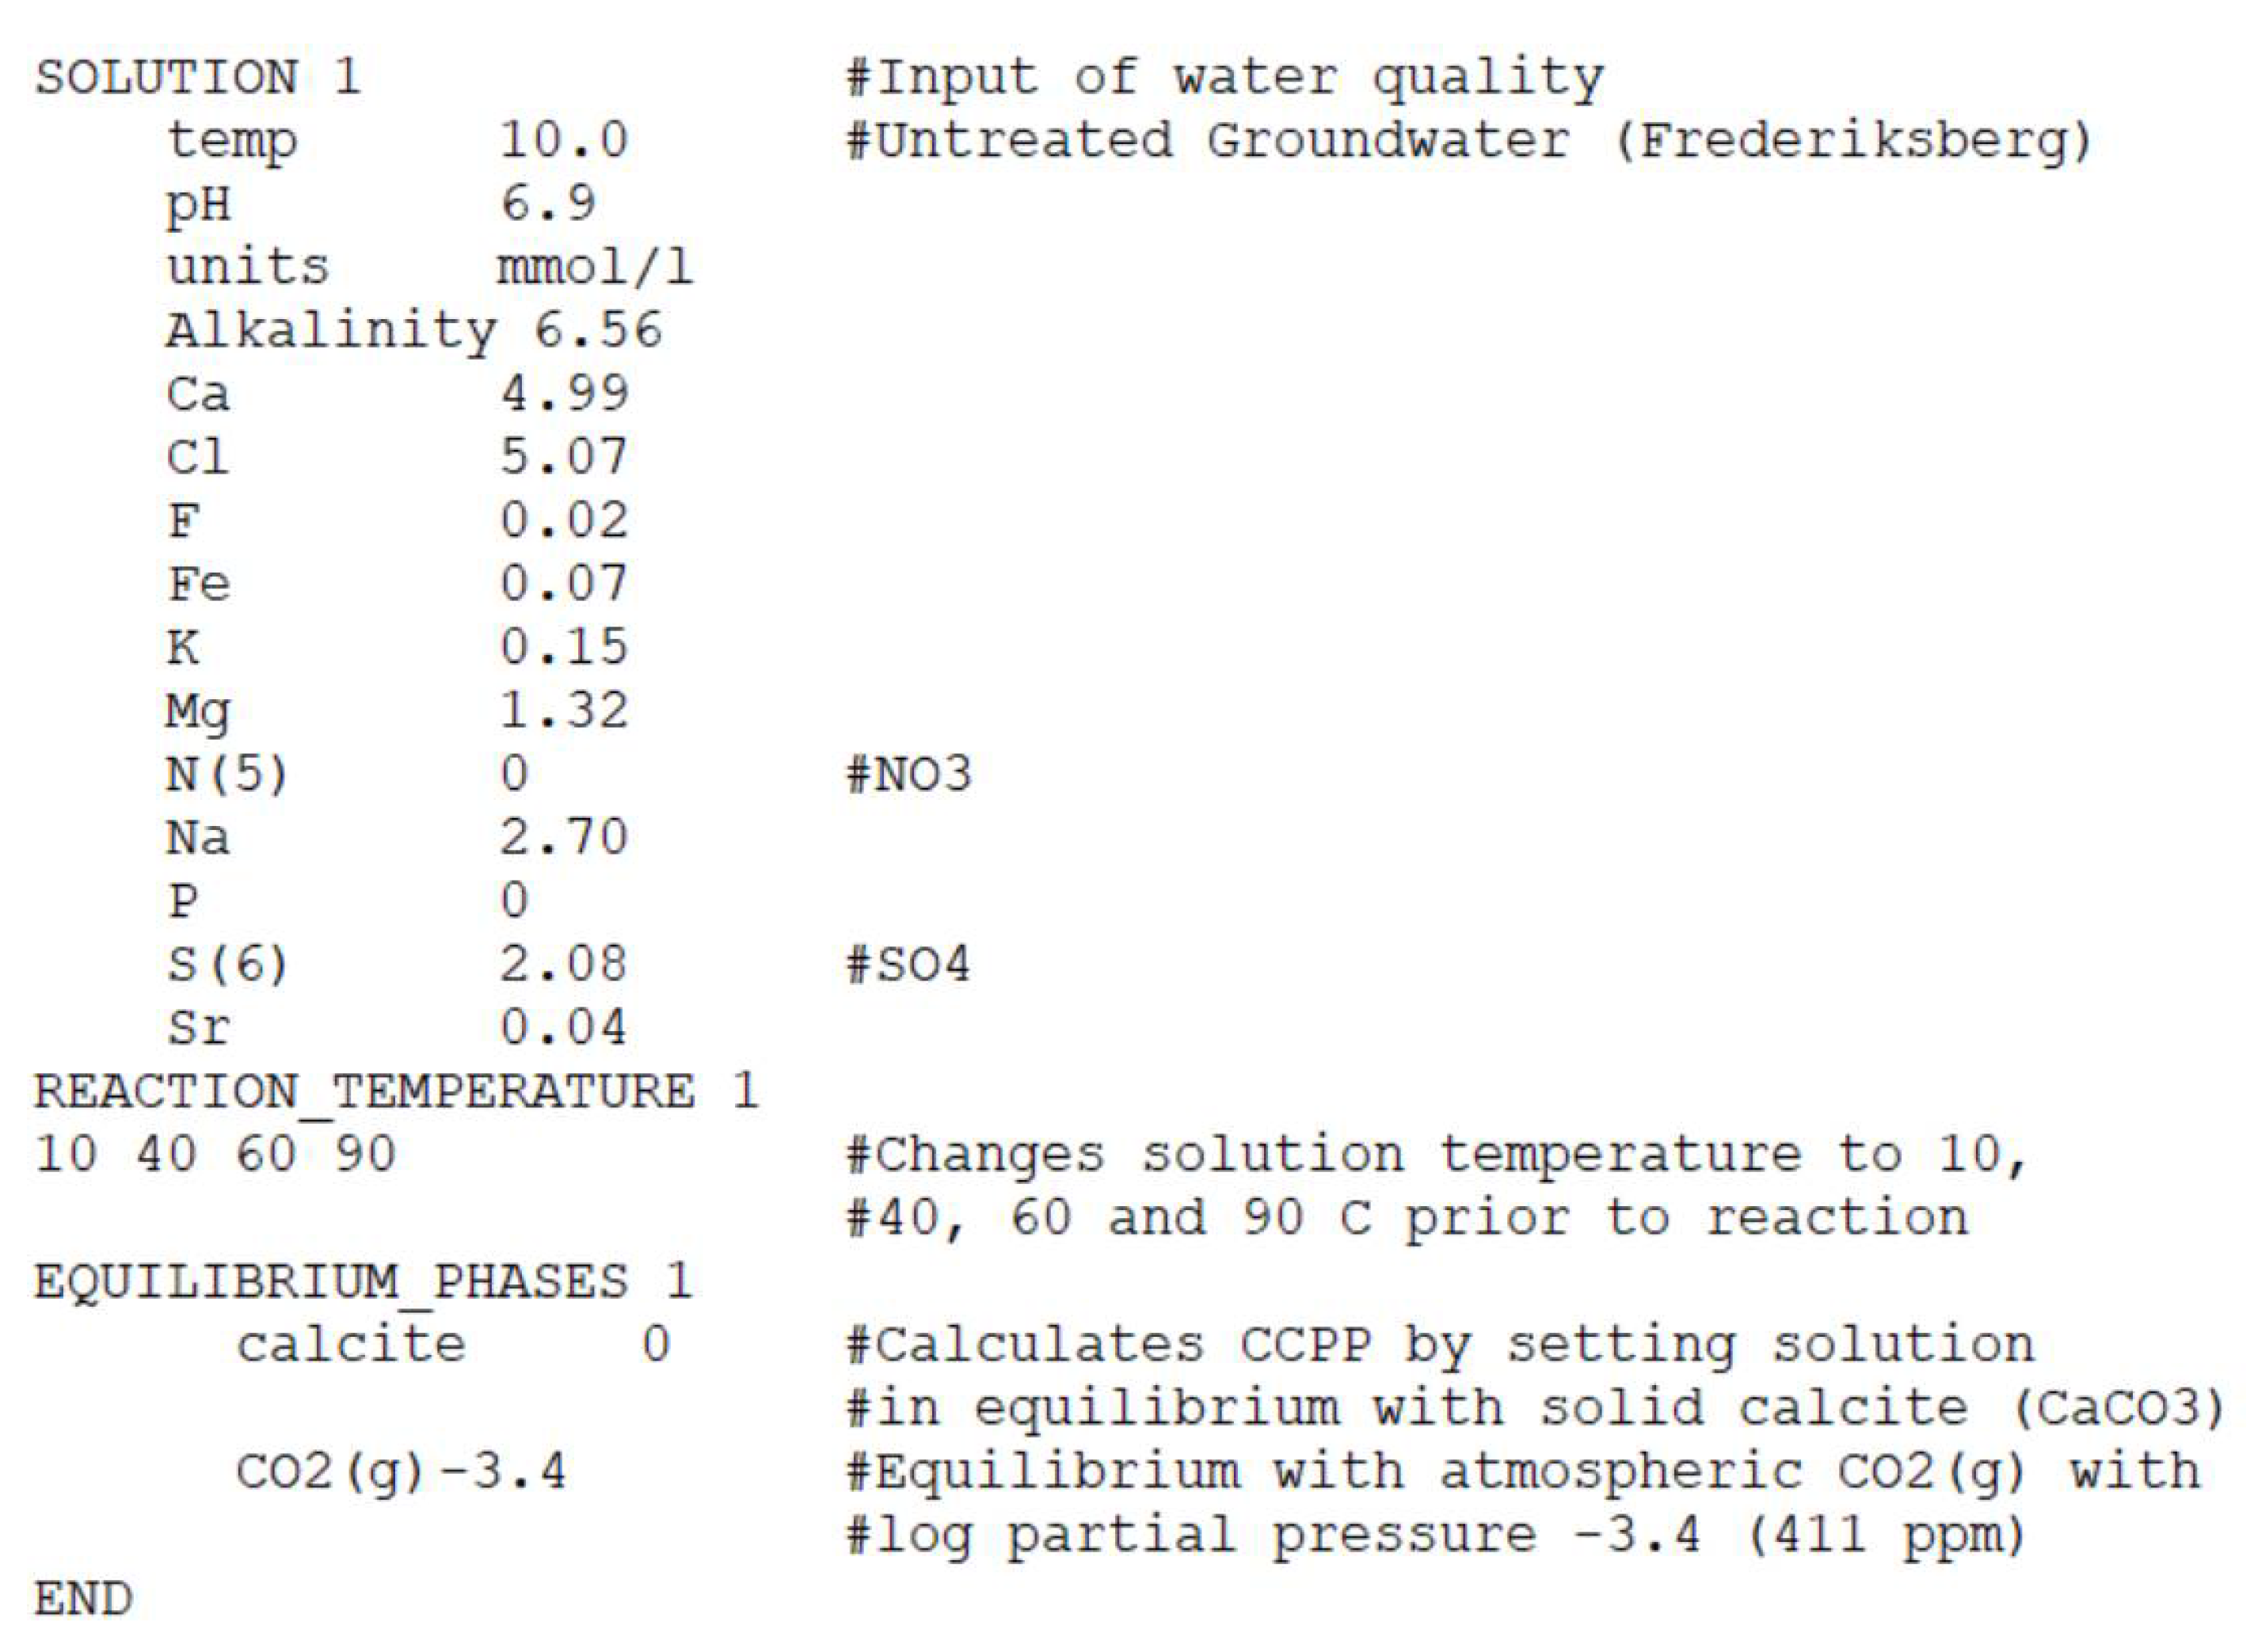
3.3. Demonstration of Calculation Method

To demonstrate the CCPP calculation procedure, we investigated the importance of temperature, included ionic species and CCPP in open versus closed systems for the 5 water types. Appendix A provides PHREEQC calculation examples, and PHREEQC input files are available in the Supplementary Materials. The principle for calculating CCPP in PHREEQC is to set the water type (in PHREEQC, called “solution”) in equilibrium with calcite (CaCO3). As a starting point, we assumed no CO2 exchange with the atmosphere, representing closed systems, but we also investigated CCPP calculations for open systems in equilibrium with atmospheric CO2 (Section 4.3). We calculated CCPP at temperatures ranging from 10 °C to 90 °C in 81 intervals of 1 °C. To investigate the importance of including ionic species, we calculated CCPP with 3 levels of concentration data: (1) Only calcium (Ca), alkalinity, temperature and pH as input; (2) including also magnesium (Mg), sodium (Na), potassium (K), chloride (Cl), phosphate (PO43−), sulphate (SO42−) and nitrate (NO3) in addition to (1), which corresponds to the species included in the DIN 38404-10 standard; and (3) the same as (2), but adding iron (Fe), strontium (Sr) and fluoride (F) that were the elements in the highest concentrations not already included.
We investigated the compliance with the DIN 38404-10 standard by calculating CCPP for the 10 water types in the DIN 38404-10 validation data. De Moel et al. (2013) developed a PHREEQC database file (“din38404-10_2012.dat”) that contains the elements, ionic species and solubility data from the DIN 38404-10 standard [4]. We calculated CCPP using this database and the phreeqc.dat database, and compared the results to the CCPP (i.e., negative sign of “DC” values in the standard) values provided in the DIN 383404-10. In order for the results to comply with the standard, the deviation between the calculated and provided CCPP values must not exceed 0.001 mmol/L [19].
We investigated the importance of accuracy in pH measurements by calculating CCPP at the measured pH (Table 2), the measured pH ± 0.01 and the measured pH ± 0.05 while keeping the remaining water chemistry constant. Finally, we calculated CCPP for open systems with exchange with atmospheric CO2 by setting the solution in equilibrium with both calcite and the atmospheric partial pressure of CO2, here 411 ppm [27]. In practice, PHREEQC calculates the equilibrium based on the log partial pressure, which is −3.4 for 411 ppm.

4. Results

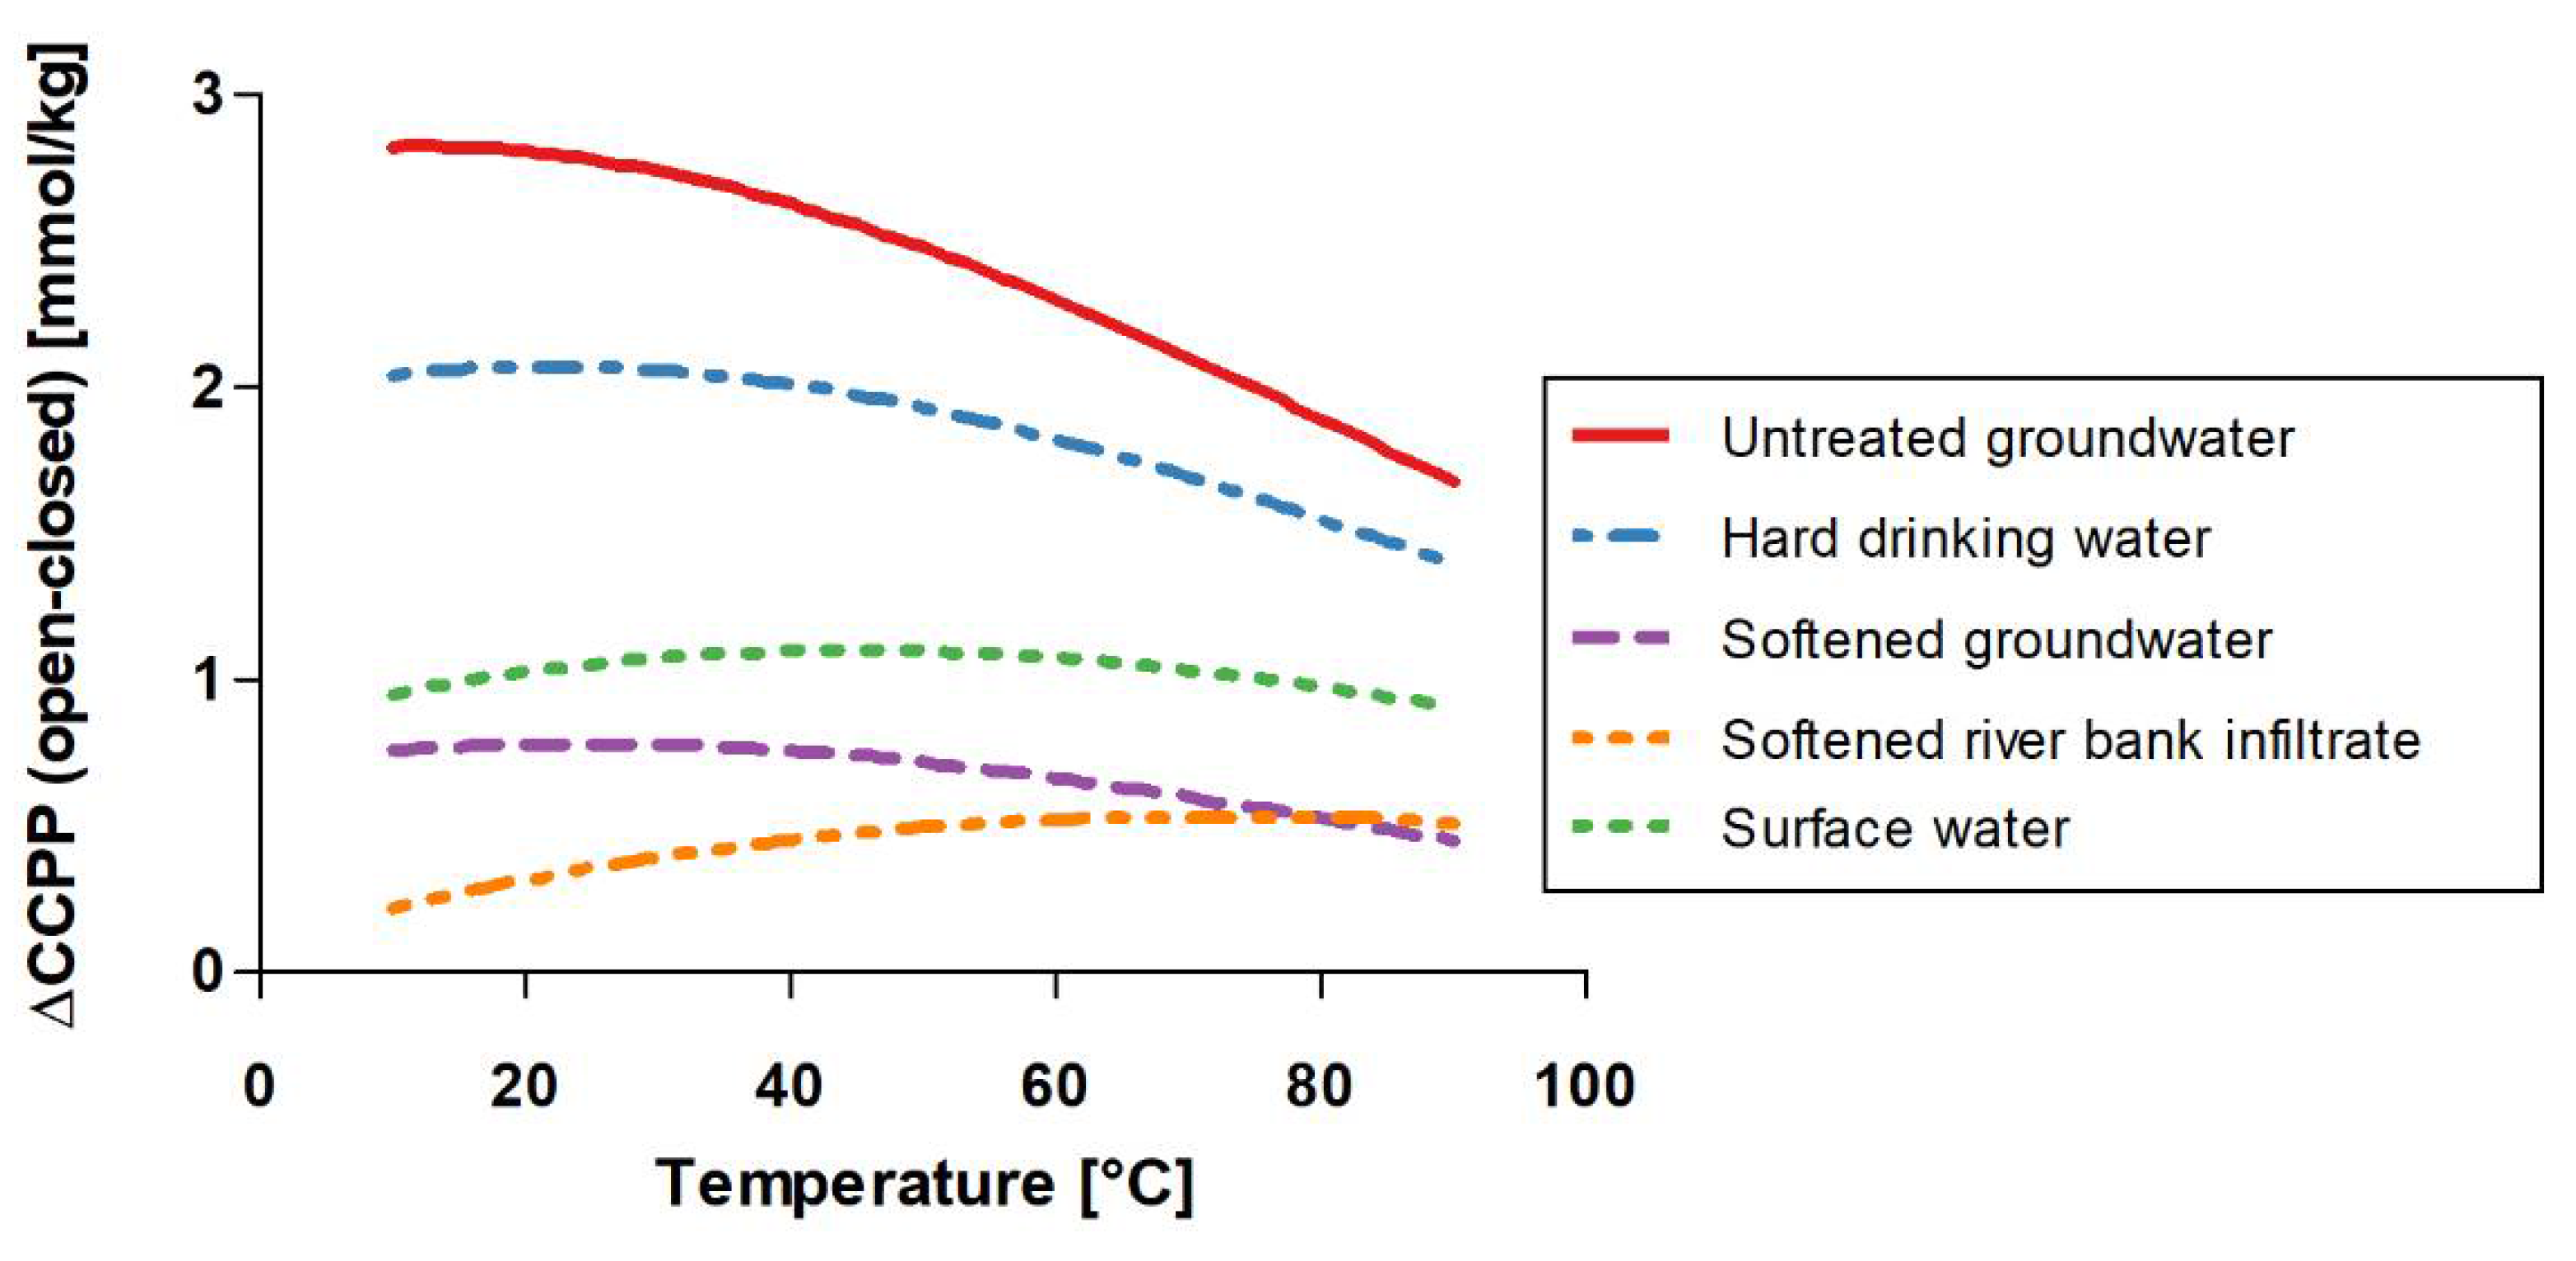
4.1. Temperature Dependency

When increasing the water temperature, the density decreases [4], which none of the included standards consider [6,7,19]. The density of pure water decreases from 1.00 g/cm3 to 0.97 g/cm3 when heated from 10 °C to 90 °C. If CCPP90 is calculated for a water sample analysed at 10 °C, CCPP90 can be slightly underestimated if the decrease in density is not considered. However, PHREEQC calculates reactions in molality (i.e., mmol/kg water) and not molarity (i.e., mmol/L water) and automatically adjusts the density according to the water temperature. The output from PHREEQC is in molality, which we also report in this study to avoid ambiguity. In practice, PHREEQC output reported in mmol/L refers to 1.00 L of the water sample at the sample temperature.
CCPP increased by 0.17–1.51 mmol/kg when increasing the temperature from 10 °C to 90 °C (Figure 1). The solubility of CaCO3 decreases with increasing temperature [22] and, consequently, more precipitation is observed at higher temperatures in, e.g., water heaters and during boiling [5], which is in line with the observed CCPP increase.
The very hard water types (Frederiksberg and Thorsbro) increased the most (1.08–1.51 mmol/kg) compared to the softer water types (0.17–0.50 mmol/kg). The CCPPsample of the untreated groundwater (Frederiksberg) was −0.04 mmol/kg at the sample temperature (10 °C). Despite being the hardest water type included in our analysis, the near-zero value indicates that the untreated groundwater was close to CaCO3 equilibrium. CCPP of the untreated groundwater increased to 1.47 mmol/kg at 90 °C, similar to the CCPP90 of the very hard drinking water (1.49 mmol/kg). The water from Ülemiste DWTP was aggressive at temperatures between 10 °C and 50 °C and supersaturated with CaCO3 at temperatures >50 °C. The Ülemiste DWTP had the lowest CCPP10, whereas softened riverbank infiltrate (Lekkerkerk) had the lowest CCPP90. This illustrates the importance of calculating CCPP at relevant temperatures when, e.g., assessing the effects from different softening technologies with varying effects on the water chemistry. We recommend calculating CCPP at the following temperatures to represent the potential for CaCO3 dissolution and precipitation at typical states in most drinking water systems: The sample temperature (distribution networks), 40 °C (shower), 60 °C (water heater) and 90 °C (boiling water).

4.2. Importance of Ionic Species

To investigate the importance of complexation and ionic activities, we calculated CCPP with varying numbers of elements and the associated ionic species from the phreeqc.dat database (Table 3). PHREEQC calculations consider the redox state of ionic species.
When including the ionic species from the DIN 38404-10 standard in addition to Ca, pH and alkalinity, CCPP10 decreased by 0.006–0.173 mmol/kg and CCPP90 decreased by 0.021–0.188 mmol/kg (Table 3). The decrease in CCPP is due to complexation and decreased ionic activity of CaCO3 with increasing ionic strength. Including F, Fe and Sr had no effect on CCPP for the three softer water types, whereas CCPP10 further decreased by 0.004 mmol/kg and CCPP90 decreased by 0.007 mmol/kg for the untreated groundwater, and CCPP90 decreased by 0.002 mmol/kg for the very hard drinking water. Adding F, Fe, Sr beyond DIN 38404-10 had a negligible effect on the CCPP results. The activities of Ca2+ and CO32−, and thereby CCPP, depend on the ionic strength [6]. We expect that additional trace concentration ions (e.g., lead, nickel and zinc) will have very limited or no effect on the ionic strength and the calculated CCPP.
CCPP calculations based on only Ca, pH and alkalinity may overestimate the CCPP. When using CCPP for, e.g., assessing the corrosion potential in distribution pipes, water types being corrosive (i.e., negative CCPP) may be classified as noncorrosive if excluding relevant ionic species in the calculations. When CCPP is used for, e.g., assessing the effects from drinking water softening by the consumers, it is important to be aware of changes to the water composition in the distribution networks that could affect CCPP. This could include mixing with other water types or the addition of corrosion inhibitors.
Including ionic species in CCPP calculations in PHREEQC requires analysis for the total concentration of each element in the water sample and inclusion in the input file and database file. However, it requires no additional programming and is hence relatively simple. For CCPP calculations, our recommendation is to include the ionic species specified in the DIN 38404-10 standard and any additionally measured species included in the PHREEQC database.

4.2.1. Compliance with DIN 38404-10

The DIN 38404-10 standard is the only of the investigated standards that provides datasets for validating CCPP calculations (Table 1) [19]. It allows for a maximum deviation of 0.001 mmol/L from the CCPP values reported in the 10 validation datasets [19]. Expanding the set of ions included in the DIN 38404-10 standard with F, Fe and Sr decreased CCPP10 by 0.004 mmol/kg and CCPP90 by 0.009 mmol/kg for untreated groundwater (Section 4.2), indicating an effect on CCPP and resulting in calculations not in compliance with the standard. The DIN 38404-10 was developed for water types typically observed in Germany and the standard does not explain the choice of elements, ionic species or solubility data. Elements not suggested by DIN 38404-10 may appear in high concentrations in other parts of the world. To maximize the accuracy of the calculated CCPP, it may be relevant to include elements beyond those in the DIN 38404-10 standard.
We calculated CCPP for the 10 validation water types in DIN 38404-10 using the two PHREEQC database files “phreeqc.dat” and “din38404-10_2012.dat,” developed for DIN 38404-10 compliance by de Moel et al. (2013), to investigate if the results complied with DIN 38404-10 (Table 4).
Using the database file specifically developed for the DIN 38404-10 standard, all 10 CCPP values complied with the validation data. Changing the database to the phreeqc.dat database resulted in only two water types (S2 and S7) complying with the standard’s requirement of less than 0.001 mmol/L difference (Table 4). The differences were due to effects of using inconsistent solubility data in the CCPP calculations. The highest difference (0.021 mmol/L) was observed for water type S3, with the highest ionic strength (15.2 mmol/L). For most practical purposes, the difference between the two databases would be negligible. However, the phreeqc.dat database is continually updated by the U.S. Geological Survey and contains solubility data for calcite and aragonite at temperatures relevant in drinking water systems (0–90 °C) [22,23]. To avoid adjustment of database files, we recommend using the phreeqc.dat database for CCPP calculations in PHREEQC unless compliance with the DIN 38404-10 standard is required.

4.2.2. pH Dependency

The pH governs the speciation of inorganic carbon in drinking water and thereby affects the CCPP. In order to investigate the importance of pH and the accuracy of pH analyses, we calculated CCPP10 and CCPP90 at the measured pH, the measured pH ± 0.01 and the measured pH ± 0.05 for the five water types with all analysed ions (Table 5). The variations in pH represent typical variations in pH readings and ±0.05 is the accepted accuracy in the DIN 38404-10 standard [19].
CCPP10 and CCPP90 varied by ≤0.02 mmol/kg when varying pH by ±0.01, whereas CCPP10 varied by ±0.01–0.10 mmol/kg and CCPP90 varied by ±0.0–0.04 mmol/kg when varying pH by ±0.05 (Table 5). This underlines that the accuracy of pH analyses should be considered when calculating CCPP, especially at lower temperatures and close to equilibrium. Such inaccuracies in pH analyses may cause variations in CCPP, which may exceed the maximum deviation allowed in the CCPP validation datasets (0.001 mmol/L) in the DIN 38404-10 standard. De Moel et al. (2013) argued that the tolerance levels in DIN 38404-10 are not equivalent to the acceptable accuracy of pH measurements of ±0.05 [4], which is in line with our results. Due to the importance of pH in CCPP calculations, the accuracy of pH measurements should be considered when sampling and analysing water samples for CCPP calculations. Sometimes, pH is adjusted to a standard temperature (e.g., 25 °C) by the instrument. In such cases, pH at the sample temperature should also be reported or pH should be calculated back to pH at the sample temperature. For water samples, e.g., not in equilibrium with atmospheric CO2 or highly scaling (i.e., high CCPP), pH measurements should be performed as quickly as possible to avoid pH changes due to CO2 exchange with the atmosphere or CaCO3 precipitation in the sample.

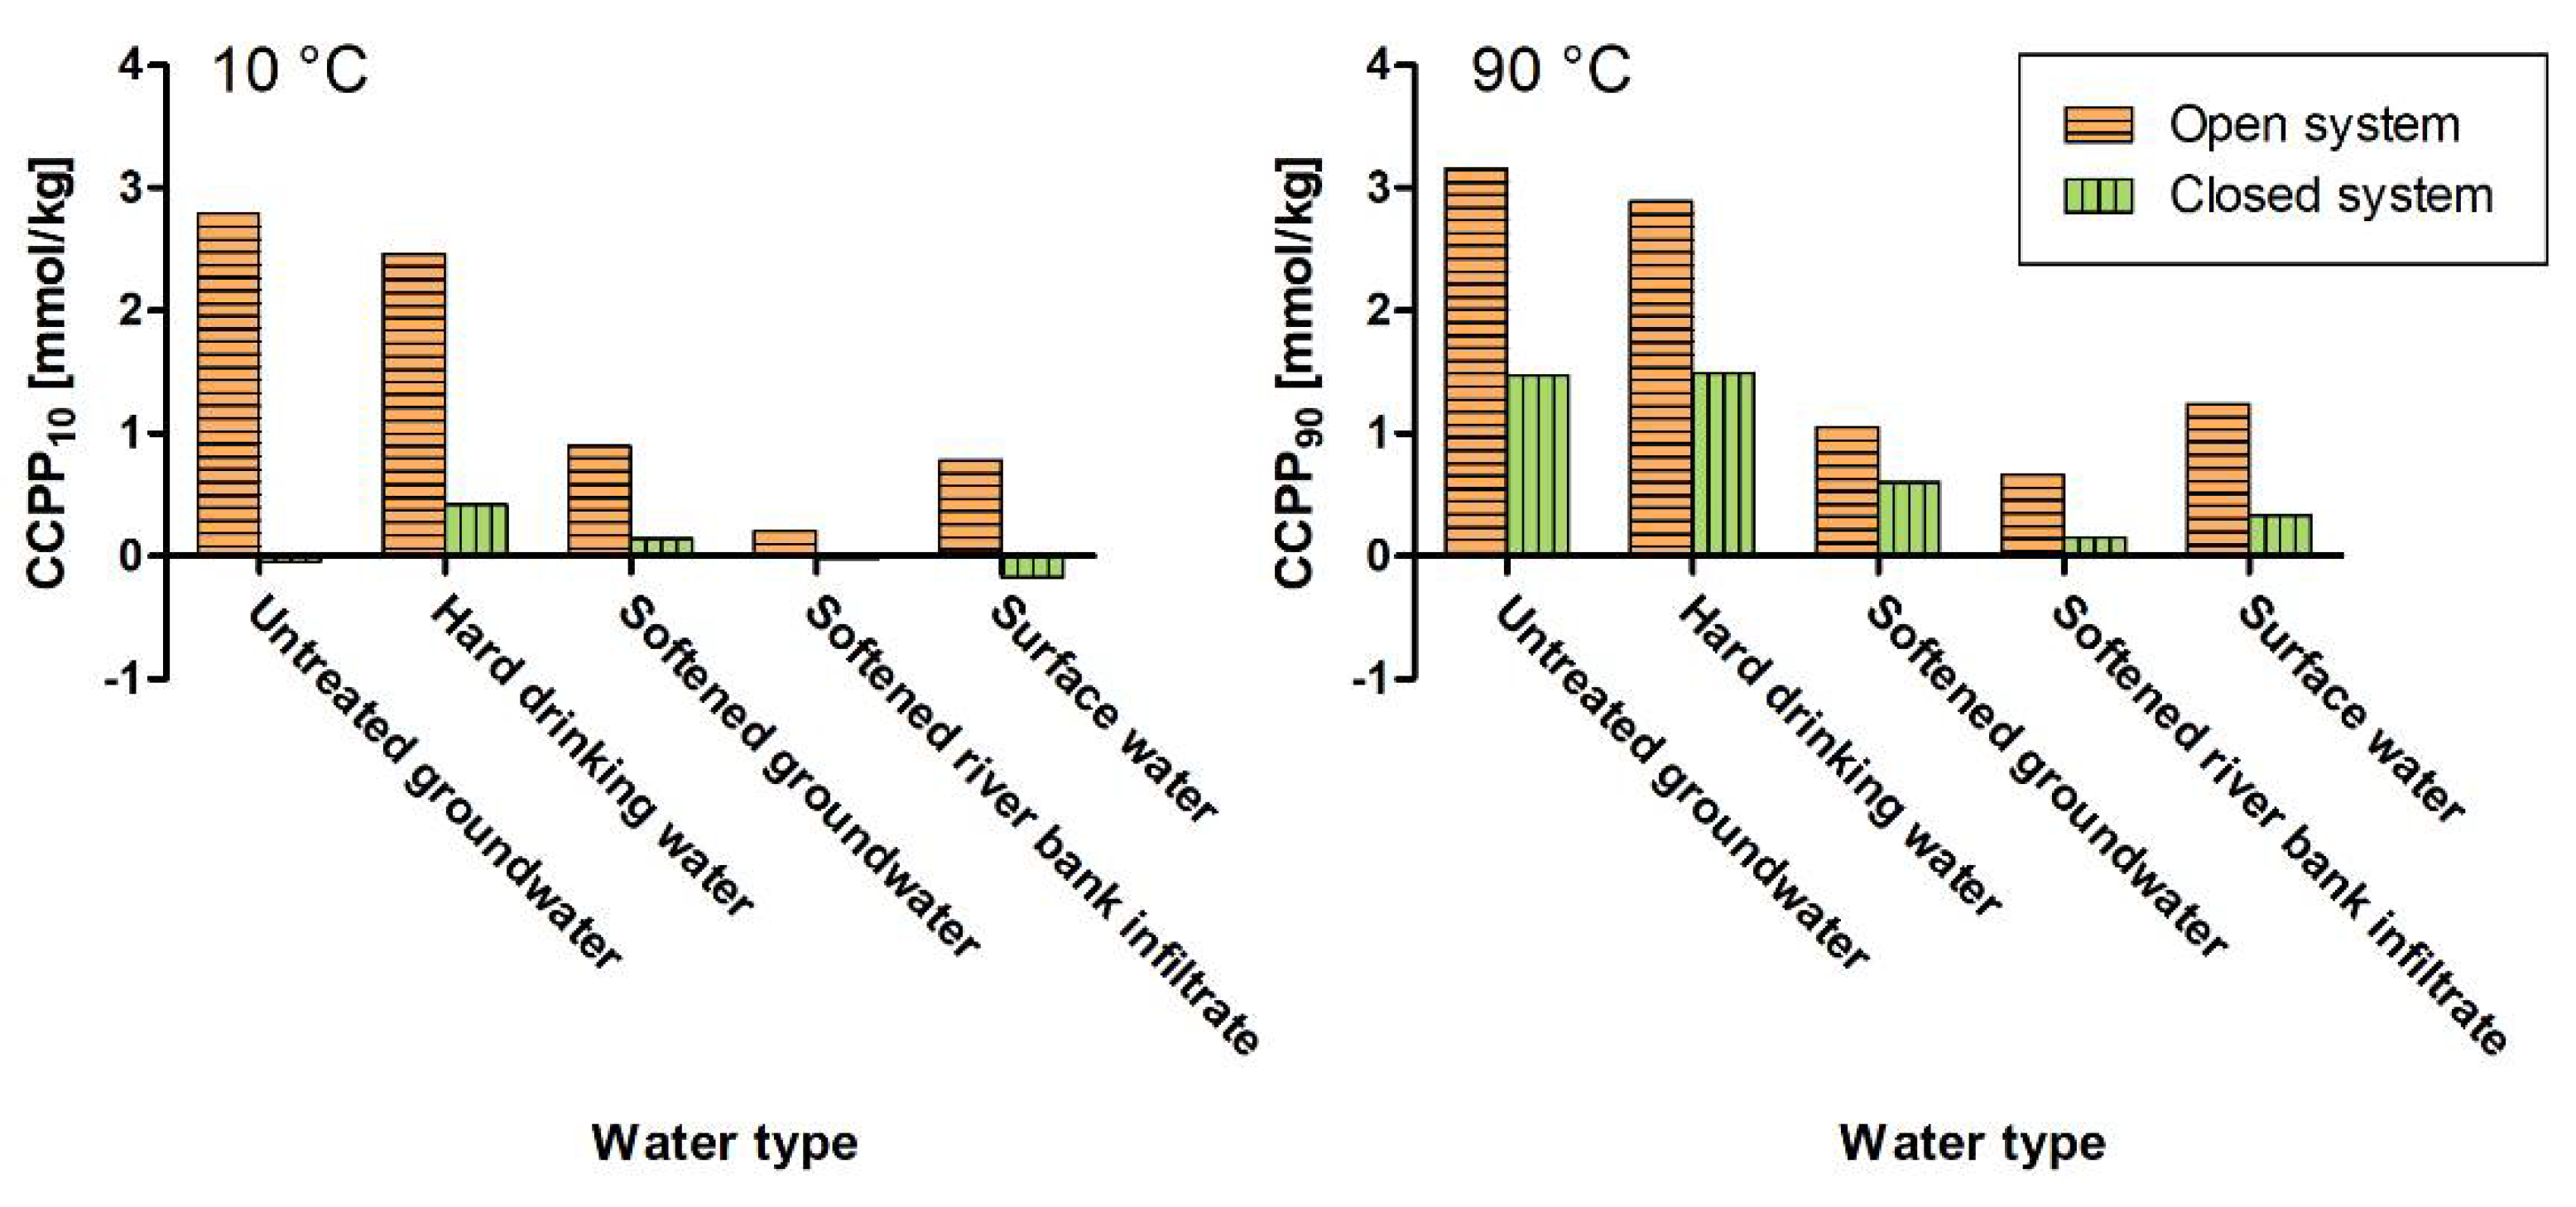
4.3. Open Versus Closed Systems

CCPP is traditionally calculated for closed systems without any contact with atmospheric CO2 resembling distribution networks. However, when drinking water is tapped, it is in contact with the atmosphere changing the equilibrium of CO2 (g) and CO2 (aq), thereby changing CCPP.
We calculated CCPP for open and closed systems at 10 °C and 90 °C for five water qualities (Figure 2).
CCPP was higher for the open systems compared to the closed systems for all five water types (Figure 2). It increased from −0.17–0.42 mmol/kg to 0.20–2.79 mmol/kg at 10 °C and from 0.15−1.49 mmol/kg to 0.66–3.15 mmol/kg at 90 °C. In open systems, CCPP of all water types was >0 mmol/kg. Using CCPP as a corrosion indicator requires that CCPP is calculated for closed systems resembling, e.g., the distribution networks where corrosion may occur. On the other hand, CCPP for open systems reflects the maximum precipitation potential for scaling in situations with CO2 in equilibrium with the atmosphere.
The difference between CCPP for open and closed systems was calculated as function of temperature (10–90 °C) for the five water types (Figure 3).
Untreated groundwater had the largest difference between a closed and open system (2.82 mmol/kg), indicating that the groundwater was the water type furthest from equilibrium with atmospheric CO2. This is in accordance with confined aquifers without contact to the atmosphere. The difference in CCPP from closed to open system was higher for the hard water types (increase of 2.04–2.82 mmol/L at 10 °C) compared to the softer water types (increase of 0.22–0.95 mmol/L at 10 °C) (Figure 3). For the hard water types (Thorsbro and Frederiksberg) and softened groundwater (Brøndbyvester), the difference between open and closed systems decreased with increasing temperature. The opposite was the case for softened riverbank infiltrate, where the difference between CCPP for open and closed systems increased with increasing temperature. Finally, the difference in CCPP first increased with increasing temperature until 50 °C and then decreased for the surface water (Figure 3). The results illustrate that the relationship between CCPP values calculated at different conditions (e.g., temperature, and with and without CO2 exchange with the atmosphere) is complex and cannot be predicted based on, e.g., linear regression.
CCPP is higher in hot water compared to the colder tap water, in accordance with Section 4.1. Consumer complaints about scaling are often related to water in open systems with contact to atmospheric CO2 and include stains on the bathroom shower walls, on the washbasin and in the tap aerators and, consequently, increased consumption of descaling agents. Other studies have shown that distribution networks have scaling even though CCPP is lower for closed systems and such scaling can be experienced as complaints about low flow rates in the network [28]. We recommend that CCPP is calculated both for open and closed systems when assessing the CaCO3 dissolution and precipitation potential on surfaces in drinking water systems.

4.4. Recommended Procedure

CCPP values depend on the calculation method, which water temperatures are considered, which ionic species are included and the solubility data applied, and whether the system is open or closed. When calculating CCPP in drinking water systems, we recommend that you:
  • Use PHREEQC for calculations with the phreeqc.dat database unless compliance with DIN 38404-10 is required.
  • At least include Ca, pH, temperature, alkalinity, Mg, Na, K, Cl, PO43−, NO3, SO42− and complexes with SO42− and PO43−. Additionally, measured elements may be included if they are present in macro concentrations and their ionic species are included in the PHREEQC database file.
  • Calculate CCPP at a range of temperatures to estimate the CaCO3 dissolution and precipitation potential throughout the distribution networks and at the consumer. The relevant temperatures are the sample temperature (distribution networks), 40 °C (shower), 60 °C (water heater) and 90 °C (boiling water). Using the phreeqc.dat database ensures that the solubility constants for CaCO3 are valid at temperatures 0–90 °C.
  • Calculate CCPP both for open systems with atmospheric CO2 exchange to estimate the maximum CaCO3 scaling potential of drinking water and for systems without CO2 exchange to investigate the corrosion and scaling potential in closed systems.
  • Report the calculation method and software along with CCPP. This should at least include the temperature, included elements and ionic species, solubility data or database, software and standard followed (if applicable).
A description of how we calculated CCPP at temperatures 10–90 °C in an open and a closed system in PHREEQC is provided in Appendix A.

5. Discussion

The procedure for calculating CCPP proposed in this study includes complexation, open/closed systems and water temperature, thereby considering different effects of water chemistry on CCPP. Studies estimating the socioeconomic effects from drinking water softening have estimated the effects based on water hardness, although many of the effects from softening are associated with a reduction of lime scaling in household appliances and installations [1,29]. We suggest that the research community directs attention to the relation between the theoretical CCPP values and the observed precipitation and associated effects in distribution systems and in households and industries. Different technologies for drinking water softening may result in the same water hardness, but in different CCPP calculated for closed systems due to different mechanisms for hardness removal [30], illustrating that CCPP provides additional information about the resulting water chemistry when, e.g., designing drinking water softening.
CaCO3 precipitation and dissolution is a complex phenomenon that also depends on water flow velocity [13], surfaces available for precipitation [6] and if nuclei are present in the water [5,6]. Natural organic matter (NOM), magnesium and sulphate can, e.g., inhibit the crystallization of CaCO3 by sorption to the crystal surface or substituting Ca2+ in the crystal lattice [6,20]. These effects are not included in the calculation of CCPP. Furthermore, CCPP calculations assume that equilibrium with solid calcite is achieved, which may not be the case due to residence times that are too short. Consequently, CCPP represents a theoretical, maximum potential for CaCO3 dissolution or precipitation that may vary from the observed scaling in, e.g., kettles, distribution pipes or water heaters, and should be used as a tool for estimating the risk and degree of CaCO3 dissolution and precipitation.
If drinking water softening aims to fulfil specific CCPP thresholds, e.g., in designs to minimize CaCO3 precipitation at the consumer, it is essential that CCPP calculations follow the same procedure as the method used to establish the limit. This calls for the development of an internationally agreed upon standard for CCPP calculations to avoid inconsistency and ensure that results across studies are comparable.

6. Conclusions

We provided and demonstrated a procedure for calculating CCPP in drinking water systems using the open-source speciation software PHREEQC and conclude that:
  • Several standards are available for CCPP calculations, but none of these consider both dissolution and precipitation of CaCO3 in drinking water systems where temperatures can reach 100 °C and the water can exchange CO2 with the atmosphere.
  • CCPP is temperature-dependent and increased by 0.17–1.51 mmol/kg for five different water types when increasing the temperature from 10 °C to 90 °C, which must be considered when calculating CCPP in drinking water systems.
  • The elements and ionic species included in CCPP calculations affect the results. CCPP decreased by 0.006–0.173 mmol/kg when including Mg, Na, K, SO42−, PO43− and NO3, and associated complexes in addition to Ca, pH and alkalinity.
  • CCPP10 increased by 0.22–2.82 mmol/kg when calculating CCPP for open systems in contact with atmospheric CO2. To resemble conditions in drinking water systems, CCPP should be calculated for both closed and open systems with and without CO2 exchange.
The CCPP values should always be reported with information on the calculation procedure to ensure consistent comparisons across studies. Consistent CCPP calculations will strengthen decision-making and planning for, e.g., drinking water softening or other processes affecting drinking water mineral composition.

Supplementary Materials

The following are available online at https://www.mdpi.com/2073-4441/13/1/42/s1, example PHREEQC input files. Figure S1: Importance of temperature; Figure S2: CCPP in open systems with CO2 equilibrium; Table S1: Importance of ionic species (Ca, alkalinity, pH and temperature only); Table S2: Importance of ionic species (DIN 38404-10 + F, Sr and Fe); Table~S3: Importance of ionic species (Ions from DIN 38404-10); Table S4; Table S5: Importance of pH (Sample pH + 0.01); Table S6: Importance of pH (Sample pH + 0.05); Table S7: Importance of pH (Sample pH - 0.01); Table 5: Importance of pH (Sample pH - 0.05).

Author Contributions

Conceptualization, C.T., B.G., H.A., H.-J.A. and M.R.; Data curation, C.T. and M.R.; Formal analysis, C.T. and B.G.; Funding acquisition, J.B.K., P.S.R. and H.-J.A.; Investigation, C.T.; Methodology, C.T., B.G., H.A., M.v.R., H.-J.A. and M.R.; Project administration, C.T. and H.-J.A.; Resources, C.T.; Software, C.T., B.G., H.A. and M.R.; Supervision, J.B.K., P.S.R., H.-J.A. and M.R.; Validation, B.G., H.A. and M.v.R.; Visualization, C.T. and B.G.; Writing—original draft, C.T. and B.G.; Writing—review & editing, C.T., B.G., H.A., M.v.R., J.B.K., P.S.R., H.-J.A. and M.R. All authors have read and agreed to the published version of the manuscript.

Funding

This research received no external funding.

Institutional Review Board Statement

Not applicable.

Informed Consent Statement

Not applicable.

Data Availability Statement

Publicly available datasets were analysed in this study. This data can be found here: https://data.geus.dk/JupiterWWW/index.jsp (accessed on 27 December 2020) and here: https://tallinnavesi.ee/wp-content/uploads/2020/03/Joogivee-kvaliteet-2019-1.pdf (accessed on 27 December 2020).

Acknowledgments

We thank Ruud Kolpa (Oasen), Kristiina Soovik (Tallinna Vesi) and Lars Orio (Frederiksberg Forsyning) for contributing with water quality data and information about the treatment process at the different drinking water treatment plants.

Conflicts of Interest

The authors declare no conflict of interest.

Appendix A

Appendix A.1. Calculating CCPP in PHREEQC

We used the PHREEQC version 3.4.0-12977 for CCPP calculations [23]. In the following, we provide a short guide for calculating CCPP of one water type at different temperatures with and without atmospheric CO2 equilibrium (open/closed system). The PHREEQC user’s guide provides an abundance of features and documentation [23].
PHREEQC calculates based on thermodynamic data for the ionic species and minerals included in a database file. Databases vary e.g., in terms of the elements included and how ionic activities are calculated. The user selects an appropriate database file for the calculations depending on the system [23]. For CCPP calculations, we recommend the phreeqc.dat database (default in PHREEQC, see main text Section 3.1). To change the database, see the PHREEQC documentation [23].
An input file provides the instructions for PHREEQC calculations (Figure A1).
Figure A1. Example PHREEQC input file for calculating CCPP at the sample temperature.
Water 13 00042 g0a1
The water composition is defined using the data block “SOLUTION”. Each element and its concentration is included together with the water temperature and the unit. The default unit in the PHREEQC input file is mmol/kg water, but PHREEQC also allows input in e.g., mg/L. Redox elements are identified by the element name followed by the valence in parentheses. Sulfate is e.g., defined as S(6), whereas total sulfide is defined as S(−2). The database file specifies which ionic species each element is defined as by default. For instance, N(5) is mg N/L and S(6) is mg SO42−/L in the phreeqc.dat database. For a list of recommended elements, see main text Section 4.2. To avoid conversion errors in the input concentrations, we recommend using mmol/L or mmol/kg water as unit for the solution input data.
The data block “EQUILIBRIUM_PHASES defines an amount of pure phase mineral to react with the solution. Writing calcite 0, where 0 indicates a saturation index of 0, forces the solution to reach equilibrium with solid calcite (CaCO3). CCPP is then equal to the amount of calcite precipitated (positive CCPP) or dissolved (negative CCPP) to reach equilibrium.

Appendix A.2. Interpreting the Output File

Running the input file generates an output file that provides the chemical speciation of the initial solution and the chemical speciation after equilibrium with calcite. “Delta” under “Phase assemblage” (Figure A2) provides the amount of calcite that needs to be dissolved or precipitated in order to reach equilibrium. In our example, CCPP is calculated as −3.919 × 10⁻⁵ mol/kg water or −0.04 mmol/L assuming that the density of water is 1.00 (Figure A2).
Figure A2. Excerpt from the PHREEQC output file.
Water 13 00042 g0a2

Appendix A.3. Temperature

Adding the “REACTION_TEMPERATURE” data block allows us to calculate CCPP at different temperatures (Figure A3). The data block changes the temperature of the solution prior to the EQUILIBRIUM_PHASES reaction. The data block can contain a list of temperatures (e.g., “10 40 60 90”, Figure A3) or a range of temperatures with a specific number of steps (e.g., “10 90 in 81 steps” meaning from 10 to 90 °C in 81 steps resulting in a step size of 1 °C). PHREEQC generates an output for each temperature defined in REACTION_TEMPERATURE. The default unit of temperature is °C.
Figure A3. PHREEQC input file for calculating CCPP at 10, 40, 60 and 90 °C for an open system in equilibrium with atmospheric CO2 (−3.4 is the log of the atmospheric CO2 partial pressure).
Water 13 00042 g0a3

Appendix A.4. Open System

In order to calculate CCPP in an open system that allows CO2 exchanging with the atmosphere, the solution can be forced in equilibrium with atmospheric CO2 concentration in the EQUILIBRIUM_PHASES data block (Figure A3). The average CO2 concentration in the atmosphere was 411 ppm in 2019 [27], which is equivalent to a log partial pressure of −3.4.

References

  1. Van Der Bruggen, B.; Goossens, H.; Everard, P.; Stemgée, K.; Rogge, W. Cost-benefit analysis of central softening for production of drinking water. J. Environ. Manag. 2009, 91, 541–549. [Google Scholar] [CrossRef]
  2. Mons, M.; van Dijk, H.; Gatel, D.; Hesse, S.; Hofman, J.; Nguyen, M.-L.; Slaats, N. Drinking Water Hardness: Reasons and Criteria for Softening and Conditioning of Drinking Water; Global Water Research Coalition: London, UK, 2007. [Google Scholar]
  3. Lahav, O.; Birnhack, L. Quality criteria for desalinated water following post-treatment. Desalination 2007, 207, 286–303. [Google Scholar] [CrossRef]
  4. De Moel, P.J.; Van Der Helm, A.W.C.; Van Rijn, M.; Van Dijk, J.C.; Van Der Meer, W.G.J. Assessment of calculation methods for calcium carbonate saturation in drinking water for DIN 38404-10 compliance. Drink. Water Eng. Sci. 2013, 6, 115–124. [Google Scholar] [CrossRef] [Green Version]
  5. Brink, H.; Slaats, P.G.G.; Eekeren, M.W.M. Van Scaling in domestic heating equipment: Getting to know a complex phenomenon. Water Sci. Technol. 2004, 49, 129–136. [Google Scholar] [CrossRef]
  6. APHA/AWWA/WEF. 2330 Calcium Carbonate Saturation, Standard Methods for the Examination of Water and Wastewater. 2017, pp. 1–9. Available online: https://www.standardmethods.org/doi/10.2105/SMWW.2882.024 (accessed on 27 December 2020).
  7. Nederlandse Norm NEN 6533 Bepaling Van de Agressiviteit Ten Opzichte Van Calciumcarbonaat en Berekning Van de Verzadigingsindex 1990. pp. 1–6, Foreign Standard—Public. Available online: https://www.nen.nl/en/nen-6533-1990-nl-1029 (accessed on 27 December 2020).
  8. Van Raalte-Drewes, M.; Brink, H.; Feij, L.; Slaats, P.; Van Soest, E.; Vaal, P.; Veenendaal, G. Scaling Propensity of Water: New Predictive Parameters. Water Intell. Online 2015, 5. [Google Scholar] [CrossRef] [Green Version]
  9. Rossum, J.R.; Merrill, D.T. An evaluation of the calcium carbonate saturation indexes. J. Am. Water Work. Assoc. 1983, 75, 95–100. [Google Scholar] [CrossRef]
  10. Loewenthal, R.; Morrison, I.; Wentzel, M. Control of corrosion and aggression in drinking water systems. Water Sci. Technol. 2004, 49, 9–18. [Google Scholar] [CrossRef] [PubMed]
  11. Rygaard, M.; Arvin, E.; Bath, A.; Binning, P.J. Designing water supplies: Optimizing drinking water composition for maximum economic benefit. Water Res. 2011, 45, 3712–3722. [Google Scholar] [CrossRef] [PubMed]
  12. Kim, H.; Kim, D.-Y.; Hong, S.-H.; Kim, J.-W.; Kim, C. Development and implementation of a corrosion control algorithm based on calcium carbonate precipitation potential (CCPP) in a drinking water distribution system. J. Water Supply Res. Technol. 2008, 57, 531–539. [Google Scholar] [CrossRef] [Green Version]
  13. Macadam, J.; Parsons, S.A. Calcium carbonate scale formation and control. Rev. Environ. Sci. Bio/Technol. 2004, 3, 159–169. [Google Scholar] [CrossRef]
  14. Schetters, M.J.A.; Van Der Hoek, J.P.; Kramer, O.J.I.; Kors, L.J.; Palmen, L.J.; Hofs, B.; Koppers, H. Circular economy in drinking water treatment: Reuse of ground pellets as seeding material in the pellet softening process. Water Sci. Technol. 2014, 71, 479–486. [Google Scholar] [CrossRef] [Green Version]
  15. Shi, B.; Wan, Y.; Yu, Y.; Gu, J.; Wang, G. Evaluating the chemical stability in drinking water distribution system by corrosivity and precipitation potential. Water Supply 2017, 18, 383–390. [Google Scholar] [CrossRef]
  16. Eggen, G.J.P.M.; Brink, H.; Nederlof, M.M. AQUACALC versie 2.0 Handleiding; 1997. Technical Manual. Available online: https://www.praktijkcodesdrinkwater.nl/opbrengst/ontharding/ (accessed on 27 December 2020).
  17. Mehl, V.; Johannsen, K. Calculating chemical speciation, pH, saturation index and calcium carbonate precipitation potential (CCPP) based on alkalinity and acidity using OpenModelica. J. Water Supply Res. Technol. 2017, 67, 1–11. [Google Scholar] [CrossRef]
  18. Höckendorf, A.; Johannsen, K.; Dorsch, T.; Reiß, M.; Flashaar, S.; Becker, O.; Bendinger, B. Method for an accelerated reproducible calcite-layering of potable water systems to validate decalcification procedures. J. Water Supply Res. Technol. 2017, 66, 75–85. [Google Scholar] [CrossRef] [Green Version]
  19. DIN DIN 38404-10. German Standard Methods for the Examination of Water, Wastewater and Sludge—Physical and Physio-Chemical Parameters (group C)—Part 10: Calculation of the Calcit Saturation of Water (C 10), Foreign Standard—Public. Available online: https://www.beuth.de/de/norm/din-38404-10/166964780 (accessed on 27 December 2020).
  20. Waly, T.; Kennedy, M.; Witkamp, G.-J.; Amy, G.L.; Schippers, J. The role of inorganic ions in the calcium carbonate scaling of seawater reverse osmosis systems. Desalination 2012, 284, 279–287. [Google Scholar] [CrossRef]
  21. Jacobson, R.L.; Langmuir, D. Dissociation constants of calcite and CaHC03+ from 0 to 50 °C. Geochim. Cosmochim. Acta 1974, 38, 301–318. [Google Scholar] [CrossRef]
  22. Plummer, L.; Busenberg, E. The solubilities of calcite, aragonite and vaterite in CO2-H2O solutions between 0 and 90 °C, and an evaluation of the aqueous model for the system CaCO3-CO2-H2O. Geochim. Cosmochim. Acta 1982, 46, 1011–1040. [Google Scholar] [CrossRef]
  23. Parkhurst, D.L.; Appelo, C. Description of input and examples for PHREEQC version 3: A computer program for speciation, batch-reaction, one-dimensional transport, and inverse geochemical calculations. In Techniques and Methods; US Geological Survey: Menlo Park, CA, USA, 2013; p. 497. [Google Scholar]
  24. Appelo, C.A.J.; Postma, D. Geochemistry, Groundwater and Pollution, 2nd ed.; CRC Press: Boda Raton, FL, USA, 2005. [Google Scholar]
  25. Vanderdeelen, J. IUPAC-NIST Solubility Data Series. 95. Alkaline Earth Carbonates in Aqueous Systems. Part 2. Ca. J. Phys. Chem. Ref. Data 2012, 41. [Google Scholar] [CrossRef]
  26. Tallinna Vesi Water Treatment Process. Available online: https://tallinnavesi.ee/en/ettevote/activities/water-treatment/water-treatment-process/ (accessed on 31 July 2020).
  27. Tans, P.; Keeling, R. Trends in Atmospheric Carbon Dioxide (NOAA). Available online: https://www.esrl.noaa.gov/gmd/ccgg/trends/data.html (accessed on 11 August 2020).
  28. Groenendijk, M.; Van De Wetering, S.; van Nieuwenhuijze, R. Central water softening: Customer comfort is relevant in new WHO view. Water Sci. Technol. Water Supply 2008, 8, 69–74. [Google Scholar] [CrossRef]
  29. Godskesen, B.; Hauschild, M.; Rygaard, M.; Zambrano, K.; Albrechtsen, H.-J. Life cycle assessment of central softening of very hard drinking water. J. Environ. Manag. 2012, 105, 83–89. [Google Scholar] [CrossRef]
  30. Tang, C.; Merks, C.W.A.M.; Albrechtsen, H.-J. Water softeners add comfort and consume water—Comparison of selected centralised and decentralised softening technologies. Water Supply 2019, 19, 2088–2097. [Google Scholar] [CrossRef]
Figure 1. CCPP as function of increasing temperature. Stars represent CCPP at the sample temperature. Untreated groundwater: Frederiksberg. Hard drinking water: Thorsbro. Softened drinking water: Brøndbyvester. Softened riverbank infiltration: Lekkerkerk. Surface water: Ülemiste.
Water 13 00042 g001
Figure 2. CCPP calculated for closed and open systems at 10 and 90 °C for five water types. Untreated groundwater: Frederiksberg. Hard drinking water: Thorsbro. Softened drinking water: Brøndbyvester. Softened riverbank infiltration: Lekkerkerk. Surface water: Ülemiste.
Water 13 00042 g002
Figure 3. Difference in CCPP between open and closed systems as a function of temperature (0–90 °C) calculated for five water types. Untreated groundwater: Frederiksberg. Hard drinking water: Thorsbro. Softened drinking water: Brøndbyvester. Softened riverbank infiltration: Lekkerkerk. Surface water: Ülemiste.
Water 13 00042 g003
Table 1. Comparison of existing standards for calculating the calcium carbonate precipitation potential (CCPP).
NEN 6533DIN 38404-102330 Standard Methods
Reference[7][19][6]
CountryThe NetherlandsGermanyU.S.A.
ApplicabilityIonic strength <20 mmol/LDrinking waterDrinking and waste water
Temperature<30 °C<60 °C 10–100 °C 2
CaCO3 phasescalcitecalcitecalcite, aragonite and vaterite
Solubility constantsJacobsen & Langmuir (1974) and Plummer & Busenberg (1982) [21,22]Jacobsen & Langmuir (1974) and Plummer & Busenberg (1982) [21,22]Plummer & Busenberg 1982 [22]
Ionic speciesCa2+, HCO3 and H+Ca2+, Mg2+, Na+, K+, Cl, C, NO3, SO42−, PO43− and H+ + associated complexes3Not specified
Exchange with atmospheric CO2NoNoNo
Validation dataNoYes(Yes) 4
1 According to de Moel et al. (2013), only <45 °C. 2 According to the standard [6], however, solubility constants for CaCO3 are only verified at 0–90 °C [22]. 3 See DIN 38404-10 (2012) or de Moel et al. (2013) for full list [4,19]. 4 The validation data does not include CCPP values for comparison.
Table 2. Selected water types for demonstrating and evaluating procedure for CCPP calculations.
ParameterUnitUntreated Groundwater 1 Hard Drinking WaterSoftened Groundwater 2 Softened Riverbank Infiltrate 3Surface Water
DWTP FrederiksbergThorsbroBrøndbyvesterLekkerkerkÜlemiste
Country DenmarkDenmarkDenmarkThe NetherlandsEstonia
Cammol/L4.993.741.071.071.70
Mgmmol/L1.320.860.910.250.33
Hardnessmmol/L6.304.601.981.332.02
Hardness°dH35.325.811.17.411.3
Alkalinitymmol/L6.566.075.251.702.82
pH[-]6.907.408.007.827.25
Temperature°C10.010.09.312.810.0
Nammol/L2.700.745.651.340.35
Kmmol/L0.150.120.140.090.06
Femmol/L0.07<1.8 × 10−4<1.8 × 10⁻⁴<1.8 × 10⁻⁴<1.8 × 10⁻⁴
Srmmol/L0.040.020.02-0.001
Clmmol/L5.071.413.381.280.90
Fmmol/L0.070.0140.022<0.10.00
PO43−mmol/L<3.6 × 10−5<3.6 × 10⁻⁵<3.6 × 10⁻⁵-<2.1 × 10⁻⁵
SO42−mmol/L2.080.880.910.250.29
NO3mmol/L<0.0020.050.030.060.04
Sample date 15.6.20183.7.201810.1.20192018 42019 4
- indicates data unavailable. 1 Groundwater well FF3 (DGU 201.5311) 2 Pellet softening with sodium hydroxide (NaOH), 3 Reverse osmosis, 4 Average value.
Table 3. Effect on varying numbers of ionic species on CCPP10 and CCPP90: With Ca, pH and alkalinity only, with the ions included in the DIN 38404-10 standard [19] and with the DIN 38404-10 standard including F, Fe and Sr. The unit is mmol/kg.
Ionic Species Included in CCPP CalculationsUntreated GroundwaterHard Drinking WaterSoftened GroundwaterSoftened Riverbank InfiltrateSurface
Water
10 °C90 °C10 °C90 °C10 °C90 °C10 °C90 °C10 °C90 °C
Ca, pH, alkalinity0.1381.6670.4861.5870.1980.690−0.0150.171−0.1580.364
DIN standard (1)−0.0351.4790.4161.4950.1450.602−0.0200.151−0.1700.334
DIN + F, Fe, Sr−0.0391.4720.4161.4930.1450.602−0.0200.151−0.1700.334
(1) Ca, Mg, pH, alkalinity, Na, K, PO43−, SO42− and NO3. The complexes included for each element are the complexes from the phreeqc.dat database.
Table 4. CCPP calculated for the 10 validation datasets from the DIN 38404-10 standard with the din38404-10_2012.dat database developed by de Moel et al. (2013) and with the phreeqc.dat database [4,19]. Density of water was assumed 1.00 kg/L Grey shaded cells are not in compliance with the standard.
mmol/LS1S2S3S4S5S6S7S8S9S10
Validation dataCCPP−0.145−0.032−0.163−1.111−0.140−0.030−0.055−0.1150.071−0.003
DIN databaseCCPP−0.145−0.032−0.162−1.110−0.140−0.030−0.055−0.1150.071−0.003
ΔCCPP0.0000.000−0.001−0.0010.0000.0000.0000.0000.0000.000
phreeqc.dat databaseCCPP−0.142−0.032−0.142−1.109−0.136−0.027−0.055−0.1120.0780.004
ΔCCPP−0.0030.000−0.021−0.003−0.004−0.0030.000−0.003−0.007−0.007
Table 5. Effect of varying pH (±0.01 and ±0.05) on CCPP 10 °C and 90 °C. Untreated groundwater: Frederiksberg. Hard drinking water: Thorsbro. Softened drinking water: Brøndbyvester. Softened riverbank infiltration: Lekkerkerk. Surface water: Ülemiste. The unit is mmol/kg.
Untreated GroundwaterHard Drinking WaterSoftened GroundwaterSoftened Riverbank InfiltrateSurface Water
10 °C90 °C10 °C90 °C10 °C90 °C10 °C90 °C10 °C90 °C
CCPP at observed pH−0.041.470.421.490.140.60−0.020.15−0.170.33
pH ± 0.01ΔCCPP0.020.010.010.000.000.000.000.000.010.00
pH ± 0.05ΔCCPP0.100.040.040.020.010.010.010.000.040.02
Publisher’s Note: MDPI stays neutral with regard to jurisdictional claims in published maps and institutional affiliations.

