1. Introduction
Due to economic growth, population increase, ageing, a growing production and use of chemicals, intensifying agriculture and livestock farming, longer periods of reduced river discharge caused by climate change, and, not to be underestimated, advances in analytical chemistry, the number and concentrations of substances found in drinking water sources are rapidly increasing [
1,
2]. Correspondingly, there are ever more news items about the contamination of drinking water sources, which may also affect drinking water quality. At present, this information is hardly, if at all, reflected on the websites of most water companies. In fact, they often contain hardly any information on the presence of non-natural or anthropogenic substances in tap water (sources), and even less on the related health effects. The question is how long this will be viable and accepted by a society that increasingly demands transparency and has deep concerns about risks [
3]. In many countries, trust in authorities is decreasing, and the general public no longer, if ever, perceives science as trustworthy. In this view, communication regarding risks and accordingly the presence of non-natural substances in tap water is a complex matter [
4,
5,
6]. In this study we have investigated how people react to such information, and how it affects their perceptions and trust in the quality and safety of drinking water.
For effective risk communication, a thorough understanding of the information needs and risk perception of the general public is vital [
7]. Slovic, et al. [
8] argue in this regard for a good interaction between analytical and subjective risk perceptions, whereby it should be recognized that the way in which the general public perceives and assesses its exposure to risks differs from analytical or technical risk assessments. Research suggests that the general public, in this context often referred to as laypersons, perceives risks differently than experts. Whereas analytical risk assessments entail hazard identification, effects assessment, exposure assessment and/or risk characterization, risk perception by the general public is intuitive, and likely influenced by emotional processes, heuristics, and political and cultural factors [
7,
9,
10]. This difference between analytical and public risk perception, i.e., the contrast between expert judgment and intuitive perception, in the literature also referred to as the risk perception gap, should not be mistaken as a confrontation between rational expert approach and irrational “common sense” reasoning [
11,
12].
Over the years, an extensive body of research aiming to explain public risk perceptions has emerged, suggesting a variety of predicting factors. Based on this literature, and apart from the influence of social-political factors as proposed by authors such as Beck [
13], who talks about a risk society, a classification can be made into two different approaches or types of underlying factors: (i) a category of factors related to the nature of the risk itself; and (ii) a category of factors related to the perceiving subject.
The first line of research, referred to as the psychometric theory [
8], is basically concerned with characteristics of the risk object, like voluntariness of exposure, perceived severity and controllability, and familiarity. A central tenet within this literature is the social amplification of risk framework proposed by Kasperson, et al. [
14]. Their thesis is that certain (perceived) characteristics of the risk object interact with psychological, social, institutional, and cultural processes in ways that perceived risks may either decrease or increase. The over-or underestimation of risks is, for instance, associated with the voluntariness of exposure [
9]. This relates to the separation between so-called voluntary and involuntary risks. The former are associated with activities, such as the consumption of alcohol or skiing, in which individuals participate by choice, while the latter are associated with activities, conditions or events to which individuals might be exposed without their consent [
15]. Classic examples of involuntary risks include both the risks of natural disasters such as earthquakes, hurricanes, and floods, and technology-related risks such as, relevant for this study, contaminated water [
16]. There is considerable evidence that people accept much higher risks for voluntary behaviors compared to involuntary risks and exposure [
15,
16]. In the same vein, research suggests that risks possibly leading to more victims per manifestation, such as airplane crashes, are perceived as higher and as more catastrophic than risks leading to fewer victims per manifestation, such as car accidents—even if the technical fatality risks for travel by car exceed that of airplane travel [
17]. Presumably, the same goes for contamination incidents affecting an entire drinking water supply area versus contamination incidents affecting only specific households. Price, et al. [
18] speak in this respect about the so-called group size effect, related to the fact that, in general, an individual is judged to be at lower risk than the average member of a group of two, whereas the average member of a group of two is judged to be at lower risk than the average member of a group of three, etcetera.
Several studies found that technological or non-natural risks, often conceptualized as unfamiliar and related to hazards of an invisible, imperceptible and corrupting nature, are generally feared more than natural risks, whose impacts are believed to be more direct and perceptible. For tap water, this implies that natural contaminants may be perceived as less threatening than anthropogenic contaminants [
19]. To recognize, let alone understand these technological or non-natural risks, people are often forced to rely on experts, whereby it is often assumed that acceptability of risks is closely related to the extent to which people trust risk management institutions [
20]. Related to the previous element, Slovic [
9] found that risks that appear to the public as obvious and controllable are accepted more easily than risks that appear ambiguous or uncontrollable. Furthermore, the public often overestimates the impact of rare, striking risks, whereas the impact of common risks, such as smoking, are often underestimated [
21]. When risks occur frequently, people are familiar with the risk, and accustomed with both the consequences itself, and how others react to these consequences. This strengthens the sense of controllability, reduces the experienced threat, and accordingly, lowers the perceived risk. Finally, the degree to which the consequences of risks are regarded as reversible or irreversible plays a role in the sense of controllability [
22].
Next to the category of factors related to the nature of the risk itself, there are those who focus on the perceiving subject, i.e., the human being, as the central element in risk perception. This line of research stresses that it is ultimately always the individual human being that makes his or her own interpretation of the risk at hand [
23]. Traditionally, this line of research has focused on personality traits, such as gender, age, level of education, and socio-economic status. For example, several researchers have focused on exploring correlations between gender and risk perception, with women generally judging risks higher and expressing more concern than men [
24]. The same goes, to some extent, for ethnic minorities [
25]. Griffin and Dunwoody [
26], for instance, suggest that ethnic minorities are more concerned about the presence of lead in drinking water. A number of explanations to this phenomenon known as the ‘white male’ effect have been suggested, among which inequality, a higher sense of vulnerability, and differences in world-view are recurring themes [
27]. In the same vein, scholars also suggest that the risk perception of young people is relatively low. Gregersen and Bjurulf [
28], for example, found that young drivers estimate the risk of a car accident structurally lower than older generations. Likewise, Syme and Williams [
29] suggest that older people attribute higher risks to drinking water. Education and income are instead often inversely correlated with risk perception. When the probability of the causes and consequences of a risk are comprehended by an individual, risks are generally judged lower than when this is not the case [
8].
The evidence on correlations between personality traits and risk perceptions is by no means unequivocal. After all, in opposition to the studies that claim that women have a higher risk perception, you can place studies that do not find this effect, e.g., [
30]. The same applies to age, as certainly not all studies show that older people have a higher risk perception. Doria [
24] reports several studies claiming that not older, but younger respondents perceive tap water as slightly riskier. Largely the same ambiguous results are reported in relation to other demographic variables that may influence risk perception.
A largely different line of study focusing on the perceiving subject as the central element in risk perception is related to the idea that risk perceptions cannot only be explained from the characteristics of the risk or the individual, but that also larger contextual factors determine individual risk perceptions. A standard work in this area is “the cultural theory of risk”, launched by Mary Douglas [
31]. The cultural theory aims to explain how people perceive and act upon the world around them, and states that the way people perceive risk is largely determined by social aspects and cultural adherence [
31,
32]. The basis of cultural theory is Douglas’ [
31] grid-group culture theory, claiming that what people do or want is culturally biased [
32]. According to this theory, individuals can be placed into a social context characterized by two dimensions: the group and the grid dimension. The former dimension is associated with the strength of collectiveness, degree of solidarity, and stands for incorporation into a bounded group. The latter dimension, instead, stands for the extent to which an individual is constrained by strict rules, regulations, and hierarchical authority [
33].
The theory claims that all individuals adhere to either the individualistic, the hierarchic, the egalitarian, or the fatalistic cultural group or worldview. The cultural characteristics of these four groups would determine what risks one will focus on. Individual freedom is, for instance, a central value for the individualistic worldview. Accordingly, individualists primarily fear things that might obstruct this freedom. Egalitarians, striving for social equality, instead fear development that may increase the inequalities amongst people, whereas hierarchic cultures, supporting the ‘‘natural order’’ of society, fear things that may distort the perseverance of this order, such as social commotion, demonstrations, and crime. Fatalists, who feel they have little way to influence their environment and accordingly view dangers as unavoidable, are quite indifferent about risks [
23,
34]. Although influential, this cultural theory has been criticized over time. It is said to be too deterministic and to leave too little room for diversity, both within groups and over time. Moreover, it is suggested that the explanatory power of the psychometric theory [
8] is to date generally stronger than the cultural theory [
23].
This study aims to enlighten the perceived quality and safety of drinking water, as well as to analyze the relationships between trust and risk perception among different customer segments, and how people deal with technical information on e.g., contaminants. It focuses on the drinking water customer as the central element in risk perception. It hereby both considers personality traits, such as gender, educational background and age, as well as cultural adherence and worldviews as possible explanatory factors for risk perceptions and information needs. In doing so, and this is what makes this study unique, it does not start from the four general cultural groups central in cultural theory [
23], but instead takes four specific customer perspectives on drinking water as a starting point. These perspectives, termed “aware and committed”, “down to earth and confident”, “egalitarian and solidary”, and “quality and health concerned”, are based on a Q-methodology study. They follow the line of thinking of modern segmentation, and accordingly are grounded on “soft” differences and subjective views [
35]. The “quality and health concerned” perspective is characterized by a focus on personal preferences and needs, especially regarding personal health, while the “aware and committed” perspective is characterized by pro-environmental values and collective sustainability ideals. The “egalitarian and solidary” perspective is marked by a great sense of solidarity with less-favored households, developing countries, and future generations. People with a “down to earth and confident” perspective have a great confidence in the responsibility of drinking water companies, along with a desire not to be bothered about drinking water [
35]. Even though these four drinking water perspectives were inductively established, they resemble, to some extent, the worldviews central in the cultural theory [
31]. The perspective showing the greatest resemblance in this respect is the “egalitarian and solidary” drinking water perspective, which, similarly to the egalitarian worldview, greatly fears inequality increasing developments. Less striking, but still notably, is the resemblance between the “down to earth and confident” perspective and the fatalist worldview. While the former are, among others, characterized by their desire not to be bothered about drinking water, the latter are quite indifferent about risks and would, in fact, rather be unaware of potential dangers. Both the “quality and health concerned” perspective and the “aware and committed” perspective are less obvious to link to any of the worldviews.
2. Materials and Methods
For a better insight and deeper understanding of the risk perception of drinking water customers, this study adopted methodological triangulation, combining quantitative and qualitative methods [
36]. The geographic focus of this study is on the Netherlands, a country where ten semi-public water companies with separated geographical supply areas provide drinking water to over eight million household and non-household consumers [
37,
38]. Tap water in the Netherlands is known for the fact that no chlorine is used for disinfection, as is common in most countries. Chlorine-free water has been common practice in the Netherlands for over 25 years. Moreover, the Dutch drinking water is reliable and safe because of: (i) a high level of disinfection by multiple disinfection steps, often including UV disinfection; (ii) efficient removal of assimilable carbon, to maintain biologically safe water; and (iii) specially designed networks, with a flow rate that prevents pollution, very limited leakage losses, and an overpressure, to prevent pollutants from entering the network [
39,
40].
This study investigates how customers perceive the quality and safety of their tap water, and whether they are concerned about it. Internationally, it is often claimed that people do not trust chlorine-free drinking water [
41]. To learn about the perception of drinking water customers, we started our empirical work by conducting a large scale quantitative nationwide survey (N = 1057) that covered the Netherlands. The survey was primarily aimed at investigating perceptions on tap water quality, safety and information need. In addition, the questionnaire contained a number of questions aiming at gaining a deeper understanding of the respondents themselves, including some key demographic characteristics and, just as important, questions to elicit their drinking water perspective [
35]. The full questionnaire contained over 30 questions, including a series of five-point Likert items, close-ended questions with limited response choices, and several open questions. Data were statistically tested using either the Mann–Whitney U test for binary categorical variables, or the chi-square test for nominal variables, with the null hypothesis being that results are independent from respondent characteristics, such as customer perspective. When two ordinal variables were compared, such as evaluation versus education level, we assessed the direction of the relation with Spearman’s rank correlation test. The survey was conducted in the early summer of 2018, and executed in collaboration with a marketing research agency that used stratified sampling. Participants were recruited via an online panel and received a small incentive to participate.
Next, for a deeper understanding of the topics discussed in this survey, we proceeded our empirical study by conducting 24 telephone follow-up interviews with 24 respondents, who in the survey indicated a willingness to participate in this aspect of data collection. Respondents were selected on the basis of their customer perspective; in order to elicit the underlying dimensions related to trust, risk perceptions and information needs, from every customer perspective, six respondents were interviewed. The interviews were conducted in a semi-standardized manner, allowing the interviewer to ask additional questions to stimulate more considered responses [
42]. All interviews were conducted in the same period as the survey, lasted between 30 and 60 min and were recorded, and responses were summarized for each question. In order to identify patterns, to make comparisons, and to contrast one set of data with another, a qualitative analysis was executed [
43].
A series of five qualitative focus groups with, in total, 40 drinking water customers was conducted towards the end of the study, known for their unique property of interaction, as participants not only respond to the researcher’s questions, but also react to each other [
44]. The objective of including a focus group was to collect qualitative information on the need for, and perception of, information on the quality of drinking water. To this end, respondents were presented various texts on tap water quality (problems) derived from different websites, journals and reports. All focus group participants were recruited and selected by an external agency, taking into account a balanced distribution in terms of gender, age, educational background and drinking water perspective. For each perspective, a separate focus group was organized, except for the “quality and health concerned” perspective, for which a distinct meeting was organized for high- and low-educated customers. The reason behind this educational differentiation is twofold: (i) our survey data have shown that customers with the “quality and health concerned” perspective are most concerned about the water quality compared to the other perspectives; and (ii) the (information) needs and perceptions differ considerably between high- and low-educated customers. All five focus group discussions were recorded, transcribed, and analyzed in the same manner as the interviews.
3. Results
3.1. Perceived Quality and Safety
As much as 90% of the respondents perceive tap water in the Netherlands as safe, and only one in a hundred respondents reported to regard their tap water as unsafe. This finding is consistent with the generally high customer appreciation scores for tap water quality in the Netherlands [
35]. In the follow-up interviews, this level of high trust was confirmed. On the question how safe people view their water respondents typically answered with statements such as “100%” and “very safe”. The results become even more interesting when focusing on the differences between different segments. For instance, and in coherence with Doria [
24], we find that women and lower-educated customers perceive tap water significantly more often as unsafe or as neither safe nor unsafe. Age and the presence of a chronic disease do not significantly influence people’s perception on the quality of water. In addition to these traditional segmentation parameters, this study revealed differences between customers with different drinking water perspectives. Customers holding the “quality and health concerned” perspective, whereby the connection between water and health is paramount [
35], perceive water significantly less often as safe than customers with the “aware and committed” perspective and the “down to earth and confident” perspective (χ2,
p > 0.001).
The follow-up interviews with customers revealed several key underlying factors related to customers’ generally high confidence in the quality of their tap water. The most important dimension is a high level of confidence in institutions that regulate tap water in the Netherlands. In this context, reference is often made to the drinking water companies themselves. Most respondents trust the utility’s purification and control systems are well functioning. Statements such as ‘I think the purification is good, otherwise we wouldn’t have had clean water’ and ‘I actually assume that I can drink water from the tap at any time, because it is well controlled’ reflect this trust well. In line with this, analysis of the survey findings reveals that customers with little concern for the quality and safety of their tap water significantly more often believe that: (i) the quality and safety of tap water is well controlled in the Netherlands; that (ii) tap water is sufficiently purified in the Netherlands; and (iii) that their water company has sufficient knowledge to keep their tap water safe (Spearman grade correlation, p < 0.05).
Institutional trust is, however, not the only underlying dimension or explanatory factor relating to our observed high level of trust in tap water. In this regard, respondents often refer to positive stories, and alternatively, the absence of negative (media) stories about tap water in the Netherlands: ’Although I follow the news closely, I haven’t heard any disturbing stories about the quality of my tap water.’ Personal experiences and stories in childhood are another important basis for great trust. Answers like ‘I’ve been drinking it for 60 years, and never experience a problem’, and ‘I have always learned that Dutch tap water is good, even better than in most other countries’ reflect this well. Overall, we find that most customers believe that the quality and safety of tap water is sufficiently controlled (78% versus 5% that do not believe water is controlled sufficiently), that tap water is sufficiently purified (76% versus 6%) and that there is sufficient knowledge available at drinking water companies (72% versus 5%).
3.2. Quality Concerns
Although it appears that the majority of customers view Dutch tap water as safe (90%), analysis of the survey findings reveals that this does not mean that customers, at the same time, do not have concerns about the quality and safety of tap water. Almost one out of four customers (23%) report concerns about the quality and safety of Dutch tap water; another quarter (25%) of the customers is neutral regarding the statement on concerns, and half of the Dutch customers report to have no concern about the quality and safety of their tap water. This seems not to be related to gender, age, educational background or the presence of a chronical disease, but as shown in
Figure 1, only to the customer perspective, ideas about the source of tap water, and the presence of children. Indeed, from a modern segmentation approach, we find significant differences between the various perspectives. Customers with the “quality and health concerned” perspective are significantly more concerned about the quality and safety of Dutch tap water, whereas customers with “down to earth and confident” perspective report less concerns. Customers who think they receive tap water from surface water instead of groundwater are more often concerned about the quality and safety of tap water. A plausible explanation for this finding may be that recent media coverage in the Netherlands regarding, for example, drug waste mainly concerned surface water. We find that customers with children are significantly more concerned about the quality and safety of Dutch tap water (Mann–Whitney U test,
p < 0.01). Additional analysis in which we differentiated between men and women showed that the latter result, more concerns related to the presence of children, only holds for female customers.
Tap water quality concerns largely stem from stories about new, unknown substances in the environment. An example of this is the following answer: ‘the air quality in the Netherlands is very poor. And via the air it enters fields, groundwater and surface water, and perhaps even our drinking water. (...) Everything is connected. These kinds of stories worry me.’ New substances also lead to concerns: ‘if you hear stories about drugs waste being dumped, or medicines...then I get a little scared.’ The survey results are consistent with the interviews in this regard. Respondents who indicated to be concerned about the quality and safety of their tap water mostly worry about the contamination of tap water sources (44%), and more specifically, antibiotics, industrial discharges, pesticides, drugs, and to a lesser extent, plastics, cosmetics and hormone disrupting substances. Next to concerns about tap water sources, we find customers that are worried about the quality of tap water itself (31%), particularly about the (unknown) long-term health effects due to a mix and accumulation of different substances. About one out of ten (12%) of the concerned customers worry about calamities or deliberate attacks on tap water installations, such as a terrorist attack.
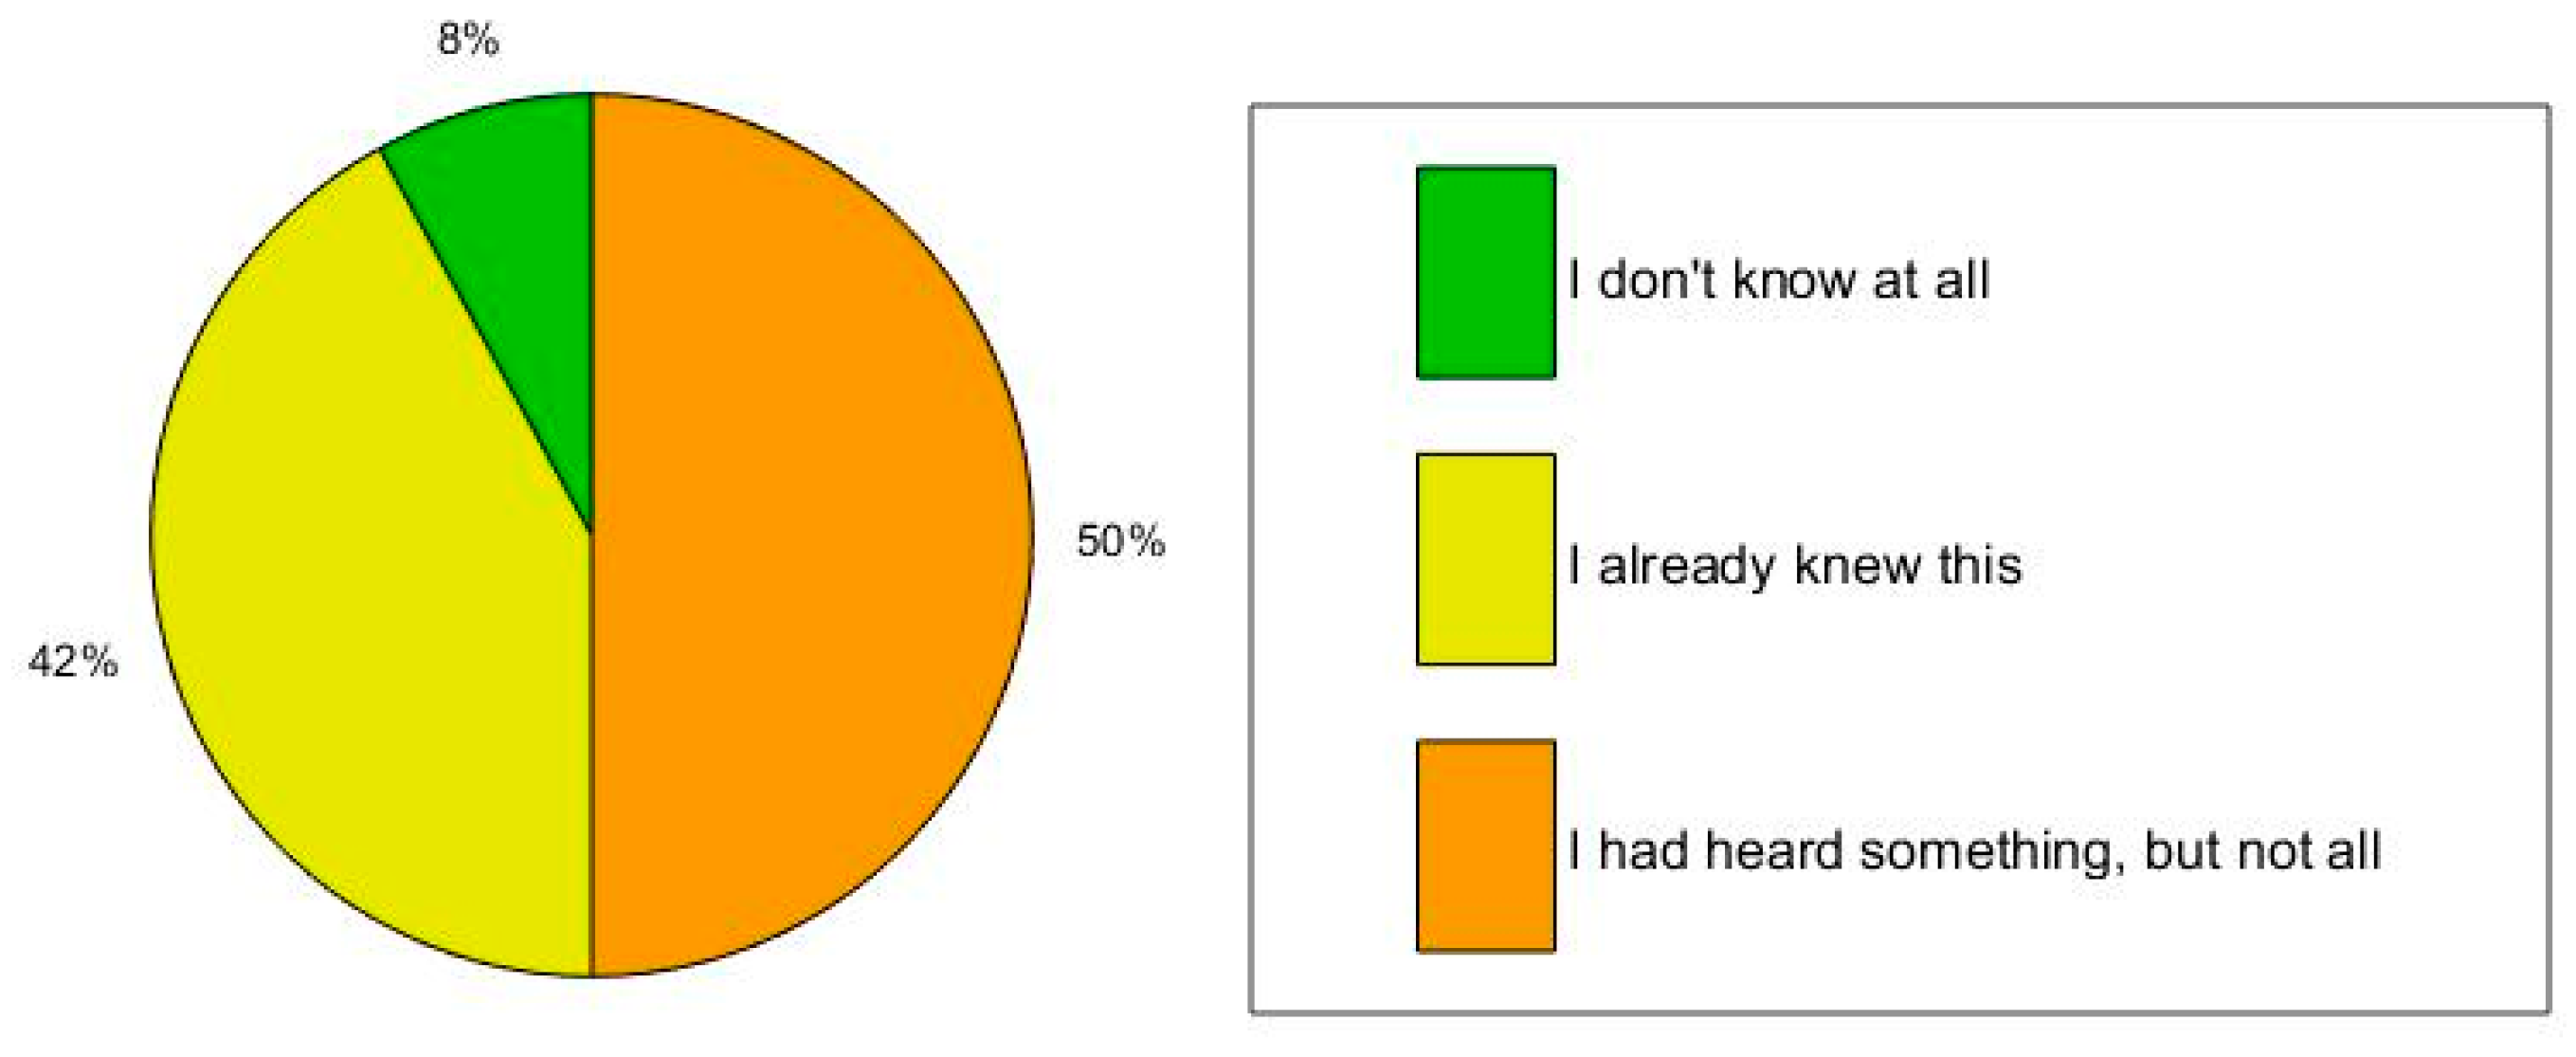
The Dutch Drinking Water Law sets standards for the presence of contaminants of human origin in drinking water, and the drinking water utilities treat their water so that it meets these standards.
Figure 2 shows that only 42% of the customers are aware of this. Customers who are aware of these standards, often male, highly educated and parents, more often indicate that they consider their tap water to be safe.
3.3. Non-Natural Substances
Related to these concerns are perceptions on the presence of non-natural (anthropogenic) substances. A small majority (55%) of the respondents, rightfully, thinks that there are (very low concentrations of) non-natural substances present in their tap water, which in the questionnaire were defined as by society-released substances into the environment, e.g., from industry, agriculture/stock farming, hospitals and households, such as pesticides, detergents, medicines and cosmetics. Nearly one out of five respondents reported that they do not know whether or not this is the case. Customers thinking that non-natural substances are present in tap water are significantly more often male, highly educated, and/or are customers who are expecting or have children under the age of 13. Customers with the “egocentric and quality” perspective significantly more often believe that non-natural substances are present in their tap water. In contrast to those customers that think non-natural substances are present, approximately a quarter (26%) of customers indicate that they think there are no non-natural substances in their water, including significantly more often customers with the “down to earth and confident” perspective.
Just as important is the significance of these data on quality perceptions. Our data show that customers who believe or do not know whether there are non-natural substances present in their tap water, not only significantly more often consider their water as unsafe (Mann–Whitney, p < 0.001), but are also more often worried about the quality and safety of tap water (Mann–Whitney, p < 0.001). At the same time, it should be noted that among these customers, a large majority still considers their tap water to be safe.
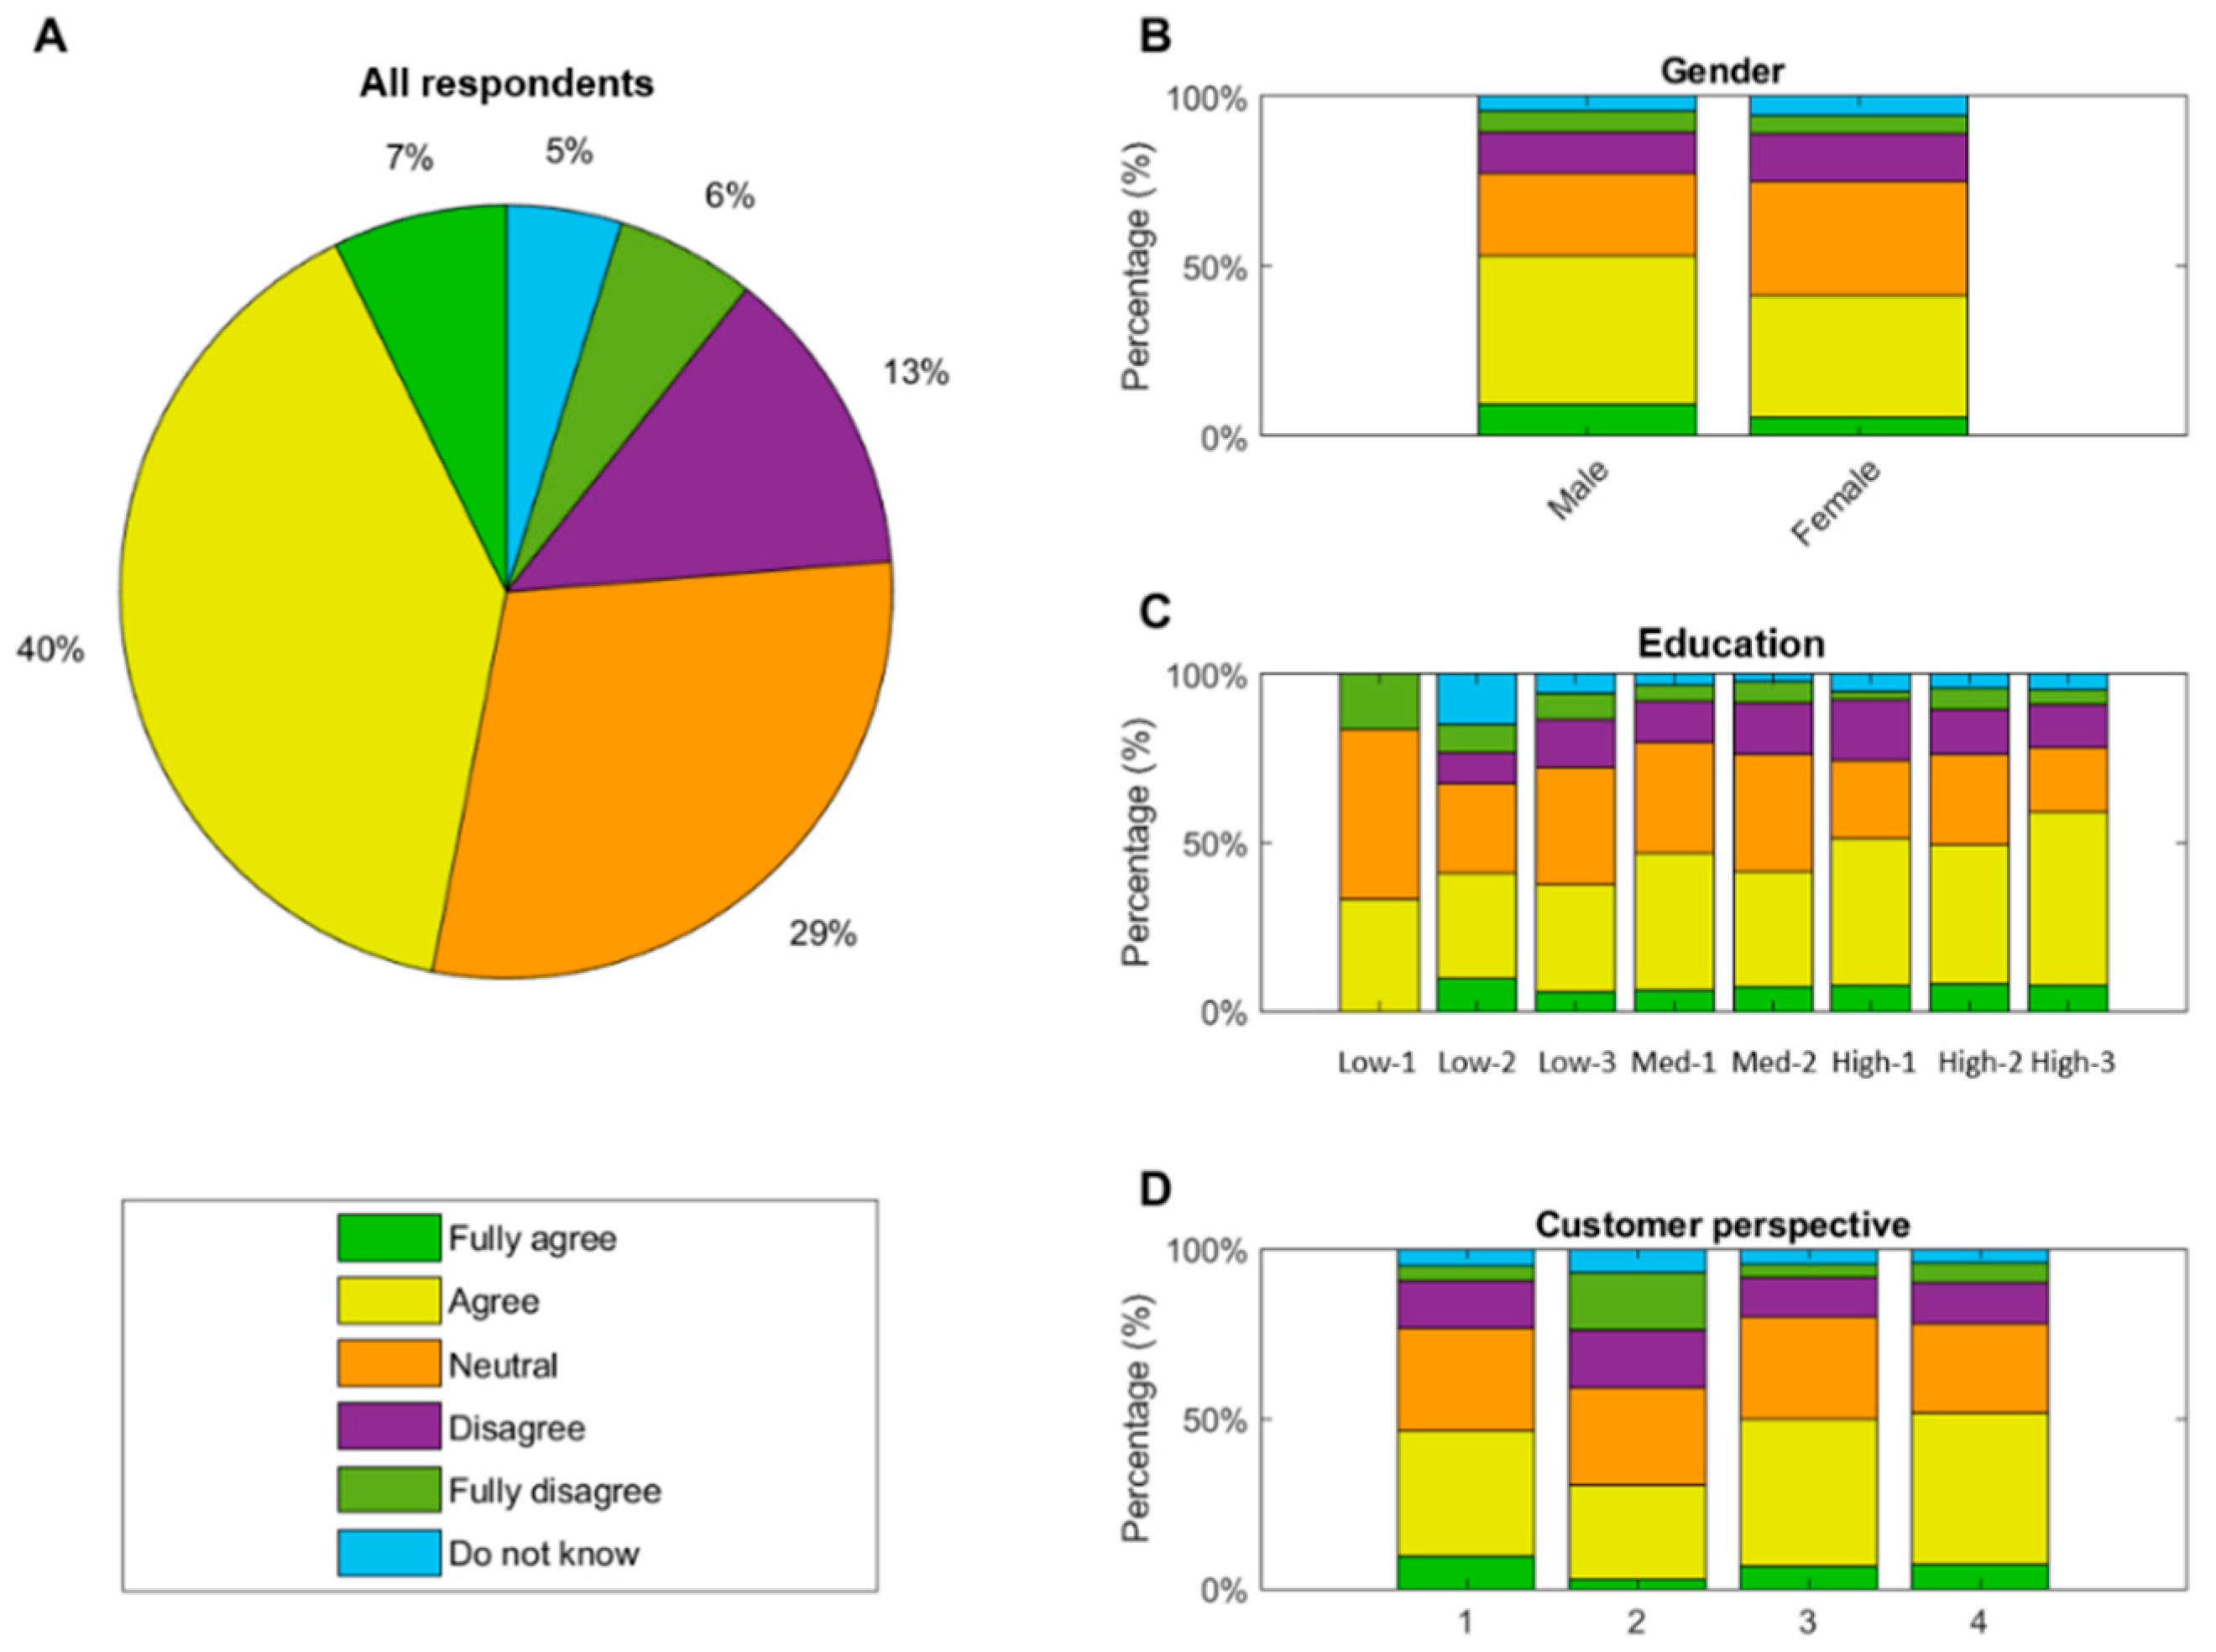
As for the statement ‘tap water containing very small amounts of non-natural substances is safe to drink as long as the amount falls within the legal standards’ 7% strongly agrees, 40% agrees, 29% is neutral, and as much as 13% and 6%, respectively, disagrees or strongly disagrees. The remaining 5% do not know whether they agree or disagree. In other words, the results of this study show that less than half of all customers (47%) feel that tap water with small amount of non-natural (anthropogenic) substances, even when maintained below legal standards, is safe to drink. In line with above results, both female customers and customers with the “egocentric and quality-oriented” perspective significantly disagree more often with this statement, whereas men, high-educated customers and customers with one of the other perspectives are more likely to agree.
Figure 3 illustrates these correlations. The factors age, a chronical disease, having children or knowledge on the source of tap water, instead, do not affect the customers’ perception regarding the safety of water in relation to the presence of non-natural substances. The statistical details related to both
Figure 1 and
Figure 3 can be found in the (
Supplementary Information Tables S1 and S2).
By way of explanation (open question), those customers (19%) who disagree with the statement, most often (31%) indicate that, in their view, non-natural substances simply do not belong in tap water at all. Others customers (21%) disagree with this statement because they are concerned about the health effects of non-natural substances, and in this light stress issues such as uncertainty about the effect on vulnerable individuals, long-term accumulative effects, or fear for the effects of the “cocktail” of substances to which they are exposed, not only via their water, but also via food, cosmetics, detergents, and, for instance, air. Finally, and in addition to 30% of the answers that were categorized as “other”, there is a group of customers (18%) disagreeing with the statement ‘tap water containing a very small amount of non-natural substances is safe to drink as long as the amount falls within the legal standards’ because they do not regard the legal standards to be reliable. Indeed, and this sentiment regularly emerged during the interviews, for some respondents references to the norm are not so much reassuring, but rather a source of concern, and sometimes even raise suspicion. Reasons given for this lack of trust relate to a perceived lack of transparency about how the standards are set, as well as fear for a strong political influence and lobbying power of for instance farmer or industrial interests groups on these standards. Especially among the group of relatively concerned customers, quality norms and standards are regularly seen as something political, and accordingly, regarded with skepticism. One respondent, for instance, noted: ‘I trust the drinking water company itself, but I have more reservations regarding the government [i.e., the norm setting authority], because they have far more interests than merely the quality of water’.
The 47% agreeing respondents, i.e., customers who, instead, are of the opinion that tap water containing a small amount of non-natural substances is safe to drink, as long as the amount falls within the legal standards, are less concerned about the quality and safety of tap water, and significantly more often of the opinion tap water is well monitored, sufficiently purified, and that water companies have sufficient knowledge. In short, they are generally confident that the quality standards are adequate, and that the quality of drinking water is guaranteed. In any case, they see no reason for concern. One respondent, for instance, stated: ‘I trust the current standards are excellent. They really don’t have to be stricter. They ensure that the quality of our water is brilliant’. For many respondents, this confidence in drinking water standards is based on the fact that they have been established by experts. ‘I assume that if the authorities have scientifically established that the standards are safe, I see no reason to doubt this.’
3.4. Information Needs
Although today most water company websites in the Netherlands provide hardly any information on the presence of non-natural substances in tap water, this research suggests that a large share of customers (42%) believe that there is sufficient information about tap water available, including significantly more often customers with the “aware and committed” and “down to earth and confident” perspective. Another 38% indicates that they do not know whether or not sufficient information is available about tap water in the Netherlands, suggesting that many customers have actually never looked for this type of information. One out of five (20%) regards the current information provision as insufficient. Customers who feel that too little information is available are significantly more often women, young, poorly educated, chronically ill and customers with the “quality and health concerned” perspective, i.e., are precisely the customers who are more often concerned about the quality of tap water.
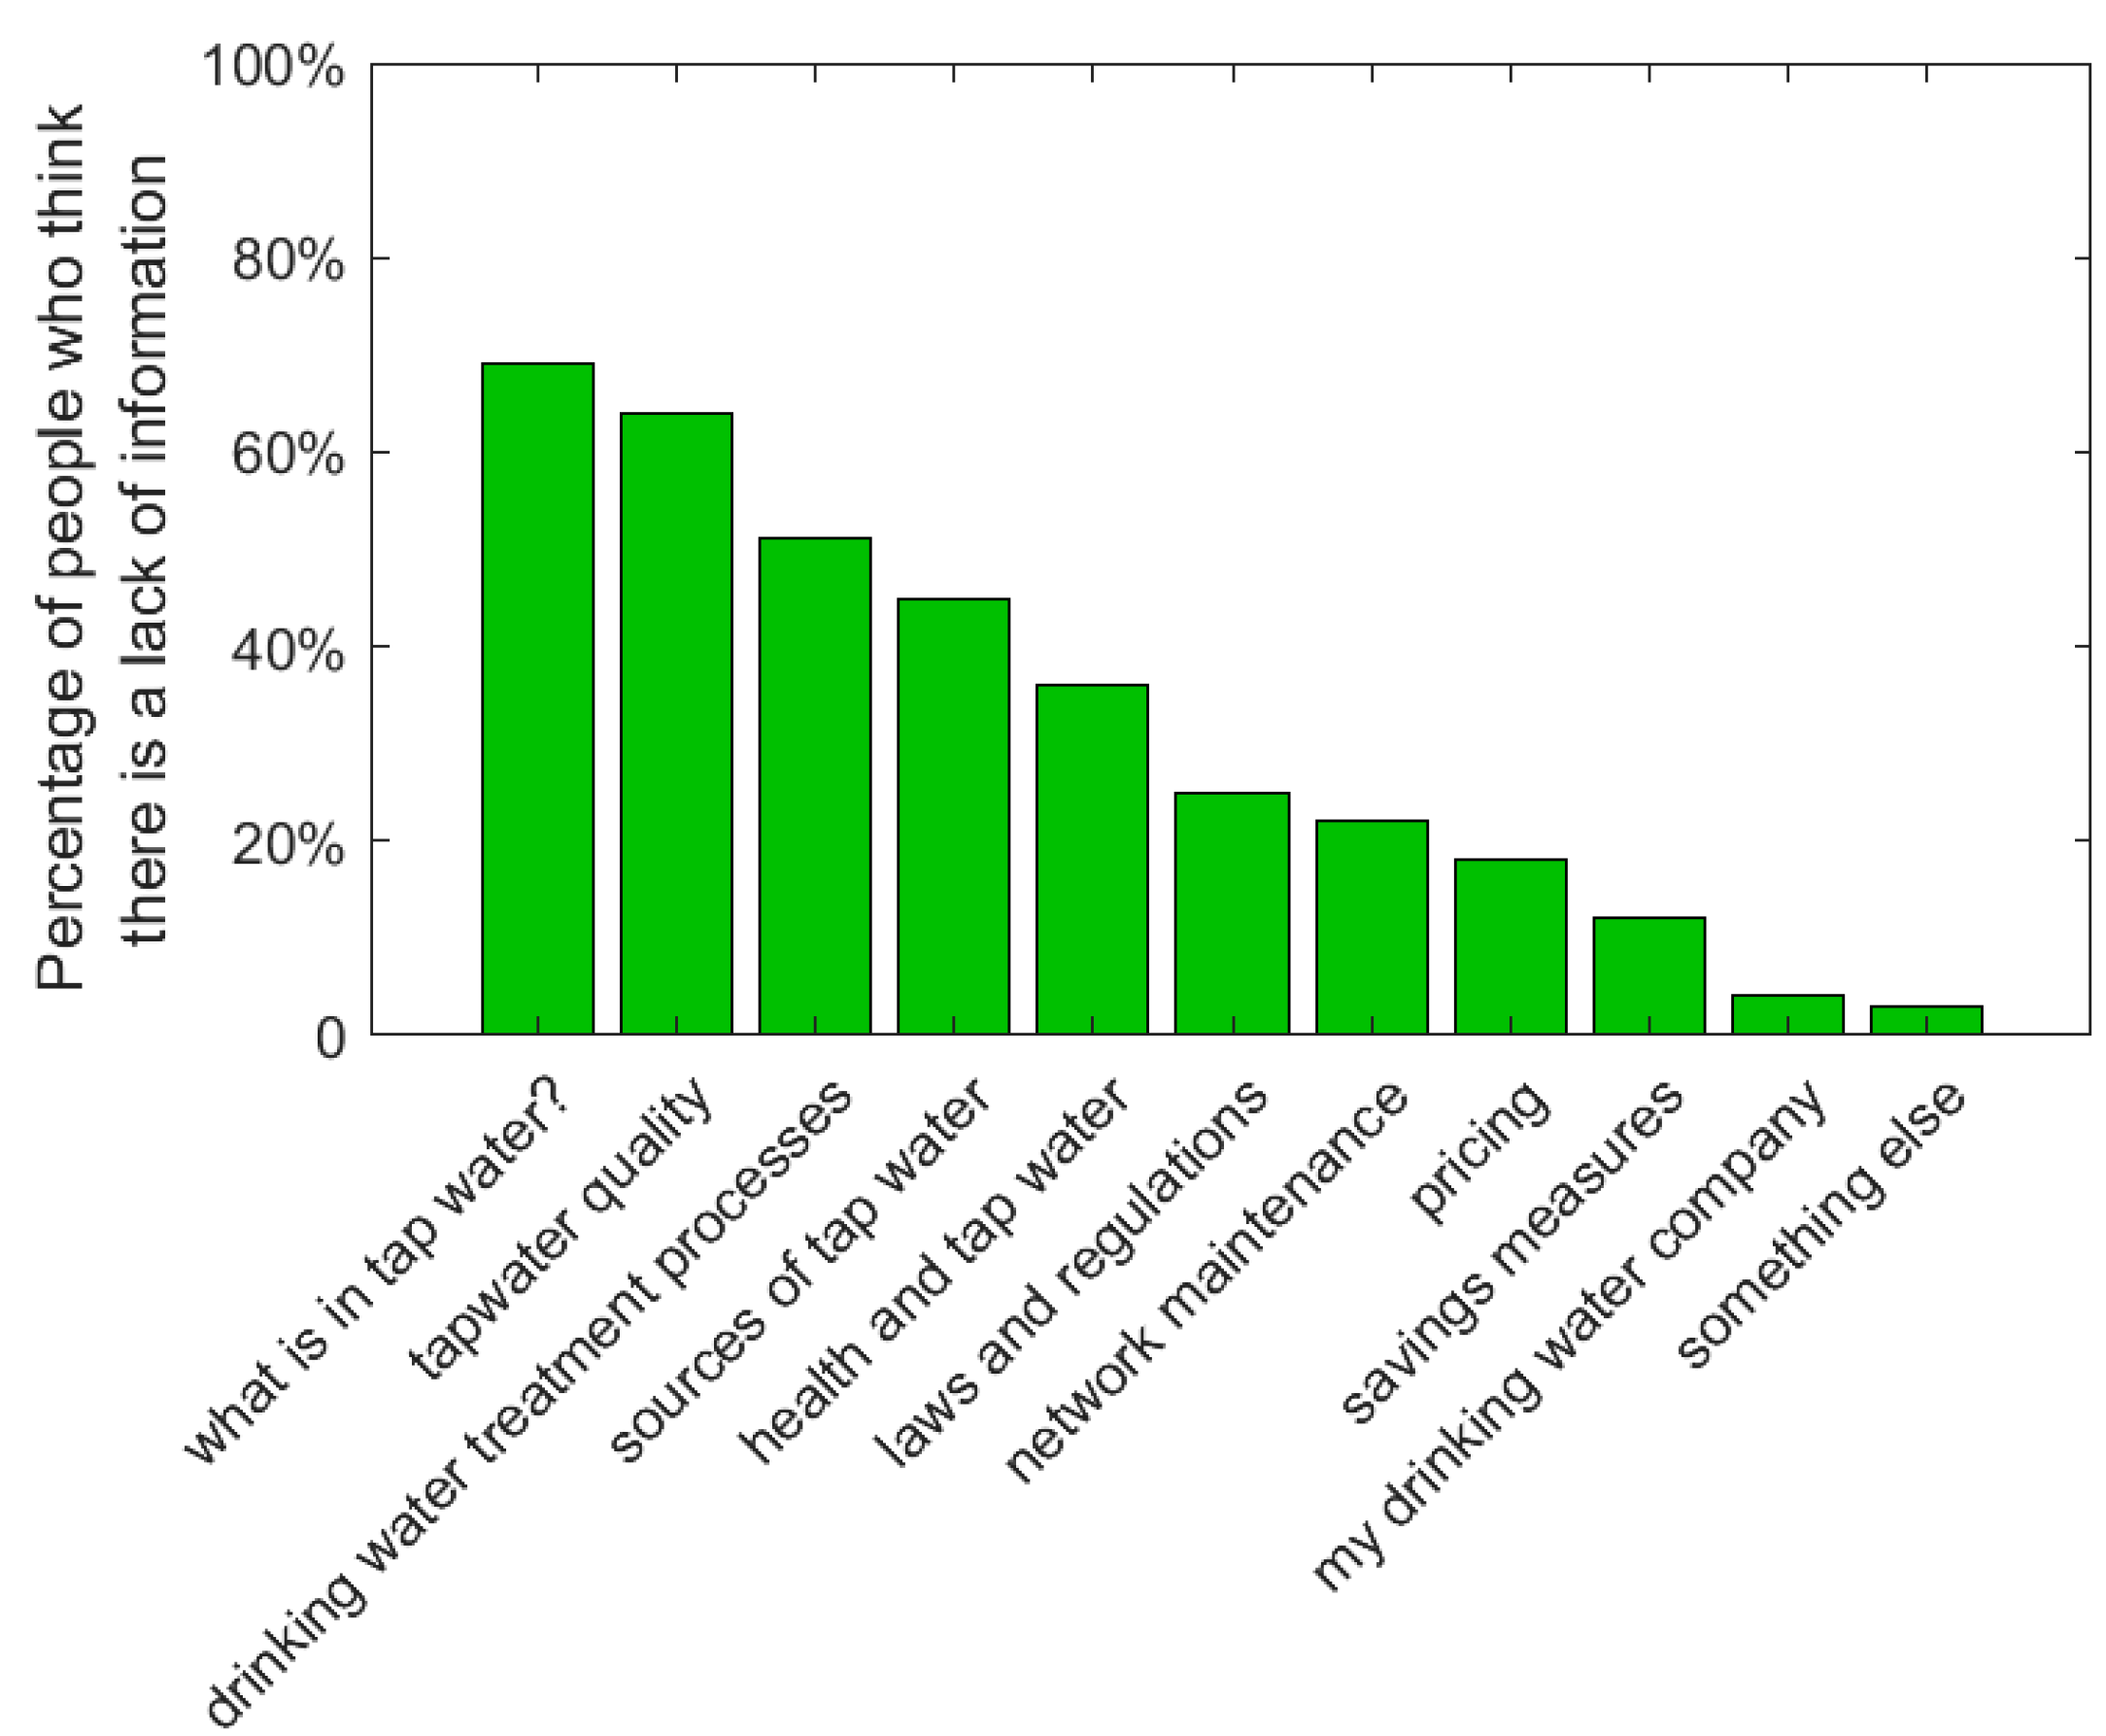
Respondents expressing to feel that there is insufficient information available were asked to indicate on which topics they would like additional information on. As shown in
Figure 4, the biggest need for additional information is associated with the quality of tap water (69%), and to a lesser extent (51%) on how their water is purified.
This call for more transparency on water quality data was also flagged during the focus groups—not because customers indicate that they will likely read information on quality data, but because they find it a sign of trustworthiness when these data are not withheld. One focus group respondent, for instance, noted: ‘I’m not going to read it, I won’t look it up, but I think this information [water quality data] should be public.’ This revelation should be taken into account in relation to the finding that from the customers who believe that too little information is available, only a small proportion (18%) have actively searched for information in the past 24 months. In other words, they call for transparency as a sign of trust, as a symbol of openness. Furthermore, respondents indicate that they like the idea that journalists or other independent experts probably will check these data, and warn the public if something is wrong. One respondent mentioned in this regard: ‘When drinking water companies would disclose this information, it becomes verifiable, an idea which gives me comfort’.
In the focus groups, it was stressed that most customers prefer water quality data offered on the website and presented in different layers and at substance group level, with the idea that interested customers can click-through easy accessible information on the home page to a second and perhaps even third layer of content with more specific information on individual substances. Especially low-educated customers with the “quality and health concerned” perspective displayed an urge for this. They fear that a full disclosure of quality data–not offered in different layers–would be at the expense of clarity. Customers with the “down to earth and confident” perspective prefer different layers of information because they generally are averse from “an overload” of information.
Even though it is evident that during the course of a focus group the effect of transparency on the trust in drinking water cannot be determined properly, a first attempt to this end was nevertheless made by asking participants to describe their feelings (e.g., fear, trust, uncertainty) after reading texts with transparent data on water quality, as well as by asking them to quantify their level of trust and concern both at the start and at the end of the focus group. Especially the latter results are interesting as both the perceived safety and the level of concern slightly decreased after reading and discussing texts about non-natural substances in tap water. A preliminary and speculative explanation is that through this transparency, more customers become aware that, indeed, very small quantities of non-natural substances in tap water can be detected. This may have resulted in a slightly lower level of trust in the quality. However, at the same time, customers feel reassured that their water company has nothing to hide and is on top of it. The latter is in coherence with the work of Brouwer, et al. [
45], and illustrated by the fact that after reading texts about these pollutants, respondents more often trust that their water is well purified and controlled and that water companies have sufficient knowledge to keep their water safe.
In addition to the call for transparency, in all focus groups, it became apparent that customers have a strong need for an interpretation of the quality data. What do certain quality data, such as x milligrams of substance y, actually mean in relation to, for instance, other routes of exposure, on the long term, or for specific customer groups such as newborns, elderly and vulnerable people? As described, Slovic, Finucane, Peters and MacGregor [
8] suggest that when the causes, consequences and the probability of a risk can be comprehended by an individual, risks are generally judged lower than when this is not the case. Information about risks, including guidance for interpretation, may contribute to the public understanding of these risks. In relation to this, it should be noted that the focus group discussions revealed that many customers have difficulty with mass units, such as nano-, micro- or milligrams. Moreover, customers often do not realize that they do not understand these units properly, leading to the risk of incorrectly interpreting data. To overcome this problem, it would help, for instance, to exemplify what certain entities mean, such as comparing a certain quantity of a substance to dissolving one tablet of paracetamol in a number of swimming pools.
Another focus group finding relates to the importance of consistency in communication towards customers, particularly for customers with the “quality and health concerned” perspective. When information seems contradictory to customers, and the focus group results suggest that some customers almost seem to be looking for these instances, this is often regarded as a sign or confirmation that something is indeed not right, i.e., that information is being hidden from them. In the literature, this phenomenon of selecting information that matches existing beliefs is referred to as selective exposure [
46].
3.5. Media Reporting
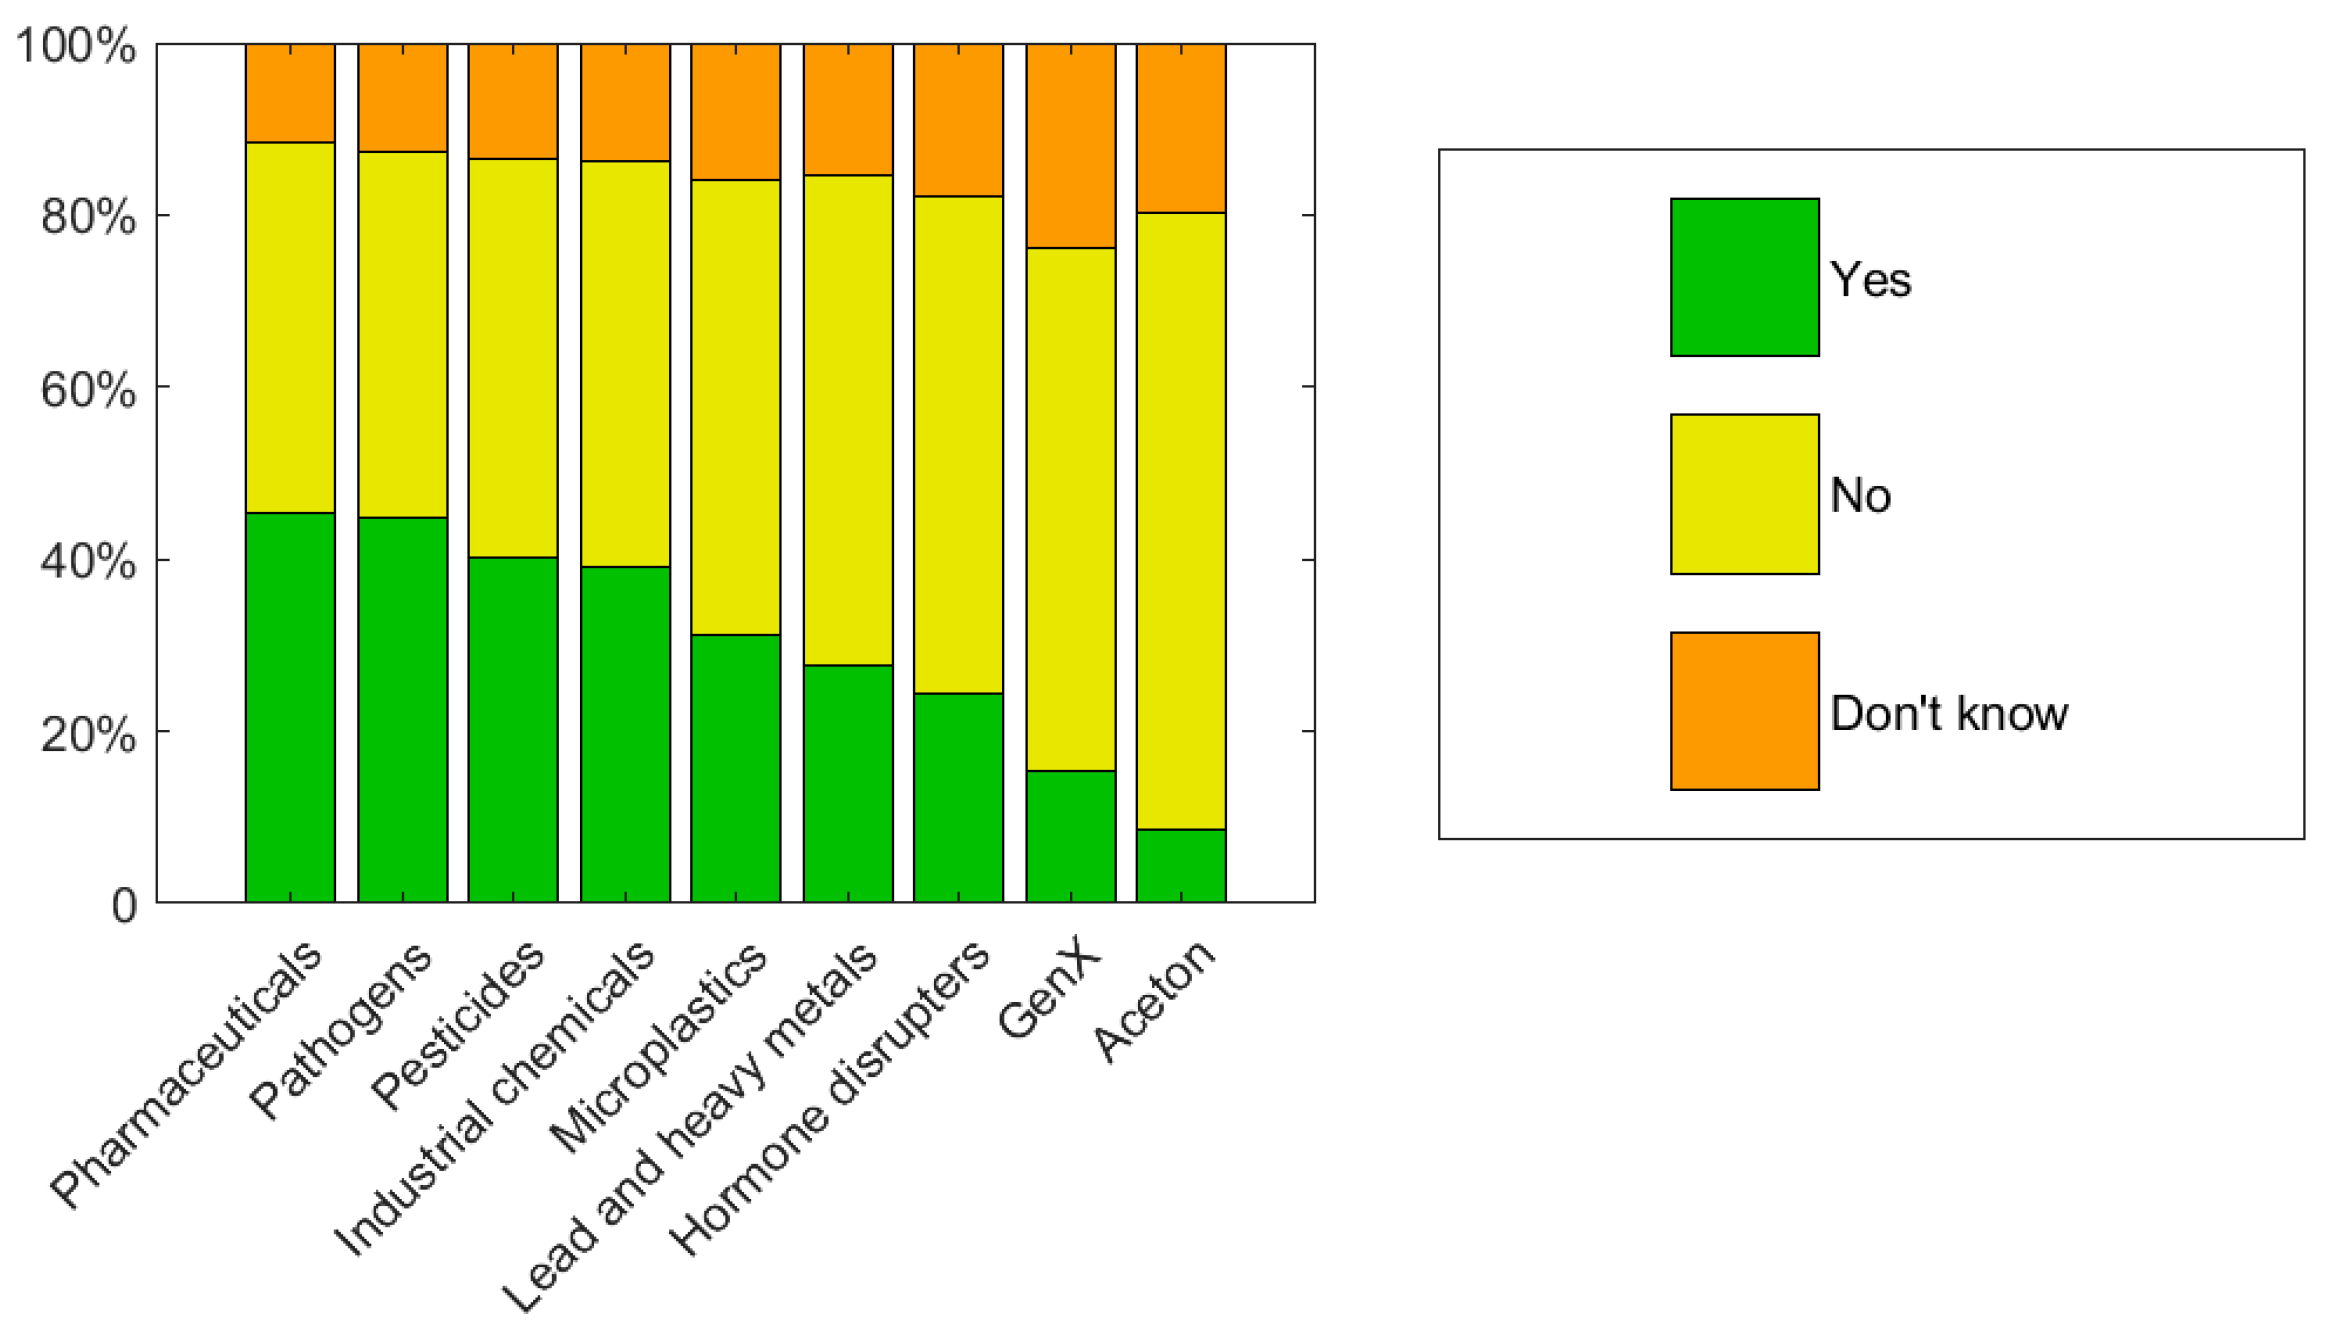
People’s perspectives often are affected by what they hear and see in media. Based on self-reporting, in the past 24 months, 67% of customers have come across media reports about pollution of Dutch tap water (sources) by various substances or substance groups (
Figure 5).
Customers report that they most frequently came across information about medicine residues/pharmaceuticals and pathogens (both 45%), pesticides (40%) and chemicals from industry (39%). About one third (31%) of the respondents expressed to have come across information about microplastics, and 29% about hormone disrupters. After this type of media coverage, almost half of the customers (45%), including significantly more often women, low educated customers, parents of children, and customers with the “quality and health concerned” perspective, expressed increased concerns about the quality and safety of tap water. Customers who have come across information about contaminants consider their tap water more often to be unsafe and are more concerned about the quality and safety of tap water (Spearman rankings, p < 0.05). This may partly be caused by inaccurate reporting on, for instance, the difference between various types of water, or the difficulty people have in judging media reports.
In addition to the fact that media coverage can result in additional concerns, customers remarkably often indicate that the social position of the media leads to greater confidence in the quality and safety of their water. Respondents often refer to the media as the watchdog of drinking water quality. ‘I have the feeling that it will be reported honestly if it’s not okay. If not by the responsible authorities, then by the media, who will come immediately after it’.
Customers who in the past 24 months have actively searched for information on the quality of their tap water have done so mainly via an internet search engine (64%). Just over half of these customers (52%) stated that they looked for this information at their water utility’s website. The latter group of customers significantly more often consider tap water to be safe. Some of the other customers, significant more often with the “egalitarian and solidary” and “quality and health concerned” perspective, who instead looked for information on social media (10%), or via family, neighbors and friends (12%), consider tap water significantly more often as unsafe; the latter group of customers is also significantly more often concerned about the quality and safety of their tap water. Speculatively, this may partly be a consequence of the wide spread of “fake news” on the social media [
47] and the fact that people are more and more enclosed to their own bubble, limiting the exchange of ideas between, for instance, people who primarily rely on social media platforms for news and people who rely on official sources of information.
3.6. Institutional Trust
As mentioned in
Section 3.1, confidence in drinking water companies is an important dimension explaining our observed high level of trust in tap water. Furthermore, as indicated in
Section 3.3, a large number of respondents stated that they have confidence in drinking water standards because they have been established by experts. At the same time, it is argued that public trust in official authorities and science is declining [
6,
48]. This raises the question of how large the institutional trust is that customers have in water companies. As shown in
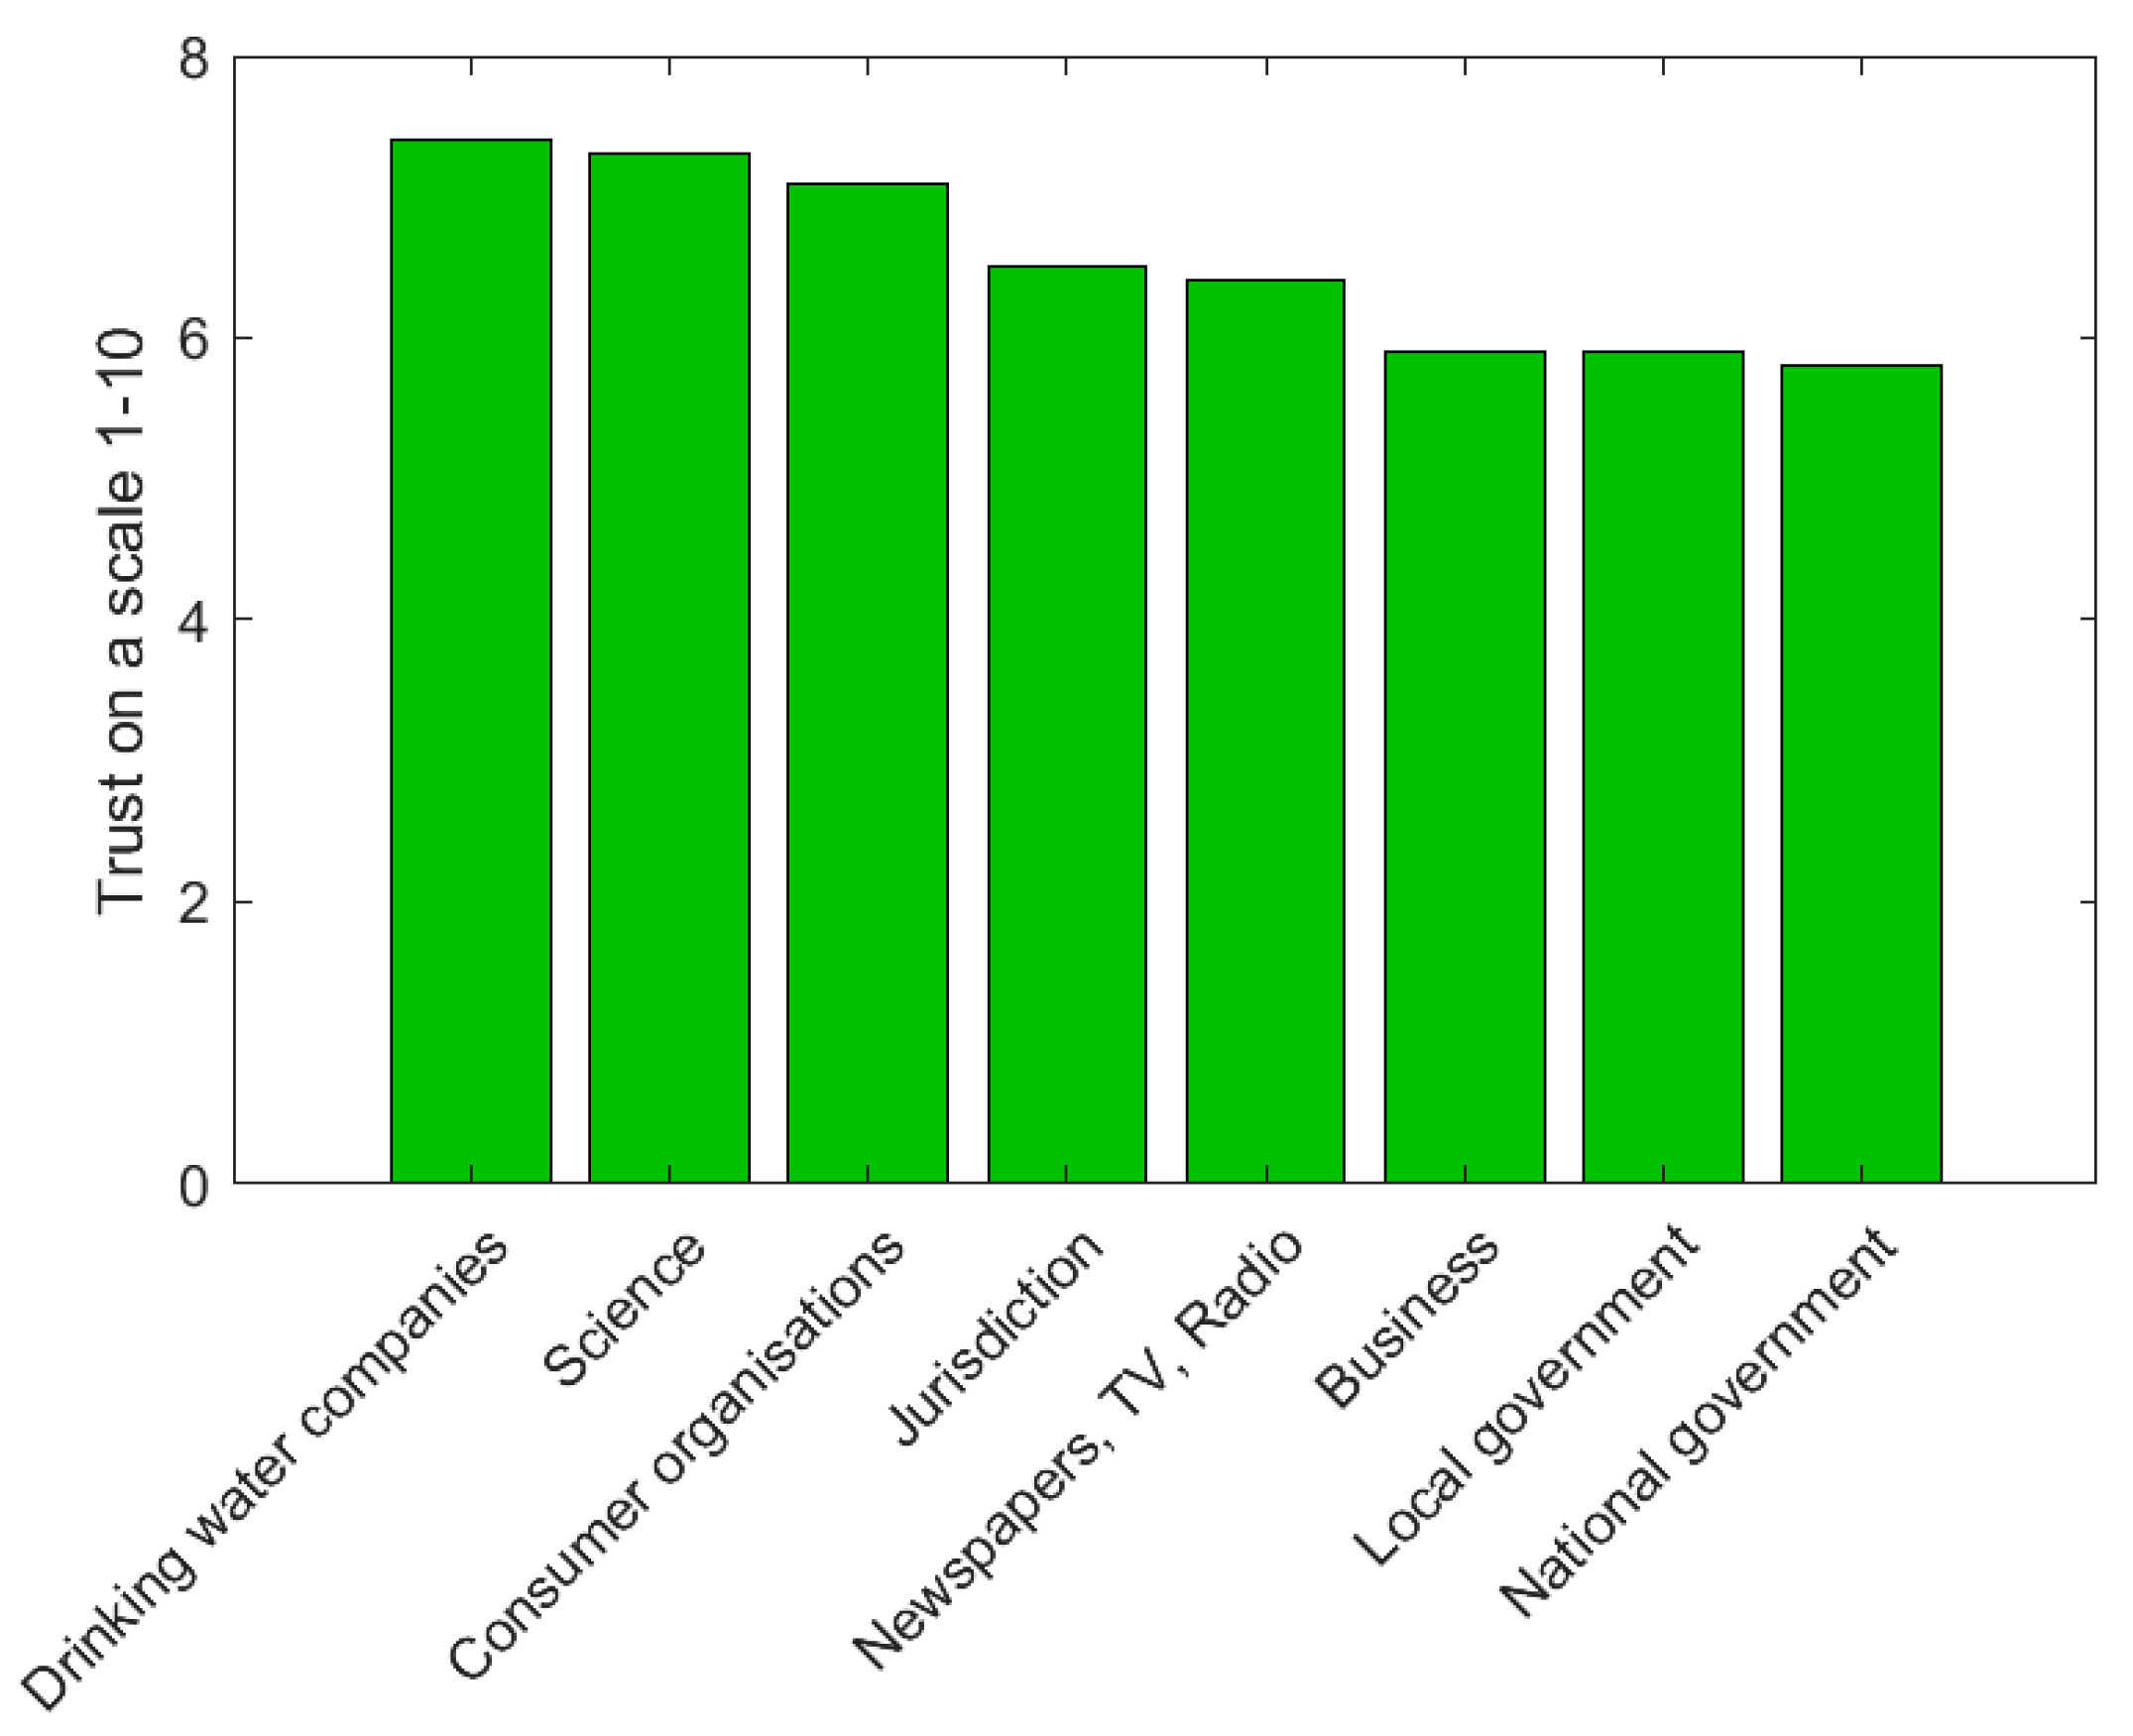
Figure 6, in the Netherlands, the confidence in water companies is fairly high when compared with other institutions such as governmental authorities and the business world.
On a scale of 1 to 10, on which a 1 stands for no trust at all and a 10 stands for full trust, customers give the water companies an average score of 7.4. This score is significantly higher for men (7.6 versus 7.3 for women), older customers (7.6 for customers aged 60+ versus 7.3 for customers aged 18–29), higher-educated customers (e.g., persons with a secondary vocational education (7.3) and people with a scientific education (7.7)), and customers with the “down to earth and confident” perspective (7.7). Customers with the “quality and health concerned” perspective give a significantly lower score (6.5) for their trust in water companies. Customers with greater confidence in water companies are significantly more likely (Spearman rankings, p < 0.05) to believe: (i) that the quality and safety of tap water in the Netherlands is properly monitored; (ii) that tap water in the Netherlands is sufficiently purified; (iii) that their own water company has sufficient knowledge to keep tap water safe; and (iv) that tap water containing a small quantity of non-natural substances is safe to drink as long as the quantity falls within the regulatory standards. In addition, customers with greater confidence in water companies are significantly less concerned about the quality and safety of Dutch tap water.
3.7. Perceptions in Perspective
In an effort to put the concerns related to tap water in an even broader perspective, respondents were asked to indicate to what extent they might be concerned about the quality and safety of other products. This shows that, after, bread and bakery products, tap water is actually the product type that customers have the least worries about. Relatively more concerns relate to the quality and safety of fruits, vegetables, milk, soft drinks, eggs, fresh meat, fresh fish and ready meals from the supermarket. The percentage of customers that either regard tap or bottled water safer is equal (24%). Most customers (44%) regard both types of water equally safe. Many customers also personally place their concerns about tap water, if any, into a broader perspective. ‘I don’t live in a sterile environment either. When I go outside, I also inhale bad substances.’, or, as another respondent put it: ‘There are so many things bad for you these days. What can you still eat and drink safely? So yeah, does it make sense to start worrying about that [quality of water] now?’
An additional question that can be asked is how perceptions on tap water quality have developed over time, and to what extent people have confidence in the future. As to the first question, about half (48%) of the respondents stated to think the level of safety has remained stable. More than one out of four (28%) believes their tap water has become safer, mainly attributed to predicted better treatment processes and intensified quality controls. One respondent, for instance, noted: ‘100 years ago there was a lot of regional industry here, textiles, Philips, however, this has sharply declined. As a consequence, I believe there are far fewer contaminants in the soil, and accordingly in our water’. A smaller group of customers (15%) perceive their water as less safe. Recent stories about tap water pollution (like the presence of lead in tap water in the Netherlands and the Flint water crisis in the USA e.g., [
48,
49]) and river and groundwater pollution are the main source of concern for these customers. This often is caused by the fact that for many people it is difficult to distinguish between different types of water (surface water, groundwater, wastewater and drinking water), as a result of which alarming information on other types of water raises concerns about drinking water quality. Except for the presence of a chronic disease, which is correlated to a higher probability that customers perceive their water to be less safe when compared to 10 years ago (Mann–Whitney U test
p < 0.01), these results are not significantly correlated to characteristics such as gender or age.
When looking ten years ahead, a mixed picture emerges from the additional interviews. Some respondents are positive, as illustrated by the following statement: ‘because the environmental requirements are becoming more and more stringent”, whereas others first and foremost refer to foreseen technological advances. Other respondents look to the future with more concern. There are concerns about increased pollution in the environment (soil, groundwater and surface water). “The whole world is polluting (…) Plastic, microplastics. At the end it all ends up in the water.’ Additionally, other respondents refer to specific perceived threats, including medicine residues and drug dumping.
4. Discussion
Drinking water companies in the Netherlands seek to inform their customers on water quality issues without raising unnecessary concerns about safety and risks. At the same time, they want to keep, or possibly even strengthen, current levels of customer trust. The question is how to accomplish this in a context of decreasing trust in authorities and science, and a growing urge for transparency. Despite this study’s finding that as much as 90% of the respondents perceive tap water in the Netherlands as safe, reconfirming previous studies e.g., [
35] showing high customer appreciation scores for tap water quality, and a high institutional trust in drinking water companies, this is a complex matter. After all, trust is never self-evident and must be regained over and over again. More importantly, we have seen that even today, one out of four customers (23%) reports concerns about the quality and safety of Dutch tap water, and that less than half of all customers (47%) feel that tap water with a small amount of non-natural (anthropogenic) substances, even when maintained below legal standards, is safe to drink.
Effective risk communication is complex, and requires a thorough understanding of the information needs and risk perception of the general public [
7]. Regarding the latter, and in accordance with previous studies e.g., [
7,
9,
10], we are led to the conclusion that risk perception by the general public is intuitive, and among others influenced by emotional processes, heuristics, and political and cultural factors. This study revealed various correlations between traditional segmentation parameters, such as gender (women generally judge risks higher than men), education (generally inversely correlated with risk perception) and the presence of children (customers with children are generally more concerned). These findings resonate with previous studies focusing on the relationship between personality traits and risk perceptions, such as the works Doria [
24] and Slovic, Finucane, Peters and MacGregor [
8]. Perhaps even more notable than the power of traditional segmentation parameters, is the explanatory strength of the four drinking water perspectives central in this study [
35], that resemble, to some extent, the worldviews in the cultural theory launched by Mary Douglas [
31]. Customers with the “quality and health concerned” perspective are significantly more concerned about the quality and safety of Dutch tap water, whereas customers with “down to earth and confident” perspective report less concerns.
Notwithstanding the variation between customer segments, it is possible to draw some overall lessons. From the above, it becomes clear that transparency on water quality levels can help to increase customers’ trust in drinking water quality. At the same time, however, it becomes evident that people find it often difficult to judge the information provided on water quality. As consumers’ trust in Dutch drinking water companies is relatively high, it seems sensible that drinking water companies themselves should provide more information about water quality and purification. In terms of practical recommendations, we would encourage water companies to enhance transparency. Not because customers indicate that they will actually read information on quality data, but because in this manner, customers feel reassured that their water company has nothing to hide. This detailed water quality information should be offered in different information layers, which can be found and understood by external experts, as well as interested customers. Providing this transparency can comfort customers to the sense that no information is withhold, and it reassures them in the idea that societal “watchdogs”, such as journalists, are enabled to keep track of potentially alarming developments.
Content wise, water companies should focus on their purification and control efforts rather than on compliance with tap water quality standards. We have seen that standards may be considered political and subject to lobbying from agriculture and industry, and, therefore, not necessarily trustworthy, whereas confidence in water companies is high. After all, Poortinga and Pidgeon [
20] showed that the acceptability of risks is closely related to the extent to which people trust the risk institutions involved. Thus, trust in the quality and safety of tap water may be reinforced by placing more emphasis on purification processes and quality checks. Showing how drinking water is produced from a certain source and demonstrating the fact that drinking water really is something different from, e.g., surface or wastewater will increase awareness about different types of water. Information on the fact that water companies literally measure for hundreds of different substances can likewise strengthen confidence, as it places the expertise of water companies in the spotlights, and demonstrates that their treatment plants are highly advanced.
In addition, and in coherence with Slovic, Finucane, Peters and MacGregor [
8], we suggest a good interaction between information on analytical risk assessments with how people perceive and understand risks, as well as taking into account the reputation of certain substances. In connection with this, we encourage the importance of recognizing that different customers may experience risks differently, and have partly diverse information needs. In all cases, it would help if information is exemplified, e.g., by showing what a certain concentration refers too in daily life. Doing so could potentially avert the risk of customers misinterpreting data due to a lack of understanding of the applied units. It appears that customers with the “quality and health concerned” perspective require additional attention in this respect. This group, representing about 13% of all customers [
35], shows the most concerns, has the lowest level of trust, and displays a clear need for transparency and extensive information on the quality of their tap water and the health effects of non-natural substances. At the other end of the spectrum, we find customers with the “down to earth and confident” perspective best served by short and technical information. Customers with either the “egalitarian and solidary” or “aware and committed” perspective are in between these two extremes.
The above conclusions and recommendations on risk perception and transparency are important, but need also to be approached with some caution. An important limitation of this study is that we could not analyze the effect of transparency on the trust of drinking water in real-life practice, but only during the course of a series of focus groups and on the basis of self-reporting. To deepen our understanding of the effect of transparency in both the long and the short run, we recommend future research to draw on an extended research design that allows real-life and long term examination. As to better understand to what extent the context in which this research was conducted might have influenced our results—that is, a small country where semi-public water companies provide drinking water and are marked by relatively high institutional trust—another promising line of future research would be to include an international comparison.


