Investigation of Attributes for Identifying Homogeneous Flood Regions for Regional Flood Frequency Analysis in Canada


Abstract
1. Introduction
2. Materials and Methods
2.1. Rationale for Attribute Selection
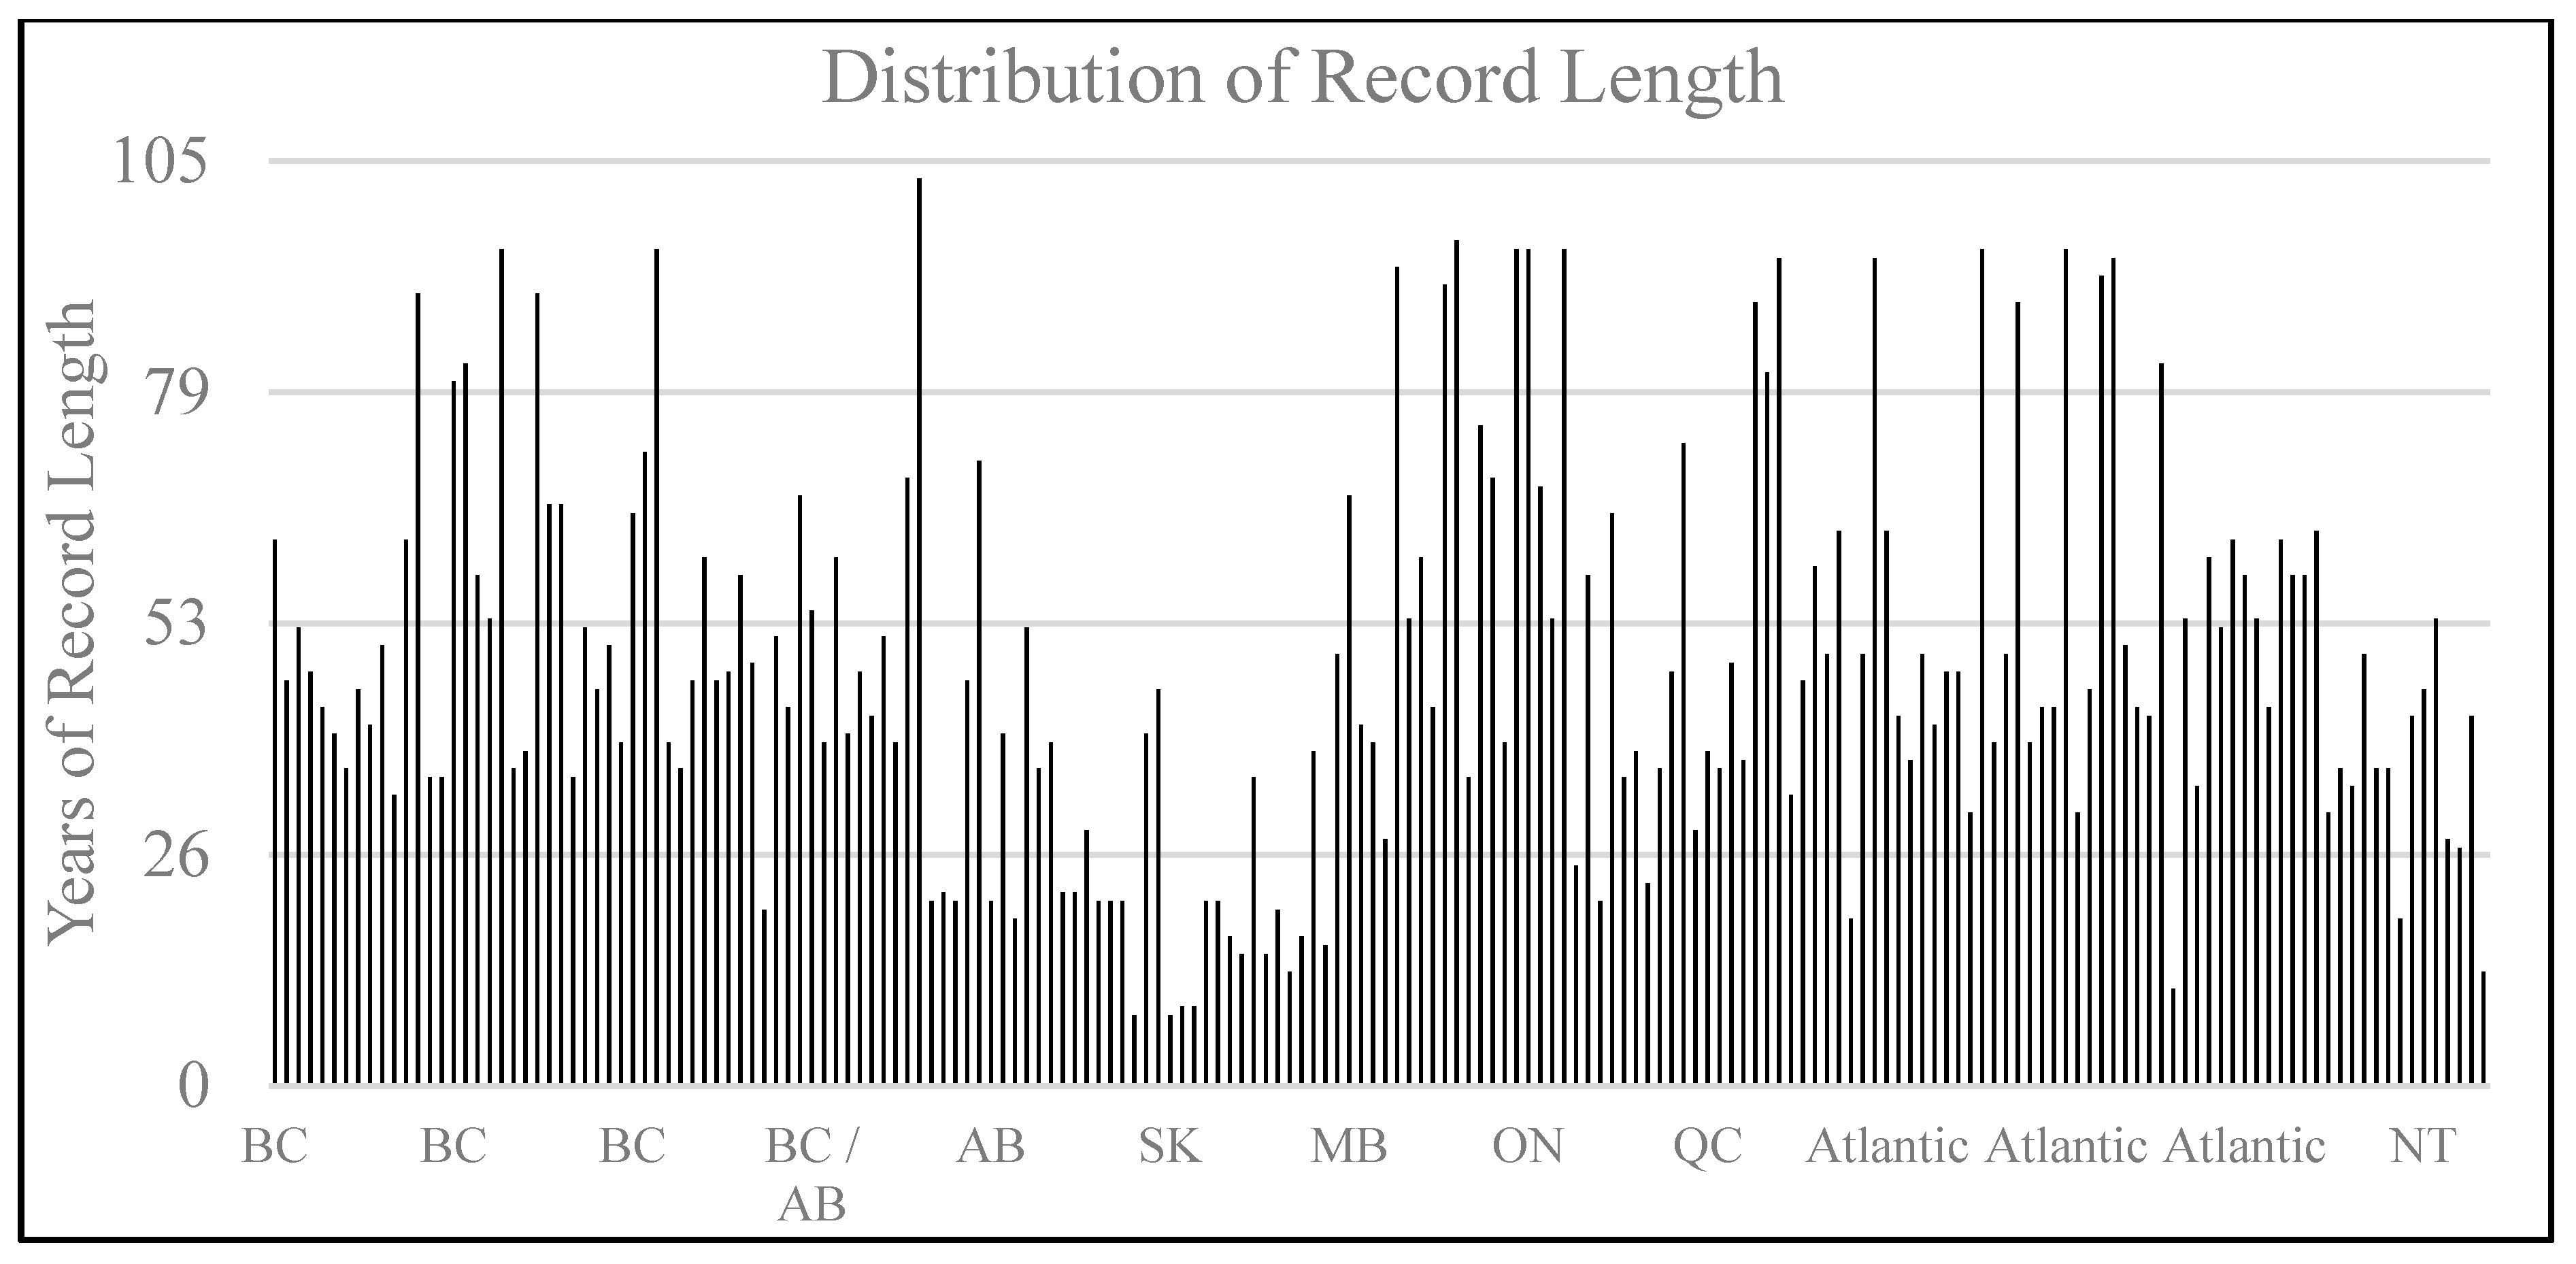
2.2. Datasets
2.3. Defining Attribute Similarity Distance
2.3.1. Geographical Proximity
2.3.2. Physiographic Variables
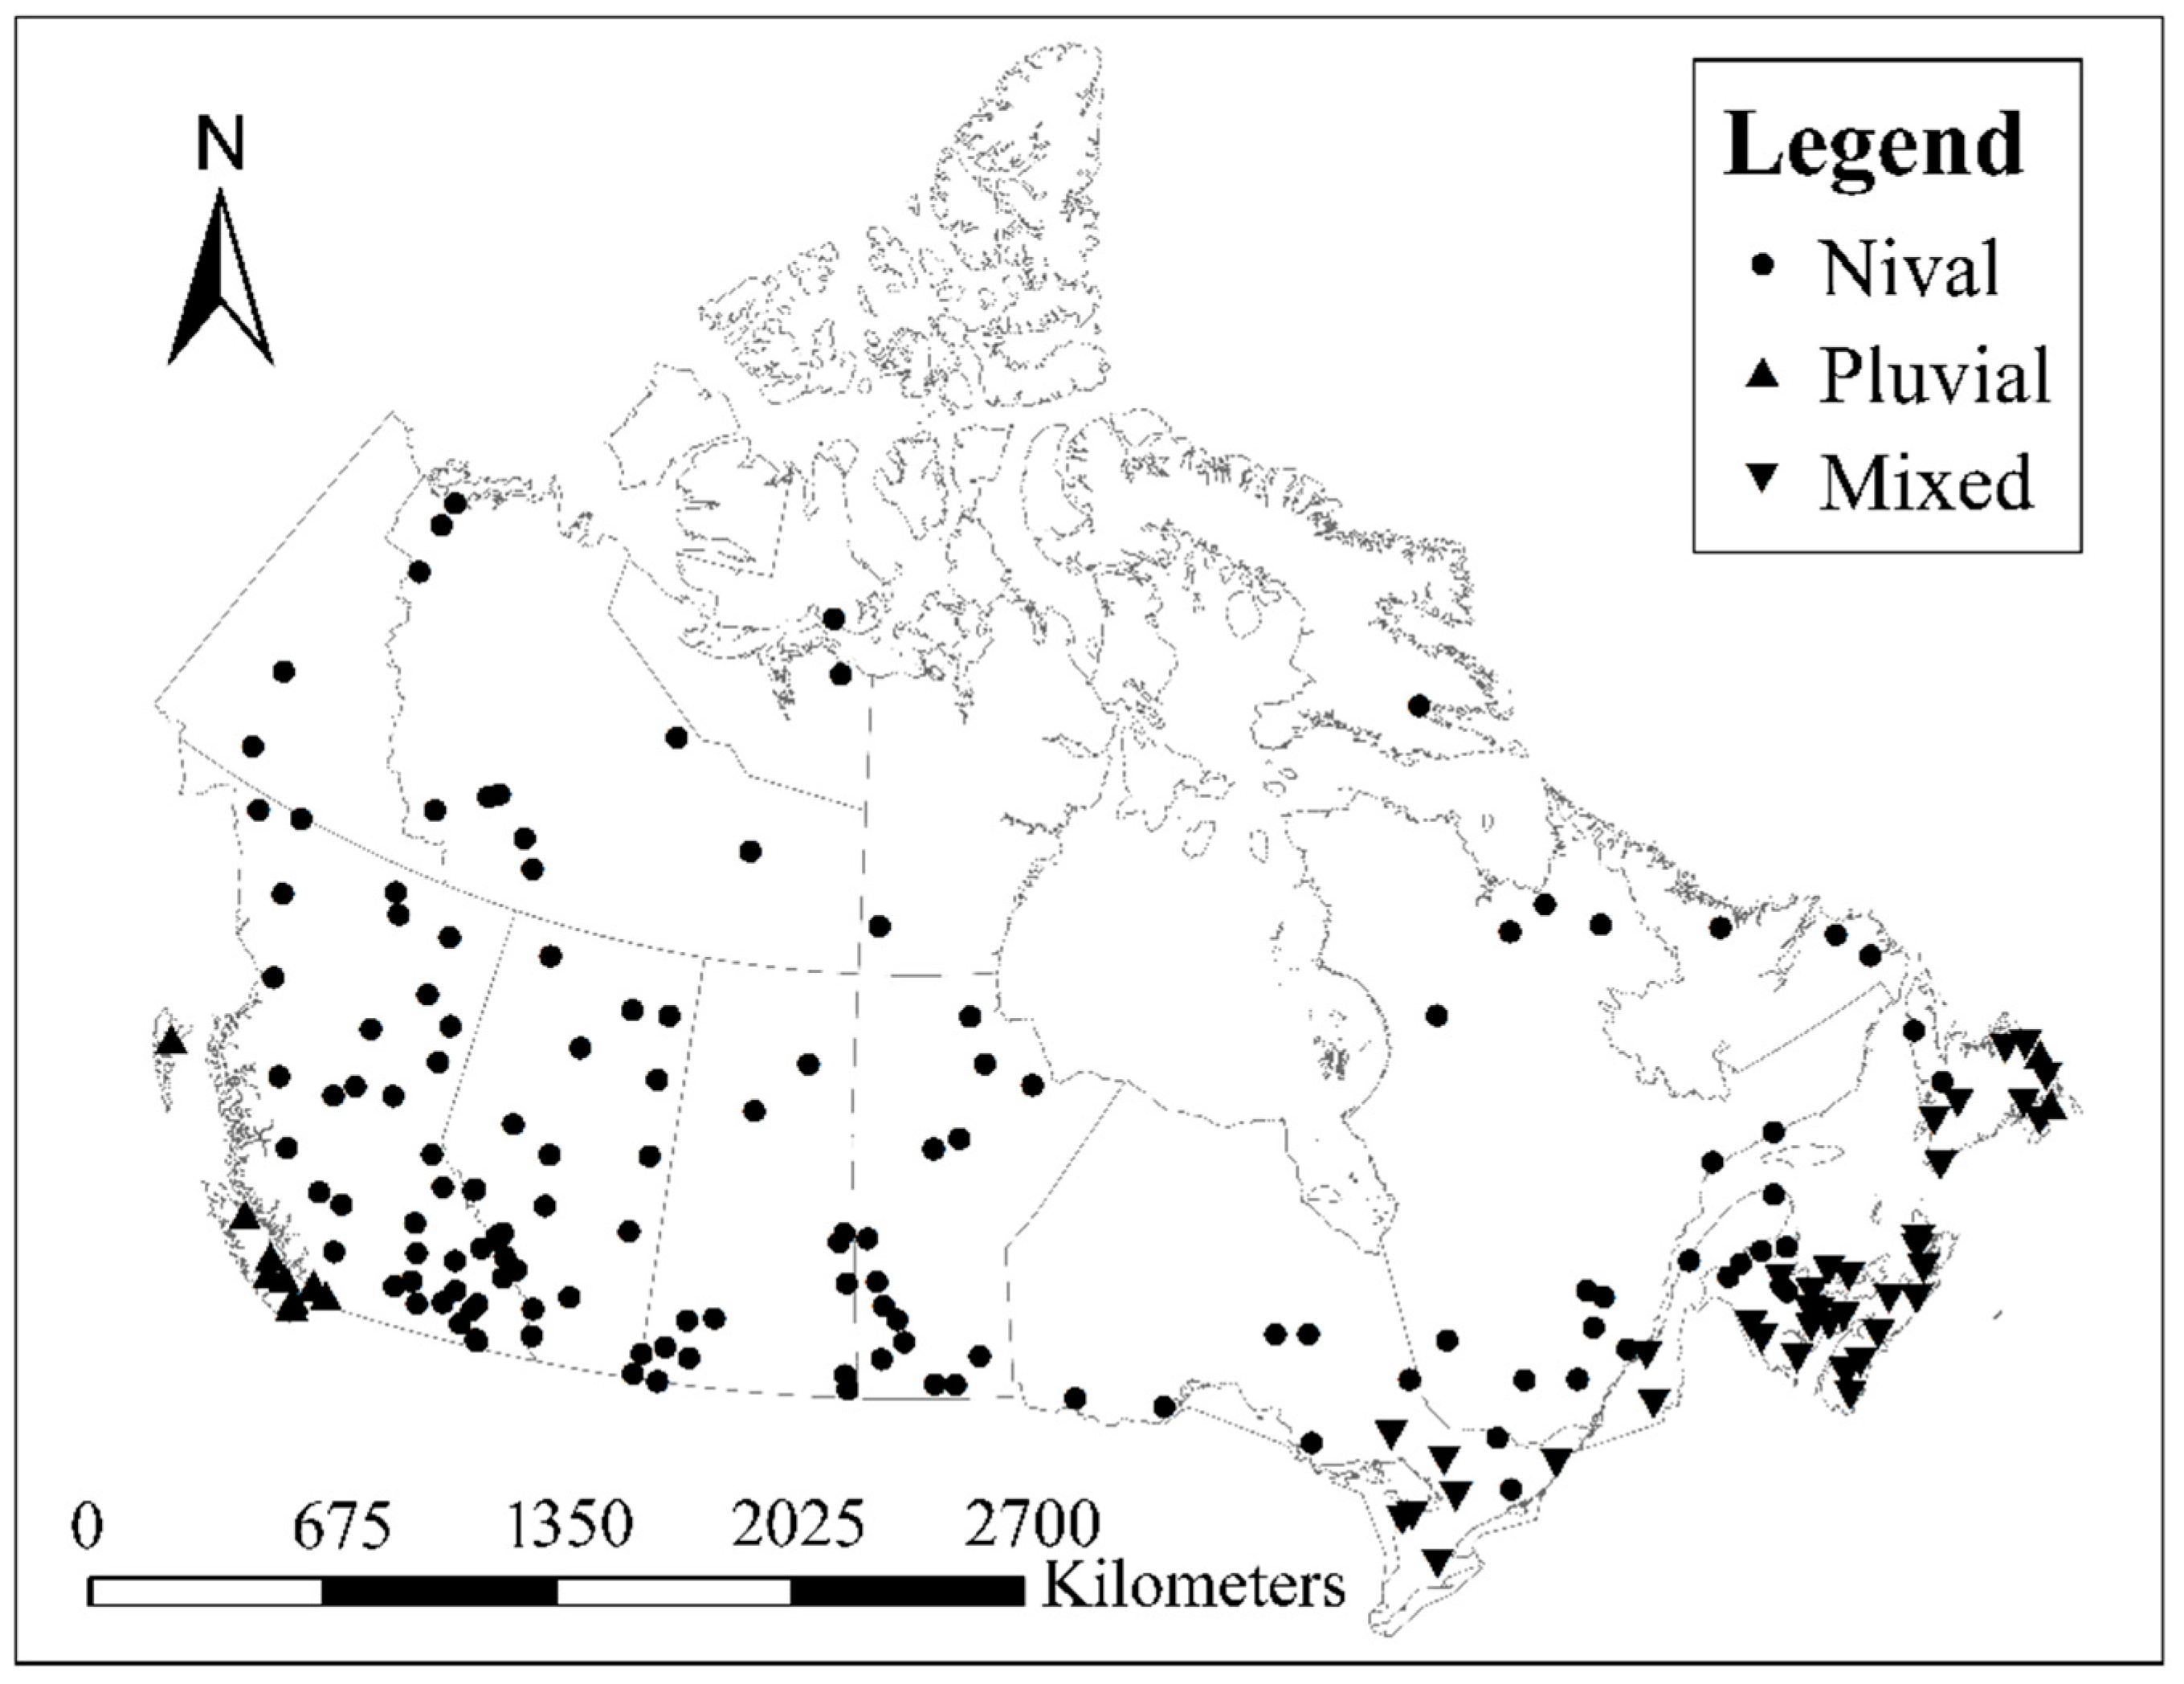
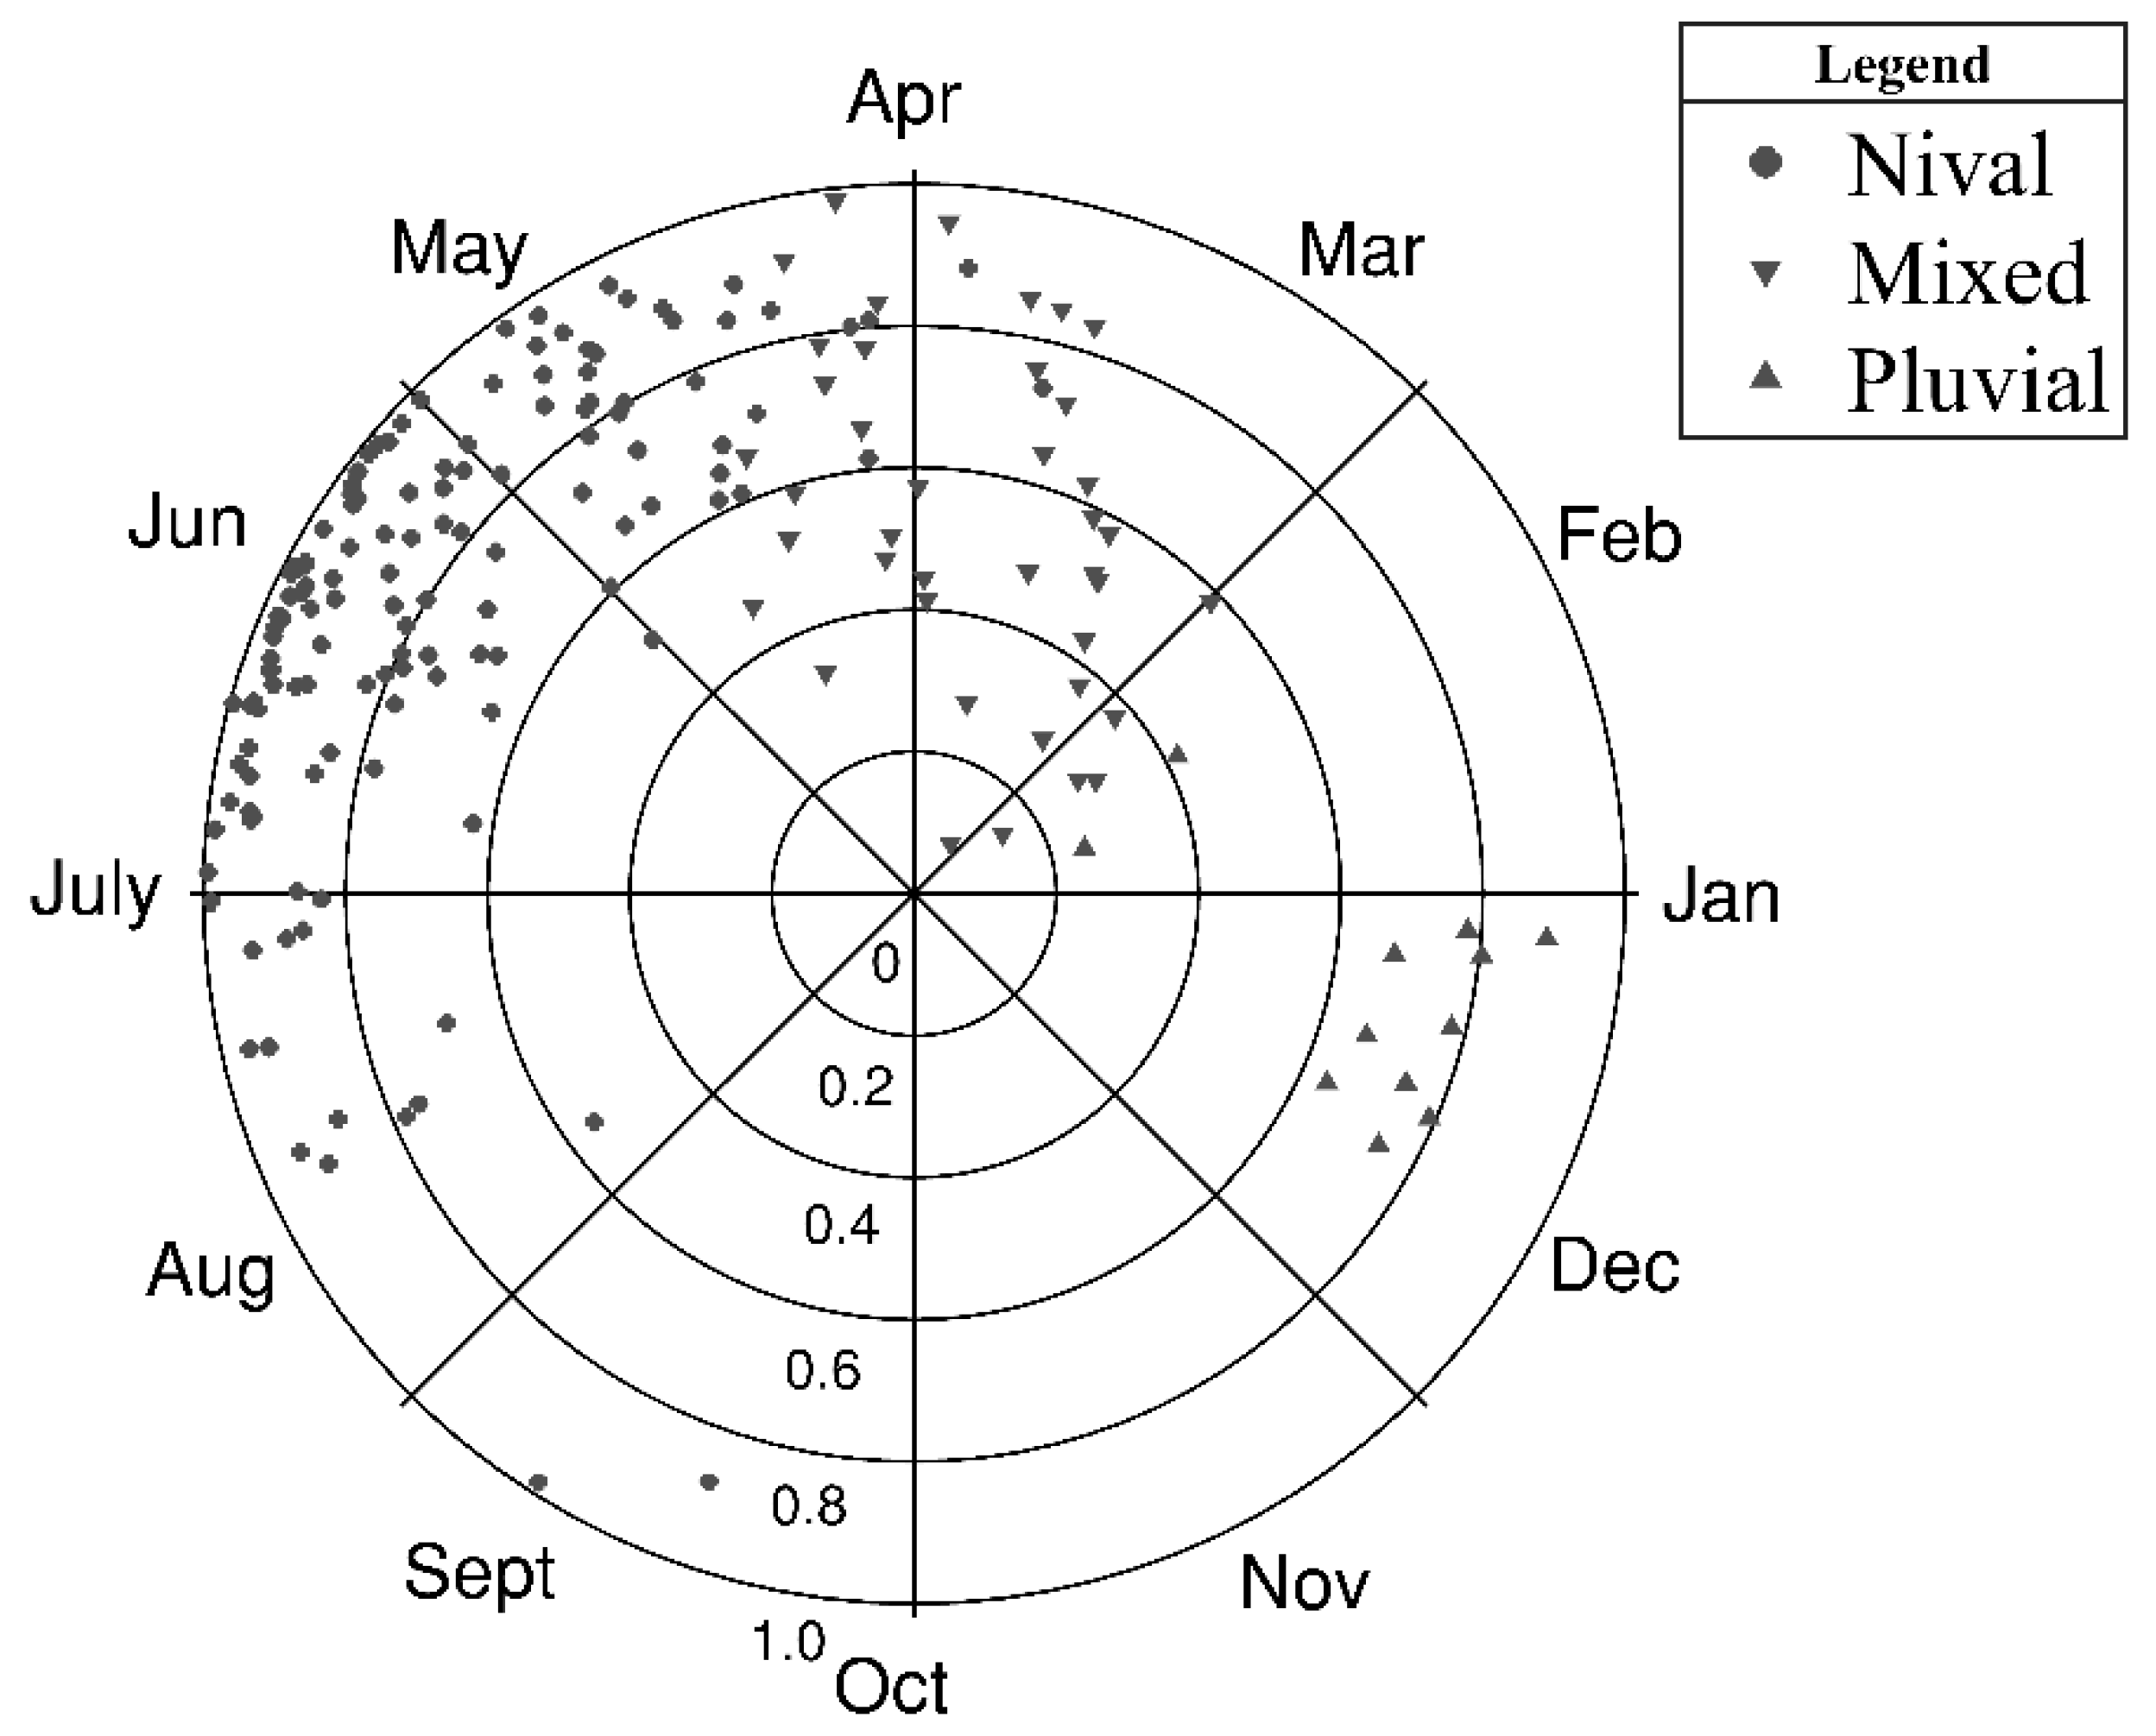
2.3.3. Flood Seasonality
2.3.4. Monthly Precipitation Pattern
2.3.5. Monthly Temperature Pattern
2.4. Region of Influence Approach
2.5. Generalized Extreme Value (GEV) Distribution and L-Moment Estimation Method
2.6. L-Moment Homogeneity Test
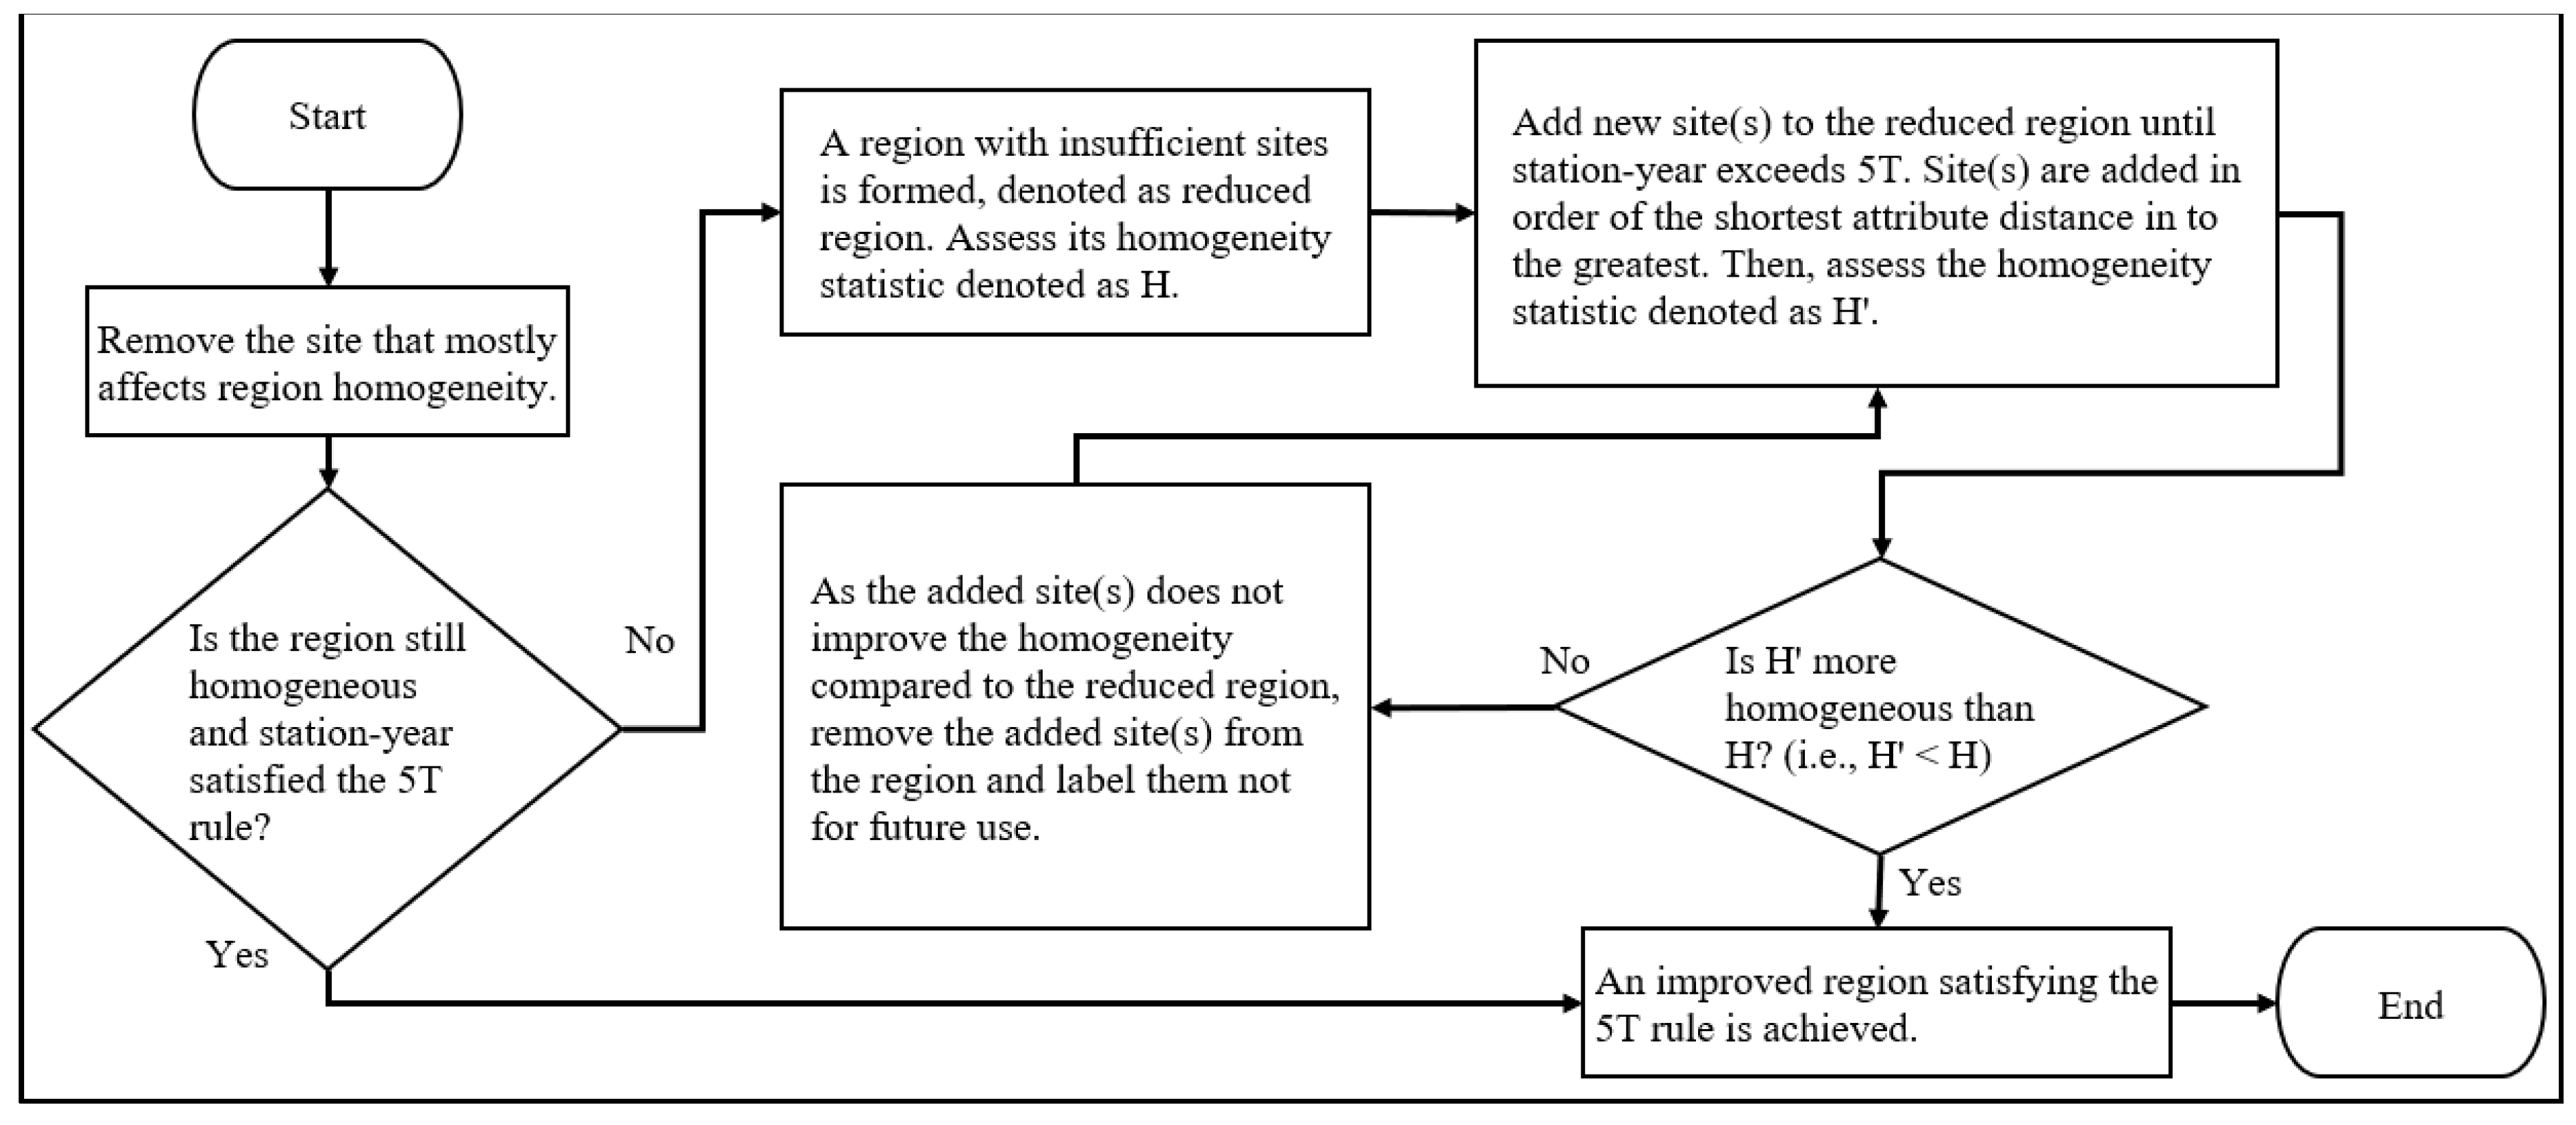
2.7. Automatic Region Revision Algorithm (ARRA)
2.8. Flood Region Identification Process
2.9. Assessing the Accuracy of Regional Flood Quantiles
3. Results and Discussion
3.1. ARRA Performance
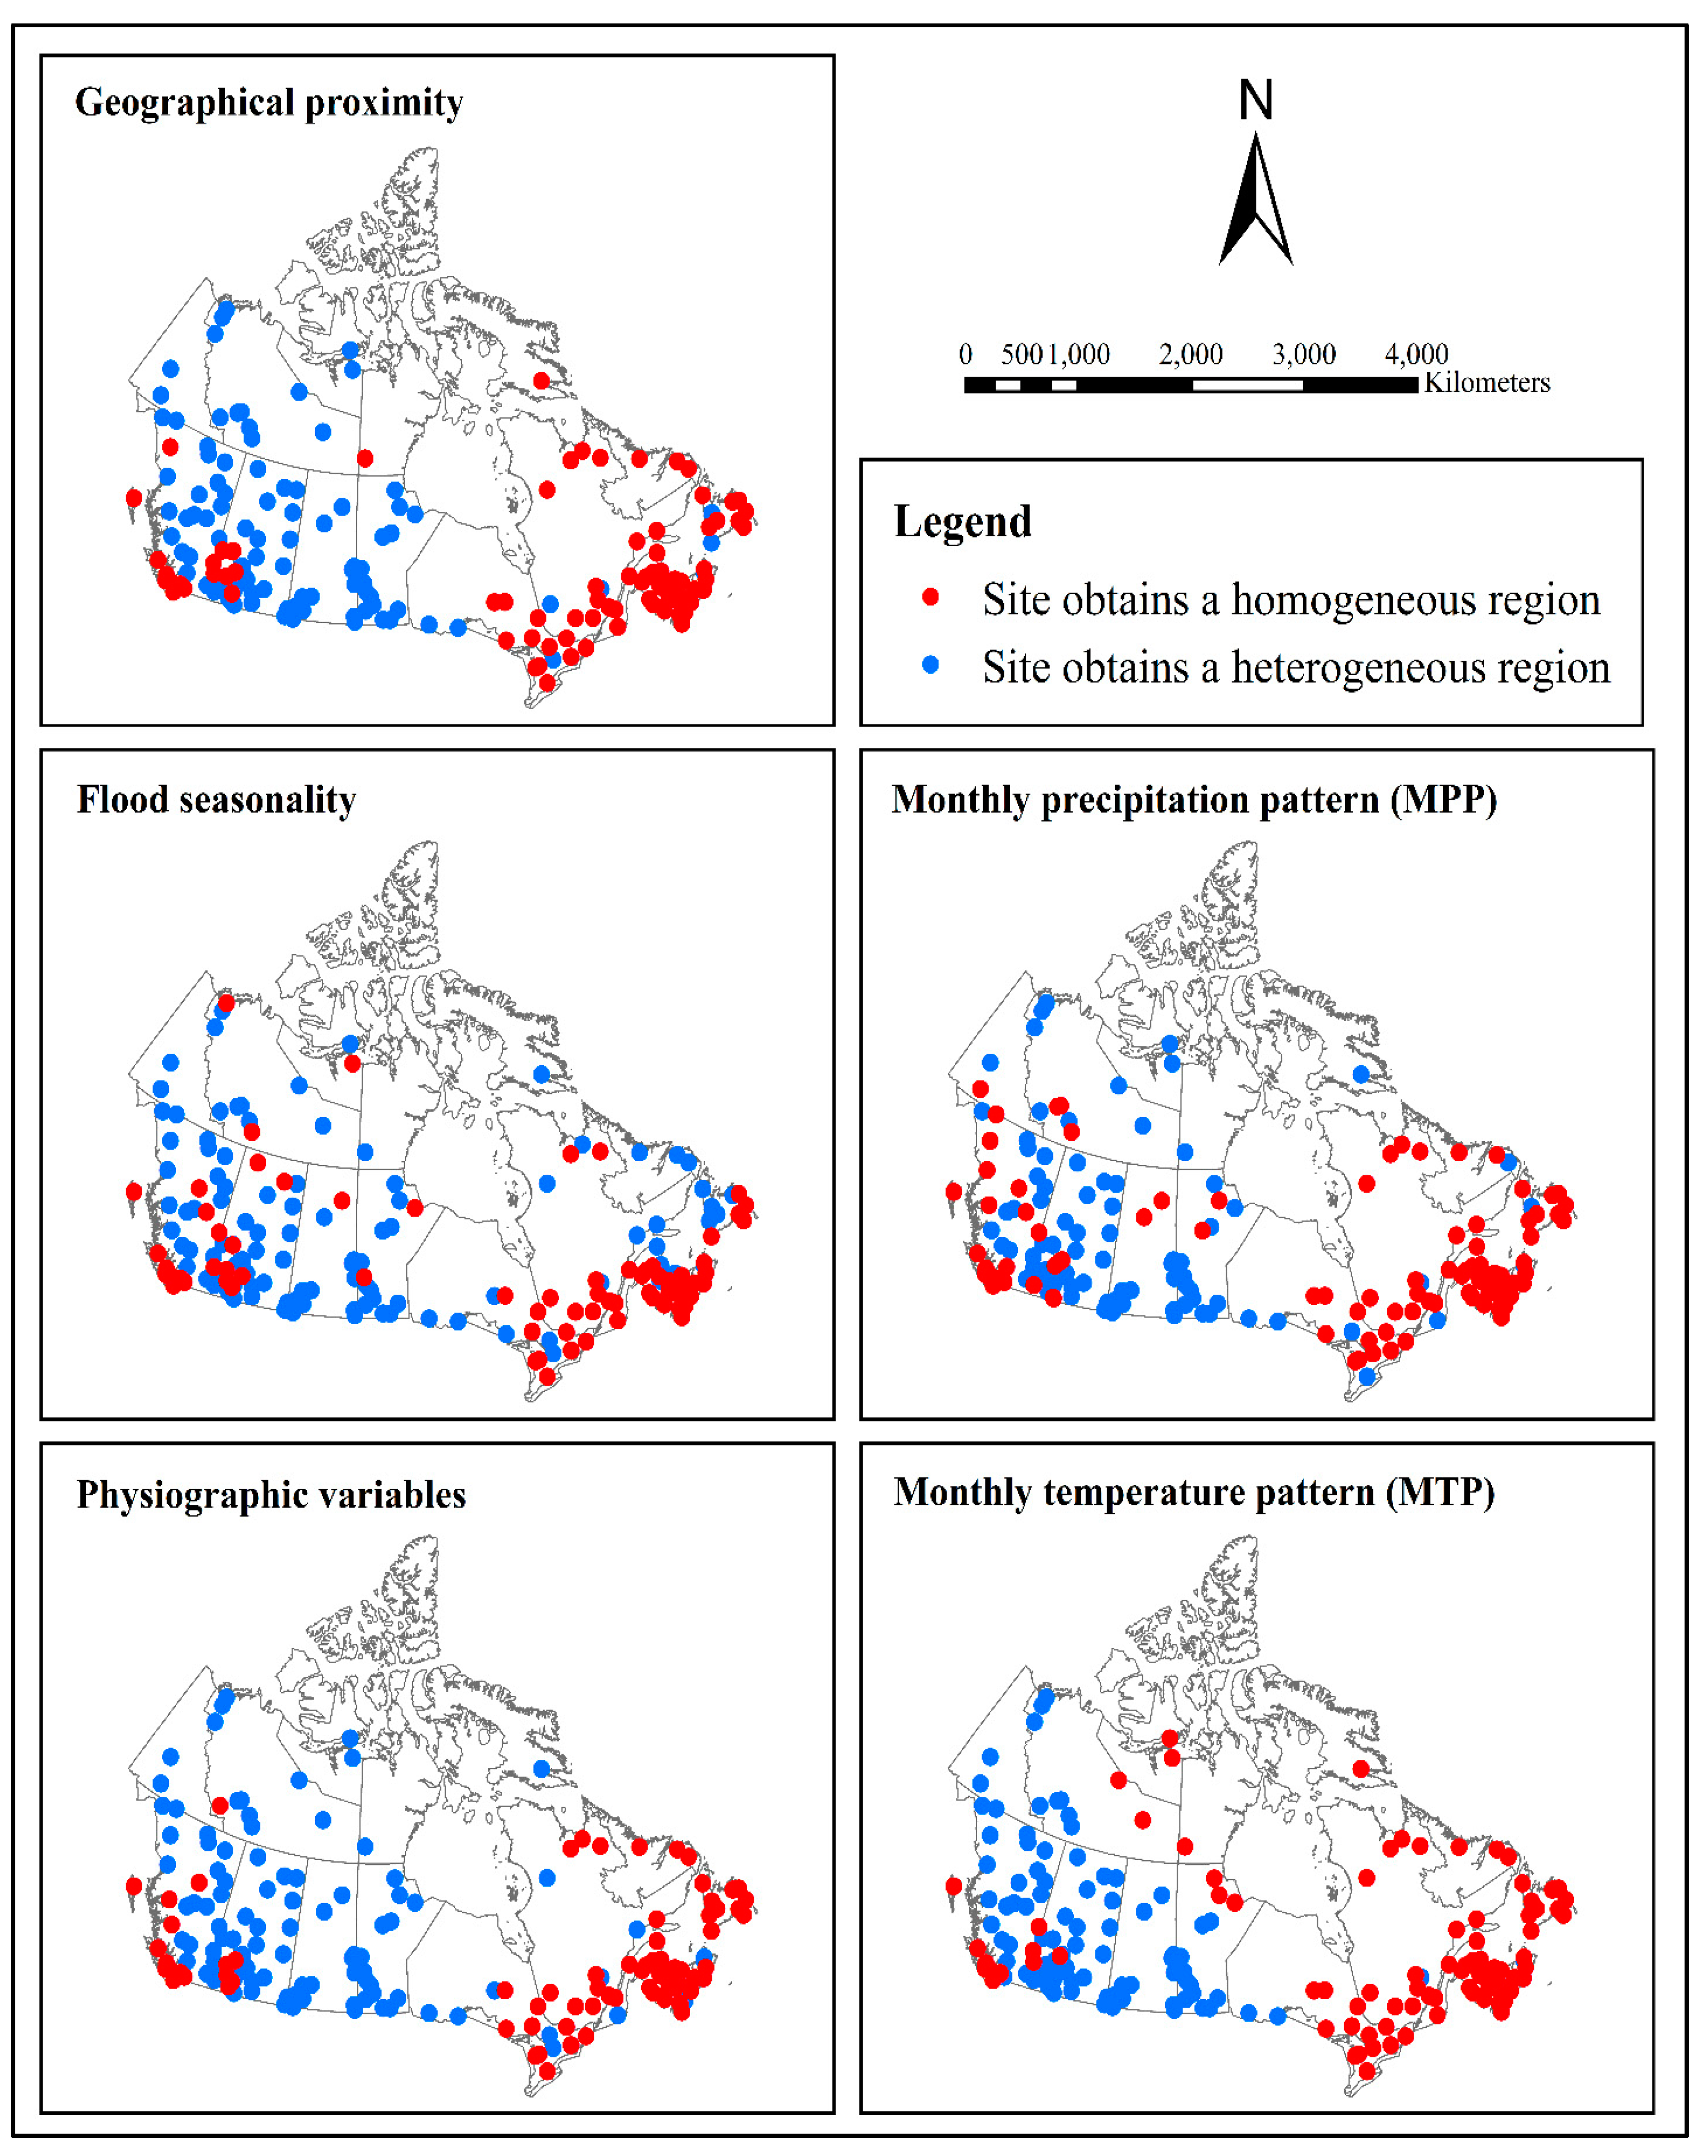
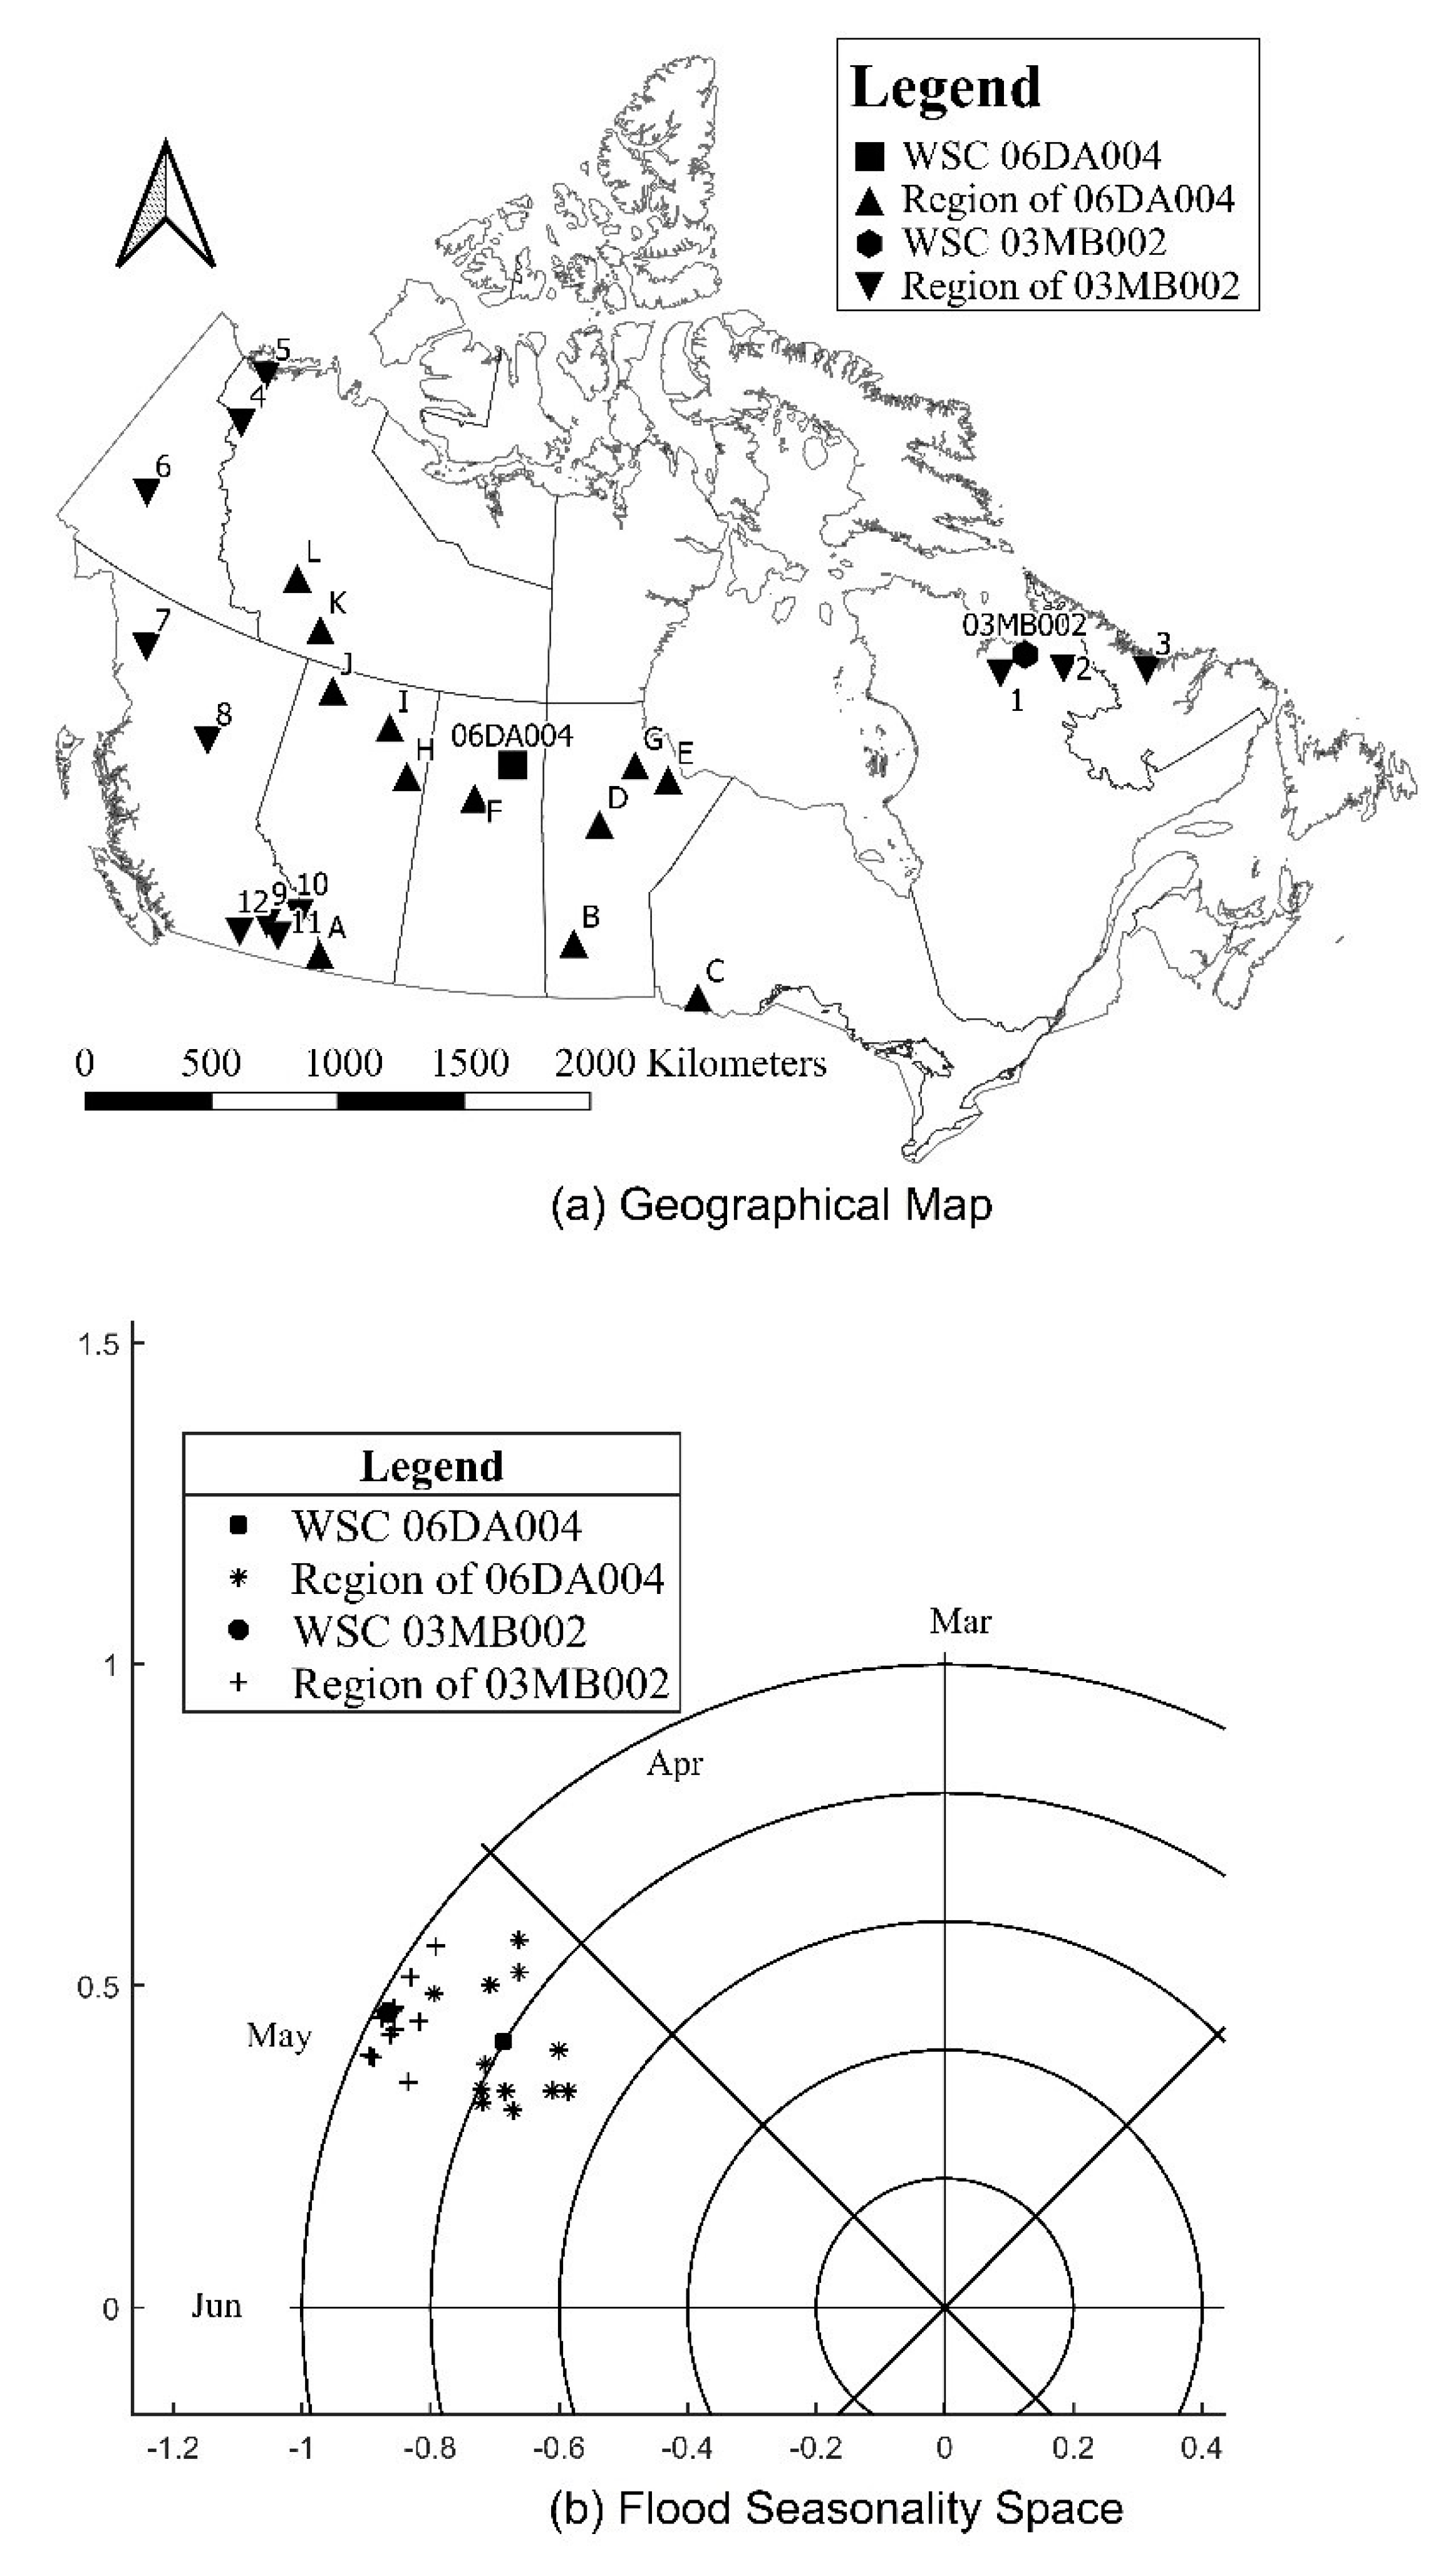
3.2. Identification of Homogeneous Regions
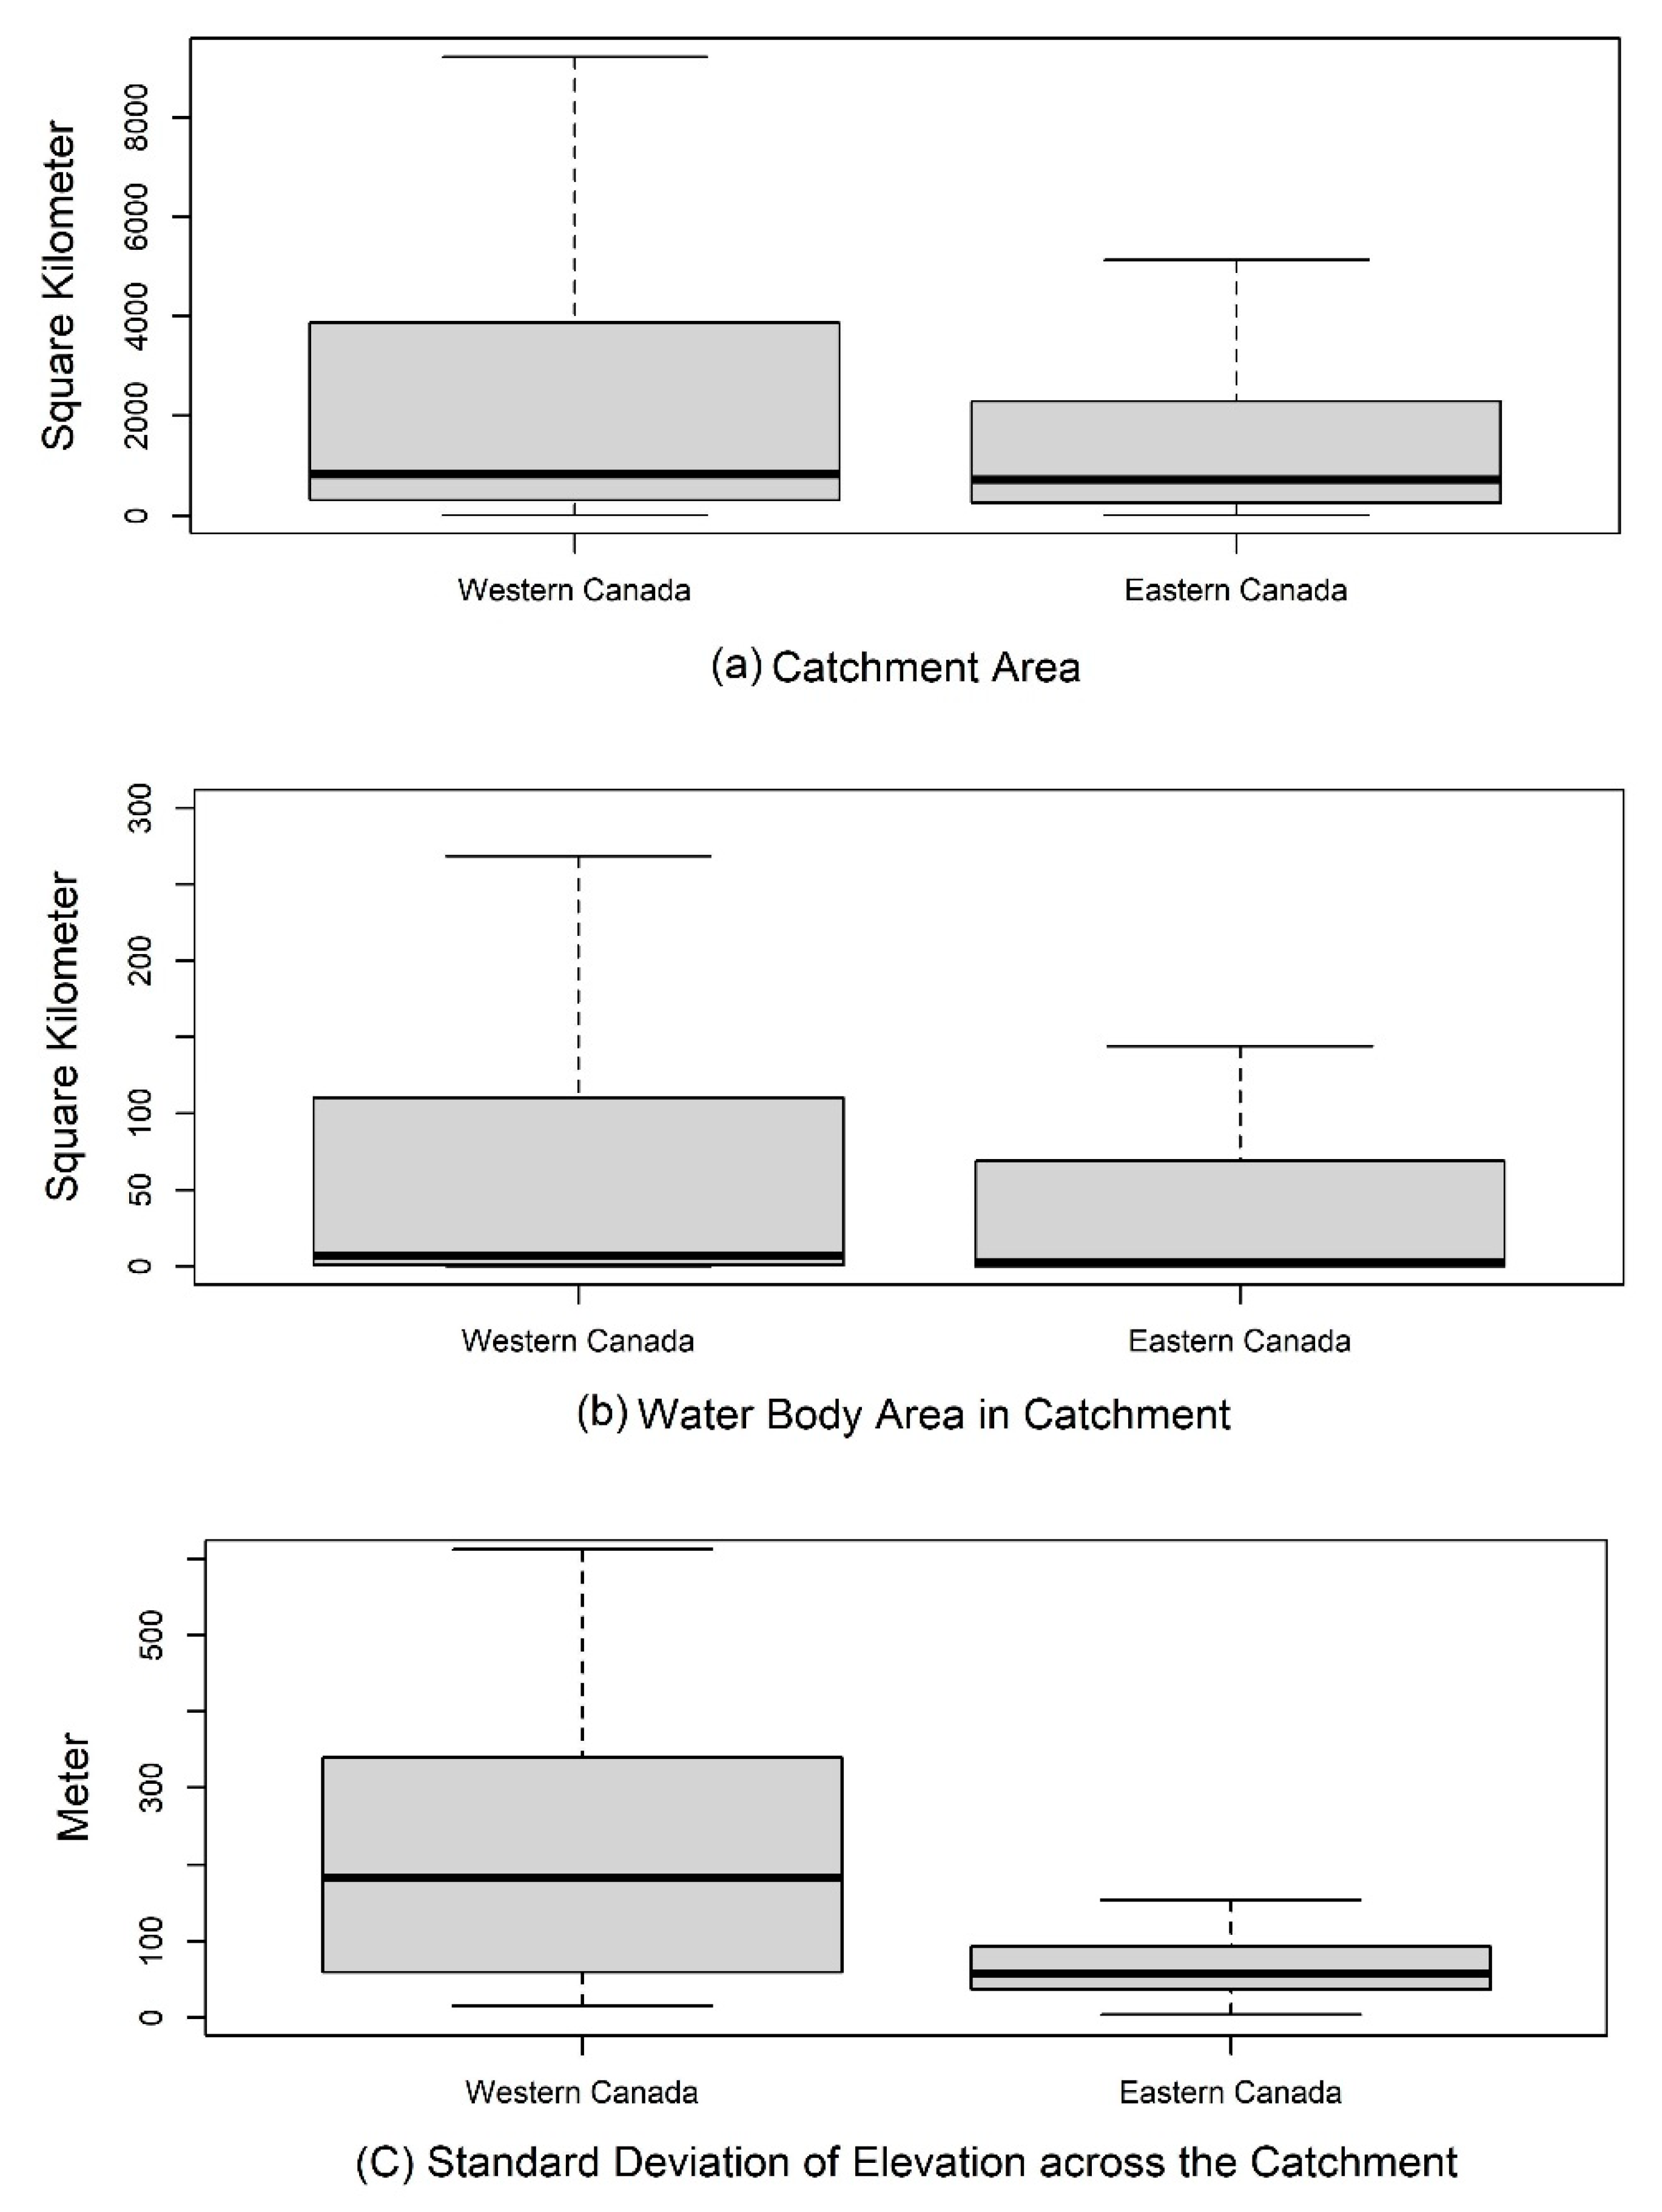
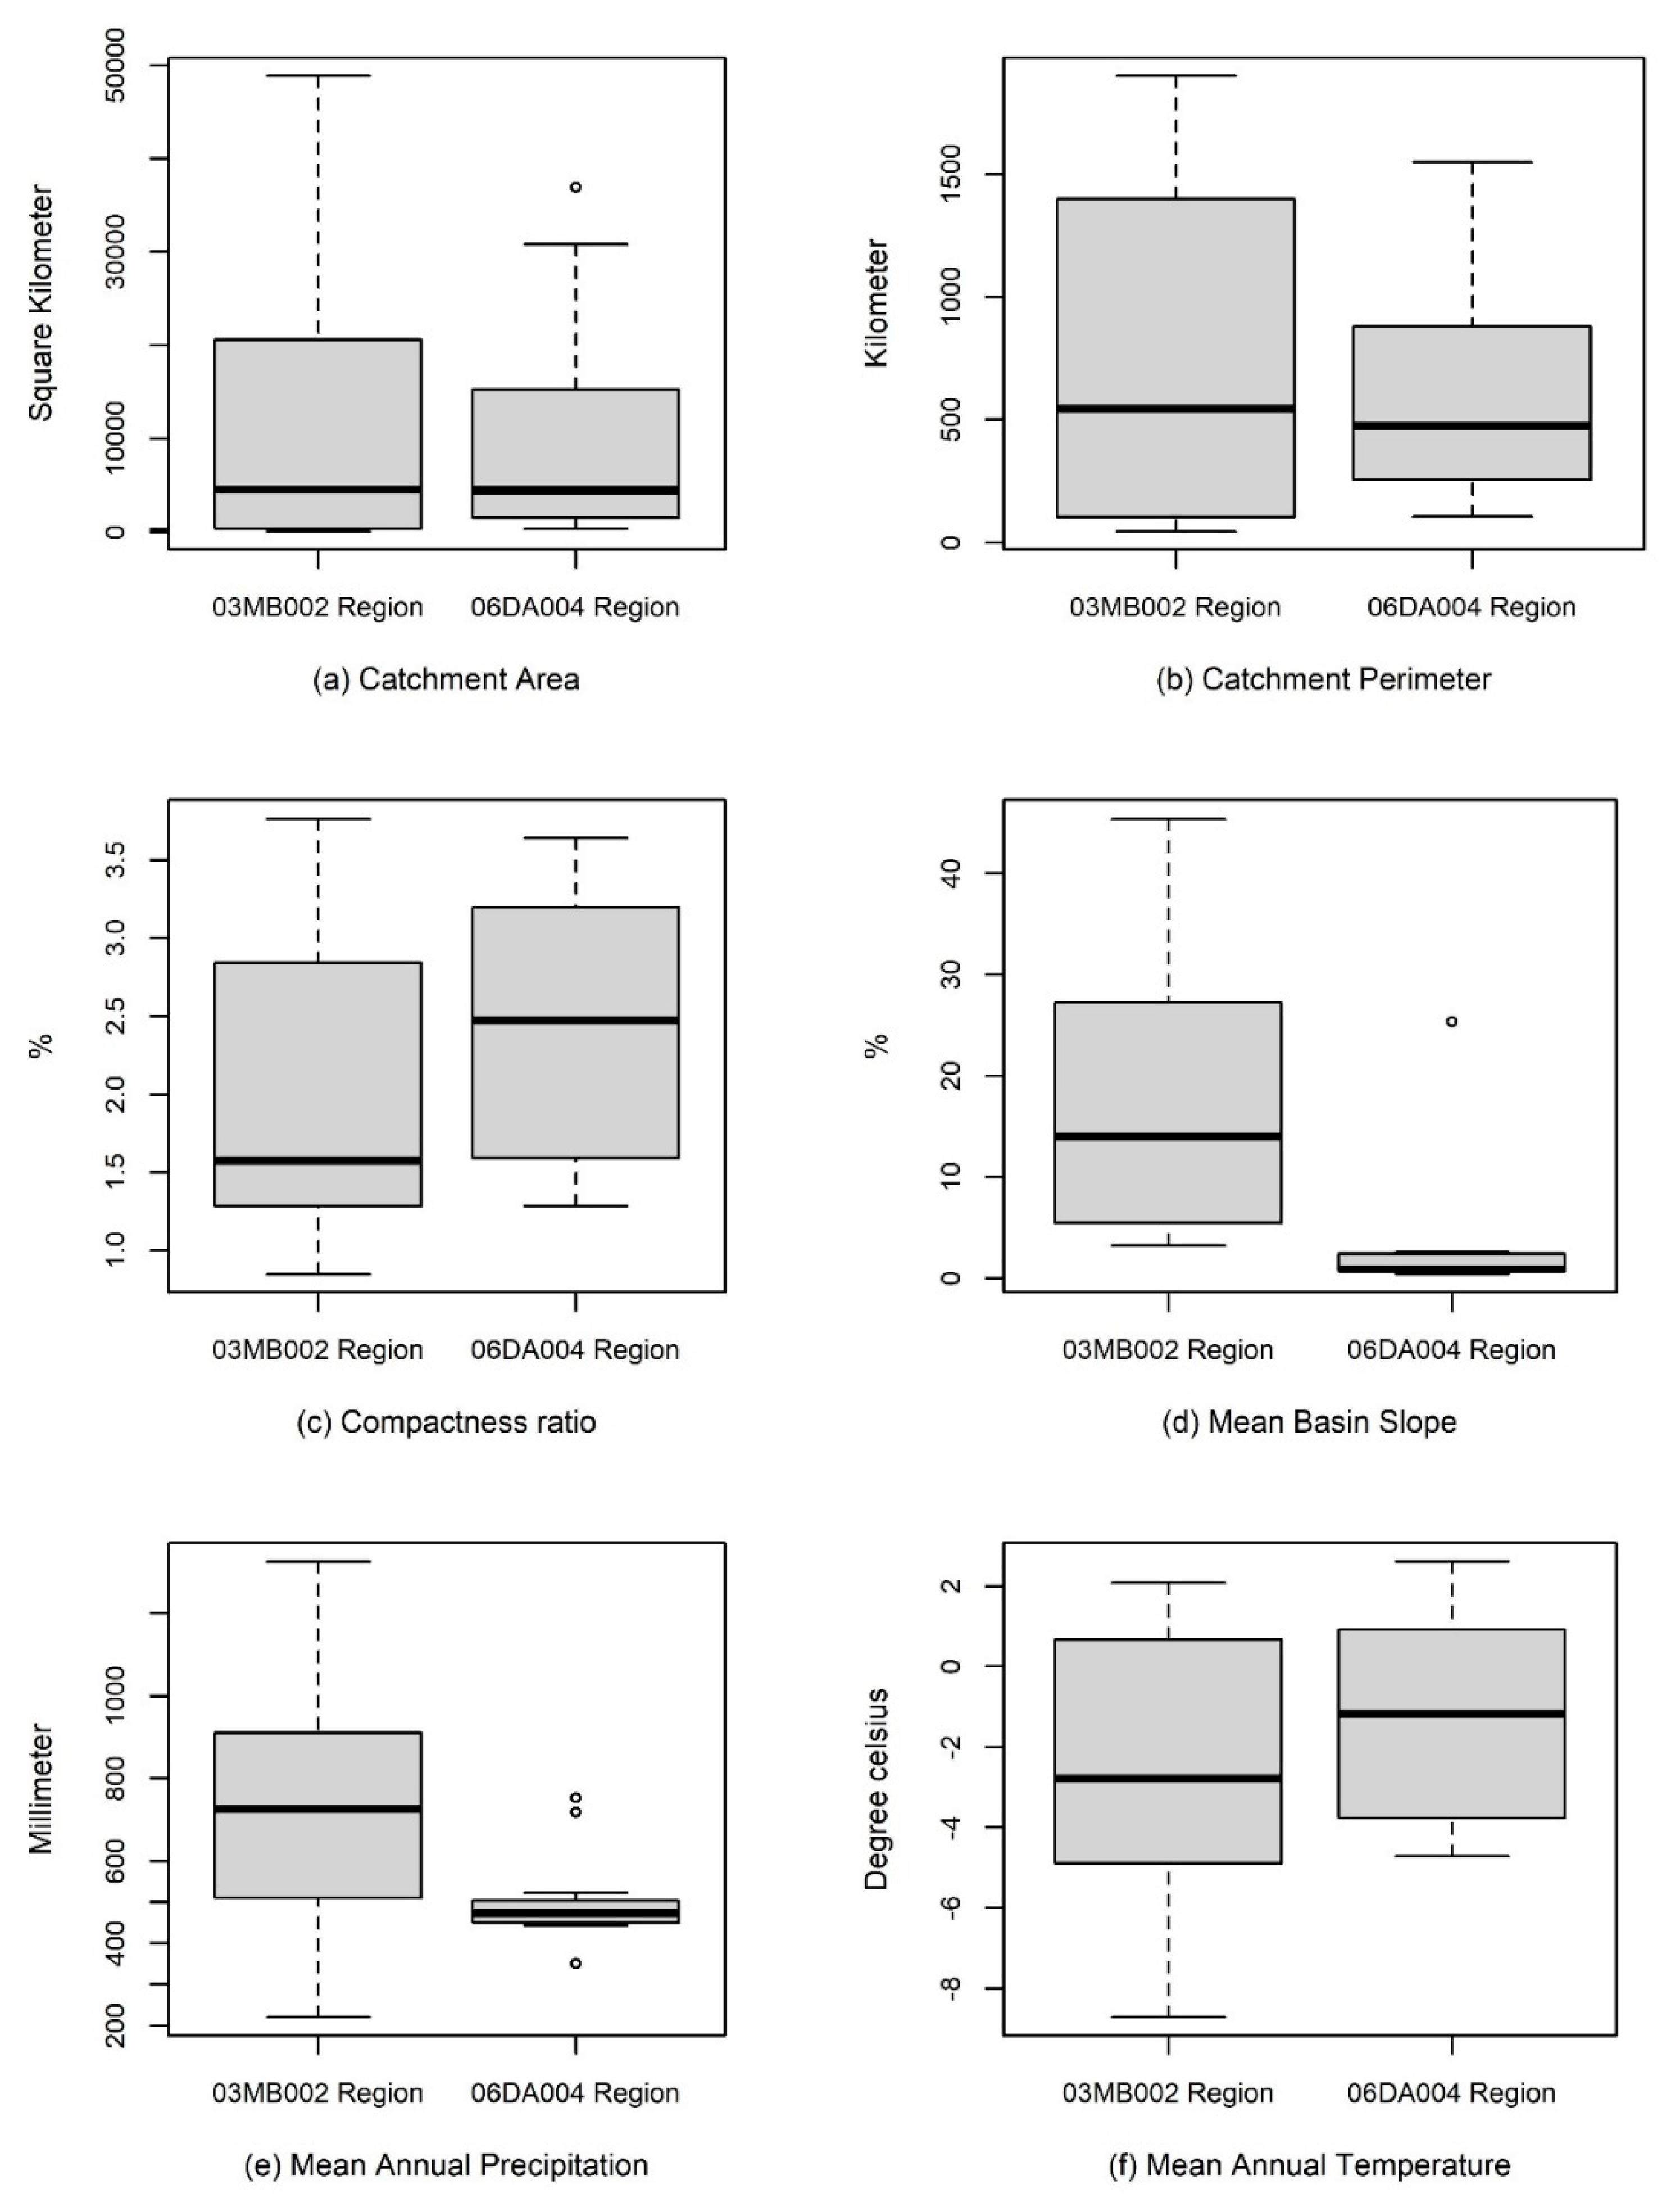
3.3. Analyzing Membership Characteristics
3.4. Predictive Measures for Regional Quantile Estimation
4. Conclusions
Author Contributions
Funding
Acknowledgments
Conflicts of Interest
References
- Salinas, J.L.; Castellarin, A.; Viglione, A.; Kohnová, S.; Kjeldsen, T.R. Regional parent flood frequency distributions in Europe—Part 1: Is the GEV model suitable as a pan-European parent? Hydrol. Earth Syst. Sci. 2014, 18, 4381–4389. [Google Scholar] [CrossRef]
- Salinas, J.L.; Castellarin, A.; Kohnová, S.; Kjeldsen, T.R. Regional parent flood frequency distributions in Europe—Part 2: Climate and scale controls. Hydrol. Earth Syst. Sci. 2014, 18, 4391–4401. [Google Scholar] [CrossRef]
- Ball, J.; Babister, M.; Nathan, R.; Weeks, W.; Weinmann, E.; Retallick, M.; Testoni, I. Australian Rainfall and Runoff: A Guide to Flood Estimation; Commonwealth of Australia (Geoscience Australia): Barton, Australia, 2016.
- Robson, A.; Reed, D. Statistical Procedures for Flood Frequency Estimation, Flood Estimation Handbook, Vol. 3; Centre for Ecology & Hydrology: Wallingford, UK, 1999. [Google Scholar]
- England, J.F., Jr.; Cohn, T.A.; Faber, B.A.; Stedinger, J.R.; Thomas, W.O., Jr.; Veilleux, A.G.; Kiang, J.E.; Mason, R.R., Jr. Guidelines for determining flood flow frequency–Bulletin 17C. In U.S. Geological Survey Techniques and Methods, Book 4, Chap. B; U.S. Geological Survey: Reston, VA, USA, 2018. [Google Scholar]
- Public Safety Canada Canadian Disaster Database. Available online: https://www.publicsafety.gc.ca/cnt/rsrcs/cndn-dsstr-dtbs/index-en.aspx (accessed on 13 November 2019).
- Blöschl, G.; Bierkens, M.F.P.; Chambel, A.; Cudennec, C.; Destouni, G.; Fiori, A.; Kirchner, J.W.; McDonnell, J.J.; Savenije, H.H.G.; Sivapalan, M.; et al. Twenty-three unsolved problems in hydrology (UPH)—A community perspective. Hydrol. Sci. J. 2019, 64, 1141–1158. [Google Scholar] [CrossRef]
- Watt, W.E. Hydrology of Floods in Canada—A Guide to Planning and Design-NRC Publications Archive-National Research Council Canada; National Research Council Canada, Associate Committee on Hydrology: Ottawa, ON, Canada, 1989; ISBN 06660128764. [Google Scholar]
- Moudrak, N.; Feltmate, B. Preventing Disaster before it Strikes: Developing a Canadian Standard for New Flood-Resilient Residential Communities; Intact Centre on Climate Adaptation, University of Waterloo: Waterloo, ON, Canada, 2017. [Google Scholar]
- Water Survey of Canada Environment Canada Data Explorer-HYDAT Database 2020. Available online: https://www.canada.ca/en/environment-climate-change/services/water-overview/quantity/monitoring/survey/data-products-services/explorer.html (accessed on 16 December 2018).
- GREHYS. Presentation and review of some methods for regional flood frequency analysis. J. Hydrol. 1996, 186, 63–84. [Google Scholar] [CrossRef]
- Burn, D.H.; Goel, N.K. The formation of groups for regional flood frequency analysis. Hydrol. Sci. J. 2000, 45, 97–112. [Google Scholar] [CrossRef]
- Wallis, J.R.; Wood, E.F. Relative accuracy of log Pearson III procedures. J. Hydraul. Eng. 1985, 111, 1043–1056. [Google Scholar] [CrossRef]
- Potter, K.W.; Lettenmaier, D.P. A comparison of regional flood frequency estimation methods using a resampling method. Water Resour. Res. 1990, 26, 415–424. [Google Scholar] [CrossRef]
- Stedinger, J.R.; Lu, L.H. Appraisal of regional and index flood quantile estimators. Stoch. Hydrol. Hydraul. 1995, 9, 49–75. [Google Scholar] [CrossRef]
- Hosking, J.R.M.; Wallis, J.R. Regional Frequency Analysis—An Approach Based on L-Moments; Cambridge University Press: Cambridge, UK, 1997; ISBN 0521019400. [Google Scholar]
- Yang, T.; Xu, C.-Y.; Shao, Q.-X.; Chen, X. Regional flood frequency and spatial patterns analysis in the Pearl River Delta region using L-Moments approach. Stoch. Environ. Res. Risk Assess. 2010, 24, 165–182. [Google Scholar] [CrossRef]
- Jingyi, Z.; Hall, M.J. Regional flood frequency analysis for the Gan-Ming River basin in China. J. Hydrol. 2004, 296, 98–117. [Google Scholar] [CrossRef]
- Merz, R.; Blöschl, G. Flood frequency regionalisation - spatial proximity vs. catchment attributes. J. Hydrol. 2005, 302, 283–306. [Google Scholar] [CrossRef]
- Mediero, L.; Kjeldsen, T.R.; Macdonald, N.; Kohnova, S.; Merz, B.; Vorogushyn, S.; Wilson, D.; Alburquerque, T.; Blöschl, G.; Bogdanowicz, E.; et al. Identification of coherent flood regions across Europe by using the longest streamflow records. J. Hydrol. 2015, 528, 341–360. [Google Scholar] [CrossRef]
- Wazneh, H.; Chebana, F.; Ouarda, T.B.M.J. Identification of hydrological neighborhoods for regional flood frequency analysis using statistical depth function. Adv. Water Resour. 2016, 94, 251–263. [Google Scholar] [CrossRef]
- Zadeh, S.M.; Burn, D.H. A super region approach to improve pooled flood frequency analysis. Can. Water Resour. J. 2019, 44, 146–159. [Google Scholar] [CrossRef]
- Durocher, M.; Burn, D.H.; Mostofi Zadeh, S. A nationwide regional flood frequency analysis at ungauged sites using ROI/GLS with copulas and super regions. J. Hydrol. 2018, 567, 191–202. [Google Scholar] [CrossRef]
- Durocher, M.; Burn, D.H.; Mostofi Zadeh, S.; Ashkar, F. Estimating flood quantiles at ungauged sites using nonparametric regression methods with spatial components. Hydrol. Sci. J. 2019, 64, 1056–1070. [Google Scholar] [CrossRef]
- U.S. Water Resources Council. Guidelines for Determining Flood Flow Frequency, Bulletin 17B; Hydrology Committee: Reston, VA, USA, 1982. [Google Scholar]
- Muhammad, A.; Evenson, G.R.; Stadnyk, T.A.; Boluwade, A.; Jha, S.K.; Coulibaly, P. Assessing the importance of potholes in the Canadian Prairie Region under future climate change scenarios. Water 2018, 10, 1657. [Google Scholar] [CrossRef]
- Whitfield, P.H.; Shook, K.R.; Pomeroy, J.W. Spatial patterns of temporal changes in Canadian Prairie streamflow using an alternative trend assessment approach. J. Hydrol. 2020, 582, 124541. [Google Scholar] [CrossRef]
- Burn, D.H. Delineation of groups for regional flood frequency analysis. J. Hydrol. 1988, 104, 345–364. [Google Scholar] [CrossRef]
- Burn, D.H. Cluster analysis as applied to regional flood frequency. J. Water Resouces Plan. Manag. 1989, 115, 567–582. [Google Scholar] [CrossRef]
- Zrinji, Z.; Burn, D.H. Regional flood frequency with hierarchical region of influence. J. Water Resour. Plan. Manag. 1996, 122, 245. [Google Scholar] [CrossRef]
- Sandrock, G.; Viraraghavan, T.; Fuller, G.A. Estimation of peak flows for natural ungauged watersheds in southern saskatchewan. Can. Water Resour. J. 1992, 17, 21–31. [Google Scholar] [CrossRef]
- Ouarda, T.; Girard, C.; Cavadias, G.S.; Bobee, B. Regional flood frequency estimation with canonical correlation analysis. J. Hydrol. 2001, 254, 157–173. [Google Scholar] [CrossRef]
- El-Jabi, N.; Caissie, D.; Turkkan, N. Flood analysis and flood projections under climate change in New Brunswick. Can. Water Resour. J. 2016, 41, 319–330. [Google Scholar] [CrossRef]
- Faulkner, D.; Warren, S.; Burn, D. Design floods for all of Canada. Can. Water Resour. J. 2016, 41, 398–411. [Google Scholar] [CrossRef]
- Sandink, D.; Kovacs, P.; Oulahen, G.; McGillivray, G. Making Flood Insurable for Canadian Homeowners: A Discussion Paper; Institute for Catastrophic Loss Reduction & Swiss Reinsurance Company Ltd.: Toronto, ON, Canada, 2010. [Google Scholar]
- Zahmatkesh, Z.; Jha, S.K.; Coulibaly, P.; Stadnyk, T. An overview of river flood forecasting procedures in Canadian watersheds. Can. Water Resour. J. 2019, 44, 213–229. [Google Scholar] [CrossRef]
- Aucoin, F.; Caissie, D.; El-Jabi, N.; Turkkan, N. Flood Frequency Analyses for New Brunswick Rivers; Fisheries and Oceans Canada: Moncton, NB, Canada, 2011.
- FloodNet Floodnet–NSERC Network–Enhanced Flood Forecasting and Management Capacity in Canada. Available online: https://www.nsercfloodnet.ca/ (accessed on 11 March 2020).
- Zhang, Z.; Stadnyk, T.A.; Burn, D.H. Identification of a preferred statistical distribution for at-site flood frequency analysis in Canada. Can. Water Resour. J./Rev. Can. Ressour. Hydr. 2020, 45, 43–58. [Google Scholar] [CrossRef]
- Ashkar, F.; El Adlouni, S.E. Adjusting for small-sample non-normality of design event estimators under a generalized Pareto distribution. J. Hydrol. 2015, 530, 384–391. [Google Scholar] [CrossRef]
- Ashkar, F.; Ba, I. Selection between the generalized Pareto and kappa distributions in peaks-over-threshold hydrological frequency modelling. Hydrol. Sci. J. 2017, 62, 1167–1180. [Google Scholar] [CrossRef]
- Durocher, M.; Zadeh, S.M.; Burn, D.H.; Ashkar, F. Comparison of automatic procedures for selecting flood peaks over threshold based on goodness-of-fit tests. Hydrol. Process. 2018, 32, 2874–2887. [Google Scholar] [CrossRef]
- Durocher, M.; Burn, D.H.; Ashkar, F. Comparison of Estimation Methods for a Nonstationary Index-Flood Model in Flood Frequency Analysis Using Peaks Over Threshold. Water Resour. Res. 2019, 55, 9398–9416. [Google Scholar] [CrossRef]
- Mostofi Zadeh, S.; Durocher, M.; Burn, D.H.; Ashkar, F. Pooled flood frequency analysis: A comparison based on peaks-over-threshold and annual maximum series. Hydrol. Sci. J. 2019, 64, 121–136. [Google Scholar] [CrossRef]
- Burn, D.H. An appraisal of the “region of influence” approach to flood frequency analysis. Hydrol. Sci. J. 1990, 35, 149–165. [Google Scholar] [CrossRef]
- Burn, D.H. Evaluation of regional flood frequency analysis with a region of influence approach. Water Resour. Res. 1990, 26, 2257–2265. [Google Scholar] [CrossRef]
- Burn, D.H.; Whitfield, P.H. Changes in floods and flood regimes in Canada. Can. Water Resour. J. 2016, 41, 139–150. [Google Scholar] [CrossRef]
- Burn, D.H.; Whitfield, P.H.; Sharif, M. Identification of changes in floods and flood regimes in Canada using a peaks over threshold approach. Hydrol. Process. 2016, 30, 3303–3314. [Google Scholar] [CrossRef]
- Burn, D.H. Catchment similarity for regional flood frequency analysis using seasonality measures. J. Hydrol. 1997, 202, 212–230. [Google Scholar] [CrossRef]
- Burn, D.H.; Zrinji, Z.; Kowalchuk, M. Regionalization of catchments for regional flood frequency analysis. J. Hydrol. Eng. 1997, 2, 76–82. [Google Scholar] [CrossRef]
- Klyszejko, E. (Environment and Climate Change Canada, Ottawa, Canada). Personal communication, 2016.
- McKenney, D.W.; Pedlar, J.H.; Papadopol, P.; Hutchinson, M.F. The development of 1901-2000 historical monthly climate models for Canada and the United States. Agric. For. Meteorol. 2006, 138, 69–81. [Google Scholar] [CrossRef]
- Historical Monthly Climate Grids for North America. Natural Resources Canada. Available online: https://cfs.nrcan.gc.ca/projects/3/3 (accessed on 22 April 2019).
- Buttle, J.M.; Allen, D.M.; Caissie, D.; Davison, B.; Hayashi, M.; Peters, D.L.; Pomeroy, J.W.; Simonovic, S.; St-Hilaire, A.; Whitfield, P.H. Flood processes in Canada: Regional and special aspects. Can. Water Resour. J. 2016, 41, 7–30. [Google Scholar] [CrossRef]
- Brimley, B.; Cantin, J.F.; Harvey, D.; Kowalchuk, M.; Marsh, P.; Ouarda, T.M.B.J.; Phinney, B.; Pilon, P.; Renouf, M.; Tassone, B.; et al. Establishment of the Reference Hydrometric Basin Network (RHBN) for Canada; Environment Canada: Ottawa, ON, Canada, 1999.
- Whitfield, P.H.; Burn, D.H.; Hannaford, J.; Higgins, H.; Hodgkins, G.A.; Marsh, T.; Looser, U. Reference hydrologic networks I. The status and potential future directions of national reference hydrologic networks for detecting trends. Hydrol. Sci. J. 2012, 57, 1562–1579. [Google Scholar] [CrossRef]
- Nathan, R.J.; McMahon, T.A. Identification of homogeneous regions for the purposes of regionalisation. J. Hydrol. 1990, 121, 217–238. [Google Scholar] [CrossRef]
- Noto, L.V.; Loggia, G. La Use of L-moments approach for regional flood frequency analysis in Sicily, Italy. Water Resour. Manag. 2009, 23, 2207–2229. [Google Scholar] [CrossRef]
- Eslamian, S.S.; Hosseinipour, E.Z. A modified region of influence approach for flood regionalization. In Proceedings of the World Environmental and Water Resources Congress 2010: Challenges of Change, Providence, RI, USA, 16–20 May 2010; pp. 2388–2414. [Google Scholar]
- Vogel, R.M.; Fennessey, N.M. L moment diagrams should replace product moment diagrams. Water Resour. Res. 1993, 29, 1745–1752. [Google Scholar] [CrossRef]
- Bobée, B.; Rasmussen, P.F. Recent advances in flood frequency analysis. Rev. Geophys. 1995, 33, 1111–1116. [Google Scholar] [CrossRef]
- Zrinji, Z.; Burn, D.H. Flood frequency analysis for ungauged sites using a region of influence approach. J. Hydrol. 1994, 153, 1–21. [Google Scholar] [CrossRef]
- Atiem, I.A.; Harmancioǧlu, N.B. Assessment of regional floods using L-moments approach: The case of the River Nile. Water Resour. Manag. 2006, 20, 723–747. [Google Scholar] [CrossRef]
- Shook, K.R.; Pomeroy, J.W. Memory effects of depressional storage in Northern Prairie hydrology. Hydrol. Process. 2011, 25, 3890–3898. [Google Scholar] [CrossRef]
- Muhammad, A.; Evenson, G.R.; Stadnyk, T.A.; Boluwade, A.; Jha, S.K.; Coulibaly, P. Impact of model structure on the accuracy of hydrological modeling of a Canadian Prairie watershed. J. Hydrol. Reg. Stud. 2019, 21, 40–56. [Google Scholar] [CrossRef]
- Ehsanzadeh, E.; Spence, C.; van der Kamp, G.; McConkey, B. On the behaviour of dynamic contributing areas and flood frequency curves in North American Prairie watersheds. J. Hydrol. 2012, 414–415, 364–373. [Google Scholar] [CrossRef]
- Prieto, C.; Le Vine, N.; Kavetski, D.; García, E.; Medina, R. Flow Prediction in Ungauged Catchments Using Probabilistic Random Forests Regionalization and New Statistical Adequacy Tests. Water Resour. Res. 2019, 55, 4364–4392. [Google Scholar] [CrossRef]


| Return Period for Comparison | Required Record Length for at-Site Estimate | Number of Sites Available | Station-Years of Record for Regional Estimate |
|---|---|---|---|
| 20 | 40 | 88 | 100 |
| 25 | 50 | 47 | 125 |
| 30 | 60 | 29 | 150 |
| 35 | 70 | 15 | 175 |
| 40 | 80 | 14 | 200 |
| 45 | 90 | 11 | 225 |
| Number of ARRA Iterations | Considered Flood-Related Attributes | Alternative Series (Initial Regions Randomly Formed) | ||||
|---|---|---|---|---|---|---|
| Geographical Proximity | Flood Seasonality | Physiographic Variables | Monthly Precipitation Pattern | Monthly Temperature Pattern | ||
| 0 | 10 | 6 | 5 | 6 | 10 | 0 |
| 1 | 26 | 22 | 17 | 23 | 21 | 1 |
| 2 | 49 | 43 | 35 | 50 | 54 | 9 |
| 3 | 70 | 50 | 52 | 69 | 80 | 22 |
| 4 | 83 | 66 | 69 | 82 | 88 | 43 |
| 5 | 89 | 78 | 83 | 99 | 94 | 63 |
| 6 | 97 | 98 | 97 | 110 | 97 | 74 |
| 7 | 106 | 110 | 104 | 118 | 105 | 98 |
| 8 | 106 | 116 | 106 | 120 | 109 | 112 |
| WSC ID | Flood Region of | Province | Map ID | Catchment Area (km2) | Catchment Perimeter (km) | Compactness Ratio (Area/Perimeter2) (%) | Mean Basin Slope (%) | Mean Annual Precipitation (mm) | Mean Annual Temperature (°C) |
|---|---|---|---|---|---|---|---|---|---|
| 03MB002 | Target Site | QC | Target Site | 29,124 | 1417 | 1.5 | 2.6 | 732.3 | −4.6 |
| 03KC004 | 03MB002 | QC | 1 | 39,371 | 1901 | 1.1 | 3.3 | 654.9 | −5.4 |
| 03MD001 | 03MB002 | QC | 2 | 22,440 | 1627 | 0.8 | 3.5 | 815.2 | −4.4 |
| 03NF001 | 03MB002 | NL | 3 | 7322 | 780.6 | 1.2 | 8.2 | 881.0 | −3.8 |
| 10LA002 | 03MB002 | NT | 4 | 18,746 | 1173 | 1.4 | 18.1 | 385.9 | −6.6 |
| 10ND002 | 03MB002 | NT | 5 | 65 | 44.4 | 3.3 | 3.5 | 220.0 | −8.7 |
| 09BC001 | 03MB002 | YT | 6 | 48,867 | 1752 | 1.6 | 15.9 | 456.5 | −3.9 |
| 08CD001 | 03MB002 | BC | 7 | 3555 | 488.9 | 1.5 | 7.4 | 562.1 | −1.8 |
| 07EC002 | 03MB002 | BC | 8 | 5559 | 597.8 | 1.6 | 23.2 | 648.7 | 0.2 |
| 08NE006 | 03MB002 | BC | 9 | 330 | 103.3 | 3.1 | 45.4 | 1326 | 1.4 |
| 08NF001 | 03MB002 | BC | 10 | 416 | 105.1 | 3.8 | 31.3 | 796.1 | 0.0 |
| 08NH005 | 03MB002 | BC | 11 | 442 | 130.5 | 2.6 | 44.5 | 1218 | 1.2 |
| 08NN015 | 03MB002 | BC | 12 | 233 | 100.3 | 2.3 | 12.1 | 941.7 | 2.1 |
| 06DA004 | Target Site | SK | Target Site | 7729 | 684.0 | 1.7 | 2.2 | 506.7 | −2.5 |
| 05AA008 | 06DA004 | AB | A | 403 | 105.2 | 3.6 | 25.4 | 753.2 | 1.9 |
| 05LJ005 | 06DA004 | MB | B | 348 | 115.5 | 2.6 | 2.5 | 522.7 | 1.7 |
| 05PB014 | 06DA004 | ON | C | 4768 | 585.6 | 1.4 | 2.4 | 718.7 | 2.6 |
| 05TG002 | 06DA004 | MB | D | 886 | 157.7 | 3.6 | 0.8 | 449.6 | −1.4 |
| 05UH002 | 06DA004 | MB | E | 2191 | 369.4 | 1.6 | 0.4 | 466.1 | −4.4 |
| 06BD001 | 06DA004 | SK | F | 3670 | 395.8 | 2.3 | 2.6 | 483.4 | −1.5 |
| 06FB002 | 06DA004 | MB | G | 4274 | 355.4 | 3.4 | 0.4 | 478.5 | −4.7 |
| 07CD001 | 06DA004 | AB | H | 30,792 | 1548 | 1.3 | 1.5 | 469.4 | 0.1 |
| 07KE001 | 06DA004 | AB | I | 9856 | 614.0 | 2.6 | 0.7 | 443.1 | −0.3 |
| 07OB003 | 06DA004 | AB | J | 36,901 | 1278 | 2.3 | 0.9 | 450.8 | −0.9 |
| 10FA002 | 06DA004 | NT | K | 9213 | 553.4 | 3.0 | 0.7 | 474.9 | −3.2 |
| 10GB006 | 06DA004 | NT | L | 20,696 | 1146 | 1.6 | 0.9 | 351.3 | −4.6 |
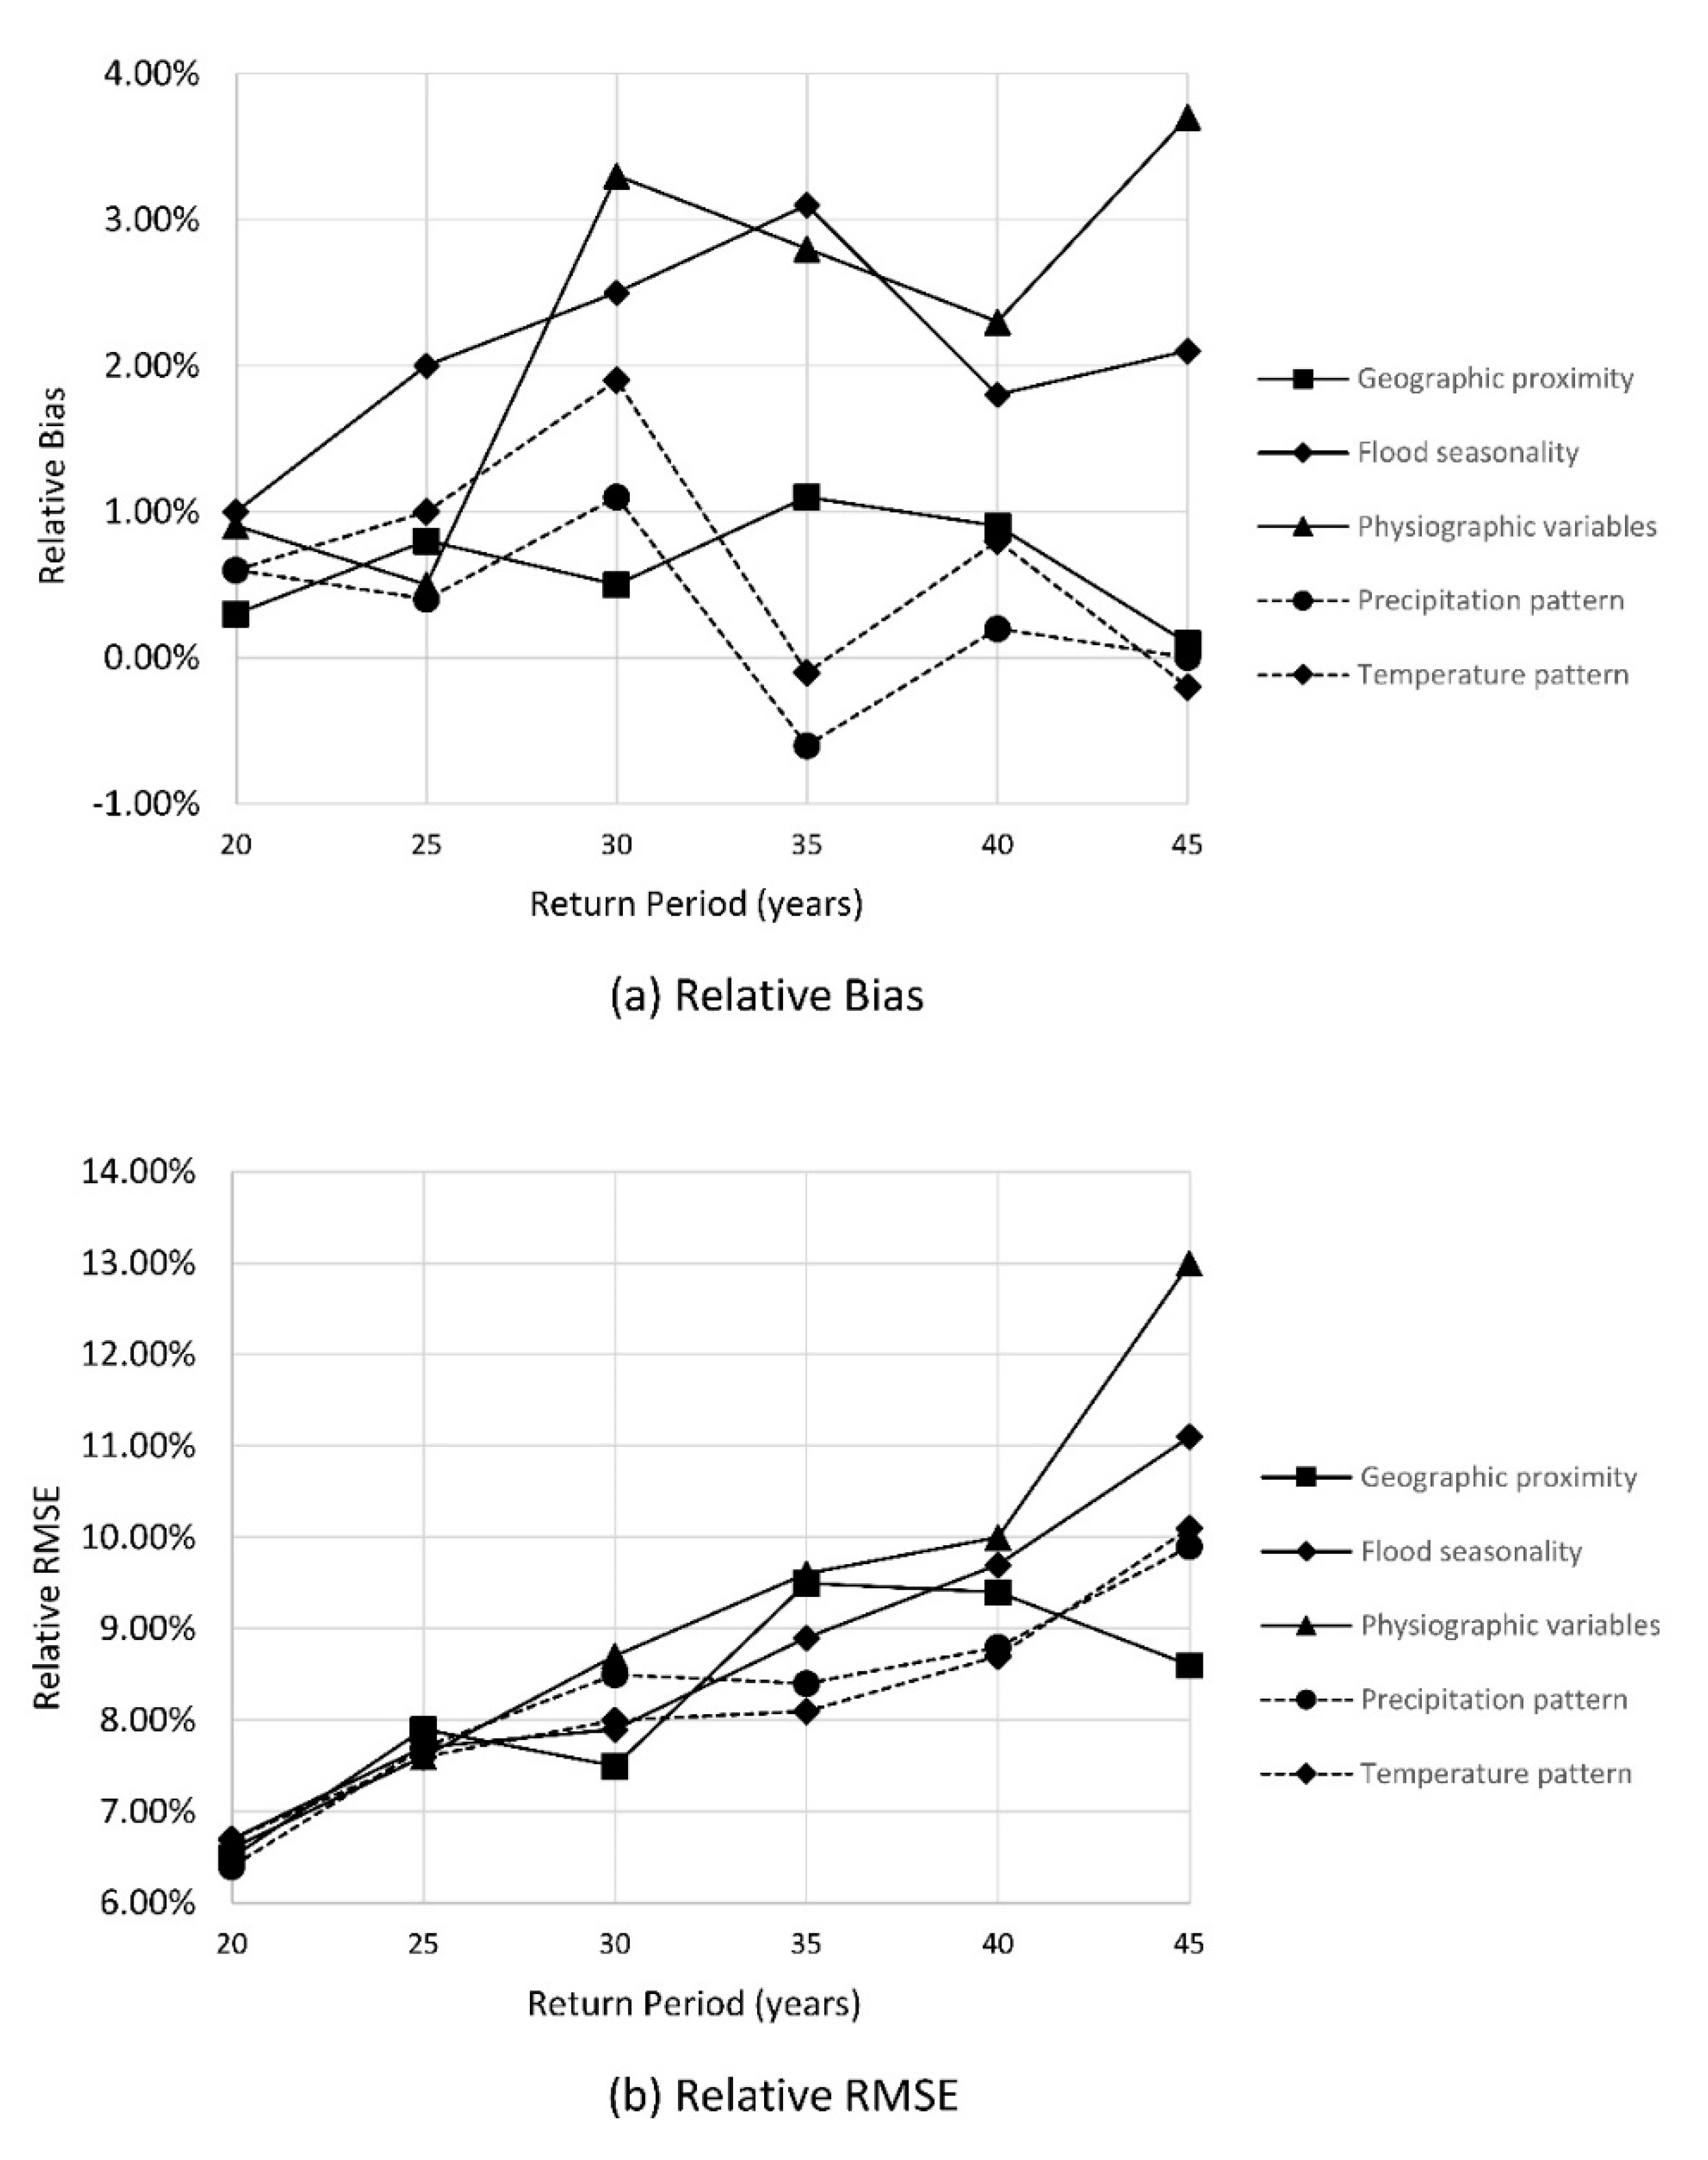
| Statistic | Return Period | Attribute | ||||
|---|---|---|---|---|---|---|
| Geographic Proximity | Flood Seasonality | Physiographic Variables | Precipitation Pattern | Temperature Pattern | ||
| Relative Bias | 20 | 0.3% | 1.0% | 0.9% | 0.6% | 0.6% |
| 25 | 0.8% | 2.0% | 0.5% | 0.4% | 1.0% | |
| 30 | 0.5% | 2.5% | 3.3% | 1.1% | 1.9% | |
| 35 | 1.1% | 3.1% | 2.8% | −0.6% | −0.1% | |
| 40 | 0.9% | 1.8% | 2.3% | 0.2% | 0.8% | |
| 45 | 0.1% | 2.1% | 3.7% | 0.004% | −0.2% | |
| Relative RMSE | 20 | 6.5% | 6.7% | 6.6% | 6.4% | 6.7% |
| 25 | 7.9% | 7.7% | 7.6% | 7.7% | 7.6% | |
| 30 | 7.5% | 7.9% | 8.7% | 8.5% | 8.0% | |
| 35 | 9.5% | 8.9% | 9.6% | 8.4% | 8.1% | |
| 40 | 9.4% | 9.7% | 10.0% | 8.8% | 8.7% | |
| 45 | 8.6% | 11.1% | 13.0% | 9.9% | 10.1% | |
© 2020 by the authors. Licensee MDPI, Basel, Switzerland. This article is an open access article distributed under the terms and conditions of the Creative Commons Attribution (CC BY) license (http://creativecommons.org/licenses/by/4.0/).
Share and Cite
Zhang, Z.; Stadnyk, T.A. Investigation of Attributes for Identifying Homogeneous Flood Regions for Regional Flood Frequency Analysis in Canada. Water 2020, 12, 2570. https://doi.org/10.3390/w12092570
Zhang Z, Stadnyk TA. Investigation of Attributes for Identifying Homogeneous Flood Regions for Regional Flood Frequency Analysis in Canada. Water. 2020; 12(9):2570. https://doi.org/10.3390/w12092570
Chicago/Turabian StyleZhang, Ziyang, and Tricia A. Stadnyk. 2020. "Investigation of Attributes for Identifying Homogeneous Flood Regions for Regional Flood Frequency Analysis in Canada" Water 12, no. 9: 2570. https://doi.org/10.3390/w12092570
APA StyleZhang, Z., & Stadnyk, T. A. (2020). Investigation of Attributes for Identifying Homogeneous Flood Regions for Regional Flood Frequency Analysis in Canada. Water, 12(9), 2570. https://doi.org/10.3390/w12092570