Article

Reactive Silica Traces Manure Spreading in Alluvial Aquifers Affected by Nitrate Contamination: A Case Study in a High Plain of Northern Italy

1
Department of Chemistry, Life Science and Environmental Sustainability, University of Parma, Parco Area Delle Scienze 11/A, 43124 Parma, Italy
2
Marine Science and Technology Center, Klaipeda University, 92294 Klaipeda, Lithuania
3
Institute for Electromagnetic Sensing of the Environment, National Research Council of Italy (CNR-IREA), 20133 Milan, Italy
*
Author to whom correspondence should be addressed.
Water 2020, 12(9), 2511; https://doi.org/10.3390/w12092511
Submission received: 4 August 2020 / Revised: 5 September 2020 / Accepted: 7 September 2020 / Published: 9 September 2020

Abstract

:
In the northern sector of the Po River Plain (Italy), widespread intensive agriculture and animal farming are supported by large amounts of water from Alpine lakes and their emissaries. Flood irrigation and excess fertilization with manure affect both the hydrology and the chemical quality of surface and groundwater, resulting in diffuse nitrogen pollution. However, studies analyzing the mechanisms linking agricultural practices with vertical and horizontal nitrogen paths are scarce in this area. We investigated groundwater quality and quantity in an unconfined, coarse-grained alluvial aquifer adjacent to the Mincio River (a tributary of the Po River), where steep summer gradients of nitrate (NO3) concentrations are reported. The effects of manure on solutes’ vertical transport during precipitation events in fertilized and in control soils were simulated under laboratory conditions. The results show high SiO2 and NO3 leaching in fertilized soils. Similarly, field data are characterized by high SiO2 and NO3 concentrations, with a comparable spatial distribution but a different temporal evolution, suggesting their common origin but different processes affecting their concentrations in the study area. Our results show that SiO2 can be used as a conservative tracer of manure spreading, as it does not undergo biogeochemical processes that significantly alter its concentrations. On the contrary, nitrate displays large short-term variations related to aquifer recharge (i.e., flood irrigation and precipitation). In fact, aquifer recharge may promote immediate solubilization and stimulate nitrification, resulting in high NO3 concentrations up to 95.9 mg/L, exceeding the Water Framework Directive (WFD) thresholds. When recharge ends, anoxic conditions likely establish in the saturated zone, favoring denitrification and resulting in a steep decrease in NO3 concentrations.

1. Introduction

For decades, water pollution has been claiming the attention of scientists and stakeholders all around the world as a growing threat to both the environment and human health [1]. In developing countries, the rising demand for food leads to the expansion and intensification of cropping and animal husbandry [2,3]. As a result, 70% of agricultural land worldwide is committed to livestock production, making it one of the major factors contributing to the environmental challenges from the local to the global scale [4]. Such anthropogenic pressures determine the alteration of nitrogen (N), phosphorous (P) and silica (Si) biogeochemical cycles, leading to eutrophication and the degradation of the chemical and biological quality of the water bodies [5,6,7,8]. In the European Union, two directives have been enacted to protect both superficial and groundwater [9,10]; nonetheless, according to [11], 38% of European water bodies remain under significant pressure from agricultural pollution.
Hydrogeology and freshwater ecology have often worked as detached fields, ignoring that they are naturally interconnected, both from a quantitative and qualitative point of view [12]. Only in recent years have the contribution of hydrogeology in the interpretation of surface water quality issues and the development of successful remediation strategies been explored, e.g., [13,14], and the opportunity of a more collaborative and holistic approach has been understood. Regarding surface water, it is well known that the excessive use of fertilizers in agriculture leads to a nitrogen over-enrichment in water via runoff and leaching [15,16], promoting eutrophication in lakes [17] and coastal waters [18].
In the same way, several agricultural pressures can affect groundwater chemical quality, especially in areas where the aquifer is shallow [19,20]. The copious use of fertilizers, including both synthetic fertilizers and organic manure, has been indicated as the main non-point source of the contamination of groundwater [21,22,23,24]. This is particularly true for nitrate, which is considered to be stored globally in great quantities in the aquifers [25]. At the same time, hydrodynamic alterations are given by the groundwater abstraction from the aquifer for irrigation purposes [26] and the use of surface water for irrigation, causing aquifer recharge [27].
Nitrogen contamination has negative effects on human health when surface and/or groundwater are used to supply drinking water. High concentrations of nitrogen in drinking water can affect human health, leading to diseases such as methemoglobinemia. In addition, nitrate is a precursor in the formation of N-nitroso compounds, most of which are carcinogens and teratogens and may provoke other negative health effects, such as cancer and birth defects [1]. Nowadays, the maximum contaminant level (MCL) for nitrate in drinking water is set to 50 mg/L NO3 in many countries (such as U.S.A., Europe and also recommended by the WHO) and it was initially set to contrast infant methemoglobinemia [28]. However, recent studies pointed out that much lower concentrations of nitrate in drinking water could lead to negative effects on human health. Schullehner et al. [29] found a significantly increased risk of colorectal cancer (CRC) in the Danish population at levels of nitrate in drinking water above 3.87 mg/L, pointing out how the MCL could be too high in some cases.
The Po Plain is an alluvial plain in Northern Italy which represents a good example of an area with agricultural pressures, for both surface and groundwater, characterized by deep hydrological and land use alterations, with areas identified as vulnerable to nitrate pollution [30,31,32]. Several authors analyzed the groundwater and surface water pressures in various regions of the Po Plain and at various (temporal and spatial) scales, using different approaches [33,34,35] (e.g., surface and groundwater physico-chemical parameters, isotopes and soil system budgets), some of which are reported below. At the watershed scale, Soana et al. [36] found that livestock manure and synthetic fertilizers contribute 85% of the total nitrogen input in the soil system budget of the Lower Oglio River Watershed (nearby the Mincio River). In addition, the N surplus accounts for 40,056 t N year−1, of which only 34% is exported by the basin. Concerning groundwater, Martinelli et al. [37] found that at the Po plain scale, the shallow aquifer in alluvial fans of the Alpine and Apennine foothills host the most impacted spots, due to intensive agricultural activities and high soil permeability. Their isotopic analyses revealed significant correlations between δ15N and pig densities, pointing out that manure represents one of the main sources of NO3 contamination in groundwater in this region. The Lombardy region (north-center part of the plain), represents an interesting study case, due to the intensive agricultural production and irrigation practices. Here, since the middle ages, agricultural activities have been supported by a capillary network of irrigation channels [38], leading to a deep modification of the natural hydrological cycle, due to the enormous amount of water deflected from the Northern Alpine lakes and their emissaries. Moreover, several articles where soil system budgets have been calculated at the watershed level report a large and widespread nutrient surplus [36,39,40]. These articles postulate a mechanism linking fertilizer surpluses with river quality in specific river sectors, mediated by large water-demanding irrigation techniques and precipitation, favored by the permeability of soils [41,42,43]. However, such a mechanism is hypothesized but not verified through a rigorous approach, including the hydrogeological characterization of specific portions of the watershed and specific river sectors.
This work aims to fill this gap, providing scientific support to the nitrate contamination of groundwater postulated in previous works [39]. For this purpose, a novel approach combining hydrogeology and freshwater ecology has been used. Hydrogeological investigations based on in situ monitoring of a series of wells and laboratory tests focusing on soil biogeochemical processes were carried out to enable a deeper understanding of the mechanisms leading to groundwater contamination.
Our intent in this work is to investigate how manure fertilization can alter the groundwater’s physico-chemical parameters in the study area, with special attention paid to NO3 and SiO2. As the proposed combined approach is novel, the main focus deals with the mechanisms driving nitrogen and silica vertical and horizontal mobility rather than the numerical quantification of contamination, which will be better investigated in the near future. We coupled the seasonal monitoring of groundwater chemistry with laboratory simulations of solutes leaching from fertilized soils, reproducing the in situ conditions as much as possible. Apart from inorganic nitrogen, we also focused on reactive dissolved silica due to discrepancies between the soil system mass budgets of this element and its loads in surface waters [37]. In particular, the latter indicates much higher concentrations than those expected from mass budgets, suggesting overlooked Si release from fertilizers.
We hypothesized that both high SiO2 and NO3 concentrations in groundwater can be related to manure spreading. We also hypothesized that groundwater chemistry depends upon the aquifer recharge rate. In particular, during flood irrigation or abundant precipitation, high recharge rates occur with oxic water, favoring the large conversion of organic nitrogen into soluble nitrate via coupled ammonification and nitrification and the vertical transport of large solutes, including reactive silica. After the recharge phase, water saturation and redox changes may promote the loss of nitrate, whereas the concentrations of other solutes may remain unaltered.

2. Materials and Methods
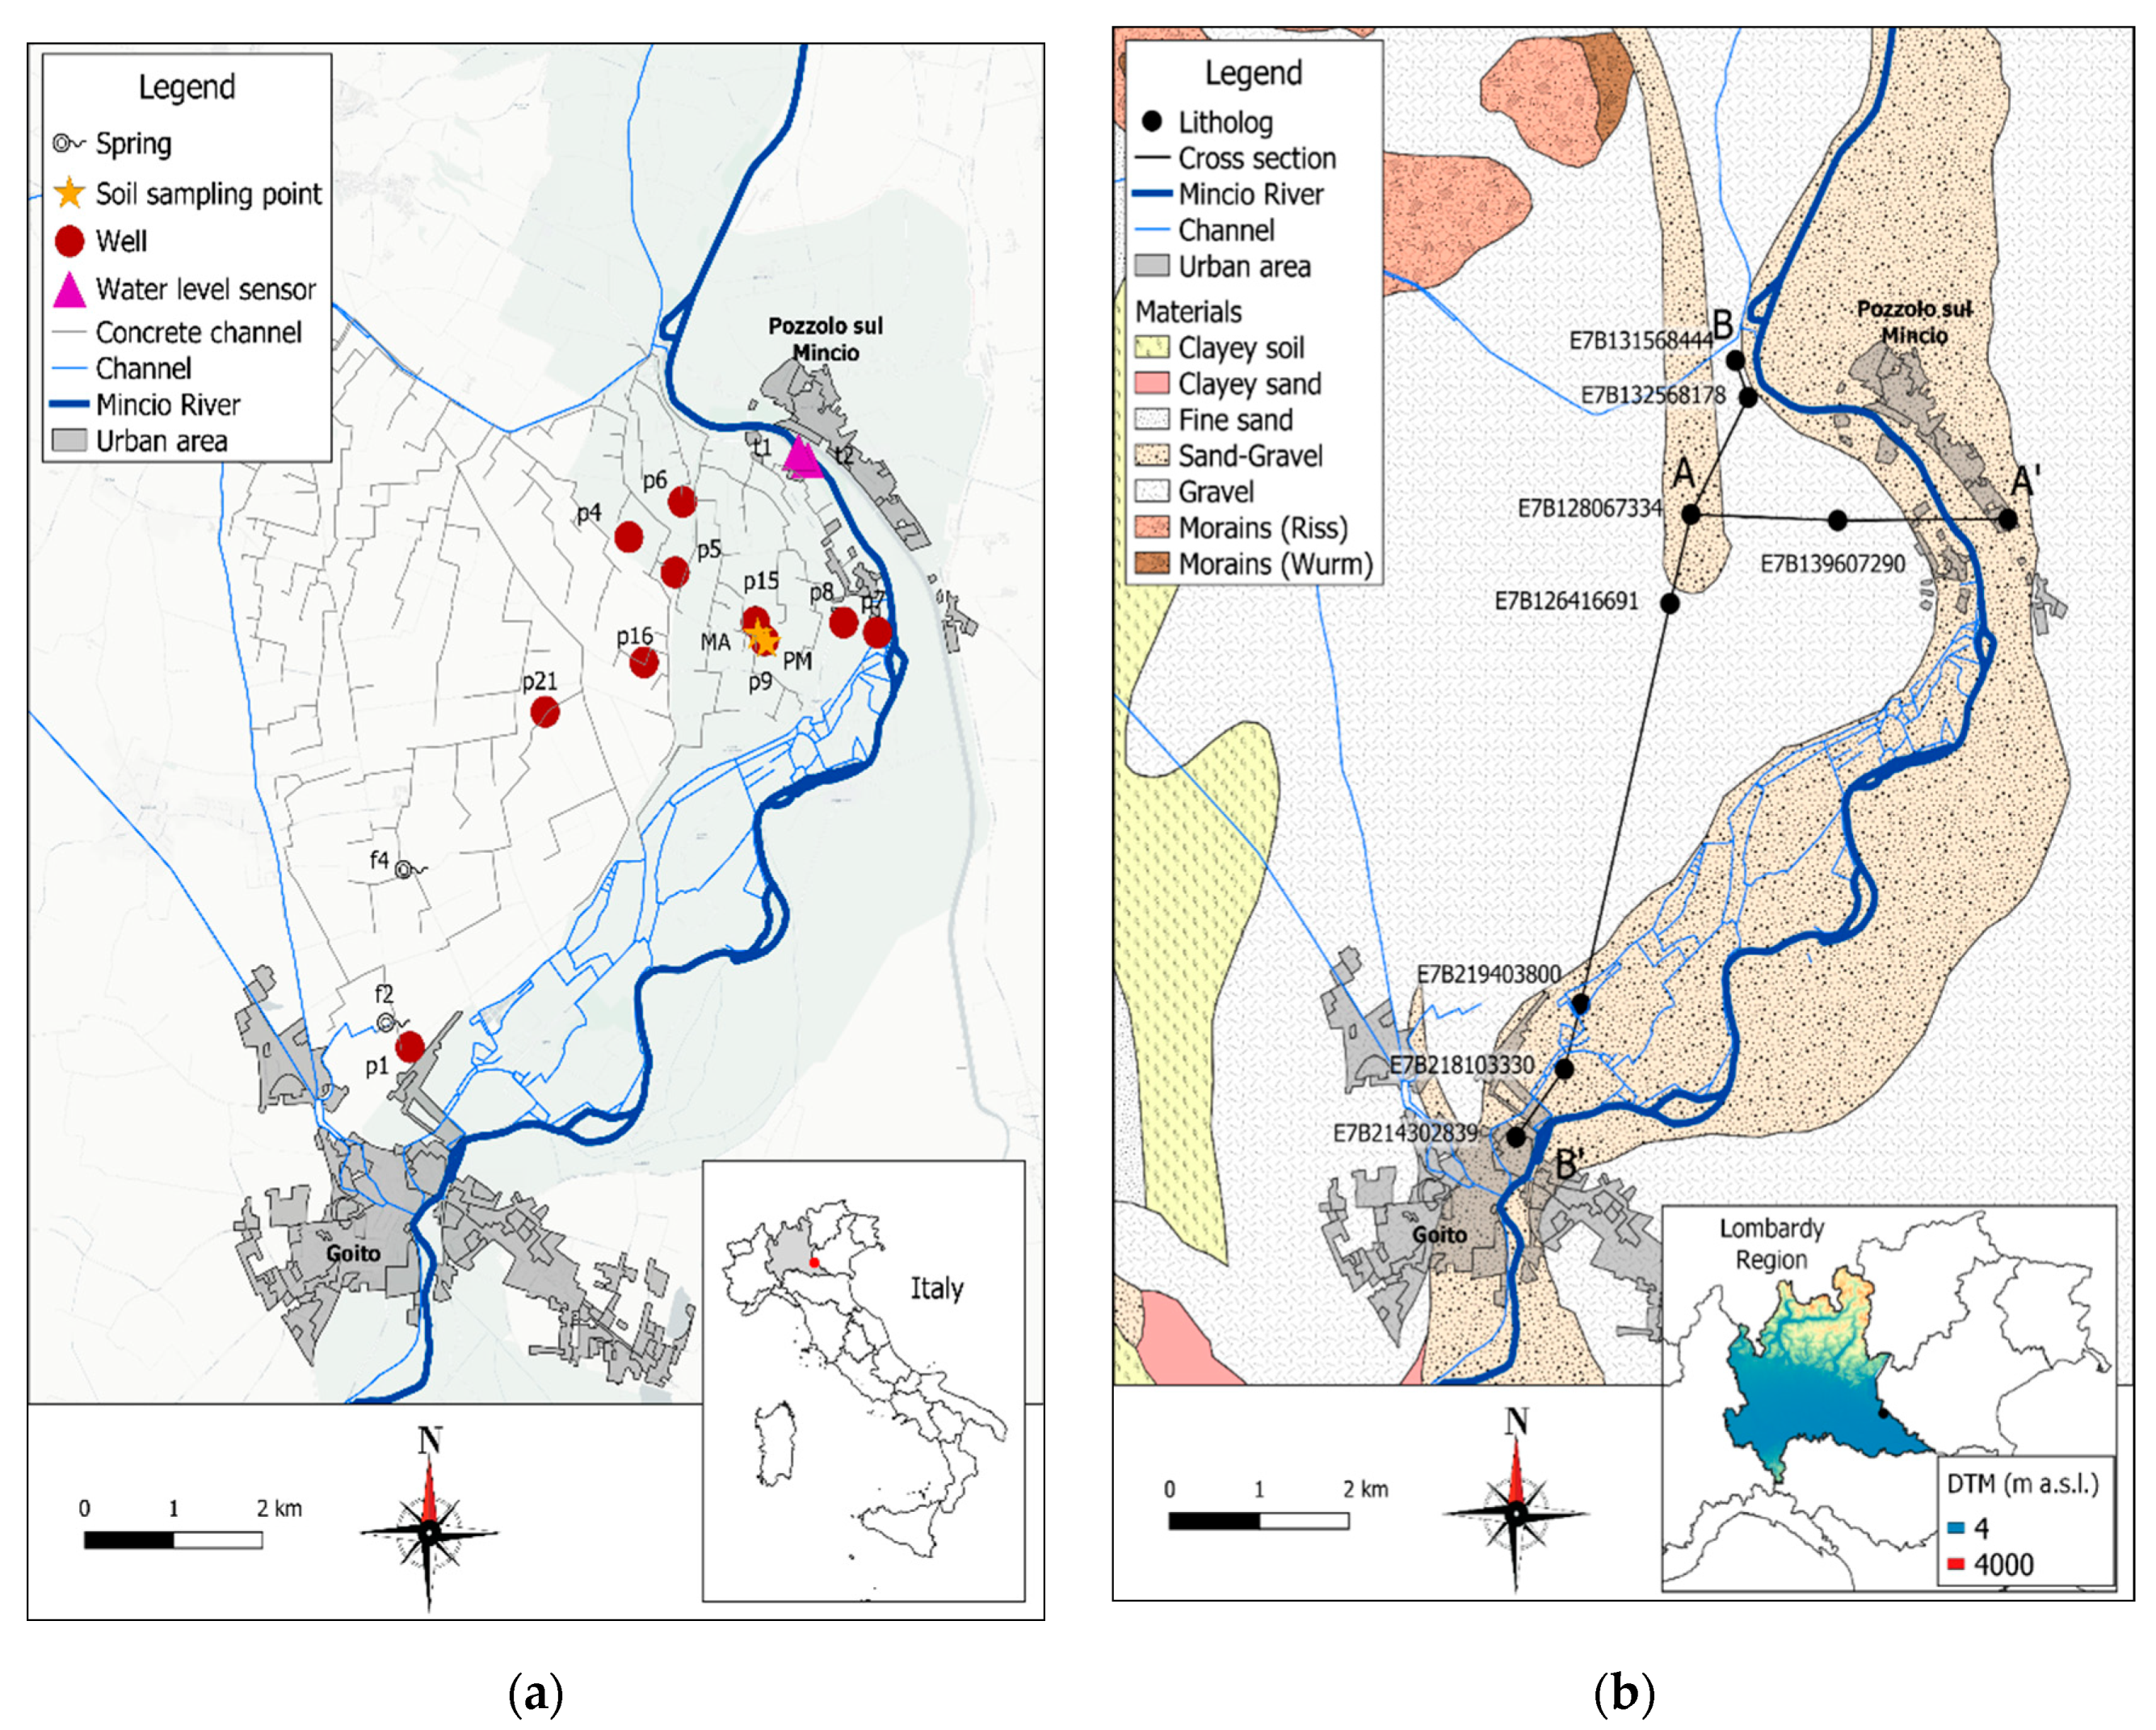
2.1. Study Area

The experimental site (Figure 1a) lies on the right bank of the Mincio River, between the villages of Pozzolo sul Mincio and Goito (Mantua province, Lombardy).
The Mincio River is a 75-km-long river originating from Lake Garda and flowing to the Po River. From a geological point of view (Figure 1b), the Po plain is characterized by an extended multilayer aquifer made up of middle–upper Quaternary succession sediments of the Po Basin [44]. Generally, the shallow aquifer is unconfined, unlike the deeper aquifers which are semiconfined or confined [37]. On the regional scale, the aquifer is made of alluvial plain deposits characterized by a cyclic architecture of fluvial-channel facies (made of gravel and sand) and overbank facies (made of silts and clays) [44], which act as aquitards or aquicludes from the local to the regional scale [45]. From a geomorphological perspective, the area is characterized by the Po plain’s main level [46] dissected by the Mincio River, whose erosive process formed four orders of fluvial terraces [45] and which now flows in Holocene deposits [47]. The Po plain is also characterized by several springs (the so-called fontanili), that are small, semi-artificial, aquatic ecosystem sensu [48]. In the study area, several fontanili have been found, generally exploited by farmers for irrigation purposes.
The hydrological regime of the Mincio River is controlled by a dam immediately downstream from Lake Garda and another one just upstream of Pozzolo sul Mincio village. These dams regulate the river flow according to the irrigation needs of the surrounding agricultural area during the irrigation period, which starts before the end of April and ends within September. As a consequence, the Mincio River has a higher discharge during the irrigation period [39]. The dams, together with several weirs, provide water for the bountiful network of irrigation channels, reaching 173 linear km in the study area and including both natural (e.g., with vegetated banks and bottom sediments) and artificial ones (e.g., made of concrete). The Mincio River basin is characterized by intensive agriculture (Figure 2) and livestock farming. The Utilized Agricultural Area covers ~70% of the watershed (850 km2), where the main cultivated crops are maize (30%), feed crops (27%), wheat (11%) and permanent grassland (9%) [49]. The livestock farming accounts for 136 × 103 cattle and 483 × 103 swine, whose manure, together with synthetic fertilizers, is used in the Mincio River basin to improve crop production [39]. In the Mantua area, manure is usually applied in autumn, when the volumetric capacity of the slurry tank is usually reached, forcing farmers to spread it [50].
The climate of the study area is humid and subtropical (Cfa) [51], according to the Köppen classification [52]. The climatic data from the Goito meteorological station of the Regional Environmental Protection Agency of Lombardy (ARPA Lombardy, https://www.arpalombardia.it/Pages/Meteorologia/Richiesta-dati-misurati.aspx) show that the mean annual temperature is 14.2 °C, while the mean annual precipitation is 765.2 mm year−1. The precipitation is higher in spring (197.6 mm) and autumn (248 mm) than in summer (157.1 mm) and winter (162.5 mm), according to data from the period 2005–2020.

2.2. Hydrogeological Characterization

The geological model of the study area was reconstructed through 20 lithological logs of boreholes from the Lombardy region dataset [53]. The hydraulic heads were measured monthly, from May to December 2019, in ten wells screened within the shallow unconfined aquifer. The heads were measured through a water level meter to reconstruct the groundwater flow net and analyze the effect of irrigation on groundwater dynamics. Hourly based precipitation data in the study area were downloaded from the Goito meteorological station (ARPA Lombardy). Well altitudes (m a.s.l.) were obtained from the national Lidar dataset (±15 cm altimetric accuracy and ±30 cm planimetric accuracy) and compared to the Regional Technical Map (CTR; 1:10,000 scale). The Mincio River stages were measured with two radar water level sensors from the Interregional Agency for the Po River (AIPo), located upstream and downstream of the Pozzolo dam. Data from these two sensors were integrated in the phreatic surface reconstruction.

2.3. Sampling and Physico-Chemical Analyses

During the monthly hydraulic head measurement campaigns (from May 2019 to December 2019), groundwater samples in wells were taken using a bailer sampler (starting from July 2019 to December 2019), while the two springs were directly sampled using a 1-L polyethylene bottle. For every sample, water was collected using 1 L polyethylene bottles, where electrical conductivity (EC), pH and temperature were measured using a multi-parameter probe (HI9829 HANNA Instruments, Woonsocket, RI, USA). Water samples were then filtered with a 0.7-μm pore size glass fiber paper filter and stored in a refrigerated case until analyses, which were carried out within 24 h from collection. Water samples for ion analyses were further filtered with a 0.2-μm pore size glass fiber paper filter. For silica, filtration through glass fiber filters may remove colloidal fractions, resulting in the underestimation of the water silica pool; this may also result in silica release from the filters. The latter was tested and was not significant. Filtered water samples for dissolved reactive silica determination were stored in 50-mL polyethylene bottles. For the analyses of ions, 20 mL plastic vials were used and then the samples for cations were acidified with 2M HNO3 to avoid metal precipitation [54]. In the laboratory, anions and cations were analyzed by ion chromatography (883 Basic IC plus Metrohm, Herisau, Switzerland) and silica was determined by spectrophotometry with the same method explained in the laboratory tests (see the next paragraph).

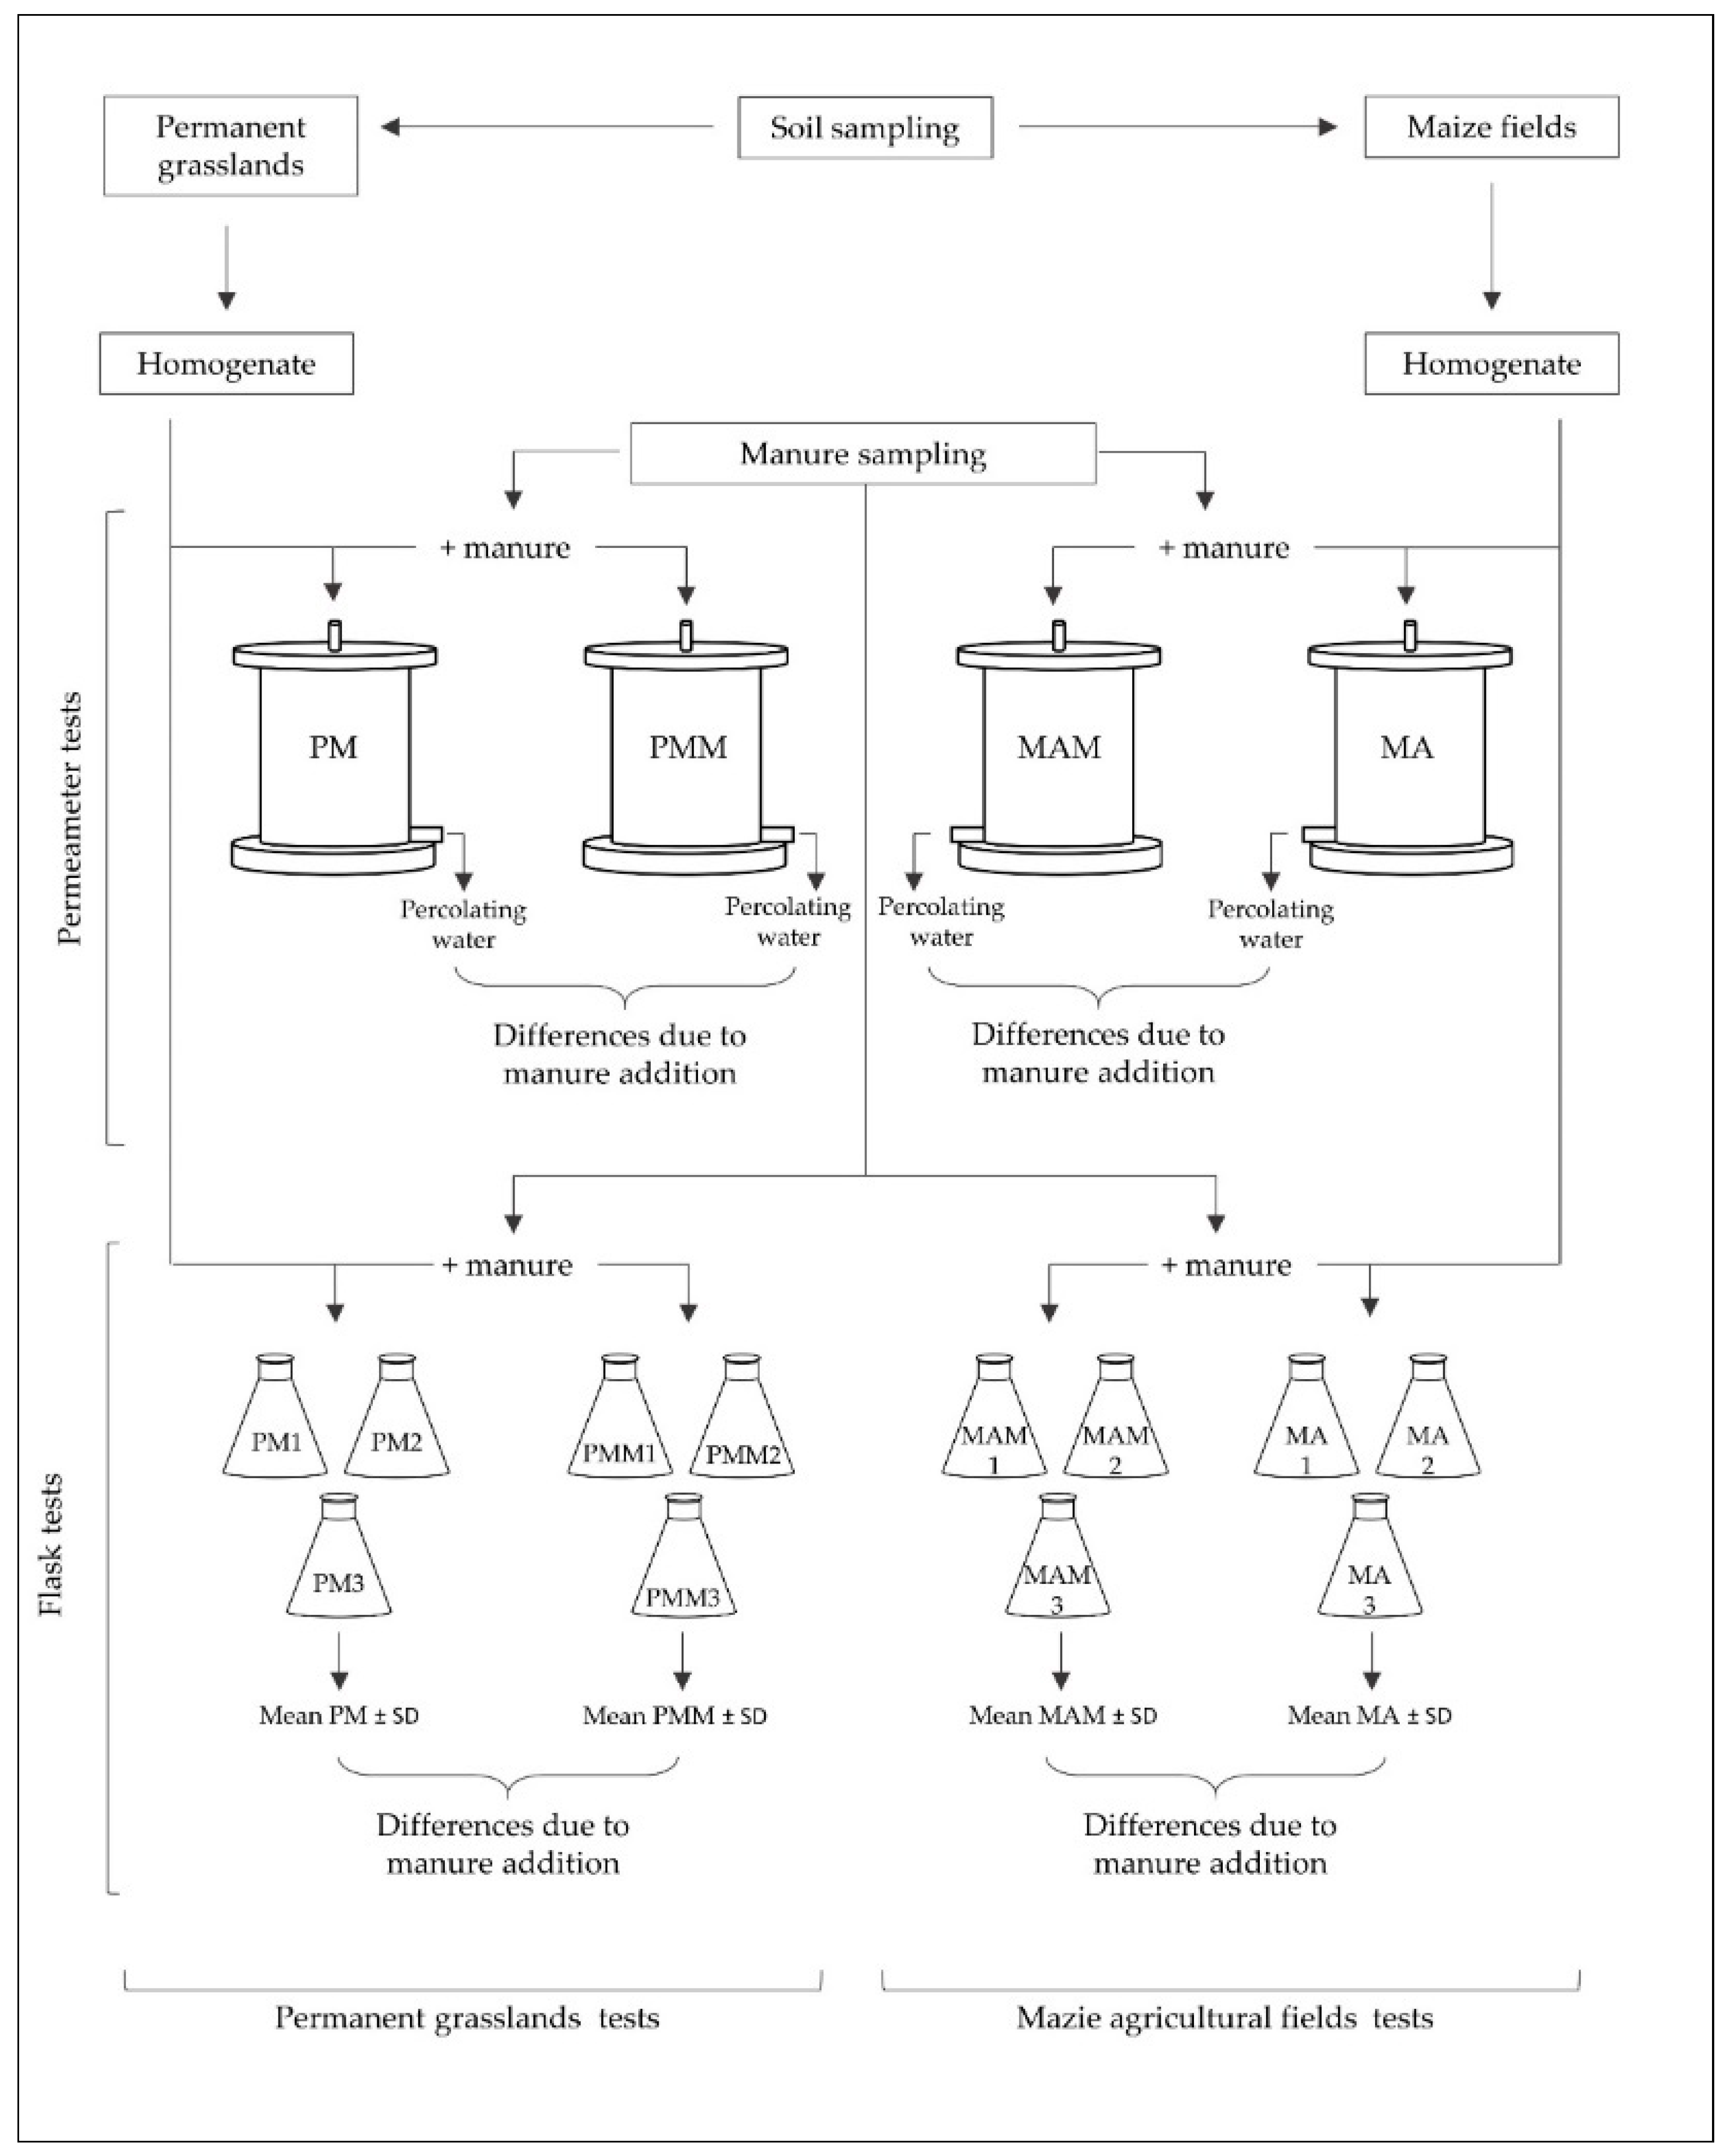
2.4. Soil Leaching Tests

A physical analogue model was carried out using column experiments to analyze the changes in water chemistry after percolation through bare soil and through soil amended with manure. For this purpose, two columns were packed with different types of bare soil (control), while two columns were packed with the same soils amended with manure to simulate fertilization. Simultaneously, the effects of a longer interaction time between water, soil and manure were investigated using bare and manure-amended soil suspensions in water (Figure 3).
In the column experiments, soil samples were taken from adjacent maize agricultural areas (indicated as MA) and permanent grasslands (indicated as PM) reported in Figure 1a. The soil samples were immediately transferred to the laboratory, where they were mixed into a single homogenate for each typology (MA vs. PM), from which subsamples were placed in a standard permeameter (81.07 cm2 by 11 cm deep; MaTest, Treviolo, Italy). Water was applied from the top of the permeameter, simulating precipitation in the agricultural field. For this purpose, a peristaltic pump (Watson-Marlow, Wilmington, MA, USA) provided a constant flow through the soil sample. We simulated a single precipitation event (3 h and 20 min long) of 70 mm, which was registered by the Goito meteorological station in November.
Two additional columns were realized by mixing manure with the soil from maize agricultural areas (indicated as MAM) and permanent grasslands (indicated as PMM) before placing the soil in the permeameter to simulate plowing, which is usually carried out after the manure distribution on soil. Before mixing, manure was dried in an oven at 50 °C until it was a constant weight and milled to a fine powder. The percolating water was collected every 20 min and stored in 50-mL polyethylene bottles. After the measurement of EC and pH, it was filtered and analyzed for hydrogencarbonate, reactive silica, nitrate and ammonium. HCO3 was analyzed by titration with 0.1 N HCl (TIM 90 Radiometer Analytical SAS, Lyon, France; [55]). SiO2 was analyzed by spectrophotometry (Novaspec II Pharmacia; [56]). NO3 and NH4+ were determined by spectrophotometry according to [54,57], respectively. Considering a mean percentage of N in manure equal to 1.5% [58], in these two simulations, 16.21 g of manure was added, equivalent to the 250 kg N ha−1 year−1 set by the derogation to the Nitrate Directive in the Lombardy region [32].
For the flask tests, nearly 1.7 g of soil was suspended in 100 mL of water in 250-mL flasks and left on an orbital shaker for 2 h at 600 rpm. This test was carried out in four different treatments (MA, PM, MAM and PMM, as detailed above) with three replicates each. In the MAM and PMM flasks, 0.2 g of manure was added besides soil, equivalent to 250 kg N ha−1. After the 2 h incubation, samples were centrifuged until the separation of liquid from solid phase occurred (5 min at 3000 rpm), then the EC and pH were measured and samples were filtered and analyzed for reactive silica, hydrogencarbonate, nitrate and ammonium, as described for the column test methods.
For all the soil leaching tests, the leachate was characterized by a brown color given by the dissolved organic matter and was heavily diluted to minimize the interference given in spectrophotometric analyses (from 1:10 to 1:50, according to color intensity and expected sample concentrations). Nonetheless, the samples’ background color was registered and subtracted for every wavelength in all the samples. Each chemical analysis was performed by the same operator on the same instrument using the same standards. For both column and flask tests, soil and manure were sampled in the study area.

3. Results

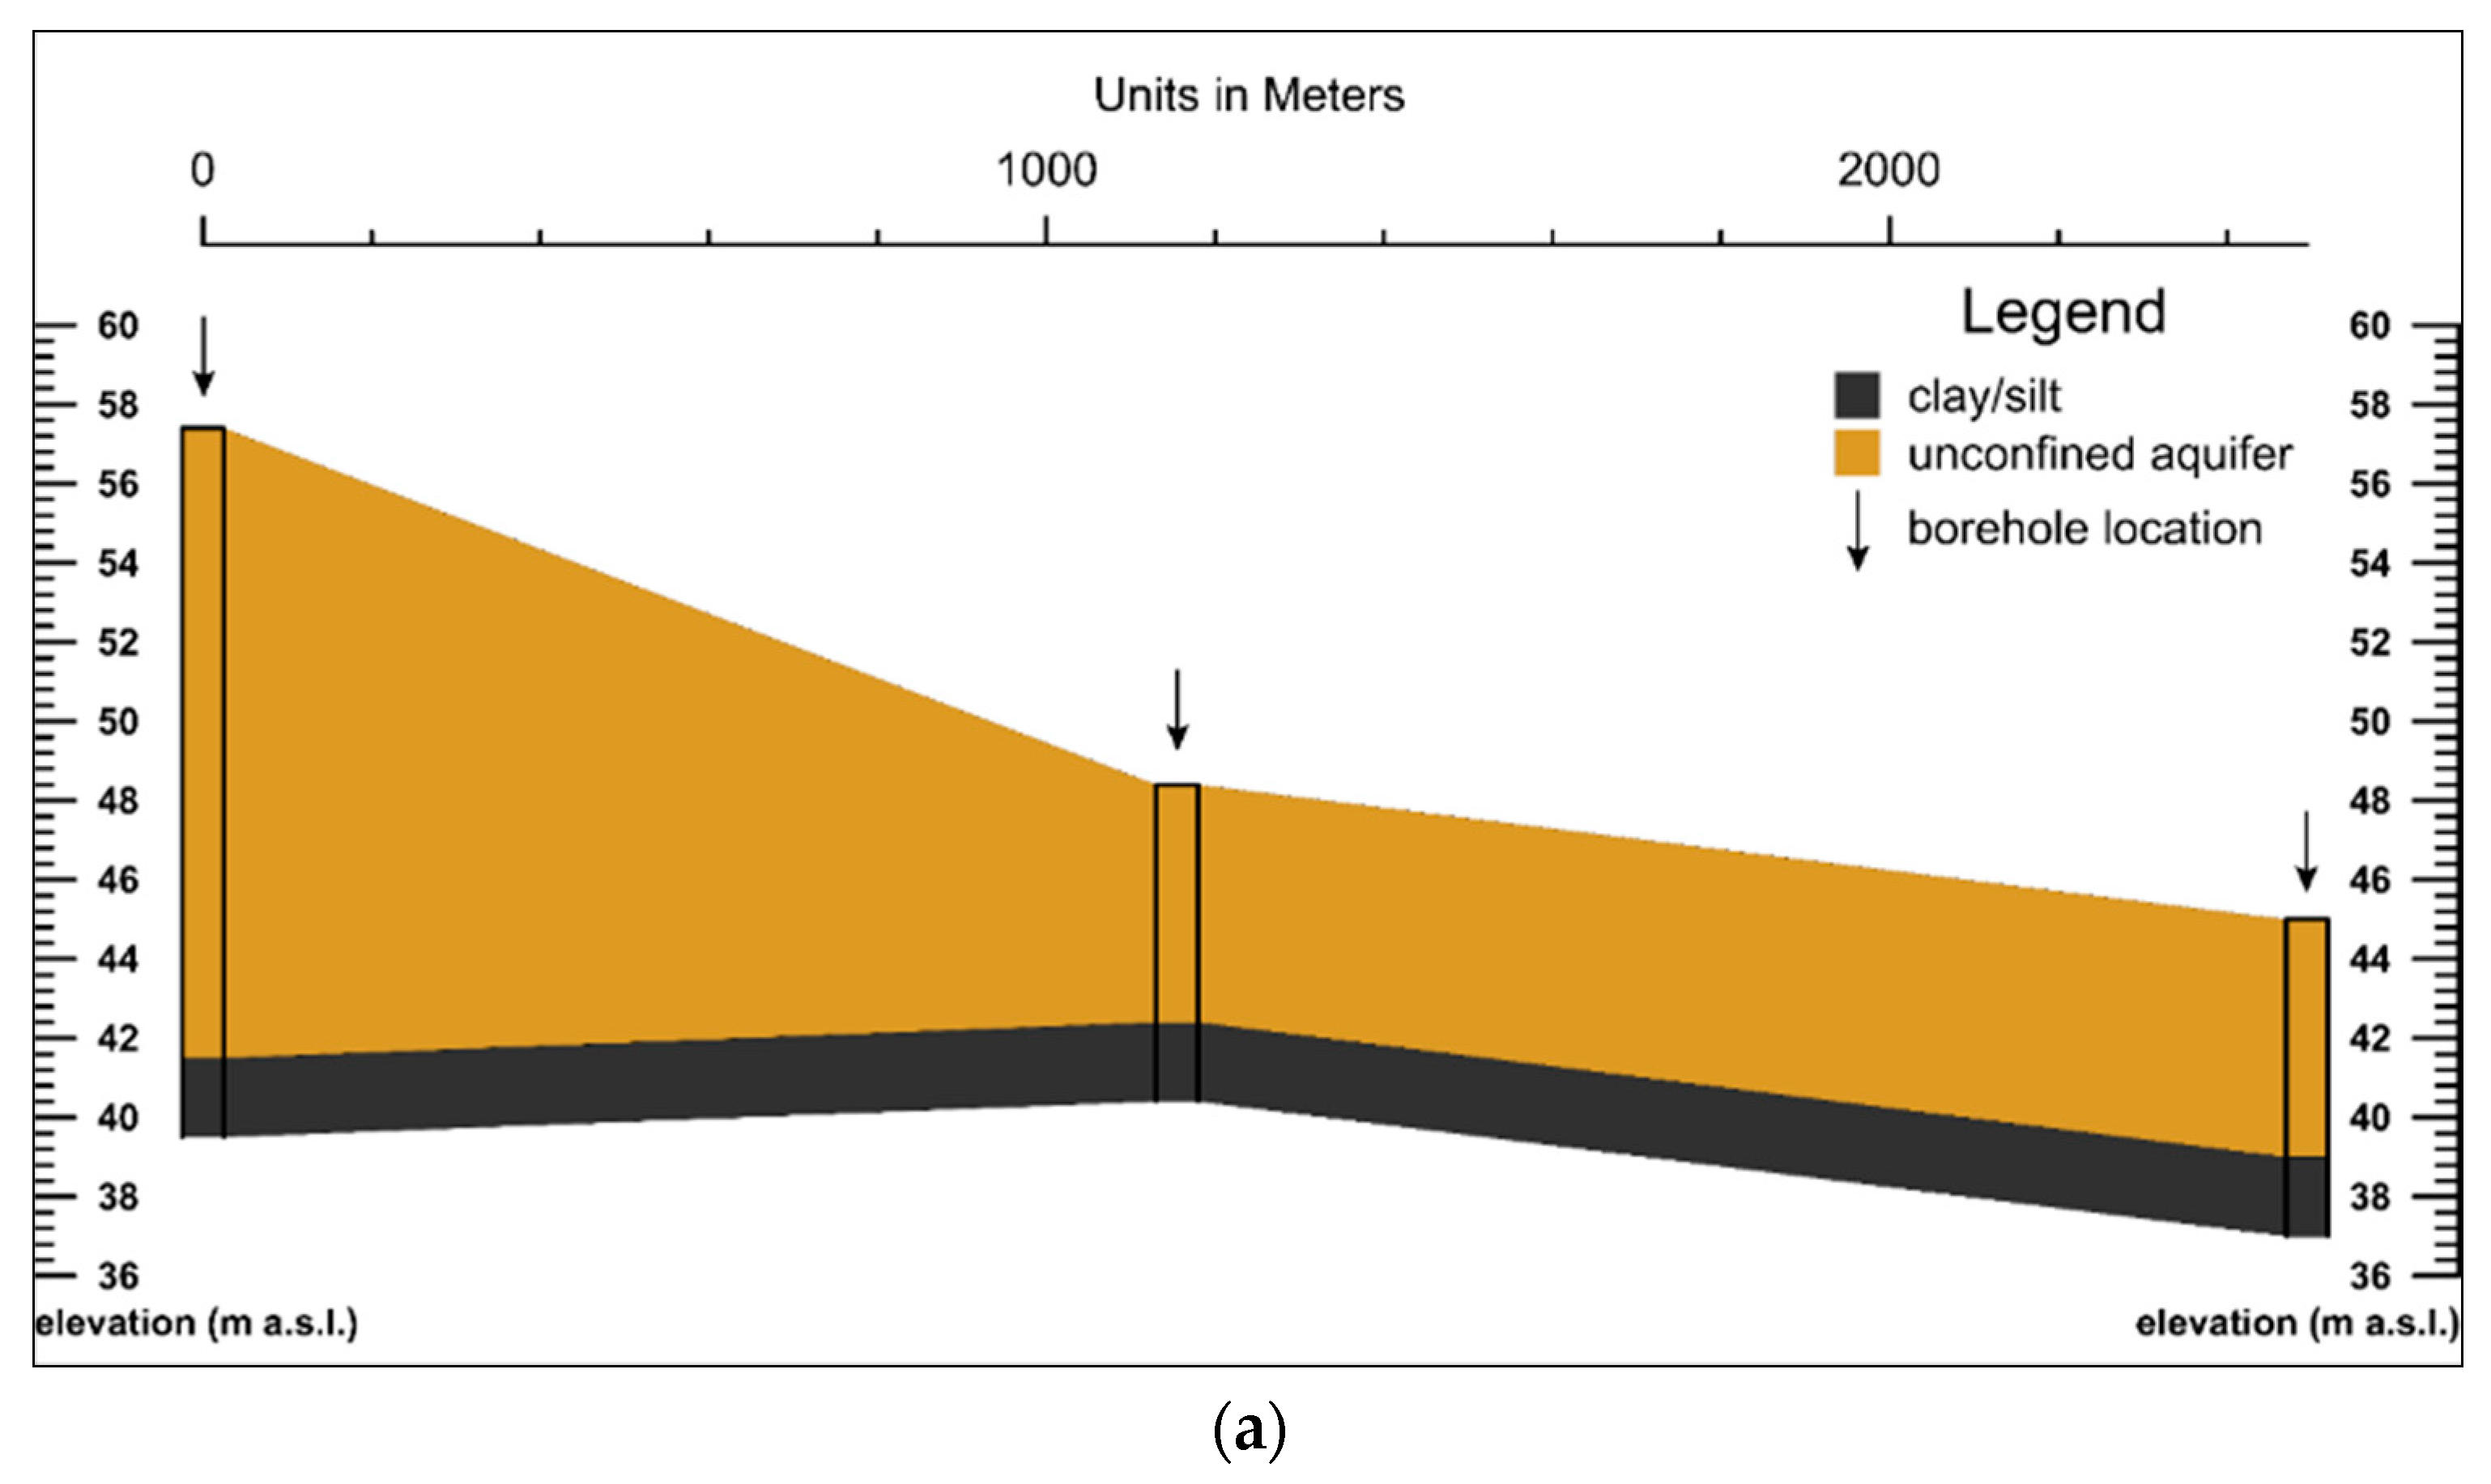
3.1. Geological and Hydrogeological Settings

The stratigraphic information allowed us to reconstruct a geological model of the study site in which two geological cross-sections are presented (Figure 4). Based on log data, the unconfined aquifer is made of gravels and, subordinately, sands. Below the ground surface, the stratigraphic sequence begins with gravels and sands belonging to the fluvial-channel facies. The shallow unconfined aquifer has a thickness varying from 22 to 2 m moving from northwest to southeast. Beneath the shallow aquifer, a continuous bed of fine grain-sized deposits was found, which belongs to the overbank facies and is constituted by clay and silt, with a thickness varying from 2 to 10 m.
Overall, the shallow groundwater flows from northwest to southeast, towards the Mincio River (Figure 5). The groundwater heads show seasonal fluctuations of different proportions (Figure 6). Irrigation water is provided in negligible volumes when rainfalls are abundant. Thus, in May 2019, groundwater heads were affected more by precipitation (that was unusually abundant) than by irrigation. From June to August 2019, considering the low amount of precipitation and the relatively high evapotranspiration, groundwater was mainly recharged by irrigation (Figure 6), raising groundwater heads to their maximum during the observation period.
From late August, water from the Mincio River is no longer used for irrigation purposes and groundwater heads in the study area begin to lower. In November, the abundant precipitation slows the lowering of the groundwater surface, stabilizing groundwater heads, which remain nearly constant until December. The rapid response of the phreatic surface agrees with the high permeability of the aquifer and the low thickness of the unsaturated zone.
The groundwater flow net showed some minor differences between the irrigation and non-irrigation periods (Figure 5a,b). In the northern part of the study area, a main drainage axis and a groundwater divide were identified. Their shapes are accentuated in summer by the higher hydraulic gradient, due to higher groundwater heads and the nearly constant (fixed and regulated) hydraulic head in the Mincio River.
During the irrigation period, near the Pozzolo dam, the hydraulic gradient has an average of 0.02, while west of the drainage axis it is slightly higher (0.03). In the rest of the investigated area, a nearly constant hydraulic gradient is inferred (0.002), lowering south by southeast towards the Mincio River. During the non-irrigation period, the hydraulic gradient decreases slightly to 0.001 in this zone.

3.2. Column Tests

When analyzing the variation in physico-chemical parameters in the column tests, large variations in solute concentrations were observed (Figure 7), with values greater than those measured in the study area during the sampling period. These differences are due to the amount of fertilizer used in each test, equivalent to the bulk that should be used in 1 year, according to the derogation to the Nitrate Directive in the Lombardy region [32]. Remarkable differences between fertilized and non-fertilized soil were apparent in all the column tests (Figure 7 and Supplementary MaterialsTable S1).
Starting from SiO2, the results showed a net discrepancy between fertilized and non-fertilized soils, with decreasing concentrations throughout the PMM, MAM, PM and MA treatments, respectively. In the column tests, MAM and PMM presented higher NO3 concentrations in the first samples, reaching 1014.55 mg/L NO3, and comparable to those found in similar studies such as [59]. After that, concentrations decreased rapidly over time, reaching values even smaller than those obtained from non-fertilized tests. In the last MAM sample, NO3 concentrations were lower than the detection limit of the method and were approximated to zero. In MA and PM tests, NO3 concentrations were initially lower than fertilized test samples, but with a less pronounced decrease. As a consequence, NO3 concentrations in the latter samples were higher, suggesting a slower and more constant leaching. The analyses of NH4+ concentrations, which are generally low in the study area, revealed marked differences between fertilized and non-fertilized samples. MA and PM conditions have nearly constant concentrations in all the collected samples, with mean values of 1.07 and 2.06 mg/L, respectively. MAM samples were almost constant too, with a mean value of 5.69 mg/L. On the other hand, PMM samples showed the highest concentrations but with a decreasing trend, varying from 14.5 to 9.99 mg/L.
NO3 concentrations in the percolated water showed a trend similar to EC. Regarding EC, the first leached water collected from the permeameter is marked by high conductivity for all the tests, reaching 11,347 μS/cm. PM and MA tests produced leached water with similar EC trends, even if PM values were higher, especially in the first collected samples. Manure addition led to similar results within fertilized and non-fertilized tests, minimizing the soil differences from different agricultural soils. In the PM test, HCO3 concentrations initially decreased and then slowly increased, returning to the initial values, while MA treatment was marked by a slight increase over time. The HCO3 values measured in the soils added with fertilizers were unexpectedly high, underlying the effect of manure spreading on hydrogen carbonate concentrations in leachate water. In all the treatments, an increase in pH was observed over time, even if the PM test showed an initial drop. MAM samples displayed the highest increase, varying by 0.7 pH units.

3.3. Flasks Tests

The soil suspension in flasks has a slightly different meaning as it provides the potential release to or retention from the water of solutes. It is a potential measurement as the soil is suspended in water and continuously mixed, something that does not happen under in situ conditions. However, due to oxic conditions, during the suspension, the amounts of released solutes (e.g., nitrate) should be comparable to those of the percolation test.
Despite the different interaction between water and soil, flask tests produced results similar to those of the column tests, with some differences in NO3 concentrations (Figure 8, Table S1).
SiO2 concentrations were similar to those found in the column tests, with higher values in fertilized samples. NO3 displayed a higher variability from the collected soil, emphasized by the small amount used. Here, the differentiation between fertilized and non-fertilized flasks was less marked. EC data showed a net difference between fertilized and non-fertilized soils, like in column tests, with a small variability inside the three replicates. pH results were characterized by a higher variability within replicates, especially PM, with a standard deviation (SD) = 0.44. Nevertheless, fertilized soils produced higher pH values. In HCO3 results, the differentiation between treatments is clear, with higher hydrogen carbonates in PMM and MAM, as found in the column tests. NH4+ results are similar to those from column tests, with higher concentrations in samples amended with manure.

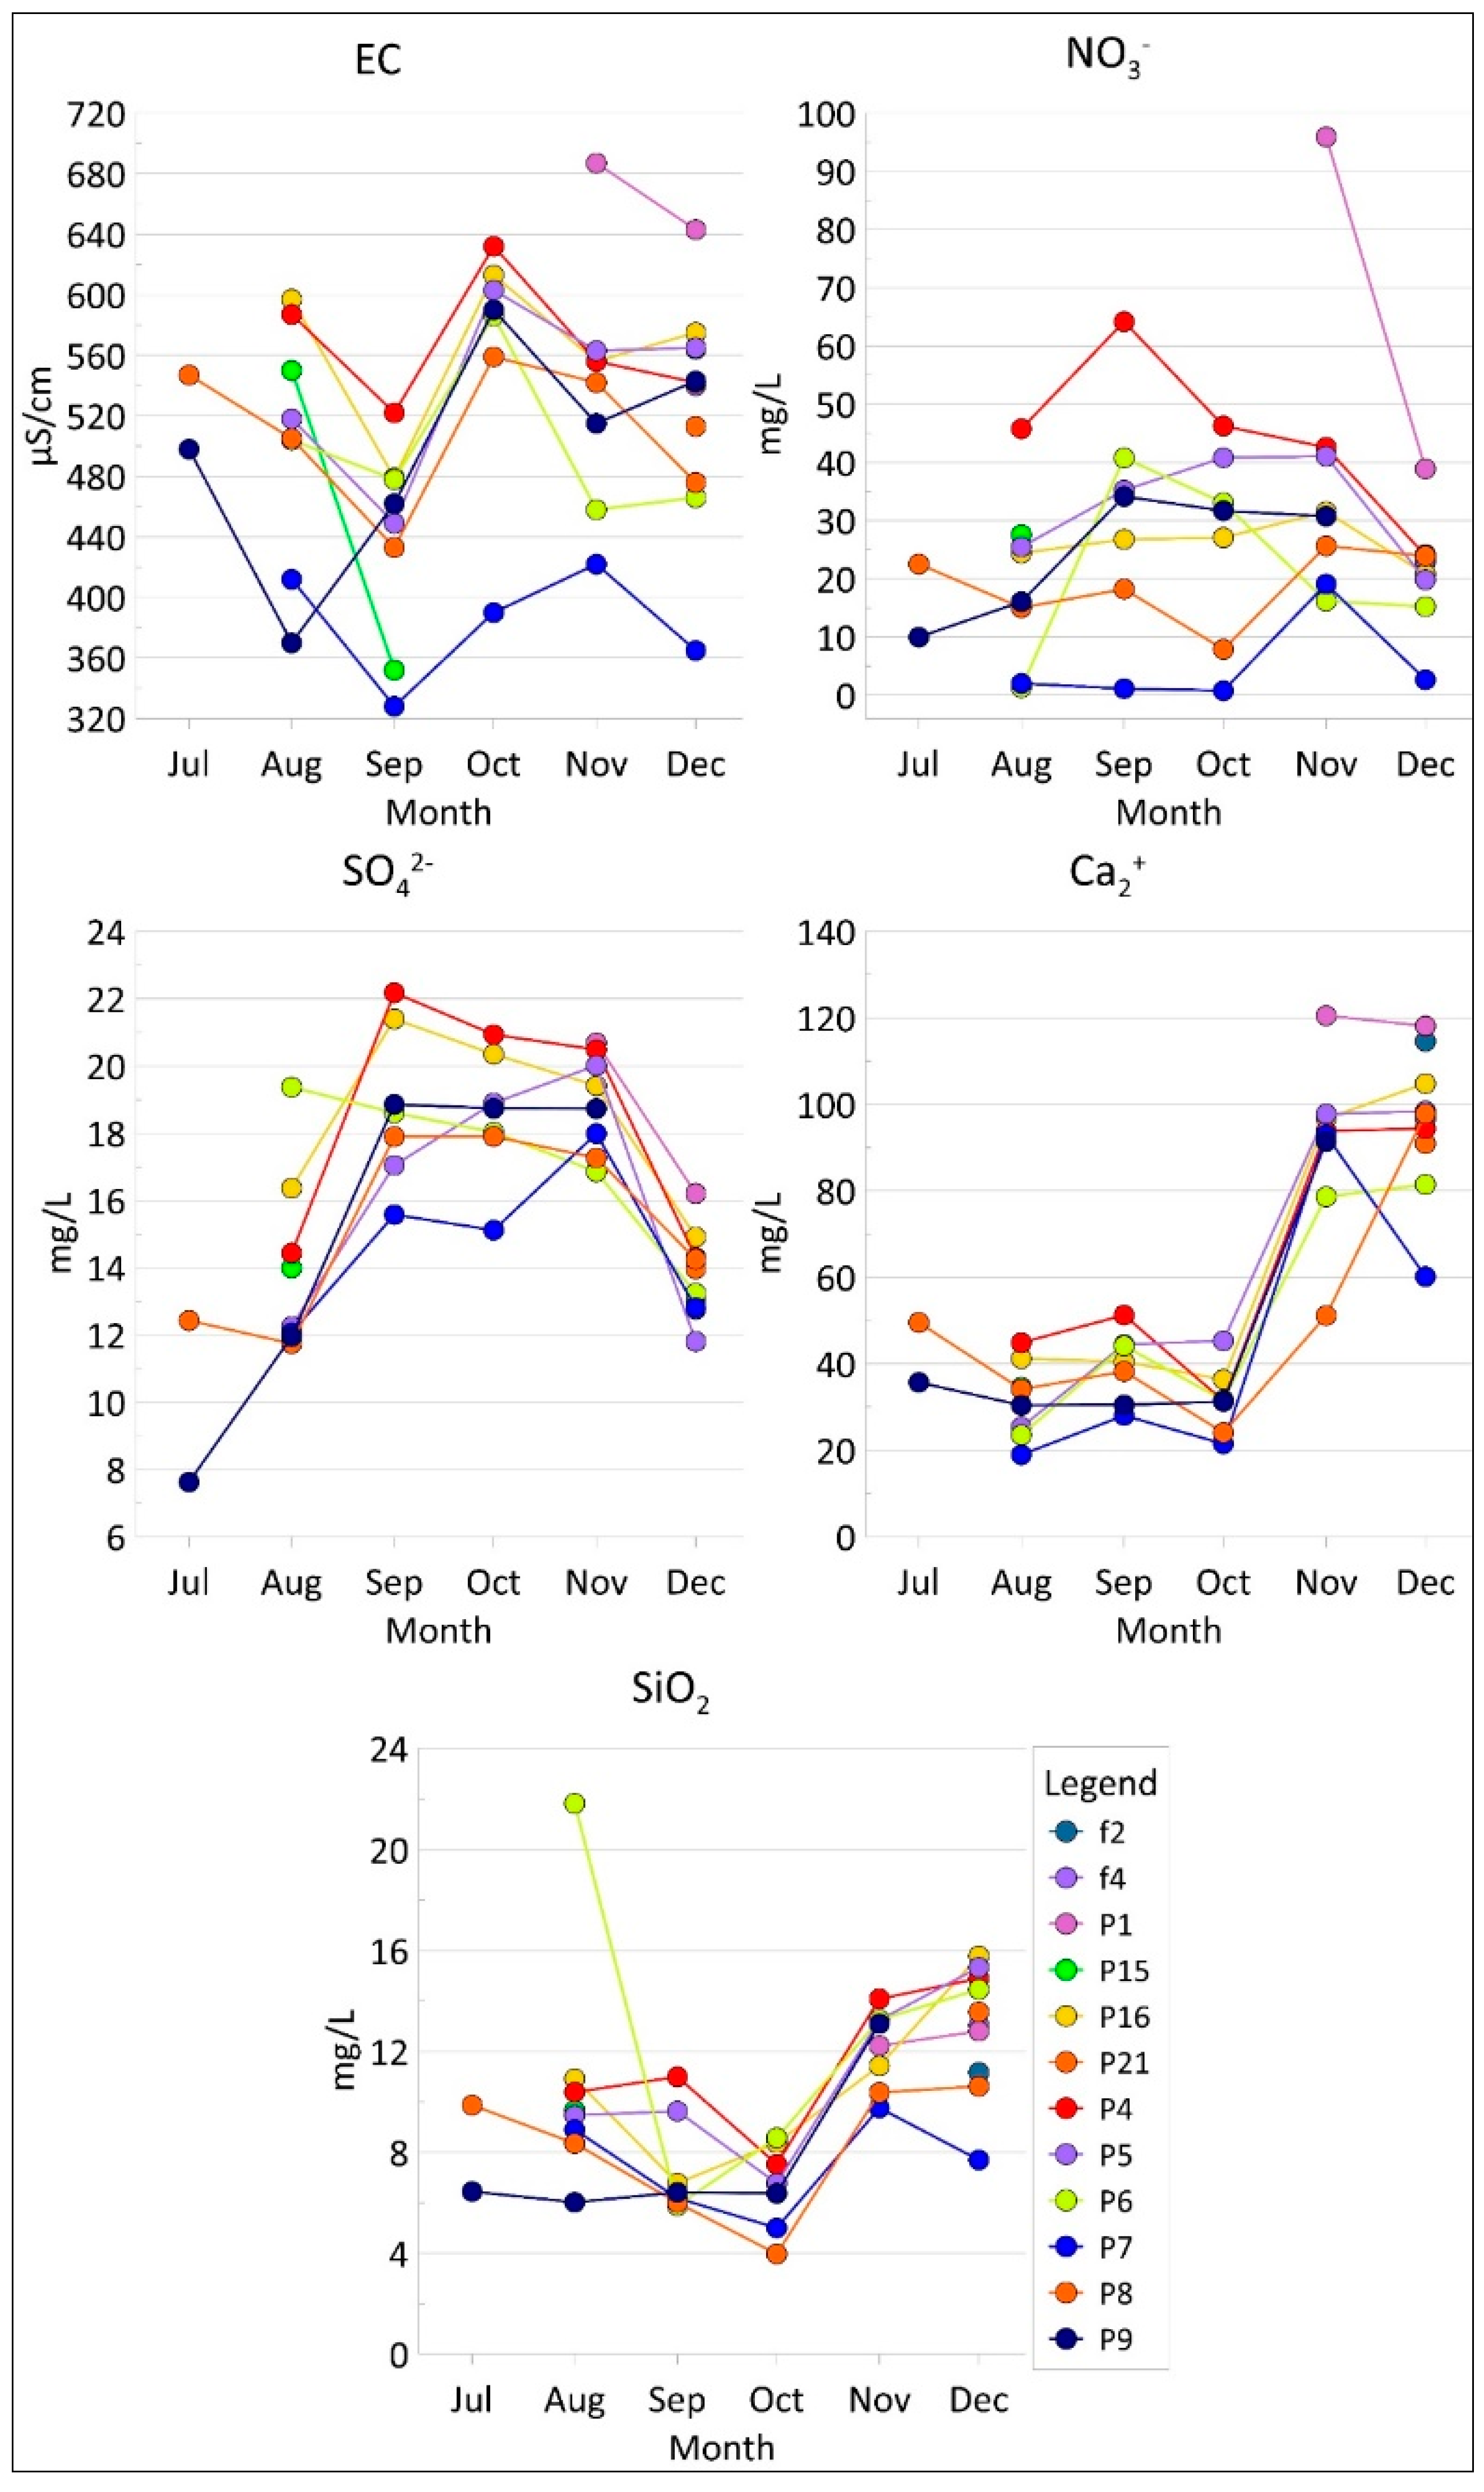
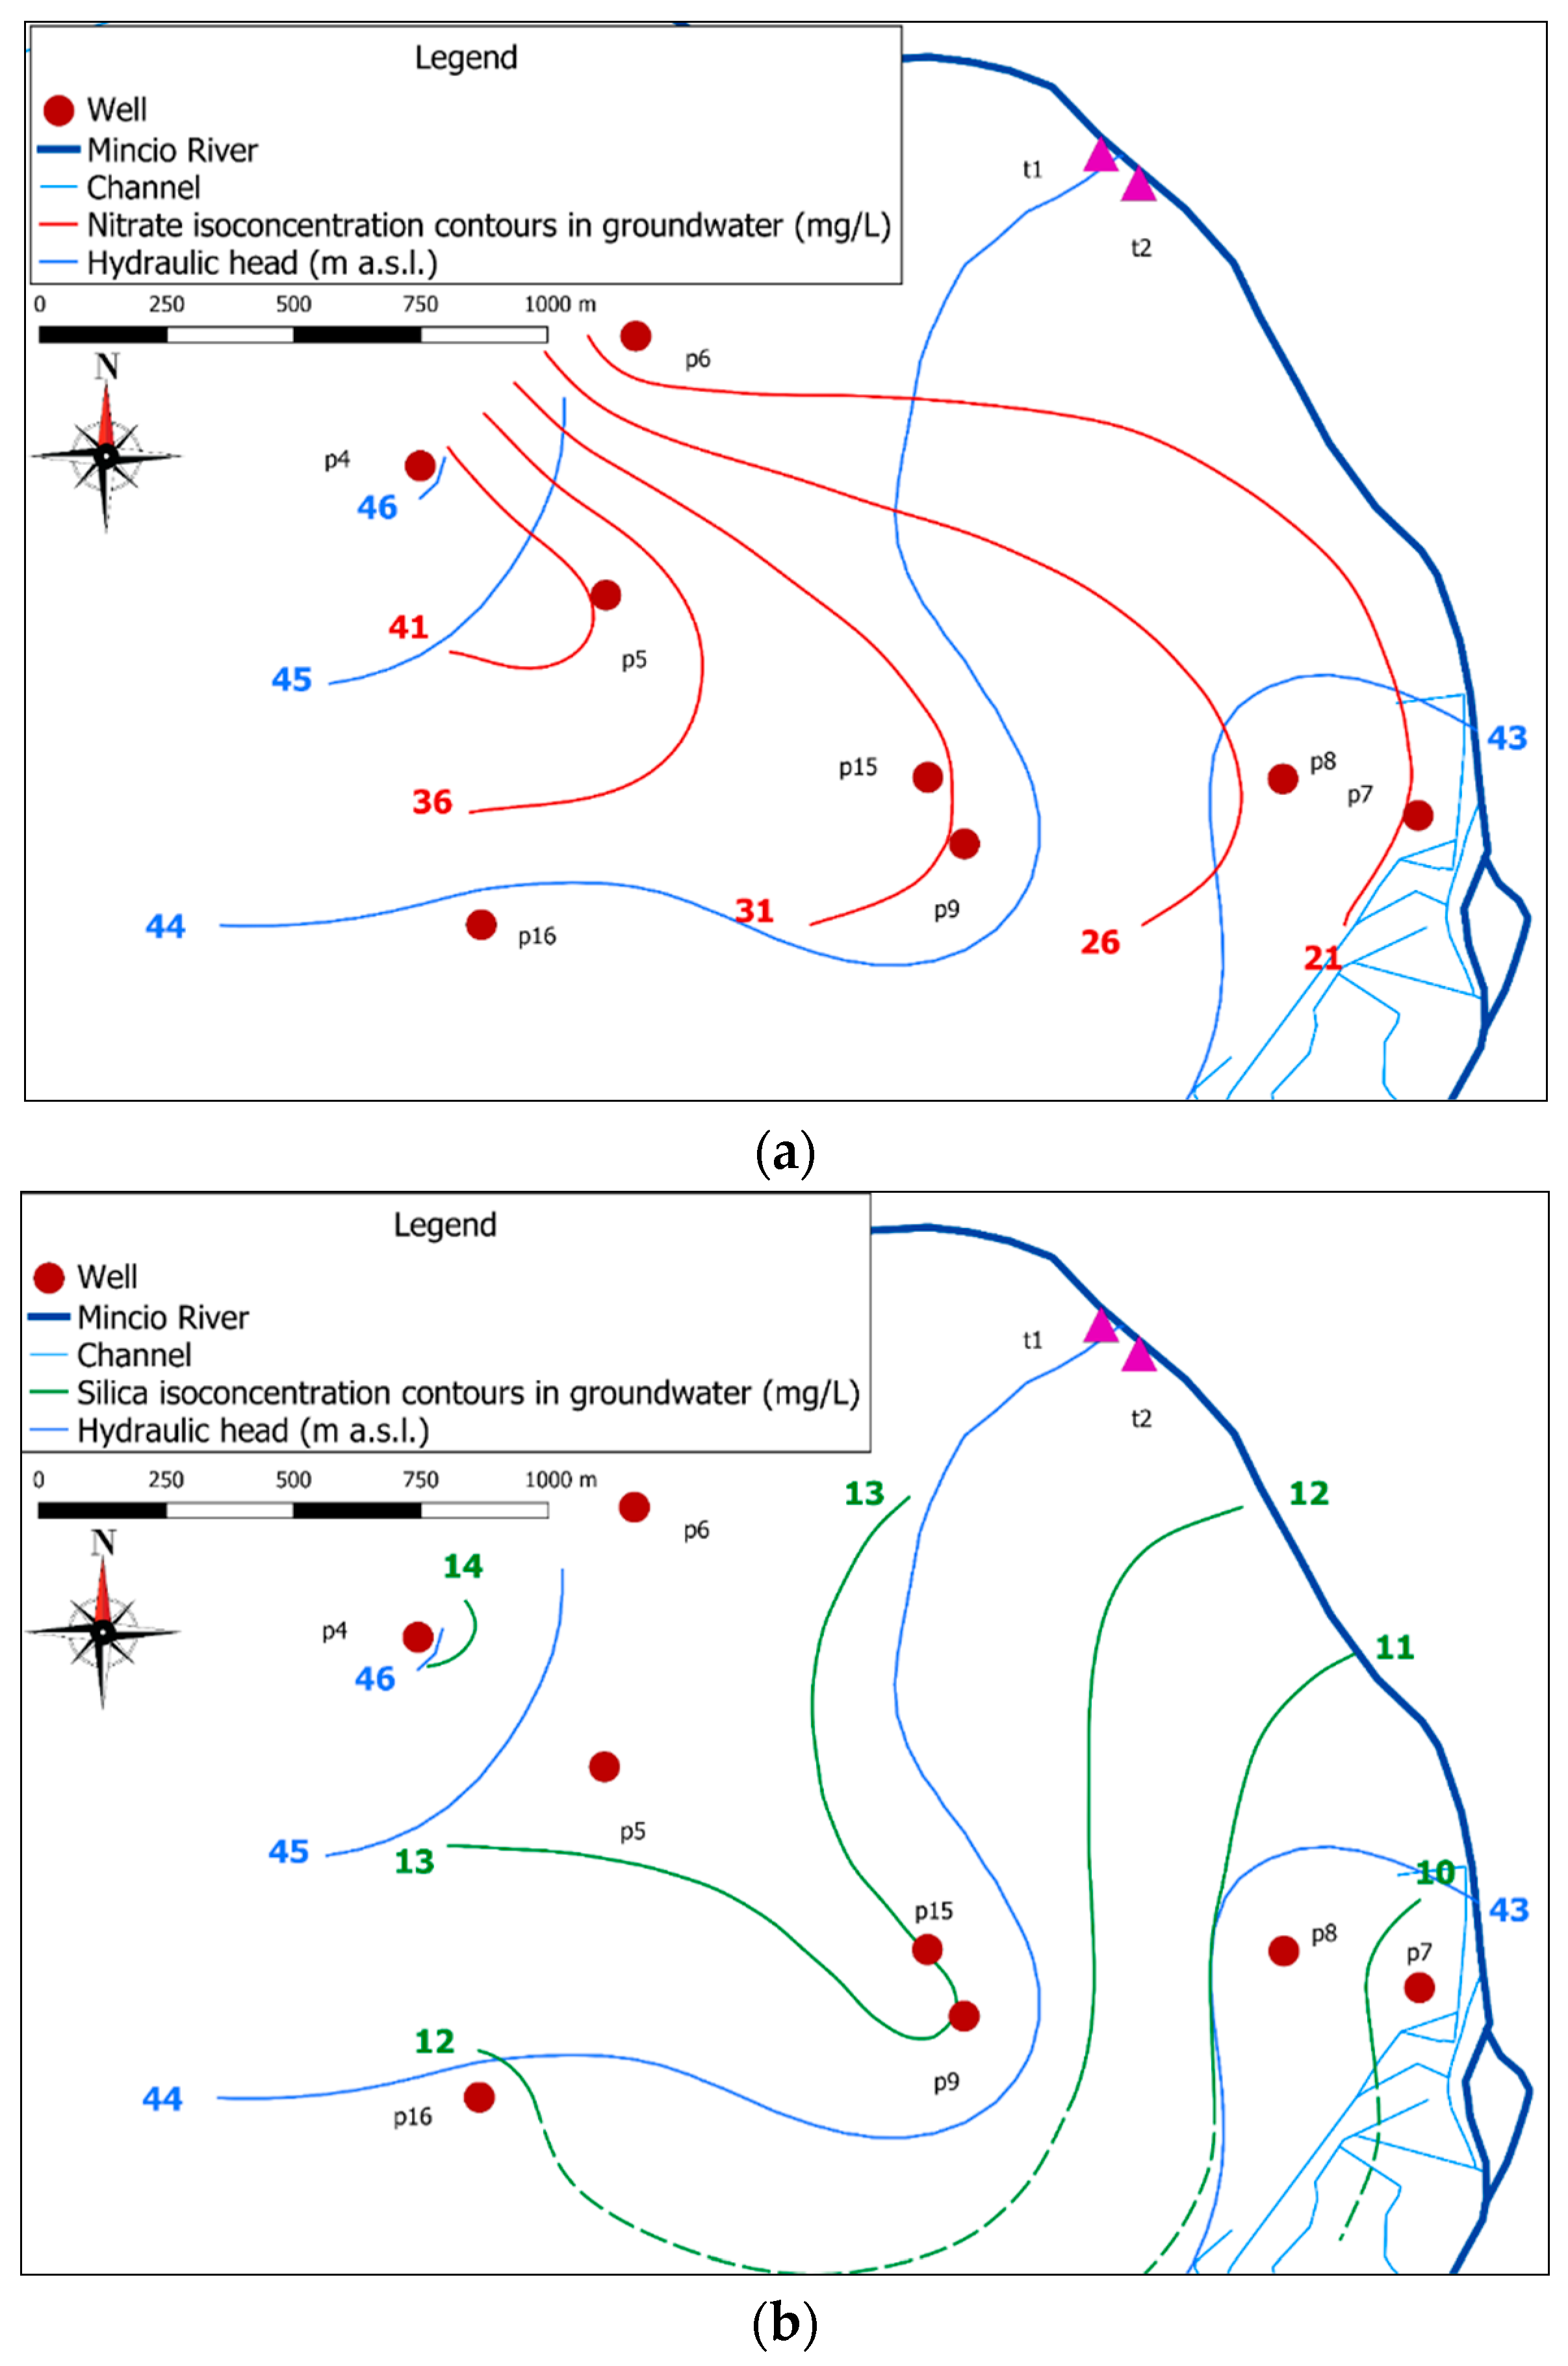
3.4. Groundwater Contamination

During the monitoring period, the concentrations of some analytes remained nearly constant, e.g., Na+, K+, F and NO2. NH4+ was detected only sporadically. On the contrary, EC, NO3, SO42−, Ca2+ and SiO2 were characterized by substantial variations (Table S2, Figure 9).
EC is characterized by high fluctuations (min = 328 μS/cm, mean = 515 μS/cm, max = 687 μS/cm), with higher values in autumn. Among the analyzed cations, only Ca2+ varied throughout the sampling periods (min = 18.96, mean = 64.9, max = 120.51 mg/L), with lower values during summer and higher concentrations in November and December. Within the analyzed anions, only sulphate (min = 7.63, mean = 16.25, max = 22.18 mg/L) and nitrate (min = 0.79, mean = 26.59, max = 95.94 mg/L) varied seasonally. SO42− concentrations were marked by lower values during the irrigation period and displayed higher concentrations from September to November.
NO3 concentrations showed an increase in September and November, exceeding, in some cases, the limits of 50 mg/L set by the WFD [30]. In the area where the well network allows a reliable analysis, the spatial distribution of NO3 concentrations is in agreement with the groundwater flow net (Figure 10a), suggesting that the main origin of the contamination is located upstream of the study area. The concentrations progressively decrease along the groundwater flow path, according to the expected dispersion within the saturated medium. In the study area, SiO2 showed marked variations during sampling time (min = 3.97, mean = 10.17, max = 21.84 mg/L), with higher values measured in November and December. The spatial distribution of reactive silica (Figure 10b) overlaps that of nitrate, indicating a possible common origin.

4. Discussion

4.1. Manure, Soil and Water Interactions

Column tests have already been reported as useful tools to analyze the chemical evolution of water percolating through soil for hydrogeological purposes [60]. Thus, we performed column tests to investigate how the addition of manure can change leachate physico-chemical characteristics. Repeated water sampling and analyses showed how water chemistry varies over time along its vertical path in the upper unsaturated aquifer. It is expected that soluble compounds are leached first, showing a peak, and then concentrations decrease, while other solutes might be lost from the soil due to water saturation and redox-dependent processes, and therefore display a delayed release [61,62]. Soil might also retain some chemical forms, decreasing their concentrations in the percolating water [63].
Moreover, the comparison between these results and those acquired in the field allow us to understand further processes affecting groundwater hydrochemical parameters in the study site. In column tests, permanent grassland samples (PM and PMM) showed higher concentrations compared to maize agricultural fields (MA and MAM), likely due to their greater organic matter content.
SiO2 results from both laboratory tests reported a clear differentiation between bare soils and soils amended with manure, despite a possible underestimation of silica in water due to the exclusion of the colloidal fraction, following sample filtration. Thus, the origin of silica in the column tests can be related to the spreading of manure. Moreover, the rapid increase in SiO2 concentrations could be due to more soluble Si forms in livestock diets, such as biogenic silica (BSi) [64]. These findings are in agreement with other studies, which reported SiO2-rich manure spreading as a useful tool to restore the Si content in depleted agricultural soils [65].
In the column experiments, high NO3 concentrations were expected, as this consequence of manure spreading in agricultural areas is well known [66]. Interesting insights into NO3 concentrations can be inferred from the NH4+. Given the larger amount of NH4+ in manure, compared to NO3 [67], PMM and MAM column tests showed a higher nitrification potential, resulting in rapid NO3 production from the applied NH4+. In the PM and MA column tests, the low NH4+ concentrations suggest the non-addition of manure, but the high NO3 concentrations are evidence of previous spreading in the fields, and of complete ammonium oxidation via nitrification. Additionally, low NH4+ levels can be caused by irrigation events and consequent leaching in the days preceding the sampling, resulting in a depletion of cation exchange sites and the higher mobility of ammonium [68]. Moreover, the higher NO3 concentrations in PM can be explained by the higher numbers of nitrifying bacteria in this soil, which might be explained by the higher ammonium and oxygen availability [69]. These results suggest that fertilizer spreading may not only be performed after crop harvesting, due to the uncoupled number of farmed animal and arable land surfaces for manure spreading. The former, in this area of northern Italy, are in large excess [40]. In addition, the high concentrations and the rapid decrease in nitrate in fertilized column tests suggest the quick leaching of recently applied manure when water applied to the top of the soil is abundant, as in summer (due to irrigation, e.g., [43]) or spring and autumn (due to precipitation, e.g., [70,71]). On the other hand, previous manure spreading with consequent NH4+ loss could lead to a lower leaching of nitrate. Conversely, flask tests resulted in no obvious differences in NO3 concentrations. In the fertilized flask tests, manure addition stimulated ammonia oxidation. However, the bacterial growth and associated nitrogen uptake might explain the similar concentrations in the four treatments; alternatively, the higher organic content may have stimulated microbial respiration and the use of nitrate as an electron acceptor. Thus, at the end of the incubation period, nitrate concentrations were similar between fertilized and non-fertilized tests. In fact, analogous nitrogen dynamics have been found by other authors in clayey soils in the Lombardy region, where a high residence time in soil leads to denitrification of manure-derived nitrogen [72]. Processes occurring in the flasks during the soil suspension did not significantly alter the ammonium concentrations. In fact, NH4+ has different values between fertilized and non-fertilized flasks, with the highest values in the PMM test, as shown in the column test. Moreover, due to the high pH values in the PMM and MAM flask tests, ammonium concentrations could have been underestimated. In fact, in contrast to the permeameter where the NH4+ was lost via nitrification and included in NO3 concentrations, here, at high pH values, part of the ammonium is converted from NH4+ to NH3 [73] (e.g., 18.2% at pH 8.5 at 28 °C), which is lost via volatilization, underestimating the overall nitrogen concentrations.
Laboratory tests clearly underline how both SiO2 and NO3 in leachate water originate from manure applications on soil and that their temporal evolution undergoes a different regulation. If, regarding NO3, the matter is well documented [74], SiO2 concentrations in groundwater can usually be ascribed to mineral weathering, never taking into account the contribution of manure, especially where it is spread in high quantities. More importantly, our results show that SiO2 concentrations in leachate water are nearly constant over time, both in column and flask tests. Such a result, in the column test, is particularly interesting if compared to the temporal trends of most solutes. Nitrate is immediately solubilized and exported from the column with the percolating water; its concentrations decrease rapidly along the temporal series. Reactive silica concentrations display a similar initial peak, but they do not show a similar decrease, suggesting a much more constant and slower release either from manure or from the soil. Moreover, reactive silica concentrations are not affected by biogeochemical processes in groundwater, such as nitrification or denitrification for nitrate. These results make SiO2 a useful tracer (at least in the study area) when studying the impact of manure spreading on groundwater quality, with an emphasis on nitrate contamination. They also may explain the discrepancies observed in recent comparisons between Si mass budgets performed at the watershed level and Si loads measured in the Mincio River, with the latter much higher than those expected from mass budgets [39].
Our tests reported EC values in the flask tests closer to those registered in the field, while in column tests they were sensibly higher. As a matter of fact, column experiment samples are characterized by a low correlation between EC and NO3 (R2 = 0.49), while field samples are characterized by low values in the first three months (mean R2 = 0.455, SD = 0.101) and higher values in the last three (mean R2 = 0.670, SD = 0.082), supporting the idea of the major contribution of nitrate to the EC in groundwater compared to other ions.
Despite the fact that they were not analyzed for field samples, HCO3 analyses were performed due to the high amount of organic matter in the collected laboratory samples. It is well known that organic matter can modify pH in soil, which can consequently affect processes considered to be highly pH sensitive, such as nitrification [75,76,77]. The HCO3 concentrations in column and flask tests are in agreement and also suggest other effects of manure application. The high HCO3 concentrations could also be functions of organic acid anions and CO2 production. Regarding the first factor, this difference is given by the high amount of organic matter in leached water, suggested by the dark color of samples. The method for HCO3 analysis reported above is based on the total alkalinity, which can be altered by the organic acid anions present in water samples rich in organic matter [78], resulting in an overestimation of HCO3 concentration. Regarding the second factor, in other similar tests, the addition of manure caused an increase in HCO3, due to the higher production of CO2 in soil [79], which is favored by irrigation [80]. Flask tests show pH values similar to the final samples of the column tests, suggesting the persistence of these conditions over more extended interaction times.

4.2. Groundwater Contamination in the Study Area: Insights from Laboratory Tests

Moving from the regional to the local scale, the cyclic architecture proposed by Amorosi is confirmed [44]. The study area is characterized by an unconfined aquifer located below intensively cultivated agricultural fields. The hydraulic properties of the unconfined aquifer have not been investigated yet at the study site. However, a transmissivity of 1.0 × 10⁻² m2s−1 and a storativity of 1.49 × 10⁻² were calculated through pumping tests in a nearby area [45].
In our study area, from late spring to autumn, the main source of aquifer recharge is the Mincio River, which largely exceeds the natural recharge given by precipitation during the irrigation period. The high volumes of water used for flood irrigation entail an unnatural incremental rise in groundwater heads, up to ~4 m during July. According to similar timings reported around the Lombardy plain [81], from late August to the end of September, maize, which is the main cultivated crop, is harvested and the irrigation of agricultural fields is no longer performed. During the non-irrigation period, the phreatic surface is sensibly lower, with some shallow wells remaining dry (e.g., p15).
Regarding SiO2 concentrations, the continuous and thick bed of fine sediments below the unconfined aquifer excludes the contribution given by deeper and slower groundwater circuits enriched in SiO2. Their values in the study area started to rise in autumn, after manure spreading. The highest concentrations are reached in the rainier months, i.e., November and December, as precipitation promotes manure-associated solute percolation in groundwater. SiO2 concentrations were unexpectedly high and distributed in the study area similarly to NO3 (Figure 10b). Thus, according to its spatial distribution and the laboratory tests, its origin is attributed to manure spreading in agricultural fields, which silica content may vary accordingly to the livestock diet. Additionally, high SiO2 concentrations have been reported to increase nitrate mobility [82] and water residence time in soil, also promoting denitrification [83]. This information, coupled with the data presented in this study, highlight the connection between SiO2 and NO3 in the study area.
The NO3 concentrations have a spatial distribution similar to SiO2 (Figure 10a). NO3 concentrations are characterized by higher values upstream of the study area, decreasing progressively along the groundwater flow path. This result suggests the absence of groundwater contamination from agricultural areas above the study sites, or at least not as significant as upstream. The progressive decrease in nitrate concentrations is due to hydrodynamic dispersion, probably coupled with denitrification and/or nitrate reduction. In fact, nitrate concentrations decrease faster than silica concentrations along the groundwater flow path, therefore suggesting that the spatial distribution of NO3 must be influenced by biological factors together with hydrodynamic ones.
On the contrary, NO3 and SiO2 concentrations in groundwater are characterized by dissimilar trends during sampling time, even if they both rise in September and November. As demonstrated in column and flask tests, N undergoes biogeochemical processes that do not affect Si, such as nitrification and denitrification, according to the redox conditions of groundwater. Simultaneously, nitrate is highly soluble and its production is limited by ammonium and oxygen availability, whereas reactive silica production and accumulation undergoes a completely different regulation that is independent of redox conditions and may derive from both organic and mineral sources. The high NO3 concentrations in September and November can be expressions of the manure spreading and recharge given by irrigation and abundant precipitation, respectively. Recharge can lead to the vertical zoning of physico-chemical features within the shallower saturated zone, as reported by other authors [84,85]. Here, the upper groundwater layer (where groundwater samples were collected for chemical analyses through a bailer) is mainly made of rainwater or irrigation water and is characterized by oxic conditions. This implies that microbial communities cannot perform denitrification and/or nitrate reduction, and NO3 concentrations remain high. This process is similar to that observed in the PMM and MAM column tests, where the applied NH4+ in manure was immediately converted to NO3 due to nitrification, resulting in high concentrations of the latter. However, when aquifer recharge is minor or absent, the thickness of the upper and oxic groundwater layer becomes negligible, and microbial communities can perform denitrification and/or nitrate reduction. This can happen in October and December when there is no irrigation and precipitation is less abundant. This process is like that observed in the PMM and MAM flask tests, which can be associated with groundwater without recharge. Here, possible combinations of different factors, including low oxygen availability, limit the oxidation of NH4+ to NO3, or favor the assimilation of nitrate or its reduction by microbial communities, resulting in no significant differences between fertilized and non-fertilized samples.
In summary, manure spreading and the complex hydrogeological features of the study area, with flood irrigation as the dominant recharge path during summer, are drivers of groundwater chemistry in the study area. Groundwater monitoring alone is not sufficient to catch underlying processes, whereas combined in situ characterization and laboratory experiments suggest the presence of solute-specific differential paths. The results from this work confirm the large manure excess in this geographical area and the risk of water contamination, as indicated by nitrate exceeding concentration thresholds. More interestingly, they provide, for the first time, evidence of manure-related SiO2 accumulation in groundwater. In particular, our data support the similar origin of silica and nitrate (from manure spreading) and similar mechanisms of silica and nitrate transferred to groundwater (via irrigation and precipitation), but different temporal dynamics in the two solutes. Nitrate dynamics strictly depend upon recharge and the recharge-dependent redox status and include rapid accumulation periods (positive redox, solubilization and nitrification as dominant processes) followed by consumption phases (negative redox, denitrification as dominant process). Comparatively, reactive silica dynamics seem slower, as suggested by the much-delayed peak in groundwater concentrations.

5. Statements and Open Questions

This study points out that SiO2 could be used as an effective tracer when studying the impact of manure spreading on groundwater quality. At the same time, it raises new questions regarding the processes affecting nitrate contamination of groundwater in the study area, as well as in other agricultural areas worldwide. The main questions can be synthesized as follows. How much recharge can influence the vertical zoning of redox conditions in the saturated zone and how fast can these conditions evolve over time? How much can the vertical heterogeneity of redox conditions in groundwater allow the coexistence of nitrification or denitrification processes within the same saturated zone? How much can the possible variations in hydraulic head with depth (typical of heterogeneous alluvial aquifers) minimize the vertical zoning of redox conditions, due to vertical flow and mixing within the saturated zone? How can we characterize the microbial communities and activities in soil and groundwater to refine our knowledge about the biogeochemical processes discussed in this work? To start refining knowledge to respond to these unanswered questions, further investigations have been planned at the study site, through the adjustment of established interdisciplinary approaches [86] merging the hydrogeological (with emphasis on the utilization of multilevel piezometers; [87]), isotopic (mainly stable isotopes of oxygen and deuterium, and tritium), hydrochemical and biomolecular investigations usually applied in microbiological studies (e.g., denaturing gradient gel electrophoresis(DGGE) [88] and Next Generation Sequencing (NGS) [89]).

Supplementary Materials

The following are available online at https://www.mdpi.com/2073-4441/12/9/2511/s1, Table S1: Laboratory tests samples’ physico-chemical parameters; Table S2: Groundwater physico-chemical parameters.

Author Contributions

Conceptualization, M.B. and F.C.; formal analysis, E.S.; investigation, E.S.; supervision, M.B. and F.C.; validation, E.S.; visualization, E.S.; writing—original draft preparation, E.S.; writing—review and editing, E.S., M.B., M.P. and F.C. All authors have read and agreed to the published version of the manuscript.

Funding

This work has benefited from the equipment and framework of the COMP-HUB Initiative, funded by the ‘Departments of Excellence’ program of the Italian Ministry for Education, University and Research (MIUR, 2018–2022).

Acknowledgments

The authors would like to thank two anonymous reviewers for their valuable comments. We would also like to thank all the private owners within the study area for allowing us to sample their wells.

Conflicts of Interest

The authors declare no conflict of interest.

References

  1. Ward, M.H.; Jones, R.R.; Brender, J.D.; de Kok, T.M.; Weyer, P.J.; Nolan, B.T.; Villanueva, C.M.; van Breda, S.G. Drinking water nitrate and human health: An updated review. Int. J. Environ. Res. Public Health 2018, 15, 1557. [Google Scholar] [CrossRef] [PubMed] [Green Version]
  2. Tilman, D.; Balzer, C.; Hill, J.; Befort, B. Global food demand and the sustainable intensification of agriculture. Proc. Natl. Acad. Sci. USA 2011, 108, 20260–20264. [Google Scholar] [CrossRef] [PubMed] [Green Version]
  3. Bruinsma, J. World Agriculture: Towards 2015/2030: An FAO Perspective; Earthscan: London, UK, 2003. [Google Scholar]
  4. Steinfeld, H.; Gerber, P.; Wassenaar, T.; Castel, V.; Rosales, M.; Rosales, M.; de Haan, C. Livestock’s Long Shadow: Environmental Issues and Options; Food & Agriculture Organization: Rome, Italy, 2006. [Google Scholar]
  5. Bernot, M.J.; Dodds, W.K. Nitrogen retention, removal, and saturation in lotic ecosystems. Ecosystems 2005, 8, 442–453. [Google Scholar] [CrossRef]
  6. Mulholland, P.J.; Helton, A.M.; Poole, G.C.; Hall, R.O., Jr.; Hamilton, S.K.; Peterson, B.J.; Tank, J.L.; Ashkenas, L.R.; Cooper, L.W.; Dahm, C.N.; et al. Stream denitrification across biomes and its response to anthropogenic nitrate loading. Nature 2008, 452, 202–205. [Google Scholar] [CrossRef]
  7. Paerl, H.W. Controlling eutrophication along the freshwater–marine continuum: Dual Nutrient (N and P) reductions are essential. Estuaries Coasts 2009, 32, 593–601. [Google Scholar] [CrossRef] [Green Version]
  8. Han, H.; Allan, J.D. Uneven rise in N inputs to the Lake Michigan Basin over the 20th century corresponds to agricultural and societal transitions. Biogeochemistry 2012, 109, 175–187. [Google Scholar] [CrossRef]
  9. Directive 2000/60/EC of the European Parliament and of the Council Establishing a Framework for the Community Action in the Field of Water Policy; European Union: Brussels, Belgium, 2000; pp. 1–73.
  10. Directive 2006/118/EC of the European Parliament and of the Council on the Protection of Groundwater against Pollution and Deterioration; European Union: Brussels, Belgium, 2006; pp. 19–31.
  11. WWAP (United Nations World Water Assessment Programme). The United Nations World Water Development Report 2015: Water for a Sustainable World; UNESCO: Paris, France, 2015. [Google Scholar]
  12. Winter, T.C. Relation of streams, lakes, and wetlands to groundwater flow systems. Hydrogeol. J. 1999, 7, 28–45. [Google Scholar] [CrossRef]
  13. Holman, I.P.; Whelan, M.J.; Howden, N.J.K.; Bellamy, P.H.; Willby, N.J.; Rivas-Casado, M.; McConvey, P. Phosphorus in groundwater-an overlooked contributor to eutrophication? Hydrol. Process. 2008, 22, 5121–5127. [Google Scholar] [CrossRef]
  14. Smolders, A.J.P.; Lucassen, E.C.H.E.T.; Bobbink, R.; Roelofs, J.G.M.; Lamers, L.P.M. How nitrate leaching from agricultural lands provokes phosphate eutrophication in groundwater fed wetlands: The sulphur bridge. Biogeochemistry 2010, 98, 1–7. [Google Scholar] [CrossRef] [Green Version]
  15. Hart, M.R.; Quin, B.F.; Nguyen, M.L. Phosphorus runoff from agricultural land and direct fertilizer effects: A review. J. Environ. Qual. 2004, 33, 1954–1972. [Google Scholar] [CrossRef]
  16. Cassman, K.G.; Dobermann, A.; Walters, D.T. Agroecosystems, nitrogen-use efficiency, and nitrogen management. Ambio 2002, 31, 132–140. [Google Scholar] [CrossRef] [PubMed]
  17. Hutchins, M.G. What impact might mitigation of diffuse nitrate pollution have on river water quality in a rural catchment? J. Environ. Manag. 2012, 109, 19–26. [Google Scholar] [CrossRef] [PubMed] [Green Version]
  18. Ruehl, C.R.; Fisher, A.T.; Huertos, M.L.; Wankel, S.D.; Wheat, C.G.; Kendall, C.; Hatch, C.E.; Shennan, C. Nitrate dynamics within the Pajaro River, a nutrient-rich, losing stream. J. N. Am. Benthol. Soc. 2007, 26, 191–206. [Google Scholar] [CrossRef]
  19. Bouwer, H. Effect of Irrigated Agriculture on Groundwater. J. Irrig. Drain. Eng. 1987, 113, 4–15. [Google Scholar] [CrossRef]
  20. Bouwer, H.; Dedrick, A.R.; Jaynes, D.B. Irrigation management for groundwater quality protection. Irrig. Drain. Syst. 1990, 4, 375–383. [Google Scholar] [CrossRef]
  21. Postma, D.; Boesen, C.; Kristiansen, H.; Larsen, F. Nitrate reduction in an unconfined sandy aquifer: Water chemistry, reduction processes, and geochemical modeling. Water Resour. Res. 1991, 27, 2027–2045. [Google Scholar] [CrossRef]
  22. Baker, L.A. Introduction to nonpoint source pollution in the United States and prospects for wetland use. Ecol. Eng. 1992, 1, 1–26. [Google Scholar] [CrossRef]
  23. Chowdary, M.; Rao, N.H.; Sarma, P.B.S. Decision support framework for assessment of non-point-source pollution of groundwater in large irrigation projects. Agric. Water Manag. 2005, 75, 194–225. [Google Scholar] [CrossRef]
  24. Liao, L.; Green, C.T.; Bekins, B.A.; Böhlke, J.K. Factors controlling nitrate fluxes in groundwater in agricultural areas. Water Resour. Res. 2012, 48. [Google Scholar] [CrossRef] [Green Version]
  25. Ascott, M.J.; Gooddy, D.C.; Wang, L.; Stuart, M.E.; Lewis, M.A.; Ward, R.S.; Binley, A.M. Global patterns of nitrate storage in the vadose zone. Nat. Commun. 2017, 8, 1416. [Google Scholar] [CrossRef]
  26. Leng, G.; Huang, M.; Tang, Q.; Gao, H.; Leung, L.R. Modeling the Effects of Groundwater-Fed Irrigation on Terrestrial Hydrology over the Conterminous United States. J. Hydrometeorol. 2014, 15, 957–972. [Google Scholar] [CrossRef]
  27. Rotiroti, M.; Bonomi, T.; Sacchi, E.; McArthur, J.M.; Stefania, G.A.; Zanotti, C.; Taviani, S.; Patelli, M.; Nava, V.; Soler, V.; et al. The effects of irrigation on groundwater quality and quantity in a human-modified hydro-system: The Oglio River basin, Po Plain, northern Italy. Sci. Total Environ. 2019, 672, 342–356. [Google Scholar] [CrossRef] [PubMed]
  28. Fan, A.M.; Willhite, C.C.; Book, S.A. Evaluation of the nitrate drinking water standard with reference to infant methemoglobinemia and potential reproductive toxicity. Regul. Toxicol. Pharmacol. 1987, 7, 135–148. [Google Scholar] [CrossRef]
  29. Schullehner, J.; Hansen, B.; Thygesen, M.; Pedersen, C.B.; Sigsgaard, T. Nitrate in drinking water and colorectal cancer risk: A nationwide population-based cohort study. Int. J. Cancer 2018, 143, 73–79. [Google Scholar] [CrossRef] [PubMed]
  30. Council Directive 91/676/EEC of 12 December 1991 concerning the protection of waters against pollution caused by nitrates from agricultural sources. 91/676/EEC; European Union: Brussels, Belgium, 1991; pp. 1–8.
  31. Commission Implementing Decision of 3 November 2011 on Granting a Derogation Requested by Italy with regard to the Regions of Emilia Romagna, Lombardia, Piemonte and Veneto Pursuant to Council Directive 91/676/EEC Concerning the Protection of Waters against Pollution Caused by Nitrates from Agricultural Sources (Notified under Document C(2011) 7770); European Union: Brussels, Belgium, 2011; pp. 36–41.
  32. Commission Implementing Decision (EU) 2016/1040 of 24 June 2016 on Granting a Derogation Requested by Italian Republic with regard to the Regions of Lombardia and Piemonte pursuant to Council Directive 91/676/EEC Concerning the Protection of Waters against Pollution Caused by Nitrates from Agricultural Sources (Notified under Document C(2016) 3820); European Union: Brussels, Belgium, 2016; pp. 6–13.
  33. Lasagna, M.; De Luca, D.A.; Franchino, E. Nitrate contamination of groundwater in the western Po Plain (Italy): The effects of groundwater and surface water interactions. Environ. Earth Sci. 2016, 75. [Google Scholar] [CrossRef]
  34. Zanini, A.; Petrella, E.; Sanangelantoni, A.M.; Angelo, L.; Ventosi, B.; Viani, L.; Rizzo, P.; Remelli, S.; Bartoli, M.; Bolpagni, R.; et al. Groundwater characterization from an ecological and human perspective: An interdisciplinary approach in the Functional Urban Area of Parma, Italy. Rend. Lincei Sci. Fis. Nat. 2018, 30, 93–108. [Google Scholar] [CrossRef]
  35. Sacchi, E.; Acutis, M.; Bartoli, M.; Brenna, S.; Delconte, C.A.; Laini, A.; Pennisi, M. Origin and fate of nitrates in groundwater from the central Po plain: Insights from isotopic investigations. Appl. Geochem. 2013, 34, 164–180. [Google Scholar] [CrossRef]
  36. Soana, E.; Racchetti, E.; Laini, A.; Bartoli, M.; Viaroli, P. Soil budget, net export, and potential sinks of nitrogen in the lower oglio river watershed (Northern Italy). CLEAN Soil Air Water 2011, 39, 956–965. [Google Scholar] [CrossRef]
  37. Martinelli, G.; Dadomo, A.; De Luca, D.A.; Mazzola, M.; Lasagna, M.; Pennisi, M.; Pilla, G.; Sacchi, E.; Saccon, P. Nitrate sources, accumulation and reduction in groundwater from Northern Italy: Insights provided by a nitrate and boron isotopic database. Appl. Geochem. 2018, 91, 23–35. [Google Scholar] [CrossRef]
  38. Fantoni, G. Water management in Milan and Lombardy in medieval times: An outline. J. Water Land Dev. 2008, 12, 15–25. [Google Scholar] [CrossRef] [Green Version]
  39. Pinardi, M.; Soana, E.; Laini, A.; Bresciani, M.; Bartoli, M. Soil system budgets of N, Si and P in an agricultural irrigated watershed: Surplus, differential export and underlying mechanisms. Biogeochemistry 2018, 140, 175–197. [Google Scholar] [CrossRef]
  40. Viaroli, P.; Soana, E.; Pecora, S.; Laini, A.; Naldi, M.; Fano, E.A.; Nizzoli, D. Space and time variations of watershed N and P budgets and their relationships with reactive N and P loadings in a heavily impacted river basin (Po river, Northern Italy). Sci. Total Environ. 2018, 639, 1574–1587. [Google Scholar] [CrossRef]
  41. Laini, A.; Bartoli, M.; Castaldi, S.; Viaroli, P.; Capri, E.; Trevisan, M. Greenhouse gases (CO2, CH4 and N2O) in lowland springs within an agricultural impacted watershed (Po River Plain, northern Italy). Chem. Ecol. 2011, 27, 177–187. [Google Scholar] [CrossRef]
  42. Bartoli, M.; Racchetti, E.; Delconte, C.A.; Sacchi, E.; Soana, E.; Laini, A.; Longhi, D.; Viaroli, P. Nitrogen balance and fate in a heavily impacted watershed (Oglio River, Northern Italy): In quest of the missing sources and sinks. Biogeosciences 2012, 9, 361–373. [Google Scholar] [CrossRef] [Green Version]
  43. Racchetti, E.; Salmaso, F.; Pinardi, M.; Quadroni, S.; Soana, E.; Sacchi, E.; Severini, E.; Celico, F.; Viaroli, P.; Bartoli, M. Is flood irrigation a potential driver of river-groundwater interactions and diffuse nitrate pollution in agricultural watersheds? Water 2019, 11, 2304. [Google Scholar] [CrossRef] [Green Version]
  44. Amorosi, A.; Pavesi, M.; Ricci Lucchi, M.; Sarti, G.; Piccin, A. Climatic signature of cyclic fluvial architecture from the Quaternary of the central Po Plain, Italy. Sediment. Geol. 2008, 209, 58–68. [Google Scholar] [CrossRef]
  45. Chelli, A.; Zanini, A.; Petrella, E.; Feo, A.; Celico, F. A multidisciplinary procedure to evaluate and optimize the efficacy of hydraulic barriers in contaminated sites: A case study in Northern Italy. Environ. Earth Sci. 2018, 77, 246. [Google Scholar] [CrossRef]
  46. Guzzetti, F.; Marchetti, M.; Reichenbach, P.J.G. Large alluvial fans in the north-central Po Plain (Northern Italy). Geomorphology 1997, 18, 119–136. [Google Scholar] [CrossRef]
  47. Marchetti, M. Environmental changes in the central Po Plain (northern Italy) due to fluvial modifications and anthropogenic activities. Geomorphology 2002, 44, 361–373. [Google Scholar] [CrossRef]
  48. Kløve, B.; Ala-Aho, P.; Bertrand, G.; Boukalova, Z.; Ertürk, A.; Goldscheider, N.; Ilmonen, J.; Karakaya, N.; Kupfersberger, H.; Kvœrner, J.J.E.S.; et al. Groundwater dependent ecosystems. Part I: Hydroecological status and trends. Environ. Sci. Policy 2011, 14, 770–781. [Google Scholar] [CrossRef]
  49. Italian National Institute of Statistics. 6th General Census of Agriculture. 2010. Available online: http://dati-censimentoagricoltura.istat.it/Index.aspx. (accessed on 15 July 2020).
  50. Perego, A.; Basile, A.; Bonfante, A.; De Mascellis, R.; Terribile, F.; Brenna, S.; Acutis, M. Nitrate leaching under maize cropping systems in Po Valley (Italy). Agric. Ecosyst. Environ. 2012, 147, 57–65. [Google Scholar] [CrossRef]
  51. Peel, M.C.; Finlayson, B.L.; McMahon, T.A. Updated world map of the Köppen-Geiger climate classification. Hydrol. Earth Syst. Sci. 2007, 11, 1633–1644. [Google Scholar] [CrossRef] [Green Version]
  52. Köppen, W. Das Geographische System der Klimate; Gebrüder Borntraeger: Berlin, Germany, 1936; Volume 1, p. 46. [Google Scholar]
  53. Regione Lombardia. Banca Dati Geologica Sottosuolo. 2020. Available online: http://www.geoportale.regione.lombardia.it/metadati?p_p_id=PublishedMetadata_WAR_geoportalemetadataportlet&p_p_lifecycle=0&p_p_state=maximized&p_p_mode=view&_PublishedMetadata_WAR_geoportalemetadataportlet_view=editPublishedMetadata&_PublishedMetadata_WAR_geoportalemetadataportlet_uuid=%7BDAF98B21-3257-4D23-9D53-5AECC966D872%7D&_PublishedMetadata_WAR_geoportalemetadataportlet_editType=view&_PublishedMetadata_WAR_geoportalemetadataportlet_fromAsset=true&rid=local (accessed on 16 June 2020).
  54. Jenkins, D.; Connors, J.J.; Greenberg, A.E. Standard Methods for the Examination of Water and Wastewater, 15th ed.; American Public Health Association: Washington, DC, USA, 1981. [Google Scholar]
  55. Anderson, L.G.; Hall, P.O.J.; Iverfeldt, A.; Rutgers van der Loejf, M.M.; Sundby, B.; Westerlund, S.F.G. Benthic respiration measured by total carbonate production. Limnol. Oceanogr. 1986, 31, 319–329. [Google Scholar] [CrossRef] [Green Version]
  56. Lienig, D.; Golterman, H.L.; Clymo, R.S.; Ohnstadt, M.A.M. Methods for Physical and Chemical Analysis of Freshwaters—1BP Handbook No 8, 2nd ed.; Blackwell Scientific Publications: Oxford, UK; Edinburgh, UK; London, UK; Melbourne, Australia, 1978. [Google Scholar]
  57. Rodier, J.; Geoffray, C.; Rodi, L. L’analyse de l’eau: Eaux Naturelles, Eaux Résiduaires, eau de mer: Chimie, Physico-Chimie, Bactériologie, Biologie; Dunod: Paris, France, 1975. [Google Scholar]
  58. Eghball, B.; Wienhold, B.; Gilley, J.E.; Eigenberg, R. Mineralization of manure nutrients. J. Soil Water Conserv. 2002, 57, 470–473. [Google Scholar]
  59. Mantovi, P.; Fumagalli, L.; Beretta, G.P.; Guermandi, M. Nitrate leaching through the unsaturated zone following pig slurry applications. J. Hydrol. 2006, 316, 195–212. [Google Scholar] [CrossRef]
  60. Boschetti, T.; Falasca, A.; Bucci, A.; De Felice, V.; Naclerio, G.; Celico, F. Influence of soil on groundwater geochemistry in a carbonate aquifer, southern Italy. Int. J. Speleol. 2014, 43, 79–94. [Google Scholar] [CrossRef]
  61. Borch, T.; Kretzschmar, R.; Kappler, A.; Cappellen, P.V.; Ginder-Vogel, M.; Voegelin, A.; Campbell, K. Biogeochemical redox processes and their impact on contaminant dynamics. Environ. Sci. Technol. 2010, 44, 15–23. [Google Scholar] [CrossRef]
  62. Christensen, T.H.; Bjerg, P.L.; Banwart, S.A.; Jakobsen, R.; Heron, G.; Albrechtsen, H.-J. Characterization of redox conditions in groundwater contaminant plumes. J. Contam. Hydrol. 2000, 45, 165–241. [Google Scholar] [CrossRef]
  63. Scheidegger, A.; Sparks, D.J.S.S. A critical assessment of sorption-desorption mechanisms at the soil mineral/water interface. Soil Sci. 1996, 161, 813–831. [Google Scholar] [CrossRef]
  64. Cornelis, J.T.; Delvaux, B.; Georg, R.B.; Lucas, Y.; Ranger, J.; Opfergelt, S. Tracing the origin of dissolved silicon transferred from various soil-plant systems towards rivers: A review. Biogeosciences 2011, 8, 89–112. [Google Scholar] [CrossRef] [Green Version]
  65. Song, Z.; Wang, H.; Strong, P.J.; Shan, S. Increase of available soil silicon by Si-rich manure for sustainable rice production. Agron. Sustain. Dev. 2014, 34, 813–819. [Google Scholar] [CrossRef] [Green Version]
  66. Wick, K.; Heumesser, C.; Schmid, E. Groundwater nitrate contamination: Factors and indicators. J. Environ. Manag. 2012, 111, 178–186. [Google Scholar] [CrossRef] [PubMed] [Green Version]
  67. Kirchmann, H.; Hansen, J.; Henriksen, K. A 3-year N balance study with aerobic, anaerobic and fresh 15N-labelled poultry manure. Nitrogen Org. Wastes 1989, 113–125. [Google Scholar] [CrossRef]
  68. Finck, A.; Hagin, J.; Tucker, B. Fertilization of Dryland and Irrigated Soils (Advanced Series in Agriculture Science 12); Springer: Berlin, Germany, 1982. [Google Scholar]
  69. Estavillo, J.M.; Merino, P.; Pinto, M.; Yamulki, S.; Gebauer, G.; Sapek, A.; Corré, W. Short term effect of ploughing a permanent pasture on N2O production from nitrification and denitrification. Plant Soil 2002, 239, 253–265. [Google Scholar] [CrossRef]
  70. Jabloun, M.; Schelde, K.; Tao, F.; Olesen, J.E. Effect of temperature and precipitation on nitrate leaching from organic cereal cropping systems in Denmark. Eur. J. Agron. 2015, 62, 55–64. [Google Scholar] [CrossRef]
  71. Hess, L.J.T.; Hinckley, E.-L.S.; Robertson, G.P.; Matson, P.A. Rainfall intensification increases nitrate leaching from tilled but not no-till cropping systems in the U.S. Midwest. Agric. Ecosyst. Environ. 2020, 290, 106747. [Google Scholar] [CrossRef]
  72. Zilio, M.; Motta, S.; Tambone, F.; Scaglia, B.; Boccasile, G.; Squartini, A.; Adani, F. The distribution of functional N-cycle related genes and ammonia and nitrate nitrogen in soil profiles fertilized with mineral and organic N fertilizer. PLoS ONE 2020, 15, e0228364. [Google Scholar] [CrossRef]
  73. Emerson, K.; Russo, R.C.; Lund, R.E.; Thurston, R.V. Aqueous ammonia equilibrium calculations: Effect of pH and temperature. J. Fish. Res. Board Can. 1975, 32, 2379–2383. [Google Scholar] [CrossRef]
  74. Spalding, R.F.; Exner, M.E. Occurrence of nitrate in groundwater—A review. J. Environ. Qual. 1993, 22, 392–402. [Google Scholar] [CrossRef]
  75. Strayer, R.F.; Lin, C.J.; Alexander, M. Effect of simulated acid rain on nitrification and nitrogen mineralization in forest soils. J. Environ. Qual. 1981, 10, 547–551. [Google Scholar] [CrossRef]
  76. Curtin, D.; Campbell, C.A.; Jalil, A. Effects of acidity on mineralization: pH-dependence of organic matter mineralization in weakly acidic soils. Soil Biol. Biochem. 1998, 30, 57–64. [Google Scholar] [CrossRef]
  77. Paul, E. Soil Microbiology, Ecology and Biochemistry; Academic Press: Cambridge, MA, USA, 2014. [Google Scholar]
  78. Lozovik, P.A. Contribution of organic acid anions to the alkalinity of natural humic water. J. Anal. Chem. 2005, 60, 1000–1004. [Google Scholar] [CrossRef]
  79. Guenzi, W.D.; Beard, W.E.; Watanabe, F.S.; Olsen, S.R.; Porter, L.K. Nitrification and denitrification in cattle manure-amended soil. J. Environ. Qual. 1978, 7, 196–202. [Google Scholar] [CrossRef]
  80. Chang, C.; Sommerfeldt, T.G.; Entz, T. Soil Chemistry after Eleven Annual Applications of Cattle Feedlot Manure. J. Environ. Qual. 1991, 20, 475–480. [Google Scholar] [CrossRef]
  81. Perego, A.; Sanna, M.; Giussani, A.; Chiodini, M.E.; Fumagalli, M.; Pilu, S.R.; Bindi, M.; Moriondo, M.; Acutis, M. Designing a high-yielding maize ideotype for a changing climate in Lombardy plain (northern Italy). Sci. Total Environ. 2014, 499, 497–509. [Google Scholar] [CrossRef] [PubMed]
  82. Reithmaier, G.-M.S.; Knorr, K.-H.; Arnhold, S.; Planer-Friedrich, B.; Schaller, J. Enhanced silicon availability leads to increased methane production, nutrient and toxicant mobility in peatlands. Sci. Rep. 2017, 7, 8728. [Google Scholar] [CrossRef] [Green Version]
  83. Schaller, J.; Frei, S.; Rohn, L.; Gilfedder, B.S. Amorphous silica controls water storage capacity and phosphorus mobility in soils. Front. Environ. Sci. 2020, 8. [Google Scholar] [CrossRef]
  84. Petrella, E.; Naclerio, G.; Falasca, A.; Bucci, A.; Capuano, P.; Felice, V.; Celico, F. Non-permanent shallow halocline in a fractured carbonate aquifer, southern Italy. J. Hydrol. 2009, 373, 267–272. [Google Scholar] [CrossRef]
  85. Petrella, E.; Celico, F. Mixing of water in a carbonate aquifer, Southern Italy, analysed through stable isotope investigations. Int. J. Speleol. 2013, 42, 25–33. [Google Scholar] [CrossRef] [Green Version]
  86. Bucci, A.; Naclerio, G.; Allocca, V.; Celico, P.; Celico, F. Potential use of microbial community investigations to analyse hydrothermal systems behaviour: The case of Ischia Island, Southern Italy. Hydrol. Process. 2011, 25, 1866–1873. [Google Scholar] [CrossRef]
  87. Rizzo, P.; Petrella, E.; Bucci, A.; Salvioli-Mariani, E.; Chelli, A.; Sanangelantoni, A.; Raimondo, M.; Quagliarini, A.; Celico, F. Studying hydraulic interconnections in low-permeability media by using bacterial communities as natural tracers. Water 2020, 12, 1795. [Google Scholar] [CrossRef]
  88. Crescenzo, R.; Mazzoli, A.; Cancelliere, R.; Bucci, A.; Naclerio, G.; Baccigalupi, L.; Cutting, S.M.; Ricca, E.; Iossa, S. Beneficial effects of carotenoid-producing cells of Bacillus indicus HU16 in a rat model of diet-induced metabolic syndrome. Benef. Microbes 2017, 8, 1–10. [Google Scholar] [CrossRef] [PubMed] [Green Version]
  89. Mancabelli, L.; Milani, C.; Lugli, G.A.; Fontana, F.; Turroni, F.; van Sinderen, D.; Ventura, M. The impact of primer design on amplicon-based metagenomic profiling accuracy: Detailed insights into bifidobacterial community structure. Microorganisms 2020, 8, 131. [Google Scholar] [CrossRef] [PubMed] [Green Version]
Figure 1. Schematic map of the study area (a) Location of monitoring and sampling points; (b) Geological map with digital terrain model of the Lombardy Region. AA’ and BB’ indicate the cross-sections.
Water 12 02511 g001
Figure 2. Agricultural practices in our study area: (a) maize cultivation on permeable soils; (b) flood irrigation over maize fields; (c) manure spreading after crops harvesting.
Water 12 02511 g002
Figure 3. Laboratory tests flow chart.
Water 12 02511 g003
Figure 4. (a) Geological cross-section AA’; (b) Geological cross-section BB’. The location of both sections is shown in Figure 1b.
Water 12 02511 g004aWater 12 02511 g004b
Figure 5. Net groundwater flow during irrigation (July 2019) (a) and non-irrigation (December 2019) (b) periods.
Water 12 02511 g005
Figure 6. Groundwater level fluctuations in wells p4 and p8 (markers with straight lines) and monthly precipitation from the Goito meteorological station (bars). The shaded area includes the irrigation period.
Water 12 02511 g006
Figure 7. Temporal variations in physico-chemical parameters of the water percolating in the four columns. Six consecutive samples were collected every 20 min after the first leached water (approximately one hour after the start of the test).
Water 12 02511 g007
Figure 8. Physico-chemical parameters analyzed during the soil suspension tests. Means and standard deviations (n = 3) are presented.
Water 12 02511 g008
Figure 9. Main physico-chemical parameters of groundwater in the study site.
Water 12 02511 g009
Figure 10. (a) Distribution of nitrate concentrations in the northern part of the study area (November 2019); (b) distribution of silica concentrations in the northern part of the study area (November 2019).
Water 12 02511 g010

