Review

Resilience Viewed through the Lens of Climate Change and Water Management

Geography and Environment, Loughborough University, Loughborough LE11 3TU, UK
Water 2020, 12(9), 2510; https://doi.org/10.3390/w12092510
Submission received: 8 August 2020 / Revised: 1 September 2020 / Accepted: 3 September 2020 / Published: 9 September 2020
(This article belongs to the Special Issue Perspectives on River Catchment Resilience)

Abstract

:
Resilience is not a new idea but there has been an upsurge in efforts to operationalize the concept within water management. This review begins with a synopsis of related themes around persistent and emerging pressures on freshwaters; environmental thresholds (or tipping points); ‘safe’ operating conditions; multiple stable states; regime shifts. A case is made for viewing and managing the resilience of water systems at nested scales. Indicators are needed to track evolving climate risks as well as to measure socio-ecological responses. Catchment properties can identify those river systems that are more or less likely to return to a pre-disturbance state; resilience further depends on institutional and social landscapes. Ideally, allied notions of resistance and reliability are applied alongside resilience to broaden the portfolio of adaptation measures. Water managers would also benefit from more consistent use of resilience terminology; incentives to build back better after catastrophes; strategic monitoring of incipient threats and tipping points; availability of long-term adaptation indicators; coordinated efforts to reduce non-climatic pressures on freshwaters (especially in headwaters); evidence-based, practical guidance on adaptation measures that build resilience.

1. Introduction

Resilience may be defined as “…the capacity of a system to absorb disturbance and reorganize so as to retain essentially the same function, structure, and feedbacks—to have the same identity. Put more simply, resilience is the ability to cope with shocks and keep functioning in much the same kind of way” [1] (p. 3).
The concept of resilience has been around for a long time. During the 1970s, Lovelock used Daisyworld as a simple metaphor for Earth’s self-regulating biosphere [2,3]. On Daisyworld, living and non-living elements achieve homeostasis (i.e., quasi-equilibrium) despite increasing stress. In the classic version of the model, two species of daisy govern the solar energy balance via their differential heat preferences and ability to reflect sunlight from the planet’s surface. They enable life to thrive over a range of luminosities as their respective areas expand and contract (Figure 1a). However, an extinction point is reached (luminosity ~ 1.5) when the incoming solar radiation is so powerful that even the hardiest daisy is unable to survive. Eventually, life is extinguished. Temperatures then climb exponentially and finally match those of a lifeless planet (Figure 1b).
More elaborate Daisyworlds have other varieties of flower, predator-prey relations, genetic mutations, adaptations to prevailing conditions, unsteady population dynamics, and weathering processes (as a climate control) [4,5]. However, the tough message from Daisyworld is that even a biodiverse planet has limits to how much stress can be absorbed before a tipping point is crossed and abrupt environmental change follows. Moreover, with just a few parameters and the right circumstances, chaotic behavior can emerge from the system [6].
Thresholds and “safe” operating ranges lie at the heart of resilience concepts. The limit (singular) to life on Daisyworld is easy to define because there is only one pressure (incoming solar radiation), only two species (black and white daisies), and only one “health” indicator (area of land occupied by daisies). Unfortunately, life on Earth is not so straightforward because of the myriad natural and human pressures, applied to complex social ecosystems, connected by powerful feedback mechanisms. Natural systems also respond in non-linear, chaotic ways to evolving human pressures [8,9] and there can be alternative stable states across climate gradients [10].
Specifying safe limits is challenging because there are two sets of unknowns. We are essentially asking “resilience of what to what?” [11]. We would also like to know which physical traits enable one system to absorb more disturbance than another. For Daisyworld, resilience is determined by the diversity of species. For Earth, what other measurable attributes could predict coping ranges or detect the approach of a critical threshold? Perhaps there are multiple alternative steady states rather than a single zone of homeostasis? How then can resilience theory move into practice?
This review examines questions of resilience through the lens of climate change and water management. The critique is as much about the theoretical as the practical aspects of resilience thinking. Section 2 starts with a summary of concepts then lays out the key attributes of resilience, from which Section 3 illustrates nested scales. Section 4 gives examples of various indices for monitoring and modelling resilience, from which Section 5 links to natural and socio-economic properties, favoring higher resilience to climate change. Section 6 demonstrates resilience in practice at the river catchment scale, given the goal of maintaining or even improving functions/levels of service, despite uncertain climate risks. Section 7 closes the review with some cautionary remarks about the limits to resilience concepts and offers a few recommendations, plus suggestions for further research.

2. Resilience Concepts and Attributes

Concepts of resilience and vulnerability have gained considerable traction over the past decade. This reflects growing appreciation of the need to adapt to climate variability and change, despite uncertainty in the outlook. Research initiatives, such as the UK Climate Resilience Programme are also driving multi-disciplinary collaborations and engagement with practitioners. Ten years ago, there were barely 50 peer-reviewed scientific articles on resilience and vulnerability, compared with the 300 to 450 published in 2019 (Figure 2). Their comparative volume suggests that the scientific community is better at (or more interested in) identifying the vulnerability of river catchments than advancing solutions (through improved resilience).
Various resilience papers are attracting thousands of citations (e.g., in [12,13,14,15,16]) as they reflect concerns about the multiple interacting threats to freshwater biodiversity (e.g., [17,18,19,20]). Some stress the connectivity and potential for non-linear change: “Resilience thinking emphasizes the interplay of gradual change with sudden disturbances, feedbacks, alternative stable states and regime shifts, cross-scale relationships and adaptive cycles” [21] (p. 549). The most concise view of resilience is simply an “ability to thrive under change” [22] (p. 1). Others question whether resilience is the “new sustainability” [1], just another fad [23] or a “complementary” approach to vulnerability [24].
The above frame resilience is a return to an equilibrium, an ability to keep the same function, or the means to bounce back. There are related ideas of self-organizing behavior, a property that enables a system to absorb disturbance, re-organize and keep functioning as before [1]—just as in Daisyworld. However, some would see the recovery of the status quo after a disruption as an unsatisfactory outcome. In military circles and in disaster risk reduction, resilience is interpreted as the opposite to vulnerability because it is the ability to bounce forward or to move on. From this perspective “…the ‘bounce forward’ notion encapsulates social engineering, if not community agency, in change processes within the context of new realities brought about by a disaster…” [25] (p. 419).
Here, “new realities” are viewed as a catalyst for change that can be transformative. Following a catastrophe, such as an earthquake or tsunami—and once the immediate humanitarian response is over—there are opportunities to “build back better” or “build back safer”. This might include improving building standards or re-siting critical infrastructure in less exposed places during post-disaster reconstruction and recovery (e.g., in [26,27]). Such concepts are being embraced within the context of urban (re)design and adaptations in the wake of flooding. For instance, following extensive winter flooding in 2015/16, the UK National Flood Resilience Review called on utilities to improve interconnectivity and rerouting capabilities to enable continuity of essential services despite loss of assets. Other initiatives included grants for property owners wanting to deploy protective measures, such as temporary flood boards and raised electric sockets. Other types of resilience-building activities are covered by Section 6.
In summary, resilience concepts are helpful in defining: (a) persistent and emerging threats; (b) human and environmental thresholds (or tipping points) for safe conditions; (c) equilibrium states; (d) catchment properties that favor recovery to the pre-stress state after disturbance. The next section demonstrates the multi-scale nature of resilience and the need for a nested approach.

3. Resilience Thinking from Global to Local Scales

Resilience concepts apply to human and natural systems alike. For instance, urban drainage networks and transport networks that continue to function despite surface water flooding are said to be resilient [28,29]. Likewise, water supply networks and operating rules that balance water demand and supply under severe historic drought conditions are expected to be more resilient to future climate change [30]. Arguably, water is the “common currency” or “master variable” that enables a more holistic understanding and management of resilience in coupled human-natural systems [24].
Globally, human water security and biodiversity are threatened by catchment disturbance, pollution, water resource development, and biotic factors (such as spread of non-native species). An estimated 80% of humanity is exposed to high levels of threat to water security, whereas 65% of water-dependent habitats have been classified as moderately to highly threatened [31] (p. 555). Disturbances may be gradual changes, abrupt shocks, or surprises; they may be weak or strong. Ideally, pressures would be managed at source rather than via costly remediation measures. However, threats to freshwaters are intensifying and proliferating; many are directly or indirectly related to climate change (e.g., expanding hydropower, freshwater salinization, invasive species, pathogens, and eutrophication) [19].
Regionally, it is possible to build water resilience to hazards, such as meteorological drought. For example, water harvesting to upgrade rain-fed agriculture, with in situ water conservation strategies (including terracing and pond storage) plus earlier planting, the addition of organic matter, minimum tillage and mulching, could all improve soil moisture and agricultural productivity [32,33]. New crop varieties that have lower energy inputs and produce more crop per drop of water are also needed [34]; supplementary irrigation may play a role too [33]. On the other hand, historic over-drafting and/or the contamination of groundwater is a global concern that weakens the resilience of water users to future droughts [35]. Hence, some contend that enhanced resilience should feature alongside increased productivity as a development objective [36].
Research into catchment scale resilience as a unifying concept for water management is harder to find. Some studies use levels of chaos (or entropy—the lack of predictability, degree of disorder, or randomness in a system) in mean annual runoff (or “sustainability” of water resources) as a surrogate for catchment resilience [37]. Others cite differences between observed and simulated streamflow records as evidence of a change in state in catchments (i.e., a shift to a new equilibrium). Such transitions have been reported for diverse climates following decades of drought in South-West Australia [38] and after the major expansion of field drainage systems in Ireland [39] (Figure 3). Evidence of multiple stable hydrological states (attractors) has also been reported in the form of bimodal distributions of water table elevations [40]. The attractor concept is helpful because it prompts the questions: How severe or how long must a disturbance be to bring about a shift in stable state?
Resilience thinking can also be used to evaluate differential impacts of water use at very localized scales. For example, one study examined the effects of agricultural water withdrawals on macroinvertebrate communities in the Umatilla catchment, Oregon [41]. High intensity but short-lived (<2 months) withdrawals altered the relative abundance of macroinvertebrate communities, but proportions of different feeding groups were unchanged. However, when discharge reductions exceeded 90%, synergistic flow-thermal effects transformed the community structure; by this stage, a coping threshold had been crossed, leading to a change of state.
Other field studies support the view that macro-invertebrates can be resilient to short-lived, historic droughts but a community may only recover from supra-seasonal low-flows once the aquifer, channel margins and hyporheic zones are fully saturated [42]. This highlights the importance of environmental heterogeneity and physical connectivity for refugia, dispersal, recolonization, and recruitment within resilient river ecosystems [43]. Unfortunately, the development of indices to predict invertebrate responses to flow variations is hampered by mismatches between spot biological samples (typically collected in autumn and spring) and continuous river flow records for different sites and seasons [44]. Efforts are also confounded by local human modifications to channel morphology and habitats [45].
The possibility of multiple stable states has long been recognized by engineers and fluvial geomorphologists. Pioneering researchers referred to the hydraulic geometry of river channels as a “quasi-equilibrium” form [46]—the most probable state given the opposing forces of scour and deposition. Channel form is dynamic because of variations in the magnitude-frequency of discharges, sediment load and particle size distributions, channel boundary materials, in-stream vegetation, and valley slope. Hence, human modifications to natural processes may lead to adjustments in channel morphology. For example, changes to discharge and sediment regimes below an impoundment can trigger complex responses in channel geometry that eventually relax to a new equilibrium [47]. The transition from an initial quasi-equilibrium form to the imposed equilibrium form could take decades to accomplish depending on the new flow/sediment regime [48].
The following section gives examples of indices and tools for defining thresholds as well as for anticipating and detecting changes in state due to climate pressures on river catchments.

4. Indices for Monitoring and Modelling Catchment Resilience

Indices for monitoring catchment resilience to climate change fall into two categories: those that track emergent climate risks and opportunities; those that measure socio-ecological outcomes. Models are also used to quantify aspects of system resilience under a range of exogenous pressures with and without management measures. All these areas of activity are discussed below.
The UK is relatively well-endowed with long-term climate records and assessments, such as the Met Office annual State of the UK Climate report [49]. These provide regular updates on trends in mean temperatures, precipitation totals, sunshine hours, wind speed and sea level, as well as analysis of changes in weather extremes based on observational data. Even so, the second UK Climate Change Risk Assessment (CCRA2) identified significant data gaps that hinder national risk assessment and adaptation planning [50]. There are also issues of data incompleteness, incompatibility of formats and commercialization of publicly funded data. Furthermore, even simple metrics of climate change cannot be used uncritically due to embedded assumptions about underlying physical processes or the decision-making context [51].
Table 1 provides examples of data gaps mapped to the information needs of the CCRA2. From the point of view of managing climate threats to natural systems, the lack of open data on non-climatic pressures and agricultural practices are probably most significant. As will be discussed later, reducing co-stressors from water quality and habitat changes are ways of enhancing the resilience of catchments to climate change, but long-term data are needed to monitor trade-offs and the efficacy of measures [52] as well as to target interventions [53]. Likewise, more information is required on asset condition and performance to manage threats to infrastructure. Access is improving to data and tools for water management thanks to knowledge exchange hubs, such as the Environmental Information Platform. Similarly, the Environmental Change Network provides data on a few climate change indicators (abundance/flight times of two species of butterfly and moth). This facility replaced 34 climate change indicators published by the Department of the Environment, Transport and the Regions [54] but unfortunately was discontinued in 2003 [55]. The UK Benchmark Network continues to deliver long-term river flow series for trend detection in about 90 catchments with near natural conditions and good-quality gauge records [56]. Other important data assets now have open access through the Defra Data Services Platform.
The Adaptation Sub Committee (ASC) [57] uses indicators for exposure and vulnerability to flooding, risks to the natural and built environment, people and infrastructure (Table 2). Underlying data are collated from a range of sources, including Defra, the Environment Agency, Natural England and water companies. In 2019, the ASC had ~100 indicators, of which 35 were subjected to review and update [58]. Two of the 2019 indicator sets explicitly measure resilience, namely: (1) size and spatial configuration of woodland patches within the landscape; (2) reported and forecasted spend on resilience by water companies (Figure 4). The latter shows rising capital investment, albeit driven by a few companies to manage extreme (1 in 500 years) droughts. In the 2019 water planning cycle for 2025–2050, companies estimated that the cost of proactive resilience improvements would be between GBP 18 billion and GBP 21 billion, compared with costs of depending on emergency measures for severe droughts of GBP 25 billion to GBP 40 billion. In this case, the economic case for resilience measures is strong.
There are established levels of service criteria for water supply systems subject to peak demands, drought, and other weather-related shocks. The mean and variance of system outputs are simple metrics, but these are incomplete descriptors of behavior under stressed conditions. When an operational target or standard has been violated, performance can be judged in terms of: (a) how often the system fails (reliability); (b) how quickly the system recovers after a failure (resilience); (c) how significant the failures are in terms of their consequences (vulnerability) [59]. Here, resilience is being defined as the length of time taken by a system to recover after a period of unsatisfactory performance.
Recovery time depends on the intrinsic properties of the system and management objectives, as well as on the frequency, severity, and duration of the exogenous pressures. For example, positive phases of the North Atlantic Oscillation (natural variability) and projected climate change (anthropogenic) increase both the severity and duration of droughts in NE England and are expected to lower the resilience of Yorkshire’s water supply system [60]. The extent to which various options manage “tolerable risk” can be tested using models of water systems exposed to very large ensembles of climate scenarios [61]. Analytical methods also help to evaluate options for managing urban floods [62], or even to measure resilience to flooding at property scales [63]. Sometimes system breaking points are revealed. For instance, the urban drainage system of Kampala, Uganda experiences a disproportionately high degradation of functionality (i.e., loss of conveyance of flood volume) when there are ~20% random failures in sewer links, indicating low resilience of the existing sewer network [64]. In this case, investment in distributed storage was shown to be more effective than centralized stormwater storage solutions.
Others apply stochastic forcing to hydrological models to investigate both the number of (stable or temporary) states and the circumstances under which a system might switch between these states (e.g., in [40,65]). This can identify the forcing and/or changes in catchment properties that could lead to an irreversible shift in conditions. For instance, water tables may not return to pre-drought levels (steady state 1) even if rainfall is the same as before (Figure 5). This could be due to a host of factors including greater reliance on groundwater during the drought; associated changes in land cover/use; impacts of wildfire on infiltration; vegetation dieback; irreversible loss of glacier/snowpack; permanent disconnection of hillslope-surface drainage networks, or alteration of hydrogeological pathways [66]. This kind of change in state has been observed in the Colorado River Basin where, after nine years of drought and groundwater depletion, “this strategic reserve is considered largely unrecoverable by natural means” [67] (p. 5910).
Detection of a hydroclimatic threshold that results in the breakdown of ecosystem resilience to drought would potentially enable prediction of abrupt shifts in biomes under climate change. Water use efficiency (WUE) (the ratio of above ground net primary productivity to evapotranspiration) has been proposed as an indicator of functional response [68]. Research shows that WUE is similar across biomes ranging from grassland to forest but tends to increase under drier conditions. However, following sustained drought, a maximum WUE is reached, beyond which dieback and biome reorganization occurs. The maximum value for Australian grasslands is thought to be WUE ~1.01. The “tipping point” concept has also been applied to large-scale components of the Earth’s system. For example, one meta-analysis tabulated 15 policy-relevant tipping elements in the global climate system and ranked the associated threats [8]. Expert elicitation revealed the greatest concern about potential irreversible melting of the Greenland Ice Sheet at a threshold of ~3 °C local warming, eventually contributing up to 3 m to global mean sea level.

5. Properties that Contribute to Catchment Resilience

Evidence of the natural and socio-economic properties that contribute to catchment resilience comes from long-term environmental reconstruction and monitoring, model analysis, field experiments and semi-structured interviews. These lines of enquiry are exemplified below.
Put simply, the most climate resilient catchments and habitats are likely to be those with least the human modification [69]. Nonetheless, some “natural” catchments are more resilient than others, and some circumstances where interventions manage climate risks better than others. Paleo-environmental reconstructions provide analogues of how freshwater systems functioned under stress prior to human-induced climate and catchment change. For example, lake sediments in Victoria, Australia generally reveal muted responses in wetland conditions despite marked climate variations before European settlement [70]. However, because of major water abstraction, widespread catchment disturbance and degradation within the Murray–Darling Basin, modern wetlands are now functioning outside their range of natural variability, limiting their capacity to recover from the recent “Millennium Drought”. Others have shown that the relative vulnerability of individual (fish) species to drought in the basin can be ranked from their feeding, life cycle and physiological traits [71].
Paleolimnological studies in the English Lake District provide similar evidence of heightened sensitivity of phytoplankton communities to recent climate fluctuations because of eutrophication [72]. The enrichment of the North and South Basins of Lake Windermere followed rapid population growth in the area, sewage disposal, intensification of agriculture and atmospheric deposition of nitrogen. Further investigation revealed that lake morphometry, catchment and landscape factors influence relationships between climate, land use and algae communities [73]. Reconstructions show seasonally dependent responses with rises in summer filamentous algae coinciding with the advent of wastewater treatment and disposal; increases in siliceous algae align with changes in winter rainfall/hydraulic flushing. The authors of both studies advocate nutrient management as a strategy for building resilience to future climate change.
Case studies show the nuanced response of individual catchments subject to multiple local pressures. However, there is a limit to which site-specific findings can be extrapolated to other locations. Hence, national and international typologies are being developed to improve understanding of the predominant controls on hydrological regimes and thereby the relative sensitivity and resilience of freshwater ecosystems to climate change (see [74,75,76]). For example, the North-Watch program examined the extent to which 10 catchments from higher mid-latitudes resist changes in rainfall with respect to river flow [77]. The least resilient (cold) catchments were found to have low storage and strong seasonality in precipitation/snowmelt. Even small changes in air temperature may cause a switch in state from a snowmelt-runoff to precipitation-runoff regime [78].
Many studies highlight the value of natural and managed water stores in modulating extreme weather and climate change (e.g., in [79,80,81,82]). Catchments with higher storage (e.g., with extensive wetlands, lakes, and/or permeable geology) are generally more resilient to variations in the seasonal cycle of precipitation because of their longer “memory”, but are less resilient to inter-annual and inter-seasonal changes than rivers with lower mean discharges. Stream chemistry tracers can indicate water source and hydrological pathway resilience to droughts of differing duration and severity [83,84]. Similarly, spatial variations in soil moisture may reveal resistance and resilience to drought by the extent of hydrological dis-connectivity of the river network from catchment units [85]. Hence, catchment resilience depends variously on the characteristics of the climate signal, amount/type of storage, hydrogeological and landscape features (s).
Objective classification of river flow regimes and sensitivity testing can further expose differential reactions to climate change. For example, marked variations in flood-risk response surfaces are discerned between catchment types when subjected to the same seasonal rainfall/temperature changes [86] (Figure 6, below). The ratio of the mean interarrival time of runoff-producing precipitation events and the mean catchment response time can be used to discriminate the relative sensitivity of persistent and erratic flow regimes to interannual changes in climate [87]. Others relate the hydrological response of rivers to catchment properties and show that annual precipitation, river channel slope, drainage density, and alluvial deposits were key predictors of the sensitivity of climate-driven flood signatures [88].
It is important to note that resilience depends as much on the institutional/social landscape as it does on the natural properties of catchments. Features that build the resilience of social-ecological systems (SES) are: “vision, leadership, and trust; enabling legislation that creates social space for ecosystem management; funds for responding to environmental change and for remedial action; capacity for monitoring and responding to environmental feedback; information flow through social networks; the combination of various sources of information and knowledge; and sense-making and arenas of collaborative learning for ecosystem management” [16] (p. 55).
The above attributes essentially describe organizations that are adaptively managing emergent climate risks and opportunities [89]. There may be specific policy interventions to strengthen the enabling environment and thereby community resilience. For instance, building the institutional capacity of barangays (local administrative units) in the Laguna Lake region of the Philippines improved community resilience to flood disasters by focusing attention on both ex ante and ex post measures [90]. Barangays must now formulate and implement their own disaster risk reduction measures, such as regular awareness raising campaigns (before a disaster) and by providing training and equipment to volunteers who respond (after a disaster). Conversely, the prospect of transformative change is hindered where there are multiple and contested water resource uses, competing value systems, diverse decision makers and rules [91]. The likelihood of SES collapse increases where there are selfish elites, limited capacity for anticipatory actions and centralized, complex and/or rigid governance systems [92].

6. Applying Catchment Resilience Concepts in Practice

Now for the most challenging and final part of this review—how to translate resilience theory, monitoring and modelling into practice? There are a few examples:
For long-lived infrastructure decisions, [93] (p. 240) recommends: (i) selecting “no-regret” strategies that yield benefits even in absence of climate change; (ii) favoring reversible and flexible options; (iii) incorporating “safety margins” in new investments; (iv) promoting soft adaptation strategies; (v) reducing decision time horizons.
For river restoration, the authors in [94] call for overall enhancement of connectivity of fluvial processes and between habitats. Others stipulate success criteria [95]: First, an ecological river restoration project should be designed to achieve a more dynamic, healthy river than already exists at the site. Second, the river’s ecological condition must be measurably improved. Third, the river system must be more self-sustaining and resilient to external perturbations so that only minimal follow-up maintenance is needed. Fourth, during the construction phase, no lasting harm should be inflicted on the ecosystem. Fifth, both pre- and post-assessment must be completed, and the data made publicly available.
For enhancing the resilience of ecosystem services, the authors in [96] identify seven policy-relevant principles: (P1) maintain diversity and redundancy, (P2) manage connectivity, (P3) manage slow variables and feedbacks, (P4) foster an understanding of SES as complex adaptive systems, (P5) encourage learning and experimentation, (P6) broaden participation, and (P7) promote polycentric governance systems.
For improving the resilience of small water bodies and repairing their natural functioning, the authors in [97] (p. 1611) propose a three-tiered approach (Figure 7), involving: (1) restoration of channel hydromorphological dynamics; (2) restoration and management of the riparian zone, and (3) management of activities in the wider catchment.
Guiding principles are needed to shape policies and priorities. Some of the above manifest strategies for “buying time” for natural systems by reducing harms that are not linked to climate [69]. However, more is needed on actionable measures. Although there have been calls for dedicated field and modelling experiments [98], much remains to be done to develop evidence-based field manuals for those who are implementing site-specific, resilience-building measures. Experience can also be gained through role play and simulation of actual water supply and planning measures under severe (historic drought) conditions [99]. These can raise awareness of actions that avoid system failure.
Sometimes advice can be as simple as protecting instream thermal refugia from cattle by fencing the riverbank (Figure 8a). Other times a rule of thumb is helpful—such as plant 0.5 km of riparian tree cover near headwaters to achieve 1 °C of river water cooling in summer [100]. Even then, more detailed instructions are required on what to plant and how to manage trade-offs between increased shade/cooling/nutrient cycling and other aspects of ecosystem function. Keeping Rivers Cool is a rare example of this type of assistance [101]. Further guidance of this kind is needed.
Flood risk management is an area where guidance is used to support detailed engineering design and catchment wide solutions to counter expected increases in flooding under climate change [102,103,104]. The UK was amongst the first countries to issue advice on flood risk allowances for climate change—initially as a national standard (the so-called “20% rule”) [105]; latterly as regional look-up tables [106]. Now there are calls for third generation guidance and allowances that are tailored to the local climate sensitivity of individual catchments [88]. Strictly speaking, such advice is more about building resistance rather than resilience to future flood risks.
Guidelines for UK water companies are quite explicit about resilience testing [107]. They require water companies to consider contingencies for challenging but plausible drought events beyond the capabilities of existing and planned water supply systems. The test event (s) had to be at least the worst drought on record but a more challenging, yet plausible range of droughts, was recommended. Here, “plausible” may be interpreted as a period of lower than usual rainfall that a company might reasonably be expected to prepare for. The reference level of service is resilience to a 1 in 200 years drought (i.e., a severe event with an approximate annual likelihood of 0.5%). For some water companies, this might be the 1921 drought (Figure 8b), which might even have been the most severe in Europe for 500 years [108].
Identifying “plausible” extreme droughts (or floods) for the stress-testing resilience of water resource systems is not straightforward. First, it requires homogeneous, multi-decadal (even multi-centennial) series—whether from observations [109], stochastic weather generator simulations [110] or proxy climate records [111]. Second, whether a frequentist or extreme value distribution is applied, the supposition is typically made that very rare events are drawn from the same distribution as less severe events. For instance, the ocean-atmosphere conditions driving a 500-year drought would be viewed as a more extreme state of those causing a 5-year drought. Extraordinarily rare events are effectively being extrapolated from distributions of less rare events. Very large ensembles from seasonal prediction systems offer alternative means of creating plausible yet previously unseen extreme events for resilience testing [112]. More research is needed to test the physical credibility and drivers of extremes taken from climate model worlds.
Finally, this Review has concentrated on threats and interventions for individual catchments because this is where past research has tended to focus. However, there is growing appreciation of the need to increase resilience to multi-basin, multi-hazard, and multi-sector climate risks [50]. For instance, analyses show that, under extreme multi-basin flooding, up to 30% of river monitoring stations in Great Britain can simultaneously record their annual maximum flow (as was the case in autumn 2000) [113]. Subsequent research investigated the spatial signature of multi-basin floods [114]; equivalent work has been undertaken on the spatial coherence of major droughts [115]. Both areas of enquiry raise questions about the resilience of connected assets and emergency systems that must continue to perform despite widespread disruption (e.g., in [116]).

7. Concluding Remarks and Recommendations

This Review draws on nearly 120 sources that inform thinking about resilience to climate change at river catchment scales. This is clearly a fashionable topic and one that rightly draws attention to system threats, tipping points, and the prospect of new equilibrium states, as well as the need for long-term monitoring and adaptive management. However, all three Rs (i.e., resilience, resistance, and reliability) should be embraced to broaden the range of solutions available and offer a more integrated conceptual framework. Six further recommendations are offered to water managers based on the evidence reviewed:
  • Use resilience terminology precisely and consistently. Within scientific and policy documents, “resilient” is at times used interchangeably with “sensitive”, “resistant”, “sustainable” or, as the opposite to “vulnerable”. A standard glossary of terms could be established by the community.
  • Strive to build back better or safer after a catastrophe. Reconstruction and recovery activities create opportunities to build resilience (i.e., to adaptively manage emergent risks). Sometimes it may be necessary to accept the new reality of a change of state—for instance it would be prohibitively costly to remediate all UK rivers impacted by mine drainage—in which case, a risk-based approach is applied.
  • Adopt a strategic approach to monitoring networks. Novel indicators of system threats, thresholds, stable states and resilience are needed. Long-term monitoring with agreed trigger points for actions are key instruments for benchmarking, then adaptively managing climate risks at all scales.
  • Demand national and regional resilience and adaptation indicators made available via open platforms that are updated regularly. Presently, much needed information is dispersed in unhelpful formats and is fragmented, incomplete or protected. This could be a significant multi-agency endeavor but would eventually strengthen national adaptation capabilities.
  • Reduce non-climatic pressures on river catchments. By addressing tangible issues such as catchment disturbance and pollution, natural systems will be in better shape to adjust to the uncertain timing/severity of future climate threats.
  • Implement specific adaptation measures to enhance resilience. Such interventions should be evidence-based, with field trials, monitoring and modelling to evaluate intended benefits. More decision tools and practical guidance are urgently needed.
Climate threats to river catchments are increasingly understood; yet knowledge to guide local resilience measures is in relatively short supply. Priority areas for applied research and development include: (a) objective designation of ecological flows; (b) tools to guide riparian management of water quality and temperature pressures; (c) economic appraisal of headwater restoration measures to achieve downstream adaptation benefits; (d) catchment-specific (rather than regional/national) allowances for climate change in detailed engineering design; (e) simulation methods for generating unseen events for stress-testing the resilience of water systems and plans. Above all, the priority is to devise and disseminate indicators of evolving climate risks and adaptation outcomes.

Funding

This review was supported by the Environment Agency.

Acknowledgments

Thanks to Kathryn Brown and Charles Ffoulkes for providing information on the UK Committee on Climate Change adaptation indicators. The author is also grateful for the constructive remarks and encouragement provided by two anonymous referees.

Conflicts of Interest

The author declares no conflict of interest.

Data Access

No new data were generated in the preparation of this Review.

References

  1. Walker, B.; Salt, D. Resilience Practice: Building Capacity to Absorb Disturbance and Maintain Function; Island Press: Washington, DC, USA, 2012. [Google Scholar]
  2. Lovelock, J.E.; Margulis, L. Atmospheric homeostasis by and for the biosphere: The Gaia hypothesis. Tellus 1974, 26, 2–10. [Google Scholar] [CrossRef] [Green Version]
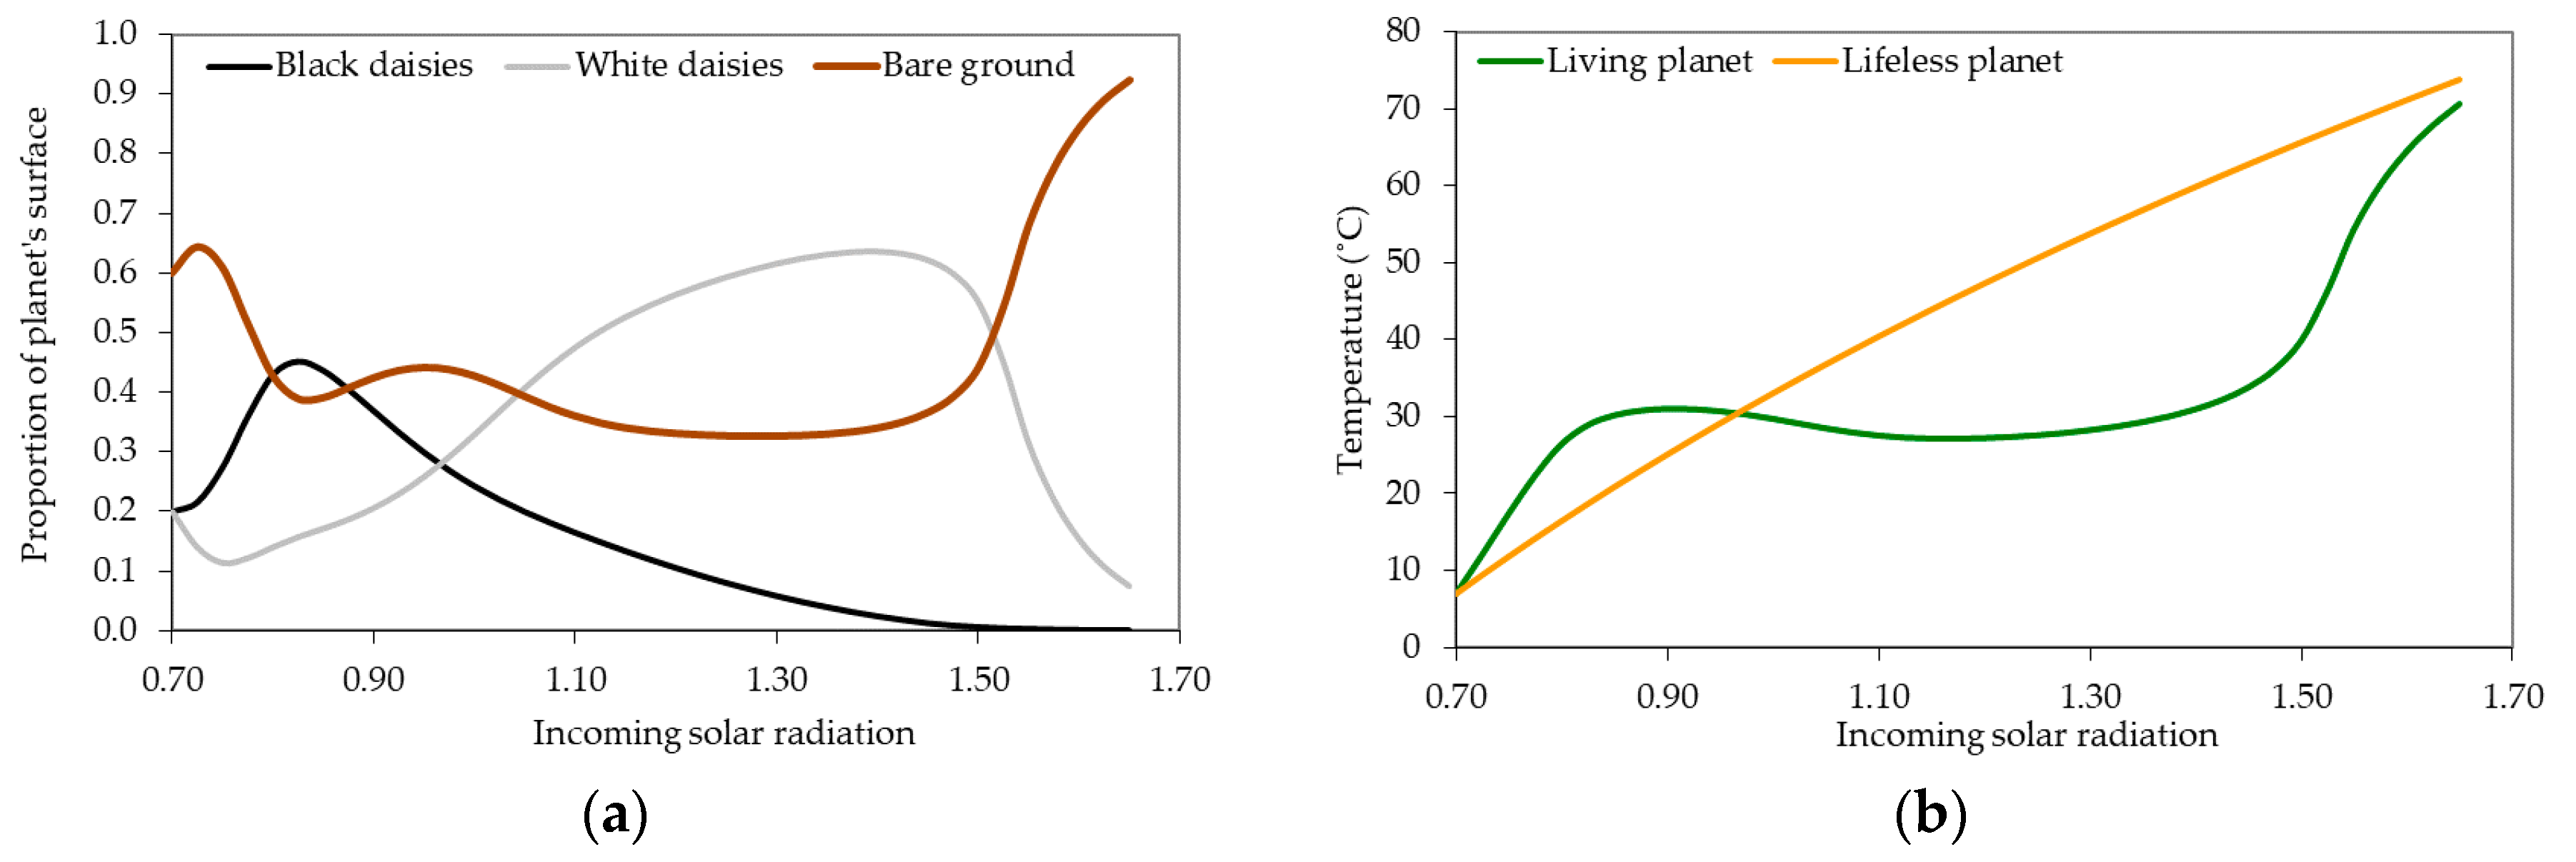
  3. Watson, A.J.; Lovelock, J.E. Biological homeostasis of the global environment: The parable of Daisyworld. Tellus 1983, 35, 284–289. [Google Scholar] [CrossRef] [Green Version]
  4. Lenton, T.M. Gaia and natural selection. Nature 1998, 394, 439–447. [Google Scholar] [CrossRef] [PubMed]
  5. Wood, A.J.; Ackland, G.J.; Dyke, J.G.; Williams, H.T.; Lenton, T.M. Daisyworld: A review. Rev. Geophys. 2008, 46, RG1001. [Google Scholar] [CrossRef] [Green Version]
  6. Zeng, X.; Pielke, R.A.; Eykholt, R. Chaos in Daisyworld. Tellus 1990, 42, 309–318. [Google Scholar] [CrossRef]
  7. Wilby, R.L. Climate Change in Practice: Topics for Discussion with Group Exercises; Cambridge University Press: Cambridge, UK, 2017; pp. 46–49. [Google Scholar]
  8. Folke, C.; Carpenter, S.; Elmqvist, T.; Gunderson, L.; Holling, C.S.; Walker, B. Resilience and sustainable development: Building adaptive capacity in a world of transformations. AMBIO 2002, 31, 437–440. [Google Scholar] [CrossRef] [PubMed]
  9. Lenton, T.M.; Held, H.; Kriegler, E.; Hall, J.W.; Lucht, W.; Rahmstorf, S.; Schellnhuber, H.J. Tipping elements in the Earth’s climate system. Proc. Natl. Acad. Sci. USA 2008, 105, 1786–1793. [Google Scholar] [CrossRef] [Green Version]
  10. Hirota, M.; Holmgren, M.; Van Nes, E.H.; Scheffer, M. Global resilience of tropical forest and savanna to critical transitions. Science 2011, 334, 232–235. [Google Scholar] [CrossRef] [Green Version]
  11. Carpenter, S.; Walker, B.; Anderies, J.M.; Abel, N. From metaphor to measurement: Resilience of what to what? Ecosystems 2001, 4, 765–781. [Google Scholar] [CrossRef]
  12. Holling, C.S. Engineering Resilience Versus Ecological Resilience. In Engineering within Ecological Constraints; Schulze, P., Ed.; National Academy of Press: Washington, DC, USA, 1996; pp. 31–43. [Google Scholar]
  13. Walker, B.; Carpenter, S.; Anderies, J.; Abel, N.; Cumming, G.; Janssen, M.; Lebel, L.; Norberg, J.; Peterson, G.D.; Pritchard, R. Resilience management in social-ecological systems: A working hypothesis for a participatory approach. Conserv. Ecol. 2002, 6, 14. [Google Scholar] [CrossRef]
  14. Elmqvist, T.; Folke, C.; Nyström, M.; Peterson, G.; Bengtsson, J.; Walker, B.; Norberg, J. Response diversity, ecosystem change, and resilience. Front. Ecol. Environ. 2003, 1, 488–494. [Google Scholar] [CrossRef]
  15. Folke, C.; Carpenter, S.; Walker, B.; Scheffer, M.; Elmqvist, T.; Gunderson, L.; Holling, C.S. Regime shifts, resilience, and biodiversity in ecosystem management. Annu. Rev. Ecol. Evol. Syst. 2004, 35, 557–581. [Google Scholar] [CrossRef] [Green Version]
  16. Folke, C.; Carpenter, S.R.; Walker, B.; Scheffer, M.; Chapin, T.; Rockström, J. Resilience thinking: Integrating resilience, adaptability and transformability. Ecol. Soc. 2010, 15, 20. [Google Scholar] [CrossRef]
  17. Olsson, P.; Folke, C.; Berkes, F. Adaptive comanagement for building resilience in social-ecological systems. Environ. Manag. 2004, 34, 75–90. [Google Scholar] [CrossRef]
  18. Folke, C. Resilience: The emergence of a perspective for social-ecological systems analyses. Glob. Environ. Chang. 2006, 16, 253–267. [Google Scholar] [CrossRef]
  19. Dudgeon, D.; Arthington, A.H.; Gessner, M.O.; Kawabata, Z.I.; Knowler, D.J.; Lévêque, C.; Naiman, R.J.; Prieur-Richard, A.H.; Soto, D.; Stiassny, M.L.; et al. Freshwater biodiversity: Importance, threats, status and conservation challenges. Biol. Rev. 2006, 81, 163–182. [Google Scholar] [CrossRef]
  20. Reid, A.J.; Carlson, A.K.; Creed, I.F.; Eliason, E.J.; Gell, P.A.; Johnson, P.T.; Kidd, K.A.; MacCormack, T.J.; Olden, J.D.; Ormerod, S.J.; et al. Emerging threats and persistent conservation challenges for freshwater biodiversity. Biol. Rev. 2018, 94, 849–873. [Google Scholar] [CrossRef] [Green Version]
  21. Fischer, J.; Peterson, G.D.; Gardner, T.A.; Gordon, L.J.; Fazey, I.; Elmqvist, T.; Felton, A.; Folke, C.; Dovers, S. Integrating resilience thinking and optimisation for conservation. Trends Ecol. Evol. 2009, 24, 549–554. [Google Scholar] [CrossRef]
  22. Boltz, F.; Poff, N.L.; Folke, C.; Kete, N.; Brown, C.M.; Freeman, S.S.G.; Matthews, J.H.; Martinez, A.; Rockström, J. Water is a master variable: Solving for resilience in the modern era. Water Secur. 2019, 8, 100048. [Google Scholar] [CrossRef]
  23. Davoudi, S.; Shaw, K.; Haider, L.J.; Quinlan, A.E.; Peterson, G.D.; Wilkinson, C.; Fünfgeld, H.; McEvoy, D.; Porter, L.; Davoudi, S. Resilience: A bridging concept or a dead end? Plan. Theory Pract. 2012, 13, 299–333. [Google Scholar] [CrossRef] [Green Version]
  24. Miller, F.; Osbahr, H.; Boyd, E.; Thomalla, F.; Bharwani, S.; Ziervogel, G.; Walker, B.; Birkmann, J.; Van der Leeuw, S.; Rockström, J.; et al. Resilience and vulnerability: Complementary or conflicting concepts? Ecol. Soc. 2010, 15, 11. [Google Scholar] [CrossRef]
  25. Manyena, B.; O’Brien, G.; O’Keefe, P.; Rose, J. Disaster resilience: A bounce back or bounce forward ability? Local Environ. 2011, 16, 417–424. [Google Scholar]
  26. Kennedy, J.; Ashmore, J.; Babister, E.; Kelman, I. The meaning of ‘build back better’: Evidence from post-tsunami Aceh and Sri Lanka. J. Contingencies Crisis Manag. 2008, 16, 24–36. [Google Scholar] [CrossRef]
  27. United Nations Office for Disaster Risk Reduction (UNISDR). Build Back Better in Recovery, Rehabilitation and Reconstruction; UNISDR: Geneva, Switzerland, 2017. [Google Scholar]
  28. Ahern, J. Urban landscape sustainability and resilience: The promise and challenges of integrating ecology with urban planning and design. Landsc. Ecol. 2013, 28, 1203–1212. [Google Scholar] [CrossRef]
  29. Lhomme, S.; Serre, D.; Diab, Y.; Laganier, R. Analyzing resilience of urban networks: A preliminary step towards more flood resilient cities. Nat. Hazards Earth Syst. Sci. 2013, 13, 221–230. [Google Scholar] [CrossRef] [Green Version]
  30. Spraggs, G.; Peaver, L.; Jones, P.; Ede, P. Reconstruction of historic drought in the Anglian Region (UK) over the period 1798–2010 and the implications for water resources and drought management. J. Hydol. 2015, 526, 231–252. [Google Scholar] [CrossRef]
  31. Vörösmarty, C.J.; McIntyre, P.B.; Gessner, M.O.; Dudgeon, D.; Prusevich, A.; Green, P.; Glidden, S.; Bunn, S.E.; Sullivan, C.A.; Liermann, C.R.; et al. Global threats to human water security and river biodiversity. Nature 2010, 467, 555–561. [Google Scholar] [CrossRef]
  32. Rockström, J.; Falkenmark, M.; Karlberg, L.; Hoff, H.; Rost, S.; Gerten, D. Future water availability for global food production: The potential of green water for increasing resilience to global change. Water Resour. Res. 2009, 45, W00A12. [Google Scholar] [CrossRef] [Green Version]
  33. Hess, T.; Knox, J.; Holman, I.; Sutcliffe, C. Resilience of primary food production to a changing climate: On-farm responses to water-related risks. Water 2020, 12, 2155. [Google Scholar] [CrossRef]
  34. Hanjra, M.A.; Qureshi, M.E. Global water crisis and future food security in an era of climate change. Food Policy 2010, 35, 365–377. [Google Scholar] [CrossRef]
  35. Gorelick, S.M.; Zheng, C. Global change and the groundwater management challenge. Water Resour. Res. 2015, 51, 3031–3051. [Google Scholar] [CrossRef]
  36. Walker, B.; Sayer, J.; Andrew, N.L.; Campbell, B. Should enhanced resilience be an objective of natural resource management research for developing countries? Crop. Sci. 2010, 50, S10–S19. [Google Scholar] [CrossRef] [Green Version]
  37. Ilunga, M. Assessing catchment resilience using entropy associated with mean annual runoff for the Upper Vaal catchment in South Africa. Entropy 2017, 19, 147. [Google Scholar] [CrossRef]
  38. Silberstein, R.P.; Aryal, S.K.; Braccia, M.; Durrant, J. Rainfall-runoff model performance suggests a change in flow regime and possible lack of catchment resilience. In Proceedings of the 20th International Congress on Modelling and Simulation (MODSIM2013), Adelaide, Australia, 1–6 December 2013; pp. 2409–2415. [Google Scholar]
  39. Harrigan, S.; Murphy, C.; Hall, J.; Wilby, R.L.; Sweeney, J. Attribution of detected changes in streamflow using multiple working hypotheses. Hydrol. Earth Syst. Sci. 2014, 18, 1935–1952. [Google Scholar] [CrossRef] [Green Version]
  40. Peterson, T.J. Multiple Hydrological Steady States and Resilience. Ph.D. Thesis, University of Melbourne, Melbourne, Australia, 2009. Unpublished. [Google Scholar]
  41. Miller, S.W.; Wooster, D.; Li, J. Resistance and resilience of macroinvertebrates to irrigation water withdrawals. Freshw. Biol. 2007, 52, 2494–2510. [Google Scholar] [CrossRef]
  42. Stubbington, R.; Wood, P.J.; Boulton, A.J. Low flow controls on benthic and hyporheic macroinvertebrate assemblages during supra-seasonal drought. Hydrol. Proc. 2009, 23, 2252–2263. [Google Scholar] [CrossRef] [Green Version]
  43. Van Looy, K.; Tonkin, J.D.; Floury, M.; Leigh, C.; Soininen, J.; Larsen, S.; Heino, J.; Poff, N.L.; Delong, M.; Jähnig, S.C.; et al. The three Rs of river ecosystem resilience: Resources, recruitment, and refugia. River Res. Appl. 2019, 35, 107–120. [Google Scholar] [CrossRef] [Green Version]
  44. Wilby, R.L.; Clifford, N.J.; De Luca, P.; Harrigan, S.O.; Hillier, J.K.; Hodgkins, R.; Johnson, M.F.; Matthews, T.K.R.; Murphy, C.; Noone, S.J.; et al. The “dirty dozen” of freshwater science: Detecting then reconciling hydrological data biases and errors. Wiley Interdiscip. Rev. Water 2017, 4, e1209. [Google Scholar] [CrossRef] [Green Version]
  45. Worrall, T.P.; Dunbar, M.J.; Extence, C.A.; Laize, C.L.; Monk, W.A.; Wood, P.J. The identification of hydrological indices for the characterization of macroinvertebrate community response to flow regime variability. Hydrol. Sci. J. 2014, 59, 645–658. [Google Scholar] [CrossRef]
  46. Langbein, W.B.; Leopold, L.B. Quasi-equilibrium states in channel morphology. Am. J. Sci. 1964, 262, 782–794. [Google Scholar] [CrossRef] [Green Version]
  47. Petts, G.E. Impounded Rivers: Perspectives for Ecological Management; John Wiley and Sons: Chichester, UK, 1984. [Google Scholar]
  48. Petts, G.E.; Pratts, J.D. Channel changes following reservoir construction on a lowland English river. Catena 1983, 10, 77–85. [Google Scholar] [CrossRef]
  49. Kendon, M.; McCarthy, M.; Jevrejeva, S.; Matthews, A.; Sparks, T.; Garforth, J. State of the UK Climate 2019. Int. J. Climatol. 2020, 40, 1–69. [Google Scholar] [CrossRef]
  50. Street, R.; Di Mauro, M.; Humphrey, K.; Johns, D.; Boyd, E.; Crawford-Brown, D.; Evans, J.; Kitchen, J.; Hunt, A.; Knox, K.; et al. UK Climate Change Risk Assessment Evidence Report: Chapter 8, Cross-Cutting Issues; Adaptation Sub-Committee of the Committee on Climate Change: London, UK, 2016. [Google Scholar]
  51. Ekström, M.; Gutmann, E.D.; Wilby, R.L.; Tye, M.R.; Kirono, D.G.C. Robustness of hydroclimate metrics for climate change impact research. Wiley Interdiscip. Rev. Water 2018, 5, e1288. [Google Scholar] [CrossRef] [Green Version]
  52. Whitehead, P.G.; Wilby, R.L.; Butterfield, D.; Wade, A.J. Impacts of climate change on nitrogen in a lowland chalk stream: An appraisal of adaptation strategies. Sci. Total Environ. 2006, 365, 260–273. [Google Scholar] [CrossRef] [PubMed]
  53. Orr, H.; Johnson, M.; Wilby, R.L.; Hatton-Ellis, T.; Broadmeadow, S. What else do managers need to know about warming rivers? A United Kingdom perspective. Wiley Interdiscip. Rev. Water 2015, 2, 55–64. [Google Scholar] [CrossRef] [Green Version]
  54. Department of the Environment, Transport and the Regions (DETR). Indicators of Climate Change in the UK; DETR: London, UK, 1999.
  55. Cannell, M.; Brown, T.; Sparks, T.; Marsh, T.; Parr, T.; George, G. Review of UK Climate Change Indicators; Centre for Ecology and Hydrology: Wallingford, UK, 2003. [Google Scholar]
  56. Whitfield, P.H.; Burn, D.H.; Hannaford, J.; Higgins, H.; Hodgkins, G.A.; Marsh, T.; Looser, U. Reference hydrologic networks I. The status and potential future directions of national reference hydrologic networks for detecting trends. Hydro. Sci. J. 2012, 57, 1562–1579. [Google Scholar] [CrossRef] [Green Version]
  57. Adaptation Sub Committee (ASC). Progress in Preparing for Climate Change—2019 Progress Report to Parliament; Committee on Climate Change: London, UK, 2019. [Google Scholar]
  58. ADAS. Research to Update the Evidence Base for Indicators of Climate-Related Risks and Actions in England; RSK ADAS Ltd.: Helsby, UK, 2019. [Google Scholar]
  59. Hashimoto, T.; Stedinger, J.R.; Loucks, D.P. Reliability, resiliency, and vulnerability criteria for water resource system performance evaluation. Water Resour. Res. 1982, 18, 14–20. [Google Scholar] [CrossRef] [Green Version]
  60. Fowler, H.J.; Kilsby, C.G.; O’Connell, P.E. Modeling the impacts of climatic change and variability on the reliability, resilience, and vulnerability of a water resource system. Water Resour. Res. 2003, 39, 1222. [Google Scholar] [CrossRef] [Green Version]
  61. Borgomeo, E.; Mortazavi-Naeini, M.; Hall, J.W.; O’Sullivan, M.J.; Watson, T. Trading-off tolerable risk with climate change adaptation costs in water supply systems. Water Resour. Res. 2016, 52, 622–643. [Google Scholar] [CrossRef]
  62. Miguez, M.G.; Veról, A.P. A catchment scale Integrated Flood Resilience Index to support decision making in urban flood control design. Environ. Plan. B Urban Anal. City Sci. 2017, 44, 925–946. [Google Scholar] [CrossRef]
  63. Adebimpe, O.A.; Proverbs, D.G.; Oladokun, V.O. A fuzzy-analytic hierarchy process approach for measuring flood resilience at the individual property level. Int. J. Build. Pathol. Adapt. 2020. [Google Scholar] [CrossRef]
  64. Mugume, S.N.; Gomez, D.E.; Fu, G.; Farmani, R.; Butler, D. A global analysis approach for investigating structural resilience in urban drainage systems. Water Res. 2015, 81, 15–26. [Google Scholar] [CrossRef] [PubMed] [Green Version]
  65. Peterson, T.J.; Western, A.W. Multiple hydrological attractors under stochastic daily forcing: 1. Can multiple attractors exist? Water Resour. Res. 2014, 50, 2993–3009. [Google Scholar] [CrossRef]
  66. De la Hera-Portillo, Á.; López-Gutiérrez, J.; Zorrilla-Miras, P.; Mayor, B.; López-Gunn, E. The ecosystem resilience concept applied to hydrogeological systems: A general approach. Water 2020, 12, 1824. [Google Scholar] [CrossRef]
  67. Castle, S.L.; Thomas, B.F.; Reager, J.T.; Rodell, M.; Swenson, S.C.; Famiglietti, J.S. Groundwater depletion during drought threatens future water security of the Colorado River Basin. Geophys. Res. Lett. 2014, 41, 5904–5911. [Google Scholar] [CrossRef] [Green Version]
  68. Ponce-Campos, G.E.; Moran, M.S.; Huete, A.; Zhang, Y.; Bresloff, C.; Huxman, T.E.; Eamus, D.; Bosch, D.D.; Buda, A.R.; Gunter, S.A.; et al. Ecosystem resilience despite large-scale altered hydroclimatic conditions. Nature 2013, 494, 349–352. [Google Scholar] [CrossRef]
  69. Hansen, L.J.; Biringer, J.L.; Hoffman, J.R. Buying Time: A User’s Manual for Building Resistance and Resilience to Climate Change in Natural Systems; WWF: Washington, DC, USA, 2003. [Google Scholar]
  70. Gell, P.; Mills, K.; Grundell, R. A legacy of climate and catchment change: The real challenge for wetland management. Hydrobiologia 2013, 708, 133–144. [Google Scholar] [CrossRef]
  71. Chessman, B.C. Identifying species at risk from climate change: Traits predict the drought vulnerability of freshwater fishes. Biol. Conserv. 2013, 160, 40–49. [Google Scholar] [CrossRef]
  72. Barker, P.; Haworth, E.Y.; Leavitt, P.R.; Maberly, S.C.; Pates, J. Humans and climate as drivers of algal community change in Windermere since 1850. Freshwat. Biol. 2012, 57, 260–277. [Google Scholar]
  73. Moorhouse, H.L.; McGowan, S.; Jones, M.D.; Barker, P.; Leavitt, P.R.; Brayshaw, S.A.; Haworth, E.Y. Contrasting effects of nutrients and climate on algal communities in two lakes in the Windermere catchment since the late 19th century. Freshwat. Biol. 2014, 59, 2605–2620. [Google Scholar] [CrossRef]
  74. Harris, N.M.; Gurnell, A.M.; Hannah, D.M.; Petts, G.E. Classification of river regimes: A context for hydroecology. Hydrol. Proc. 2000, 14, 2831–2848. [Google Scholar] [CrossRef]
  75. Monk, W.A.; Wood, P.J.; Hannah, D.M.; Wilson, D.A. Selection of river flow indices for the assessment of hydroecological change. River Res. Appl. 2007, 23, 113–122. [Google Scholar] [CrossRef] [Green Version]
  76. Laizé, C.L.; Hannah, D.M. Modification of climate—River flow associations by basin properties. J. Hydrol. 2010, 389, 186–204. [Google Scholar] [CrossRef]
  77. Carey, S.K.; Tetzlaff, D.; Seibert, J.; Soulsby, C.; Buttle, J.; Laudon, H.; McDonnell, J.; McGuire, K.; Caissie, D.; Shanley, J.; et al. Inter-comparison of hydro-climatic regimes across northern catchments: Synchronicity, resistance and resilience. Hydrol. Proc. 2010, 24, 3591–3602. [Google Scholar] [CrossRef]
  78. Wilby, R.L.; Dettinger, M.D. Streamflow Changes in the Sierra Nevada, CA Simulated Using a Statistically Downscaled General Circulation Model Scenario of Climate Change. In Linking Climate Change to Land Surface Change; McLaren, S.J., Kniveton, D.R., Eds.; Kluwer Academic Publishers: Dordrecht, Netherlands, 2000; pp. 99–121. [Google Scholar]
  79. Capell, R.; Tetzlaff, D.; Soulsby, C. Will catchment characteristics moderate the projected effects of climate change on flow regimes in the Scottish Highlands? Hydrol. Proc. 2013, 27, 687–699. [Google Scholar] [CrossRef]
  80. Prudhomme, C.; Crooks, S.; Kay, A.L.; Reynard, N. Climate change and river flooding: Part 1 classifying the sensitivity of British catchments. Clim. Chang. 2013, 119, 933–948. [Google Scholar] [CrossRef] [Green Version]
  81. Van Loon, A.F.; Laaha, G. Hydrological drought severity explained by climate and catchment characteristics. J. Hydrol. 2015, 526, 3–14. [Google Scholar] [CrossRef] [Green Version]
  82. Yates, D.; Miller, K.A.; Wilby, R.L.; Kaatz, L. Decision-centric adaptation appraisal for water management across Colorado’s Continental Divide. Clim. Risk Manag. 2015, 10, 35–50. [Google Scholar] [CrossRef] [Green Version]
  83. Worrall, F.; Burt, T.; Adamson, J. Long-term changes in hydrological pathways in an upland peat catchment—Recovery from severe drought? J. Hydol. 2006, 321, 5–20. [Google Scholar] [CrossRef]
  84. Worrall, F.; Burt, T.P.; Adamson, J.K. Change in runoff initiation probability over a severe drought in a peat soil-implications for flowpaths. J. Hydrol. 2007, 345, 16–26. [Google Scholar] [CrossRef]
  85. Geris, J.; Tetzlaff, D.; Soulsby, C. Resistance and resilience to droughts: Hydropedological controls on catchment storage and run-off response. Hydrol. Proc. 2015, 29, 4579–4593. [Google Scholar] [CrossRef] [Green Version]
  86. Prudhomme, C.; Wilby, R.L.; Crooks, S.; Kay, A.L.; Reynard, N.S. Scenario-neutral approach to climate change impact studies: Application to flood risk. J. Hydrol. 2010, 390, 198–209. [Google Scholar] [CrossRef] [Green Version]
  87. Botter, G.; Basso, S.; Rodriguez-Iturbe, I.; Rinaldo, A. Resilience of river flow regimes. Proc. Natl. Acad. Sci. USA 2013, 110, 12925–12930. [Google Scholar] [CrossRef] [PubMed] [Green Version]
  88. Broderick, C.; Murphy, C.; Wilby, R.L.; Matthews, T.; Prudhomme, C.; Adamson, M. National assessment of climate change allowances for future flood risk using a scenario-neutral framework. Water Resour. Res. 2019, 55, 1079–1104. [Google Scholar] [CrossRef]
  89. Wilby, R.L.; Vaughan, K. The hallmarks of organizations that are adapting to climate change. Water Environ. J. 2011, 25, 271–281. [Google Scholar] [CrossRef]
  90. Razafindrabe, B.H.N.; Cuesta, M.A.; He, B.; Rañola, R.F., Jr.; Yaota, K.; Inoue, S.; Saito, S.; Masuda, T.; Concepcion, R.N.; Santos-Borja, A.; et al. Flood risk and resilience assessment for Santa Rosa-Silang subwatershed in the Laguna Lake region, Philippines. Environ. Hazards 2015, 14, 16–35. [Google Scholar] [CrossRef]
  91. Abel, N.; Wise, R.M.; Colloff, M.J.; Walker, B.H.; Butler, J.R.; Ryan, P.; Norman, C.; Langston, A.; Anderies, J.M.; Gorddard, R.; et al. Building resilient pathways to transformation when “no one is in charge” insights from Australia’s Murray-Darling Basin. Ecol. Soc. 2016, 21, 23. [Google Scholar] [CrossRef] [Green Version]
  92. Rubinos, C.; Anderies, J. Integrating collapse theories to understand socio-ecological systems resilience. Environ. Res. Lett. 2020, 15, 075008. [Google Scholar] [CrossRef]
  93. Hallegatte, S. Strategies to adapt to an uncertain climate change. Glob. Environ. Chang. 2009, 19, 240–247. [Google Scholar] [CrossRef]
  94. Addy, S.; Cooksley, S.; Dodd, N.; Waylen, K.; Stockan, J.; Byg, A.; Holstead, K. River Restoration and Biodiversity: Nature-Based Solutions for Restoring Rivers in the UK and Republic of Ireland; Scotland’s Centre of Expertise for Waters (CREW): Aberdeen, UK, 2016. [Google Scholar]
  95. Palmer, M.A.; Bernhardt, E.S.; Allan, J.D.; Lake, P.S.; Alexander, G.; Brooks, S.; Carr, J.; Clayton, S.; Dahm, C.N.; Shah, J.F.; et al. Standards for ecologically successful river restoration. J. Appl. Ecol. 2005, 42, 208–217. [Google Scholar] [CrossRef]
  96. Biggs, R.; Schlüter, M.; Biggs, D.; Bohensky, E.L.; BurnSilver, S.; Cundill, G.; Dakos, V.; Daw, T.M.; Evans, L.S.; Kotschy, K.; et al. Toward principles for enhancing the resilience of ecosystem services. Annu. Rev. Environ. Resour. 2012, 37, 421–448. [Google Scholar] [CrossRef] [Green Version]
  97. Riley, W.D.; Potter, E.C.E.; Biggs, J.; Collins, A.L.; Jarvie, H.P.; Jones, J.I.; Kelly-Quinn, M.; Ormerod, S.J.; Sear, D.A.; Wilby, R.L.; et al. Small Water Bodies in Great Britain and Ireland: Ecosystem function, human-generated degradation, options for restorative action. Sci. Total Environ. 2018, 645, 1598–1616. [Google Scholar] [CrossRef] [PubMed]
  98. Wilby, R.L.; Orr, H.; Watts, G.; Battarbee, R.W.; Berry, P.M.; Chadd, R.; Dugdale, S.J.; Dunbar, M.J.; Elliott, J.A.; Extence, C.; et al. Evidence needed to manage freshwater ecosystems in a changing climate: Turning adaptation principles into practice. Sci. Total Environ. 2010, 408, 4150–4164. [Google Scholar] [CrossRef] [PubMed]
  99. Watts, G.; von Christierson, B.; Hannaford, J.; Lonsdale, K. Testing the resilience of water supply systems to long droughts. J. Hydrol. 2012, 414, 255–267. [Google Scholar] [CrossRef] [Green Version]
  100. Johnson, M.F.; Wilby, R.L. Seeing the landscape from the trees: Metrics to guide riparian shade management in river catchments. Water Resour. Res. 2015, 51, 3754–3769. [Google Scholar] [CrossRef] [Green Version]
  101. Environment Agency. Keeping Rivers Cool: Getting Ready for Climate Change by Creating Riparian Shade; Environment Agency: Bristol, UK, 2012.
  102. Ashley, R.M.; Balmforth, D.J.; Saul, A.J.; Blanskby, J.D. Flooding in the future—Predicting climate change, risks and responses in urban areas. Water Sci. Technol. 2005, 52, 265–273. [Google Scholar] [CrossRef]
  103. Wilby, R.L.; Beven, K.J.; Reynard, N.S. Climate change and fluvial flood risk in the UK: More of the same? Hydrol. Proc. 2008, 22, 2511–2523. [Google Scholar] [CrossRef]
  104. Watts, G.; Battarbee, R.W.; Bloomfield, J.P.; Crossman, J.; Daccache, A.; Durance, I.; Elliott, J.A.; Garner, G.; Hannaford, J.; Hannah, D.M.; et al. Climate change and water in the UK—Past changes and future prospects. Prog. Phys. Geogr. 2015, 39, 6–28. [Google Scholar] [CrossRef]
  105. Defra. Flood and Coastal Defence Appraisal Guidance FCDPAG3 Economic Appraisal Supplementary Note to Operating Authorities—Climate Change Impacts; Defra: London, UK, 2006. [Google Scholar]
  106. Environment Agency. Adapting to Climate Change: Advice for Flood and Coastal Erosion Risk Management Authorities; Environment Agency: Bristol, UK, 2016.
  107. Environment Agency and Natural Resource Wales. Final Water Resource Planning Guideline; Environment Agency: Bristol, UK, 2016.
  108. Wetter, O.; Pfister, C.; Werner, J.P.; Zorita, E.; Wagner, S.; Seneviratne, S.I.; Herget, J.; Grünewald, U.; Luterbacher, J.; Alcoforado, M.J.; et al. The year-long unprecedented European heat and drought of 1540—A worst case. Clim. Chang. 2014, 125, 349–363. [Google Scholar] [CrossRef]
  109. Murphy, C.; Wilby, R.L.; Matthews, T.K.R.; Thorne, P.; Broderick, C.; Fealy, R.; Hall, J.; Harrigan, S.; Jones, P.D.; McCarthy, G.; et al. Multi-century trends to wetter winters and drier summers in the England and Wales precipitation series explained by observational and sampling bias in early records. Int. J. Climatol. 2020, 40, 610–619. [Google Scholar] [CrossRef] [Green Version]
  110. Steinschneider, S.; Ray, P.; Rahat, S.H.; Kucharski, J. A weather-regime-based stochastic weather generator for climate vulnerability assessments of water systems in the Western United States. Water Resour. Res. 2019, 55, 6923–6945. [Google Scholar] [CrossRef]
  111. Loader, N.J.; Young, G.H.; McCarroll, D.; Davies, D.; Miles, D.; Ramsey, C.B. Summer precipitation for the England and Wales region, 1201–2000ce, from stable oxygen isotopes in oak tree rings. J. Quat. Sci. 2020, 35, 731–736. [Google Scholar] [CrossRef]
  112. Thompson, V.; Dunstone, N.J.; Scaife, A.A.; Smith, D.M.; Slingo, J.M.; Brown, S.; Belcher, S.E. High risk of unprecedented UK rainfall in the current climate. Nat. Commun. 2017, 8, 1–6. [Google Scholar] [CrossRef] [PubMed] [Green Version]
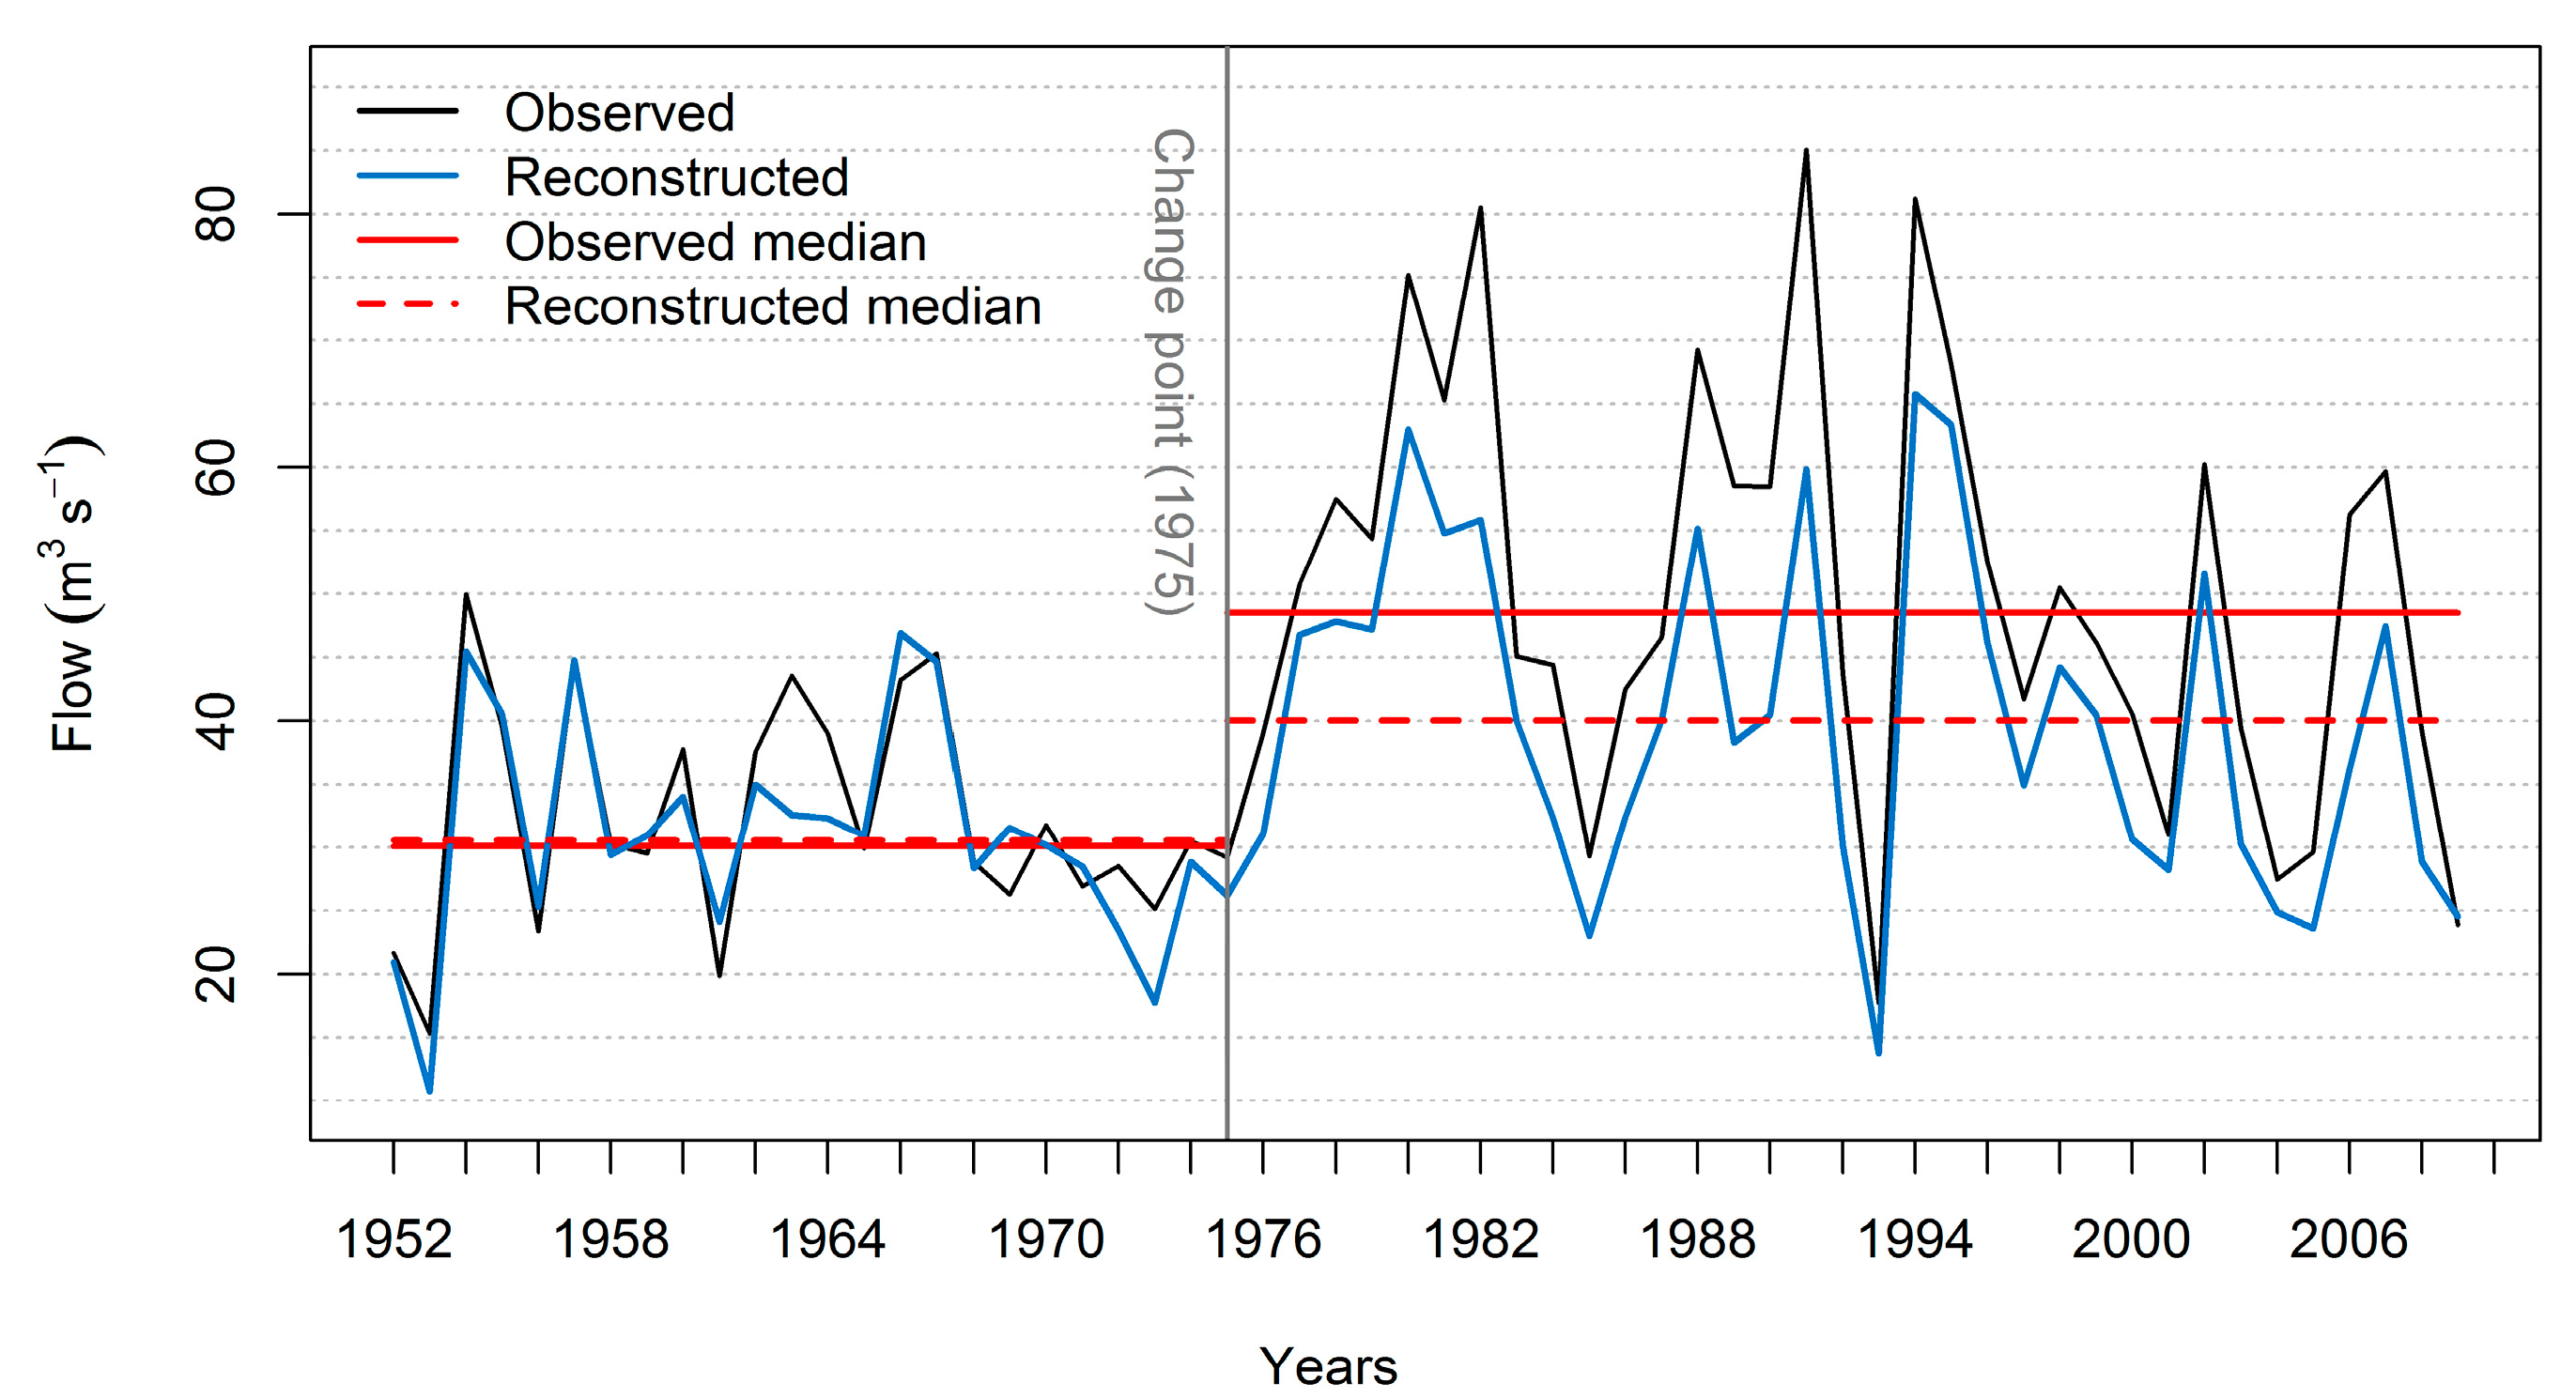
  113. Wilby, R.L.; Quinn, N.W. Reconstructing multi-decadal variations in fluvial flood risk using atmospheric circulation patterns. J. Hydrol. 2013, 487, 109–121. [Google Scholar] [CrossRef]
  114. De Luca, P.; Hillier, J.K.; Wilby, R.L.; Quinn, N.W.; Harrigan, S. Extreme multi-basin flooding linked with extra-tropical cyclones. Environ. Res. Lett. 2017, 12, 114009. [Google Scholar] [CrossRef]
  115. Hannaford, J.; Lloyd-Hughes, B.; Keef, C.; Parry, S.; Prudhomme, C. Examining the large-scale spatial coherence of European drought using regional indicators of precipitation and streamflow deficit. Hydrol. Proc. 2011, 30, 1146–1162. [Google Scholar] [CrossRef]
  116. Yu, D.; Yin, J.; Wilby, R.L.; Lane, S.; Aerts, J.; Lin, N.; Oppenheimer, M.; Liu, M.; Yuan, H.; Chen, J.; et al. Disruption of emergency response to vulnerable populations during floods. Nat. Sustain. 2020, 3, 728–736. [Google Scholar] [CrossRef]
Figure 1. Proportion of Daisyworld that is covered by (a) black or white daisies, or bare ground, and (b) temperatures on planets with (living) and without daisies (lifeless) under increasing stress from incoming solar radiation [7].
Water 12 02510 g001
Figure 2. Annual number of publications identified by the Web of Science given the search terms (resilience) AND (catchment or basin or river) AND (climate OR stress OR pressure OR driver). The same criteria were used for (vulnerability). There is the double counting of some articles.
Water 12 02510 g002
Figure 3. Observed medians of 328 simulated series for March mean flow in the River Boyne, Ireland. The solid red line is the observed median flow before (1952–1975) and after (1976–2009) the detected change point. The dashed red line is the simulated median flow for the same periods. The difference between observed and simulated flows post 1975 was interpreted as the consequence of field drainage with a shift in the rainfall regime linked to a more positive phase in the North Atlantic Oscillation index. Reproduced from [39] under Creative Commons Attribution 3.0 License.
Water 12 02510 g003
Figure 4. Total spend on resilience from 2008–2009 to 2017–2018 by water companies, as reported to Ofwat. Between 2008–2009 and 2017–2018, 70% of all spent on resilience was by Anglian and Severn Trent. A further 25% of that spent was by Thames, Wessex, Yorkshire, Affinity, Bristol and Sutton and East Surrey. The remaining 10 water companies (grouped as ‘Other’) accounted for less than 5% of the total spent on resilience across all water companies. Reproduced from [58] with permission from ADAS and the UK Committee on Climate Change.
Water 12 02510 g004
Figure 5. A system with two steady states and switching between them due to stochastic forcing. The two steady states (i.e., attractors) exist under average forcing but a large disturbance between years 16 and 20 (e.g., a drought) causes the system state to fall below a threshold. In year 21, the large disturbance ends but the system converges to the lower steady state and stays there for the remaining years. In this case, both steady states emerge because stochastic forcing was enough to cause switching between states. Reproduced from [65] with permission from the American Geophysical Union.
Water 12 02510 g005
Figure 6. Response surfaces showing percentage changes in the 20-year return period flood (color coded) versus percentage changes in mean annual precipitation (y-axis) and seasonal variation in the changes (x-axis). The examples are for the Enrick at Mille of Tore (NE Scotland, left) and Roding at Redbridge (SE England, right). Dots show the distribution of changes inferred from the multi-model, multi-emission ensemble by the 2080s, comprising change factors from IPCC-AR4 GCMs (black dots) and UKCP09 RCMs (blue dots). Reprinted from [86] with permission from Elsevier.
Water 12 02510 g006
Figure 7. Representation of measures to reverse the decline of small water bodies from (a) degraded, to (b) a state of improved resilience following restorative action. Reproduced from [97] under the Open Government License.
Water 12 02510 g007
Figure 8. Paddling in (a) the River Dove, Derbyshire 28 May 2012. This crossing is ~50 m upstream of an Environment Agency monitoring site and immediately below a cool spring head a potential thermal refuge for biota during heatwaves and drought; (b) the River Trent, Nottinghamshire 14 July 1921. Droughts, such as those in 1976, 1921 and the Tudor mega-drought of 1540, can be used to stress-test the resilience of modern water supply systems. Photo (b) source: Nottstalgia Nottingham Forums.
Water 12 02510 g008
Table 1. Selected data and information gaps identified by CCRA2. Adapted from [50].
Climate Risk and Vulnerability Assessment
  • Decision-relevant metrics of climate vulnerability.
  • Indicators of socio-economic change relevant to climate risks (e.g., amount of urban greenspace).
  • Indicators of global threats to the UK (e.g., security of supply chains, geopolitical context).
Natural Environment and Natural Assets
  • Information about multipliers of climate risks (e.g., air pollution, habitat loss, soil erosion).
  • Surveillance systems for early detection of non-native species, pests and diseases.
  • Quantitative information on tree growth rates and drought sensitivity of different species.
  • Indicators of farmland practices and impacts (e.g., drainage systems, water use, crop yields).
Infrastructure
  • Information on asset adaptation measures (e.g., raising heights of sub-stations to resist floods).
  • Information about asset condition, materials, design specification and performance.
  • Data on long-term implications of weather and climate for infrastructure performance.
  • Data about infrastructure resilience, capacity to absorb shocks, connectedness and failures.
People and the Built Environment
  • Indicators of urbanization trends (e.g., patterns of migration, growth/decline, new towns).
  • Data on the extent of new developments on floodplains in Wales and Northern Ireland.
  • Data on flood impacts related to health and social care delivery.
  • Scenarios of socio demographic trends to support assessments of future social vulnerability.
Table 2. Examples of indicators shown in the 2019 Adaptation Sub Committee report [57].
Natural Environment
  • Condition of Sites of Special Scientific Interest (terrestrial, freshwater, coastal, farmland, bog).
  • Size and spatial configuration of woodland patches within the landscape.
  • Proportion of water bodies meeting Good status in England.
  • Volumes of abstraction from non-tidal water sources for agriculture in England.
  • Total number of wildfire incidents.
People and the Built Environment
  • Percentage and number of new properties built in Flood Zone 3.
  • Number of planning permissions that are granted contrary to Environment Agency advice.
  • Area of permeable and impermeable land within all urban areas in England.
  • Weighted average water consumption per capita in England.
  • Percentage of households in England and Wales with water meters.
Infrastructure
  • Total number of minutes of delay per weather related incident in England (rail).
  • Total leakage for all water companies.
  • Reported and forecasted spend on resilience by water companies.

