Entropy-Based Research on Precipitation Variability in the Source Region of China’s Yellow River
Abstract
1. Introduction
2. Materials
2.1. Study Basin
2.2. Precipitation Datasets
2.3. Land Cover Map
3. Methods
3.1. Calculation of Variability
3.1.1. Entropy
3.1.2. Entropy Application in Precipitation Analysis
3.1.3. Disorder Index
3.2. Statistical Test
4. Results and Discussion
4.1. Variability of Precipitation
4.1.1. Inter-Annual Variation of Annual and Monthly Precipitation
4.1.2. Intra-Annual Distribution of Daily Precipitation
4.2. Variation of Precipitation Distribution
4.2.1. Abrupt Change Analysis and Stages Division
4.2.2. Annual Precipitation and Intra-Annual Variability Distribution in Stages
4.3. Implication of Precipitation and Its Variability
4.3.1. Long-Term Precipitation Variation Characteristics
4.3.2. Throughout-the-Year Moisture Supply
5. Conclusions
- (1)
- The AP series shows a significantly increasing trend during 1979–2015 measured by the M–K test and the inclination rate is 2.7 mm·a−1, with a reverse in climate trend from warm-dry to warm-wet. Wetting is mainly attributed to the growing impact of global climate change, in particular the enhanced southwest monsoon and a warming-induced freeze-thaw process, with summer monsoons making the biggest contribution.
- (2)
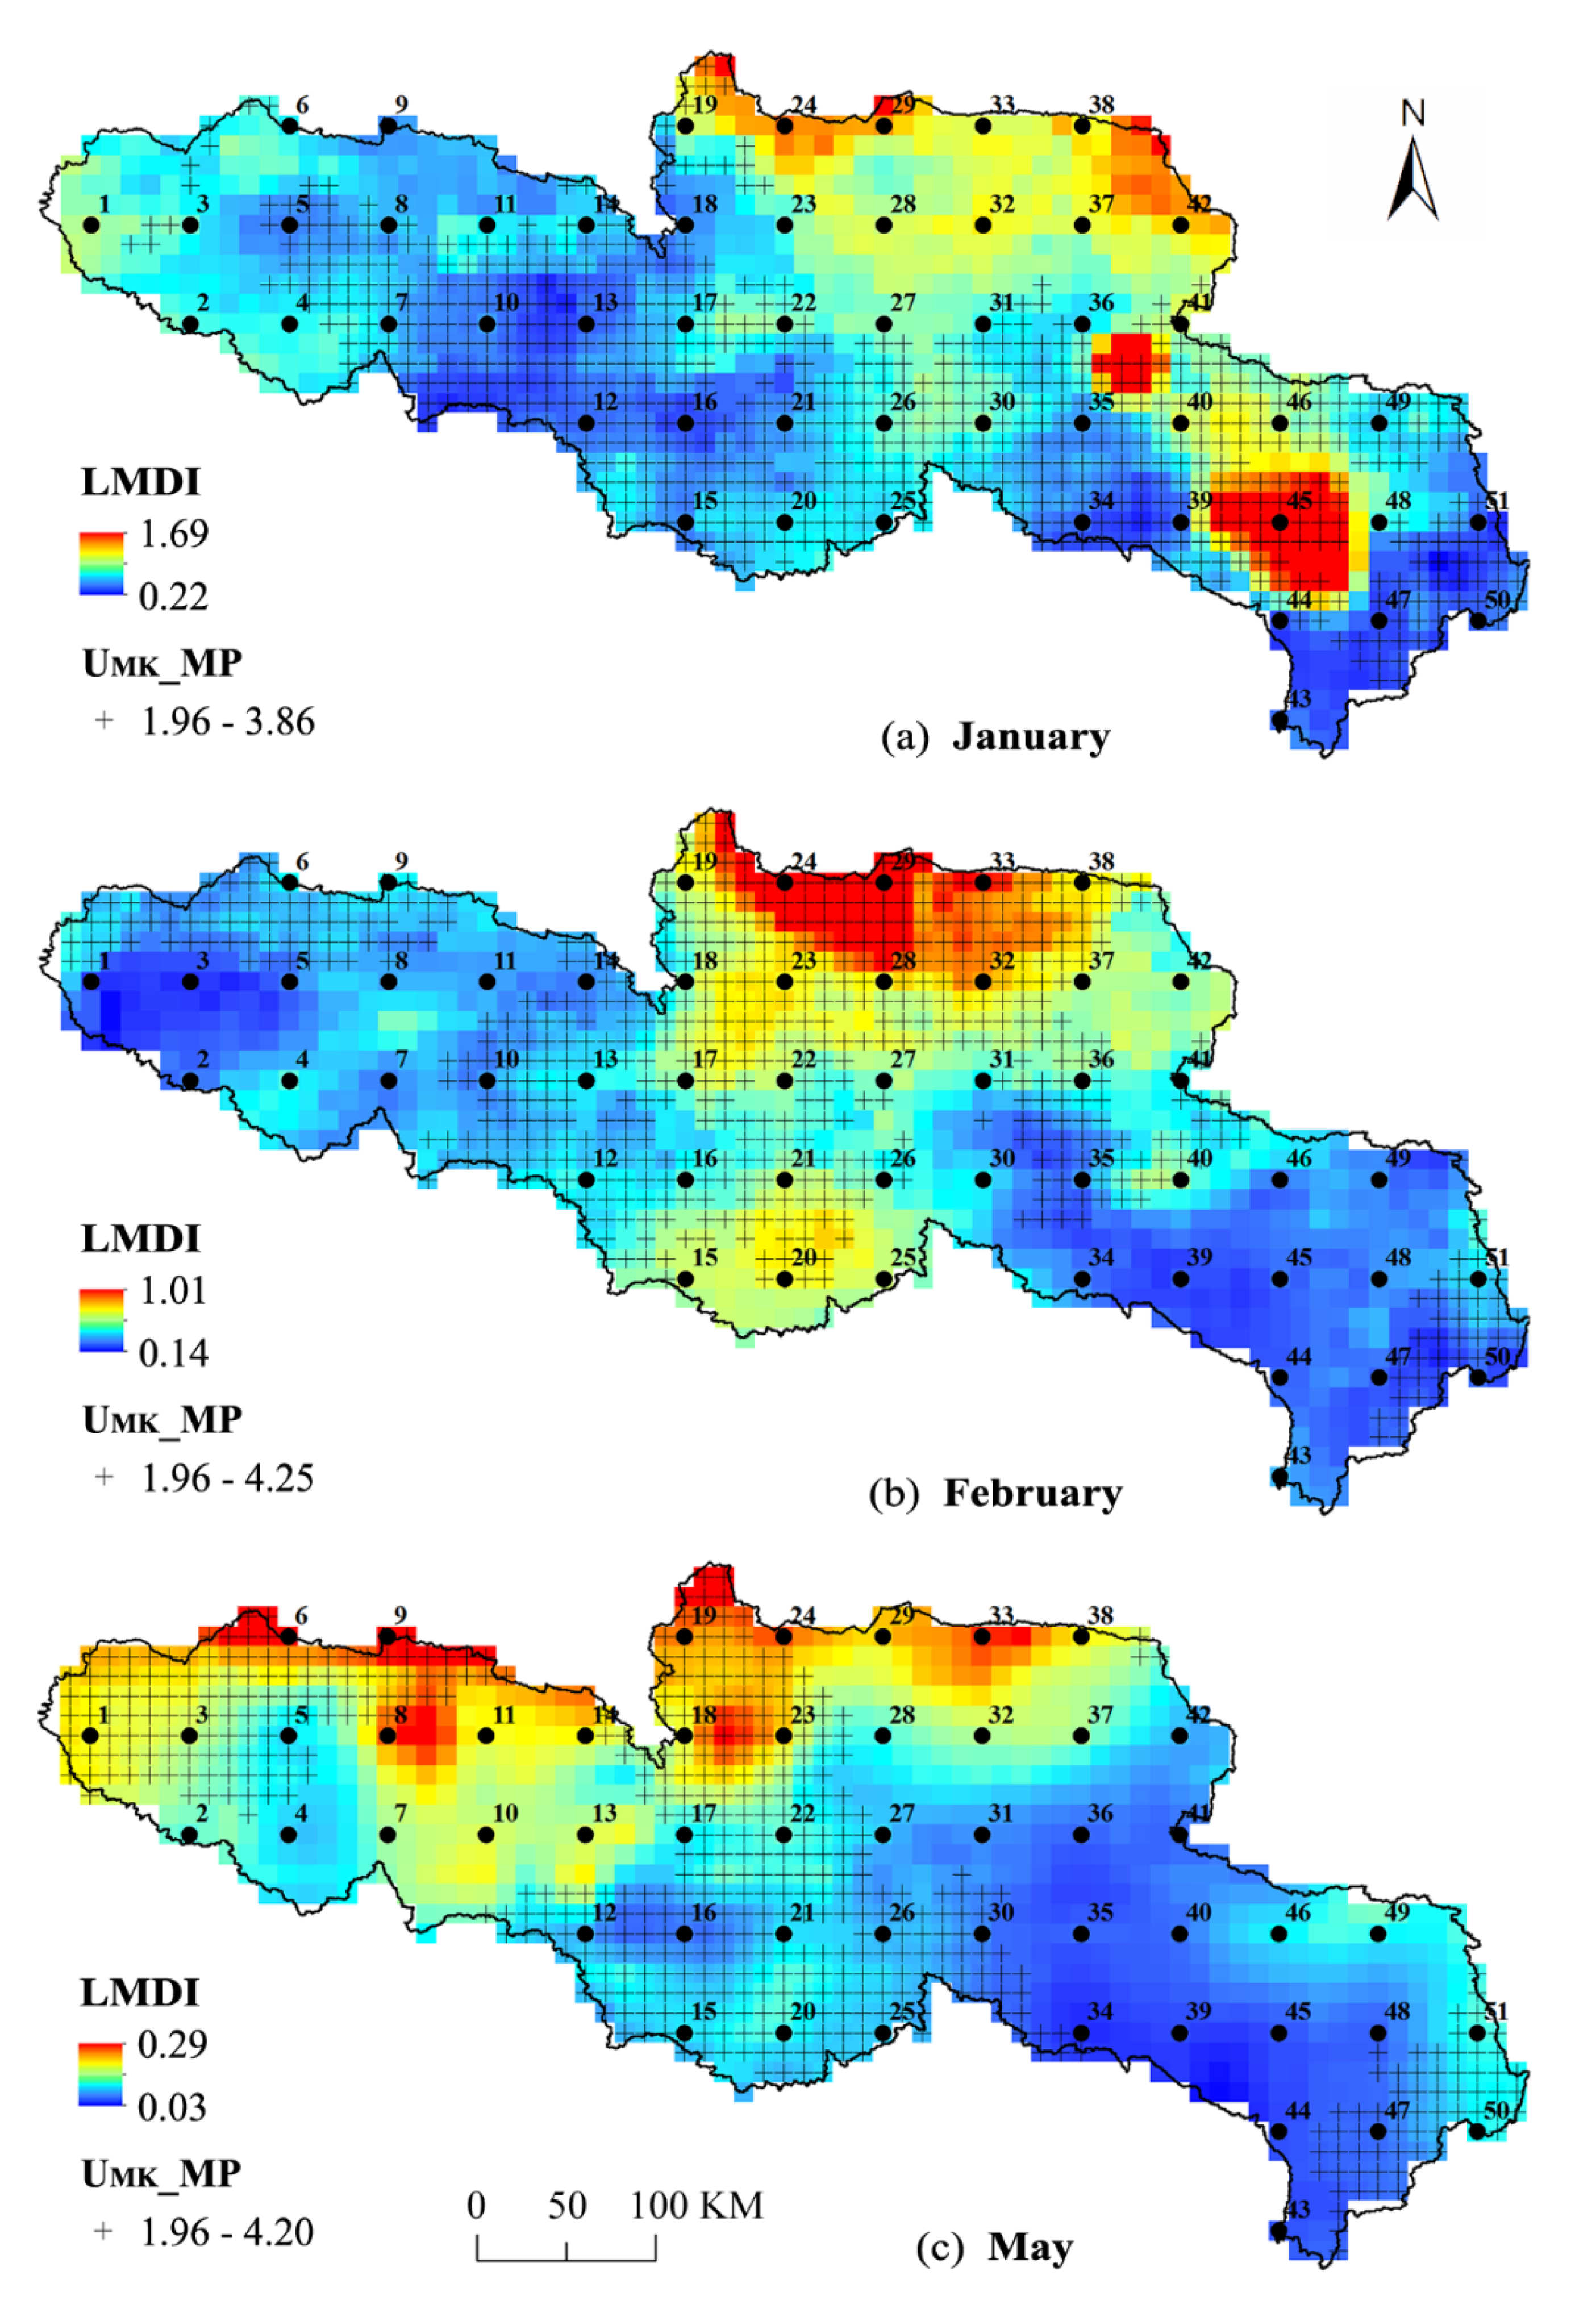
- The arrival of the summer monsoon was advanced, which makes May the beginning of the wet season, and the increase in the MP in May contributes to the main changes in AP. There are four quantitative pieces of evidence to support this view. The proportion of MP in AP during May–September ranges between 11.6–20.6%, while in the other months it is no higher than 6.5%; the average LMDI during May–September is about 0.1, the other months are all above 0.2; the MP in May is the only month during May–September in sync with the significantly incrasing AP trend during 1979–2015; the spatial distribution of LMDI in May is conformed with that of the AP, dividing the basin in half based on a value, which for MP in May is 0.1 within the range 0.03–0.29 and for AP is 0.02 within 0.01–0.10, with NW over the value and SE under it.
- (3)
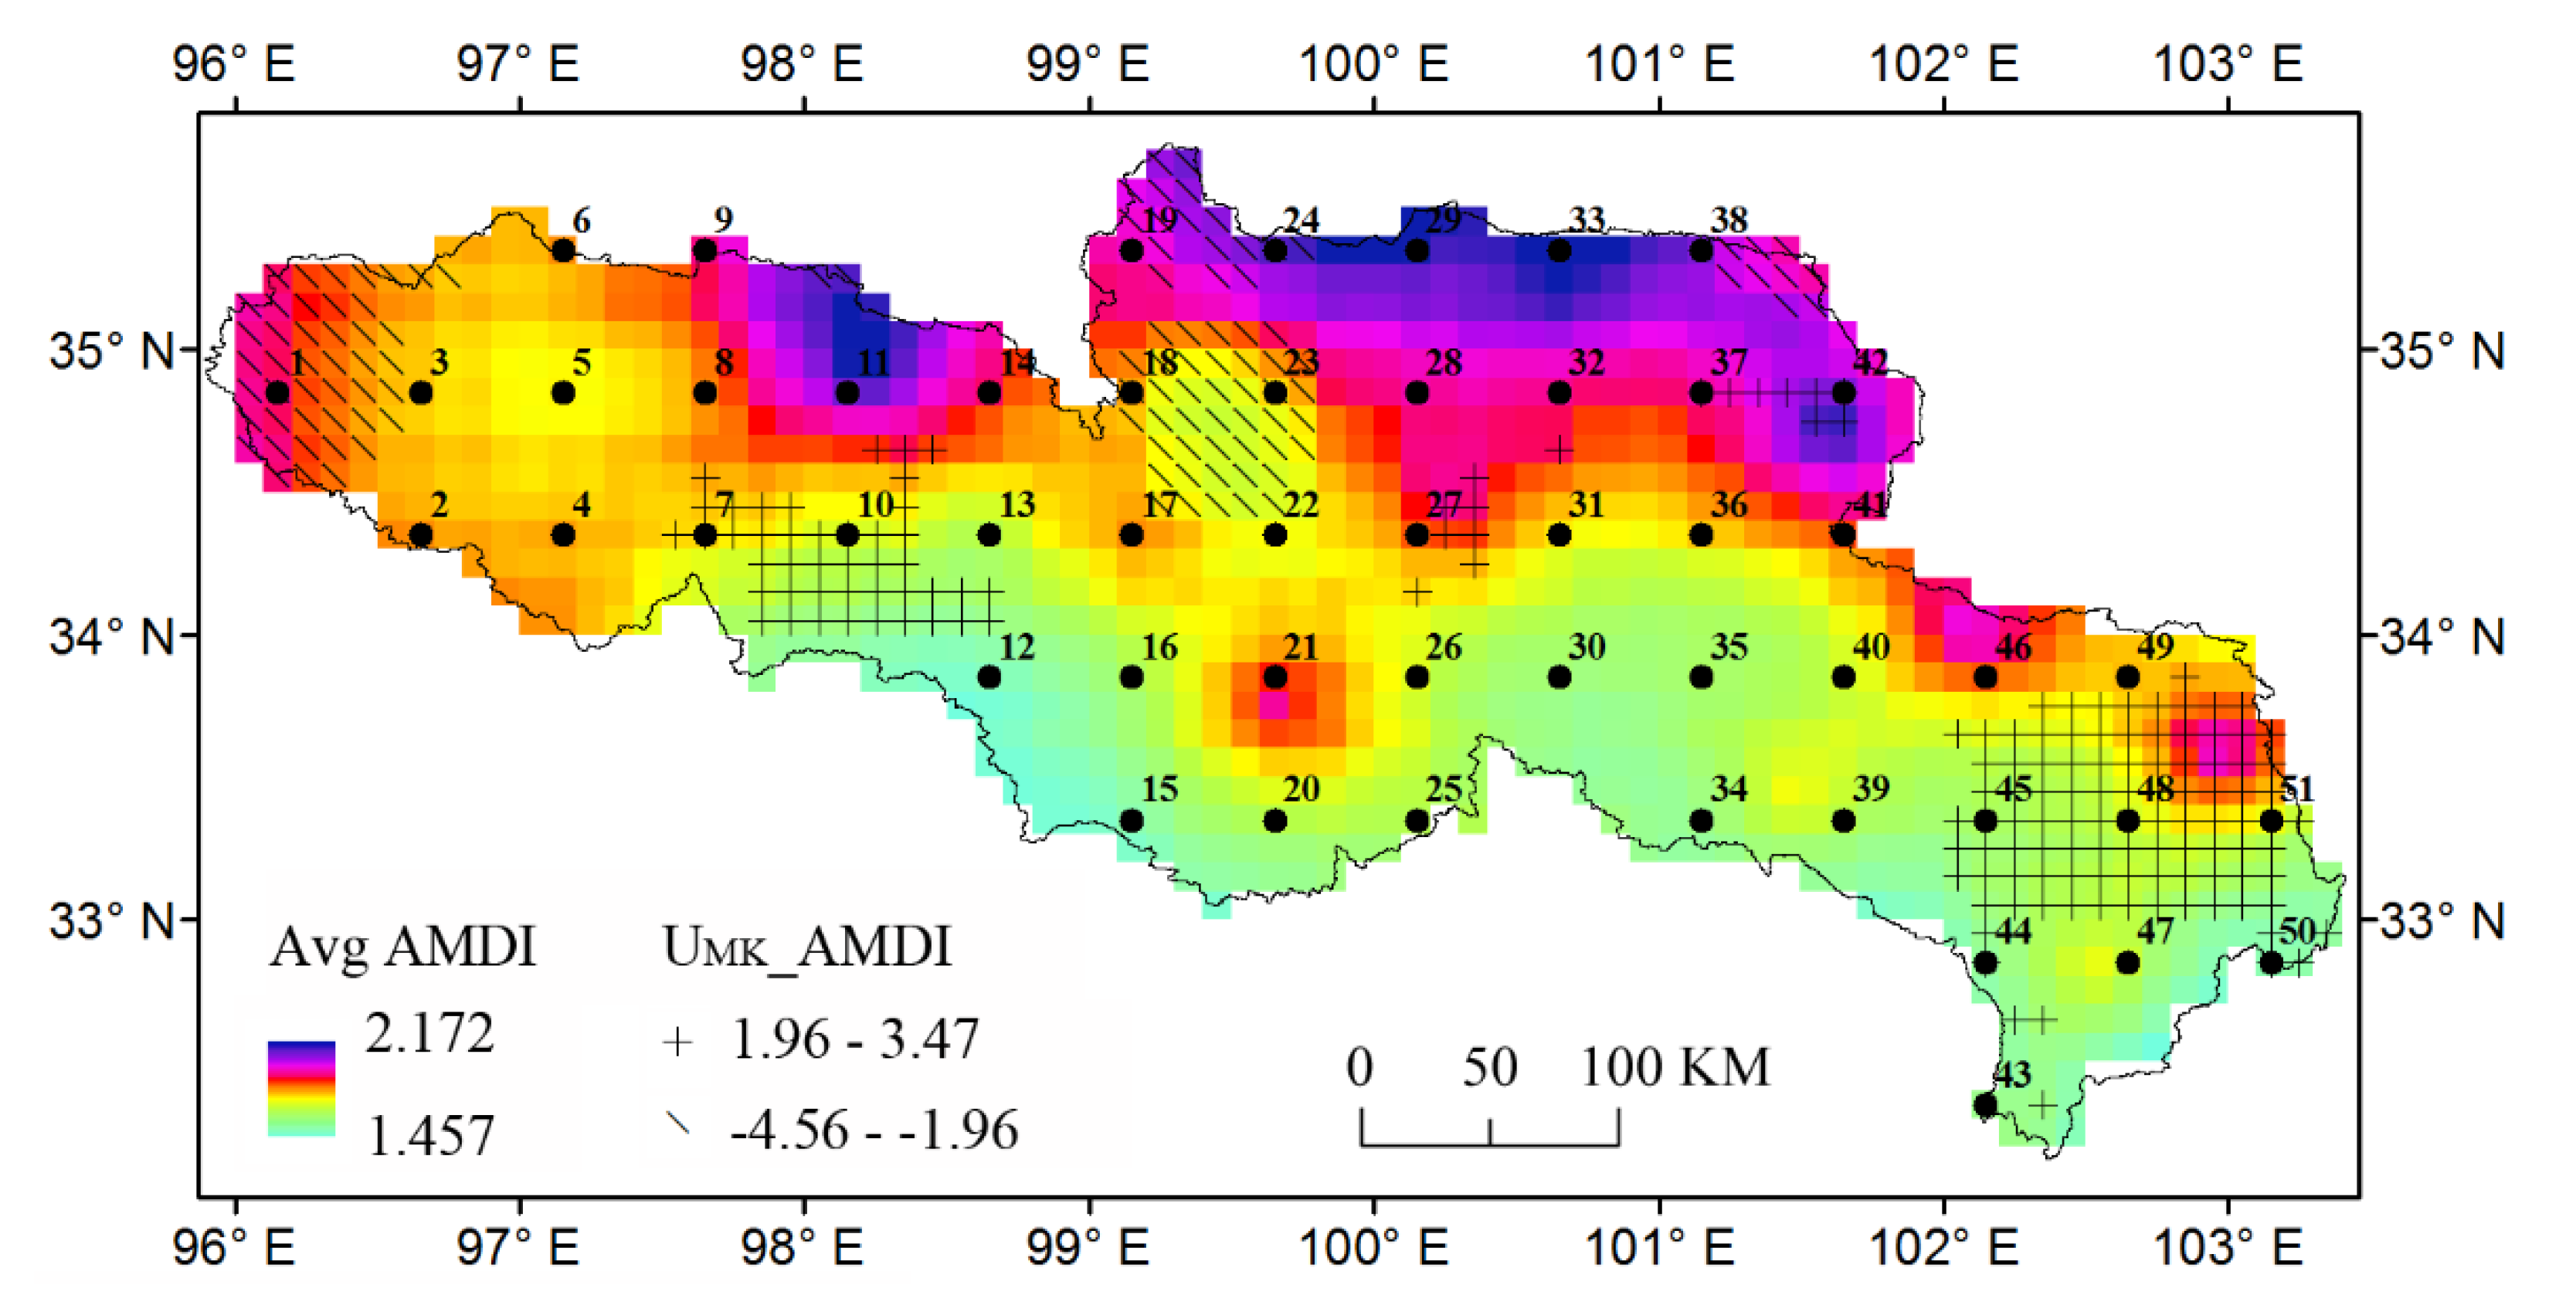
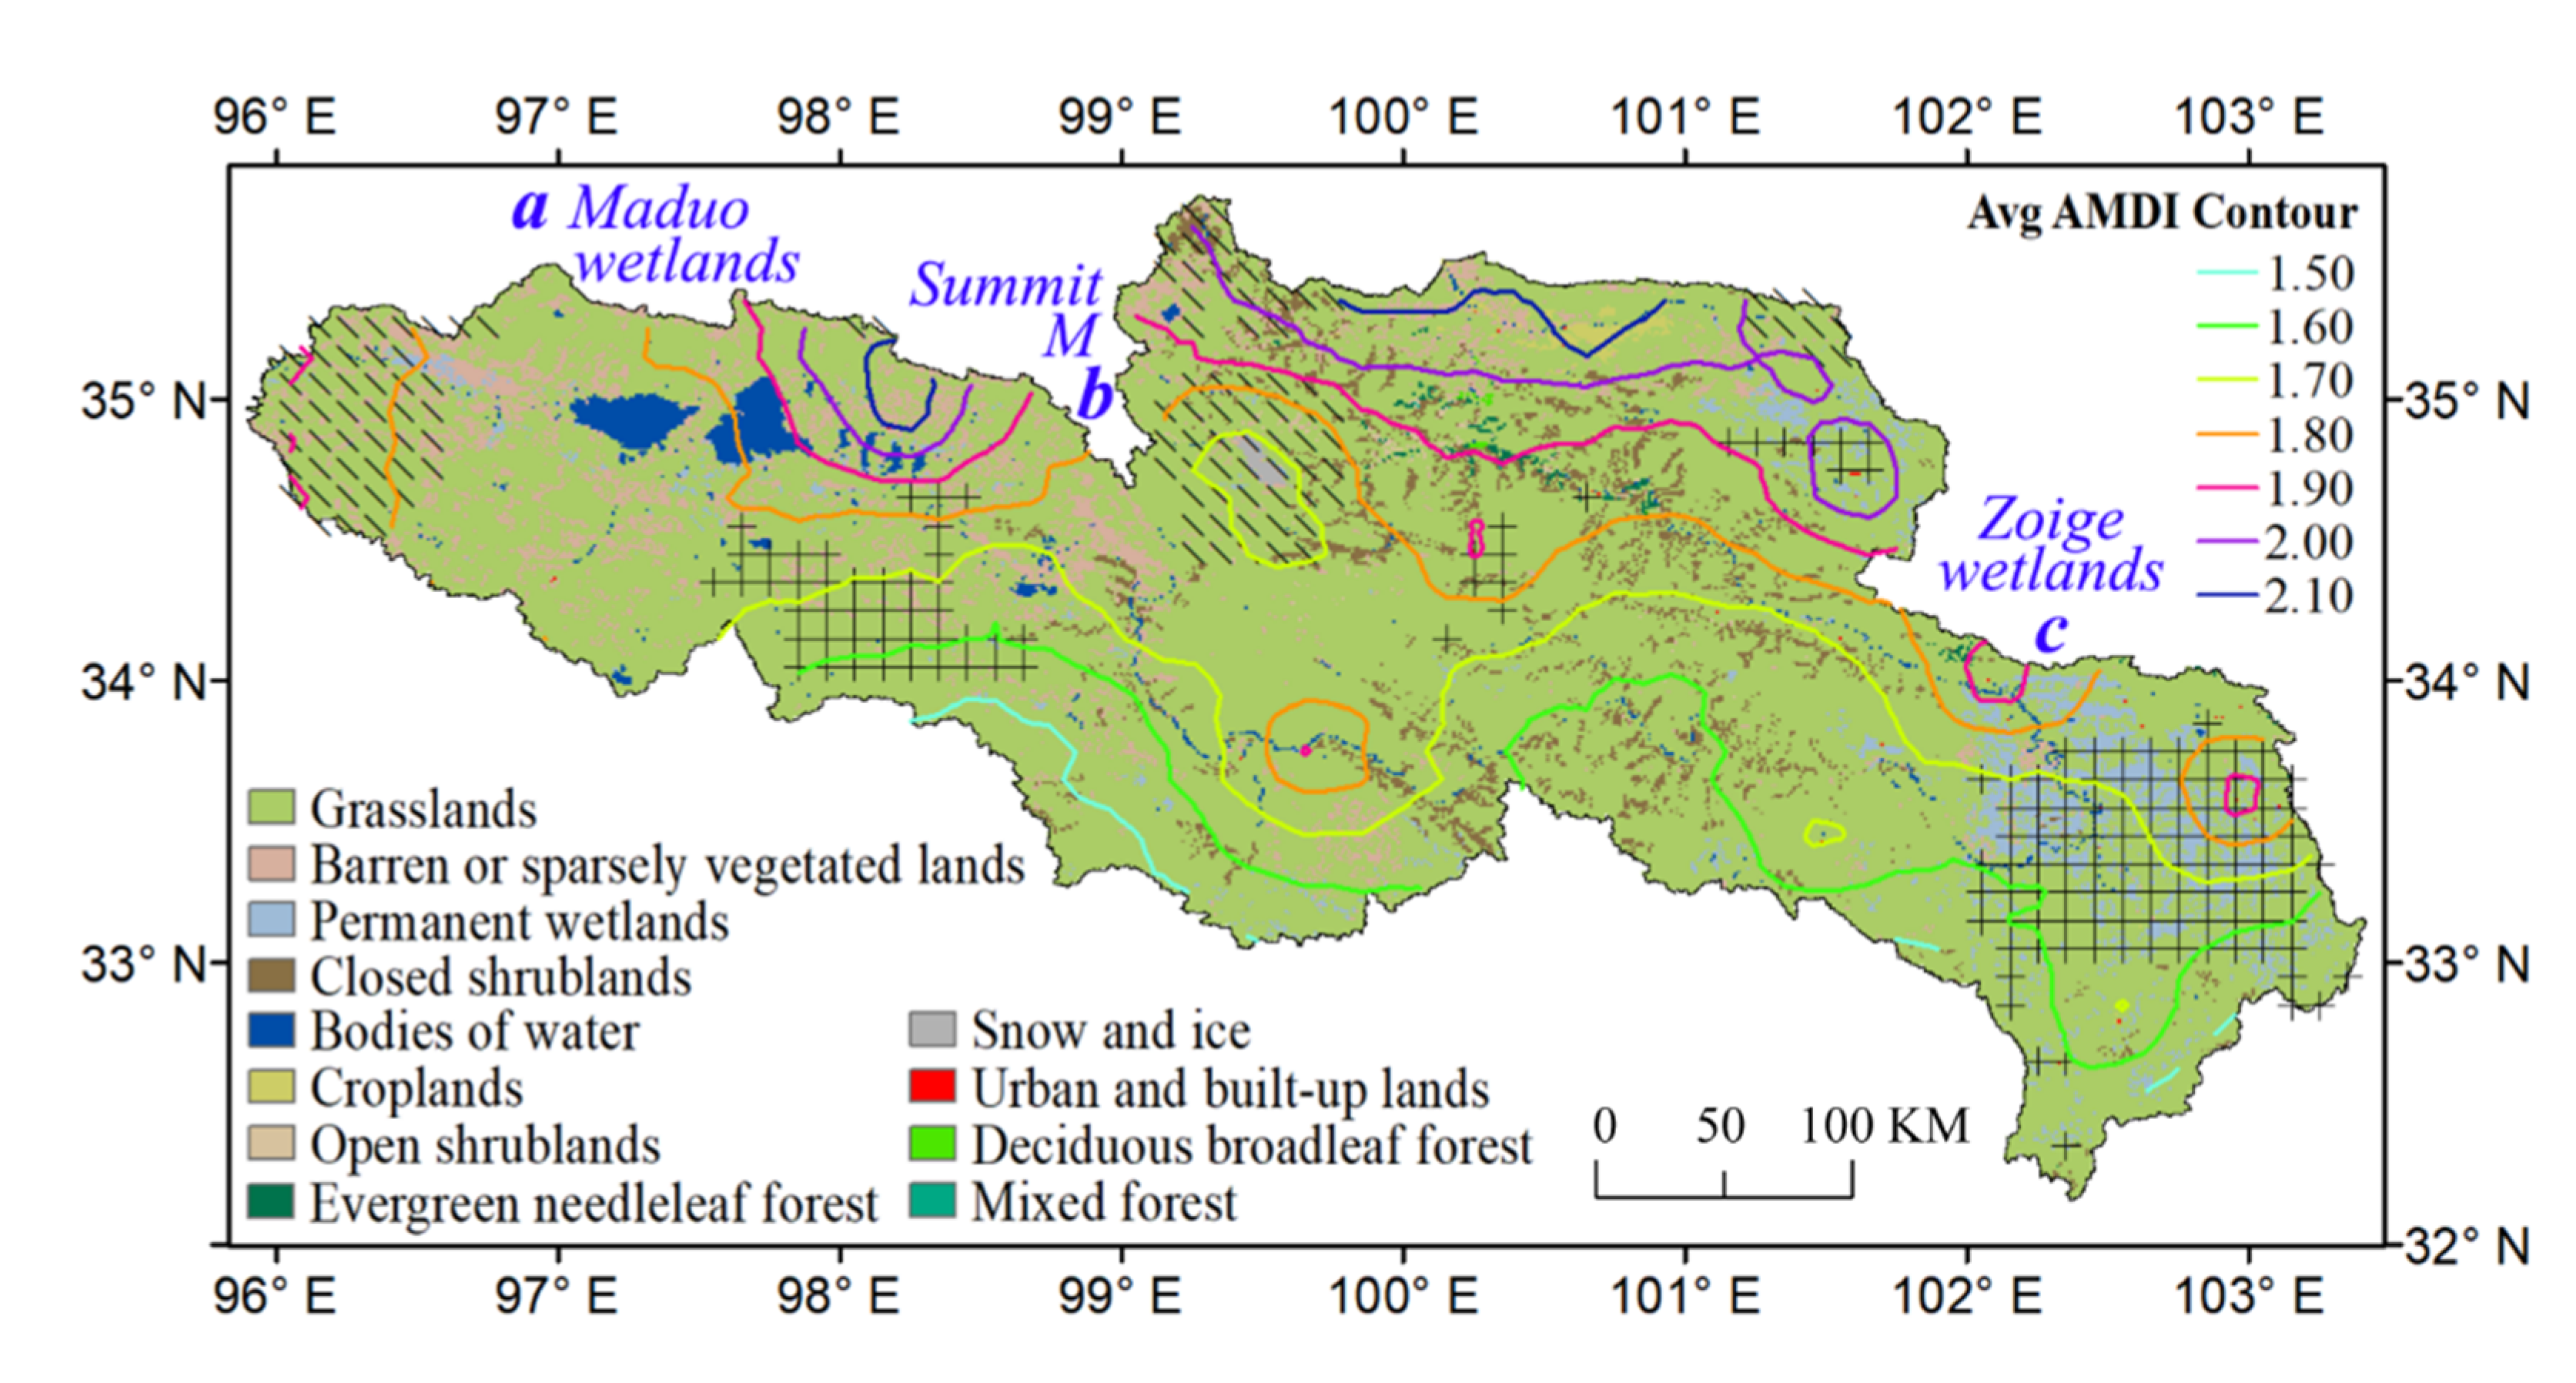
- The variability of the throughout-the-year precipitation apportionment based on daily precipitation is measured by AMDI. The long-term AMDI time series ranges between 1.52–1.93 during 1979–2015, and no significant trend was detected during 1979–2006. The multi-year average AMDI roughly increased with latitude in space, with a range of 1.46–2.17. The Zoige Plateau Wetland (wetlands on the SE), the Maduo country (wetlands on the West) and the summit M (peak of the SRYR) is more uniform than the neighborhood by about 0.1 in AMDI, as a result of a relatively perennial local water supply.
- (4)
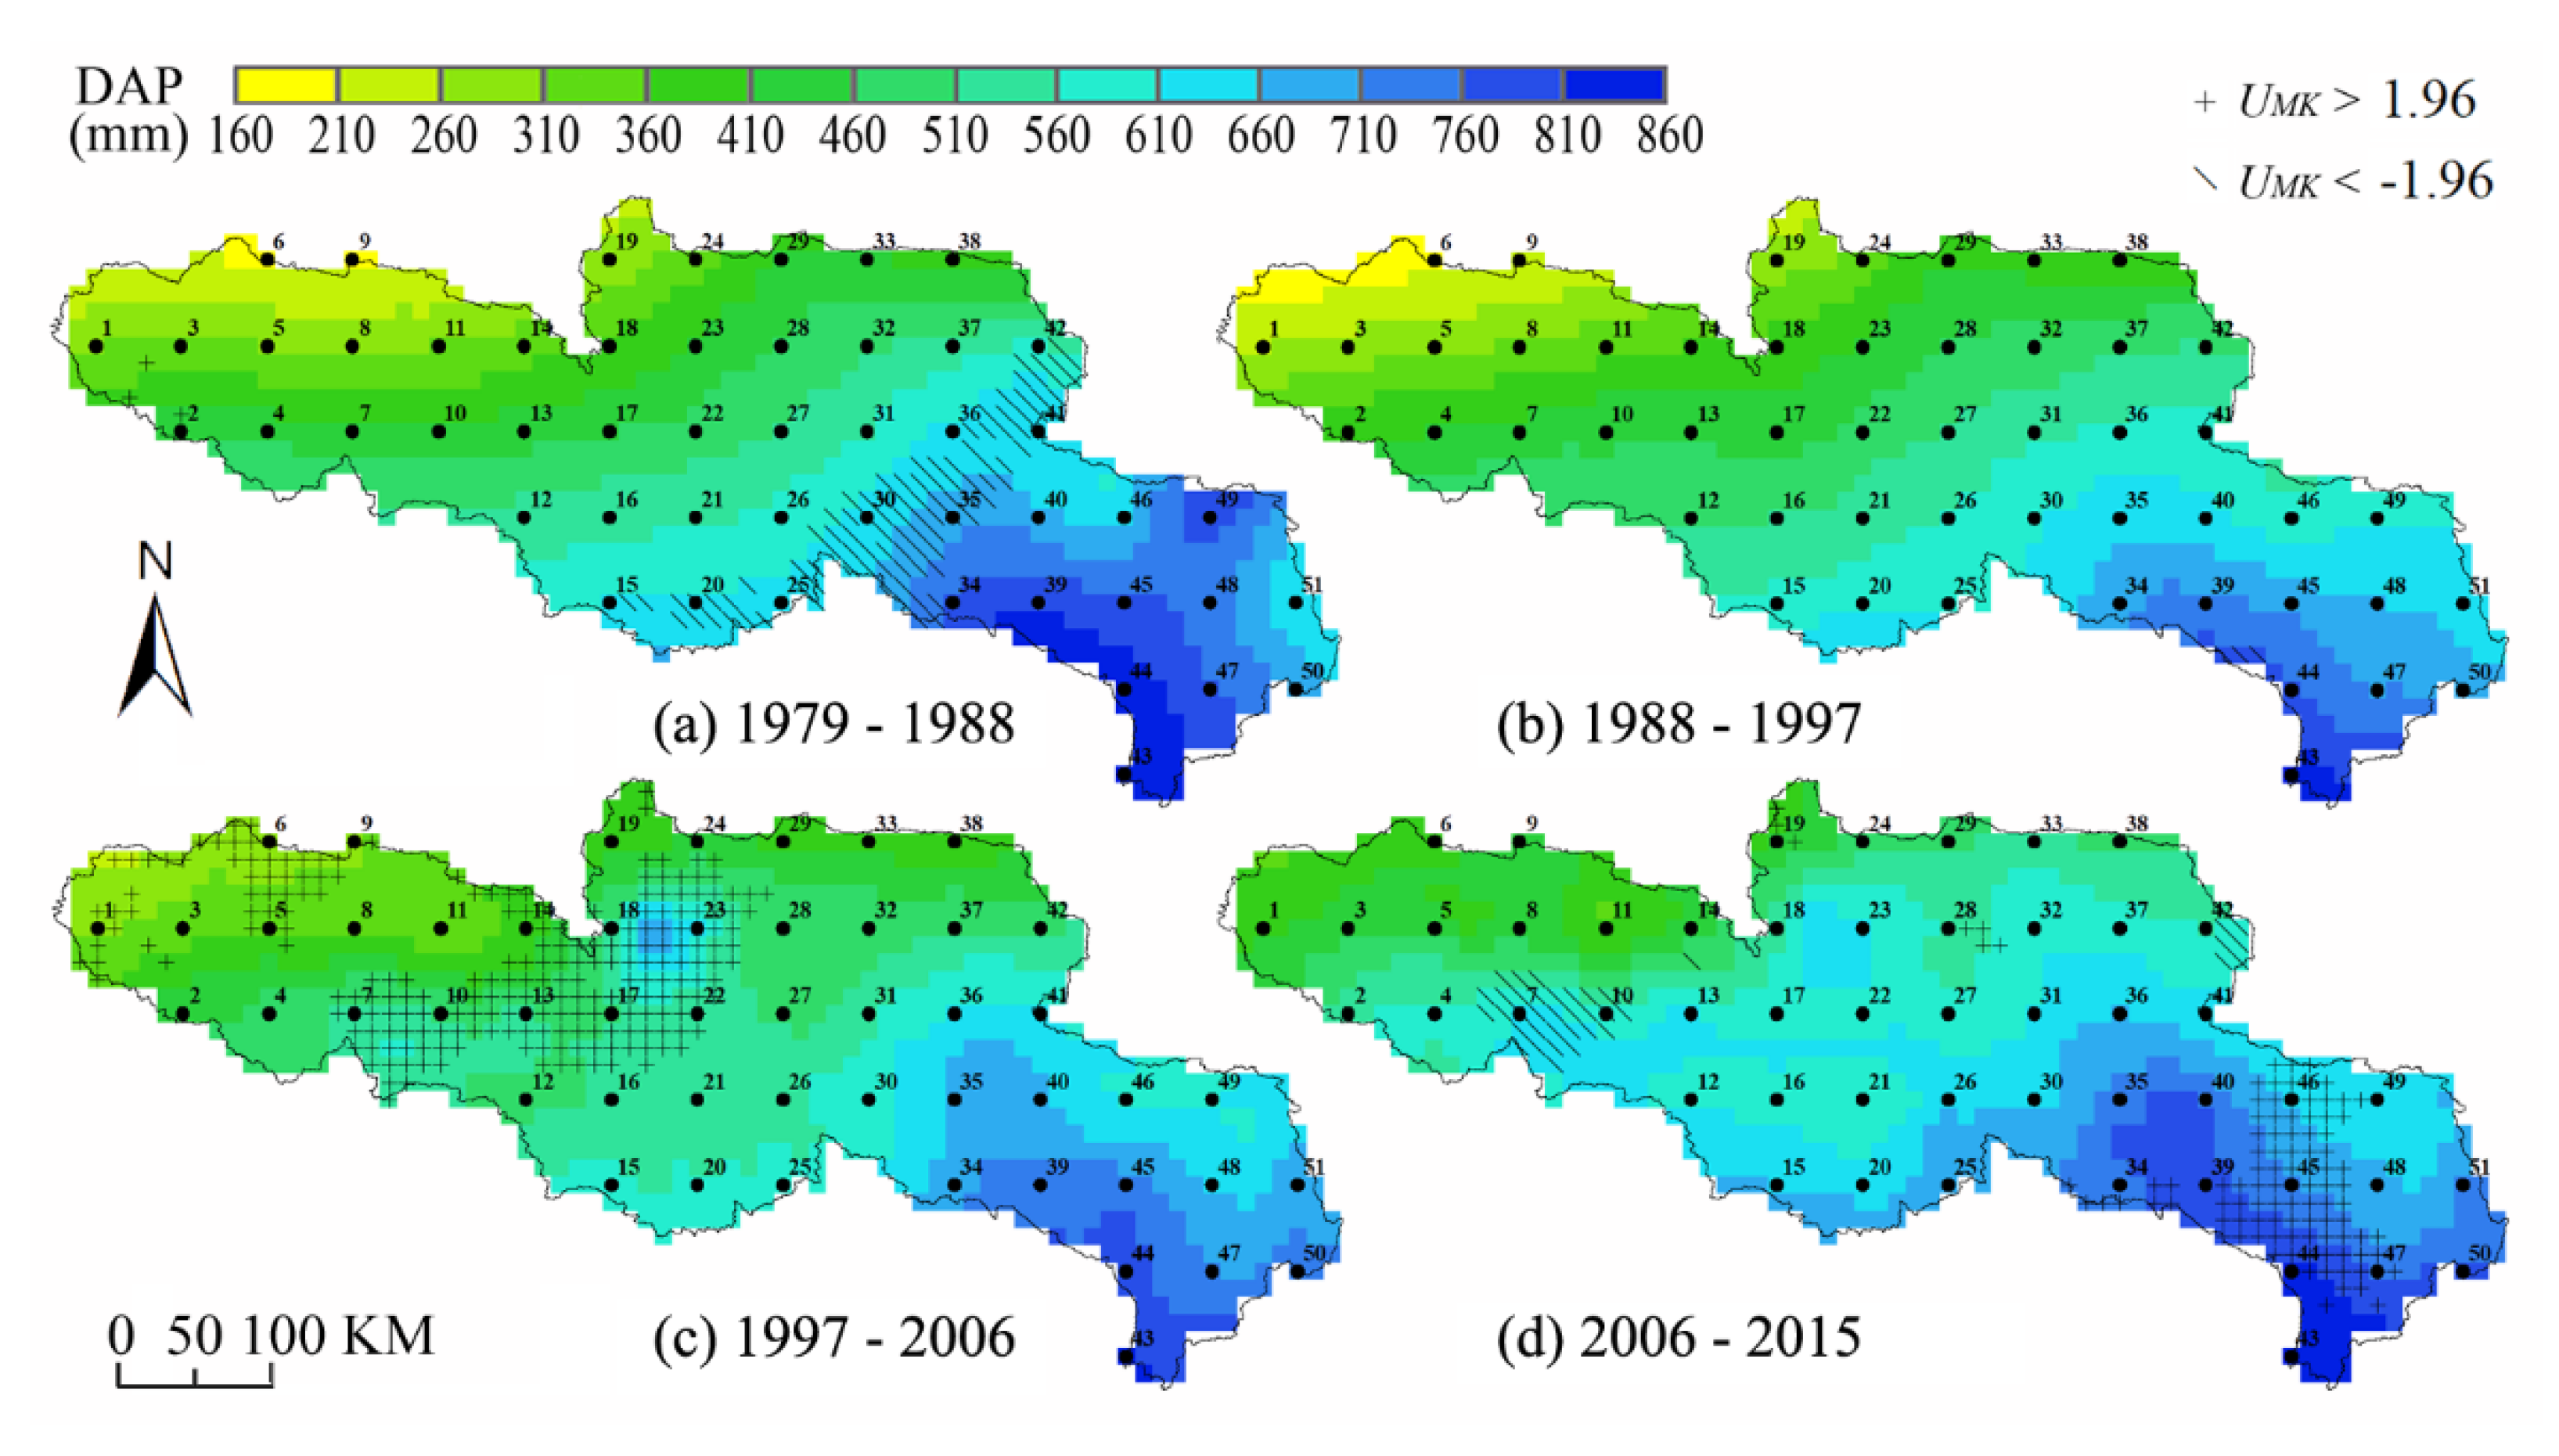
- The increase in precipitation amounts were concentrated in the period after 1997, especially in the decade of 1997–2006, according to a segmented study. During 1979–2006, the mean, minimum and maximum regional averages of AP reached their biggest rising rate, as 9.8 mm·a−1, 12.0 mm·a−1 and 15.3 mm·a−1, respectively. The big increase in the minimum is a remarkable feature in wetting. Meanwhile, the intra-annual apportionment variability slightly increased in the mean and the maximum, and decreased in the minimum, the rate is 0.008 a−1, 0.009 a−1 and -0.003 a−1, successively.
- (5)
- From a spatial distribution perspective, the increase in AP after 1997 was concentrated on the NW high-altitude areas first and then the lower southern corner. AP in the summit M changed from 390 mm to 680 mm during 1997–2006, and the southern corner was raised by about 50 mm in AP during the last decade. The degradation problem drove the moisture supply on the Zoige Plateau Wetland towards non-uniformity mainly during 1997–2006, when its AMDI raised from 1.4 to 1.7; the supply on the summit M and the headwater NW corner varied towards perennial with the AMDI dropping from 1.8/2.0 to 1.5/1.8, respectively, and part of the North Slope in the Bayan Har Mountain towards temporary, as the AMDI increased from 1.4 to 1.6, due to the single or combined effect of enhanced monsoon and/or a freeze-thaw process after 1997.
Author Contributions
Funding
Conflicts of Interest
References
- Barros, A.P.; Lettenmaier, D.P. Dynamic Modeling of the Spatial Distribution of Precipitation in Remote Mountainous Areas. Mon. Weather. Rev. 1993, 121, 1195–1214. [Google Scholar] [CrossRef]
- Mishra, A.K.; Özger, M.; Singh, V.P. An entropy-based investigation into the variability of precipitation. J. Hydrol. 2009, 370, 139–154. [Google Scholar] [CrossRef]
- Yuan, F.; Berndtsson, R.; Uvo, C.B.; Zhang, L.; Jiang, P. Summer precipitation prediction in the source region of the Yellow River using climate indices. Hidrol. Res. 2016, 47, 847–856. [Google Scholar] [CrossRef]
- Pohl, E.; Gloaguen, R.; Seiler, R. Remote Sensing-Based Assessment of the Variability of Winter and Summer Precipitation in the Pamirs and Their Effects on Hydrology and Hazards Using Harmonic Time Series Analysis. Remote Sens. 2015, 7, 9727–9752. [Google Scholar] [CrossRef]
- Clark, P.U.; Alley, R.B.; Pollard, D. Northern Hemisphere Ice-Sheet Influences on Global Climate Change. Science 1999, 286, 1104–1111. [Google Scholar] [CrossRef]
- Li, B.; Yu, Z.; Liang, Z.; Acharya, K. Hydrologic response of a high altitude glacierized basin in the central Tibetan Plateau. Glob. Planet. Chang. 2014, 118, 69–84. [Google Scholar] [CrossRef]
- Li, Q.; Yang, M.; Wan, G.; Wang, X. Spatial and temporal precipitation variability in the source region of the Yellow River. Environ. Earth Sci. 2016, 75, 594. [Google Scholar] [CrossRef]
- Ran, Y.H.; Li, X.; Lu, L.; Li, Z.Y. Large-scale land cover mapping with the integration of multi-source information based on the Dempster–Shafer theory. Int. J. Geogr. Inf. Sci. 2012, 26, 169–191. [Google Scholar] [CrossRef]
- Hu, Y.; Maskey, S.; Uhlenbrook, S.; Zhao, H. Streamflow trends and climate linkages in the source region of the Yellow River, China. Hydrol. Process. 2011, 25, 3399–3411. [Google Scholar] [CrossRef]
- Yi, X.S.; Li, G.S.; Yin, Y.Y. The impacts of grassland vegetation degradation on soil hydrological and ecological effects in the source region of the Yellow River—A case study in Junmuchang region of Maqin country. Procedia Environ. Sci. 2012, 13, 967–981. [Google Scholar] [CrossRef]
- Meng, F.; Su, F.; Yang, D.; Tong, K.; Hao, Z. Impacts of recent climate change on the hydrology in the source region of the Yellow River basin. J. Hydrol. Reg. Stud. 2016, 6, 66–81. [Google Scholar] [CrossRef]
- Zheng, H.X.; Zhang, L.; Zhu, R.R.; Liu, C.M.; Sato, Y.; Fukushima, Y. Responses of streamflow to climate and land surface change in the headwaters of the Yellow River Basin. Water Resour. Res. 2009, 45, 641–648. [Google Scholar] [CrossRef]
- ASTER Global Digital Elevation Model. Version 2. Available online: https://lpdaac.usgs.gov/documents/220/Summary_GDEM2_validation_report_final.pdf (accessed on 17 October 2011).
- Jie, H.E.; Kun, Y. China meteorological forcing dataset (1979–2015). Available online: http://westdc.westgis.ac.cn/en/data/7a35329c-c53f-4267-aa07-e0037d913a21/ (accessed on 1 May 2016).
- Chen, Y.; Yang, K.; Jie, H.; Qin, J.; Shi, J.; Du, J.; He, Q. Improving land surface temperature modeling for dry land of China. J. Geophys. Res. Atmos. 2011, 116. [Google Scholar] [CrossRef]
- Fang, Y.H.; Zhang, X.; Corbari, C.; Mancini, M.; Zeng, W. Improving the Xin’anjiang hydrological model based on mass–energy balance. Hydrol. Earth Syst. Sc. 2017, 21, 3359–3375. [Google Scholar] [CrossRef]
- Yang, K.; He, J.; Tang, W.; Qin, J.; Cheng, C.C.K. On downward shortwave and longwave radiations over high altitude regions: Observation and modeling in the Tibetan Plateau. Agric. For. Meteorol. 2010, 150, 38–46. [Google Scholar] [CrossRef]
- Ran, Y.; Li, X. Multi-source Integrated Chinese Land Cover Map. Available online: http://data.tpdc.ac.cn/zh-hans/data/7e61387b-d3f2-40cb-bc05-8d16e01ea72b/ (accessed on 9 August 2019).
- Shannon, C.E. A mathematical theory of communication. Bell Syst. Tech. J. 1948, 27, 379–423, 623–656, Reprited in C.E. Shannon and W. Weaver The Mathematical Theory of Communication; University Illinois Press: Champaign, IL, USA, 1949. [Google Scholar] [CrossRef]
- Fisher, R.A. XV.—The Correlation between Relatives on the Supposition of Mendelian Inheritance. Trans. R. Soc. Edinb. 1918, 52, 399–433. [Google Scholar] [CrossRef]
- NIST/SEMATECH e-Handbook of Statistical Methods."1.3.6.4. Location and Scale Parameters". 2013. Available online: https://www.itl.nist.gov/div898/handbook/eda/section3/eda364.htm (accessed on 30 October 2013).
- Kendall, M.G. Rank Correlation Methods; Griffin: Oxford, UK, 1948; Volume 34, p. 108. [Google Scholar]
- Mann, H.B. Nonparametric Tests Against Trend. Econometrica 1945, 13, 245–259. [Google Scholar] [CrossRef]
- Pettitt, A.N. A Non-Parametric Approach to the Change-Point Problem. J. Royal Stat. Soc. 1979, 28, 126–135. [Google Scholar] [CrossRef]
- Wang, G.; Qian, J.; Cheng, G.; Lai, Y. Eco-environmental degradation and causal analysis in the source region of the Yellow River. Environ. Geol. 2001, 40, 884–890. [Google Scholar] [CrossRef]
- Zhang, W.; Zhou, T.; Zhang, L. Wetting and greening Tibetan Plateau in early summer in recent decades: Wetting and Greening Tibetan Plateau. J. Geophys. Res. Atmos. 2017, 122, 5808–5822. [Google Scholar] [CrossRef]
- Spicer, R.A. Tibet, the Himalaya, Asian monsoons and biodiversity-In what ways are they related? Plant Divers. 2017, 39, 233–244. [Google Scholar] [CrossRef] [PubMed]
- Li, X.; Xue, Z.; Gao, J. Dynamic Changes of Plateau Wetlands in Madou County, the Yellow River Source Zone of China: 1990–2013. Wetlands 2016, 36, 299–310. [Google Scholar] [CrossRef]
- Bai, J.-H.; Lu, Q.-Q.; Wang, J.-J.; Zhao, Q.-Q.; Ouyang, H.; Deng, W.; Li, A.-N. Landscape pattern evolution processes of alpine wetlands and their driving factors in the Zoige Plateau of China. J. Mt. Sci. 2013, 10, 54–67. [Google Scholar] [CrossRef]
- Li, X.; Xue, Z.; Gao, J. Environmental Influence on Vegetation Properties of Frigid Wetlands on the Qinghai-Tibet Plateau, Western China. Wetlands 2016, 36, 807–819. [Google Scholar] [CrossRef]

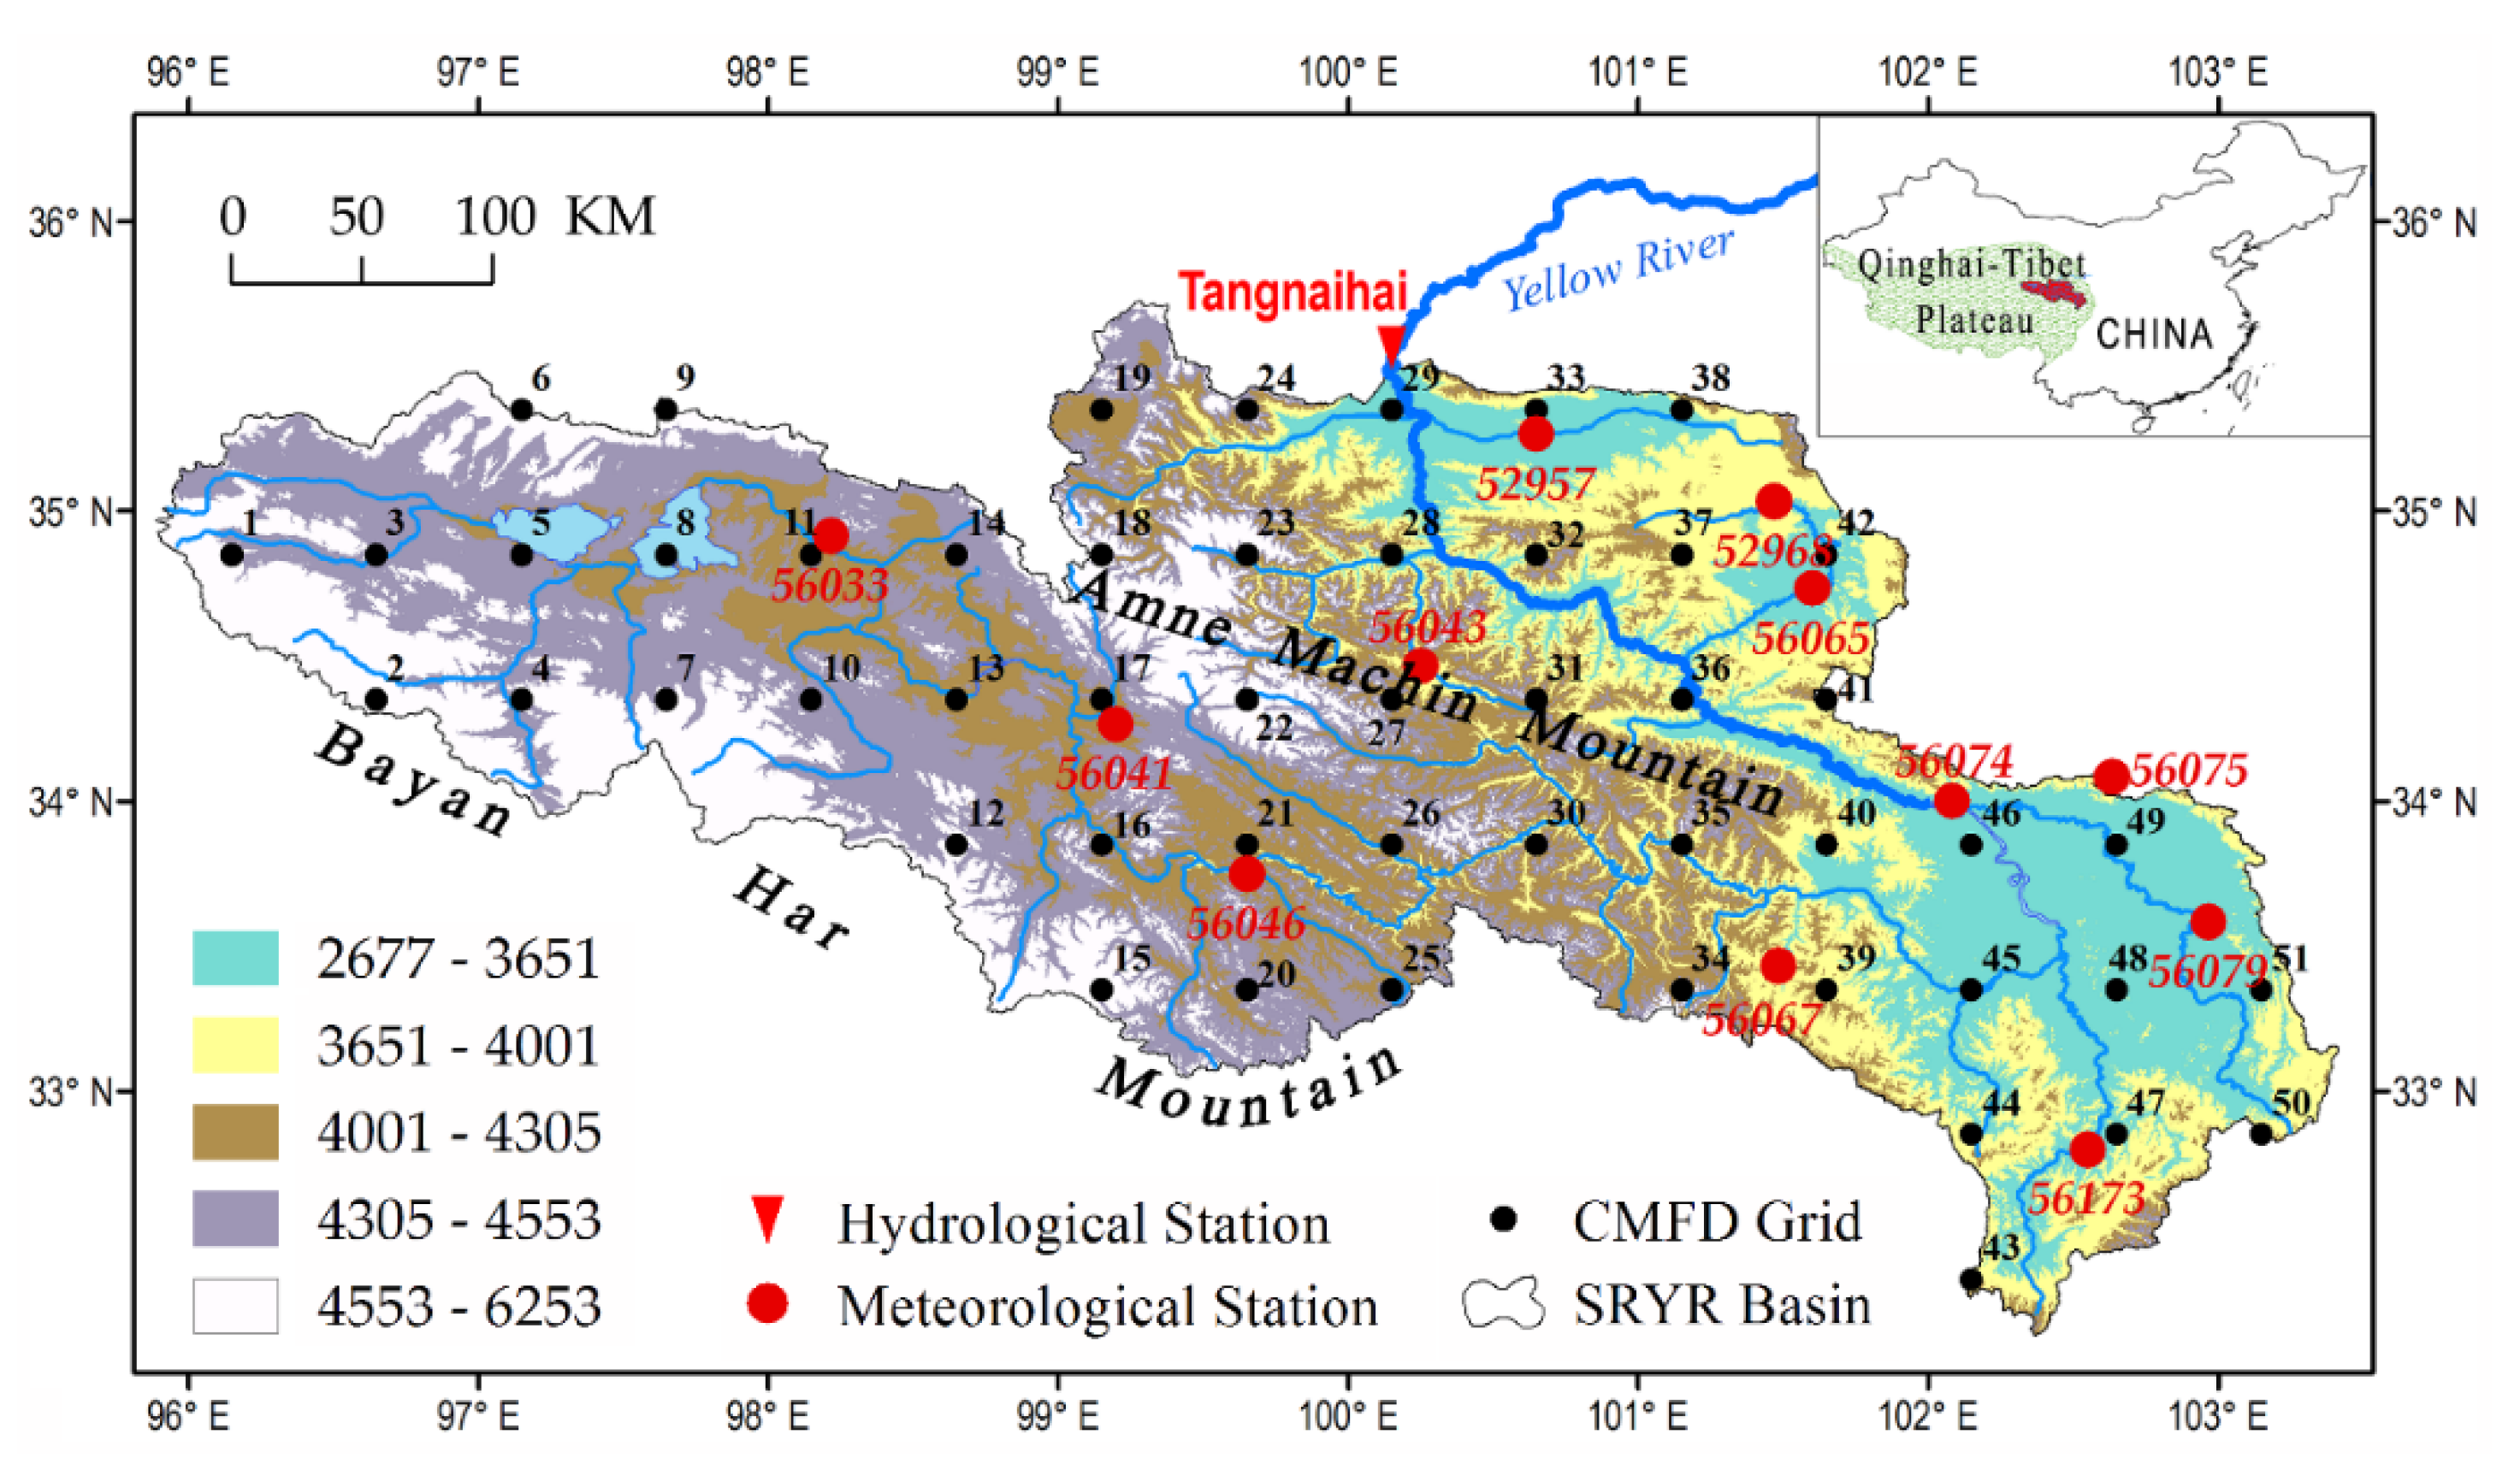





| ID | Name | Longitude (°E) | Latitude (°N) | Altitude (m) | Period (Year) |
|---|---|---|---|---|---|
| 52957 1 | Tongde | 100.65 | 35.27 | 3289.4 | 1954–1998 |
| 52968 | Zeku | 101.47 | 35.03 | 3662.8 | 1957–1990 |
| 56033 | Maduo | 98.22 | 34.92 | 4272.3 | 1953– |
| 56041 | Zhongxin | 99.2 | 34.27 | 4211.1 | 1959–1997 |
| 56043 | Guoluo | 100.25 | 34.47 | 3719 | 1991– |
| 56046 | Dari | 99.65 | 33.75 | 3967.5 | 1956– |
| 56065 | Henan | 101.6 | 34.73 | 3500 | 1959– |
| 56067 | Jiuzhi | 101.48 | 33.43 | 3628.5 | 1958– |
| 56074 | Maqu | 102.08 | 34 | 3471.4 | 1967– |
| 56075 | Langmusi | 102.63 | 34.08 | 3362.7 | 1957–1988 |
| 56079 | Ruoergai | 102.97 | 33.58 | 3439.6 | 1957– |
| 56173 | Hongyuan | 102.55 | 32.8 | 3491.6 | 1960– |
| No. | Mean (mm) | Max (mm) | Min (mm) | CV | No. | Mean (mm) | Max (mm) | Min (mm) | CV |
|---|---|---|---|---|---|---|---|---|---|
| 1 | 321 | 505 | 197 | 0.24 | 27 | 532 | 679 | 394 | 0.14 |
| 2 | 453 | 635 | 263 | 0.19 | 28 | 494 | 657 | 307 | 0.17 |
| 3 | 347 | 527 | 197 | 0.24 | 29 | 429 | 613 | 285 | 0.19 |
| 4 | 474 | 725 | 285 | 0.22 | 30 | 622 | 767 | 460 | 0.14 |
| 5 | 348 | 505 | 219 | 0.20 | 31 | 573 | 745 | 417 | 0.15 |
| 6 | 270 | 482 | 153 | 0.37 | 32 | 521 | 788 | 372 | 0.19 |
| 7 | 498 | 810 | 329 | 0.25 | 33 | 442 | 810 | 307 | 0.24 |
| 8 | 350 | 569 | 241 | 0.22 | 34 | 727 | 920 | 569 | 0.12 |
| 9 | 287 | 548 | 153 | 0.38 | 35 | 691 | 876 | 527 | 0.13 |
| 10 | 488 | 767 | 329 | 0.23 | 36 | 625 | 832 | 438 | 0.15 |
| 11 | 339 | 504 | 220 | 0.17 | 37 | 536 | 767 | 372 | 0.18 |
| 12 | 533 | 725 | 350 | 0.16 | 38 | 413 | 613 | 286 | 0.22 |
| 13 | 515 | 835 | 372 | 0.23 | 39 | 763 | 1029 | 571 | 0.14 |
| 14 | 382 | 548 | 264 | 0.18 | 40 | 687 | 898 | 527 | 0.14 |
| 15 | 613 | 769 | 460 | 0.14 | 41 | 623 | 767 | 438 | 0.14 |
| 16 | 549 | 701 | 372 | 0.14 | 42 | 535 | 723 | 372 | 0.16 |
| 17 | 503 | 679 | 350 | 0.19 | 43 | 839 | 1076 | 526 | 0.13 |
| 18 | 455 | 679 | 286 | 0.23 | 44 | 810 | 1007 | 526 | 0.14 |
| 19 | 349 | 591 | 220 | 0.25 | 45 | 729 | 964 | 571 | 0.13 |
| 20 | 611 | 788 | 416 | 0.14 | 46 | 628 | 876 | 504 | 0.14 |
| 21 | 551 | 679 | 372 | 0.14 | 47 | 747 | 964 | 504 | 0.13 |
| 22 | 525 | 679 | 394 | 0.16 | 48 | 693 | 878 | 483 | 0.13 |
| 23 | 521 | 832 | 329 | 0.26 | 49 | 661 | 986 | 482 | 0.17 |
| 24 | 404 | 657 | 242 | 0.25 | 50 | 735 | 920 | 591 | 0.12 |
| 25 | 632 | 854 | 416 | 0.16 | 51 | 675 | 898 | 504 | 0.14 |
| 26 | 592 | 810 | 460 | 0.14 | Avg | 542 | 754 | 377 | 0.18 |
| Year | AP | AMDI | Year | AP | AMDI | ||||
|---|---|---|---|---|---|---|---|---|---|
| Grid | Count | Grid | Count | Grid | Count | Grid | Count | ||
| 1989 | 34; 45 | 2 | - | 0 | 1999 | 9 | 1 | 11; 43 | 2 |
| 1990 | - | 0 | - | 0 | 2000 | 6; 22 | 2 | 23; 33 | 2 |
| 1991 | - | 0 | - | 0 | 2001 | 5; 13; 14 | 3 | 4; 41 | 2 |
| 1992 | - | 0 | 27; 28 | 2 | 2002 | 7; 8; 10; 12; 15; 16; 17; 21; 31; 35; 36; 40; 41; 51 | 14 | 18; 19; 24 | 3 |
| 1993 | - | 0 | - | 0 | |||||
| 1994 | - | 0 | - | 0 | |||||
| 1995 | - | 0 | 1; 3; 46 | 3 | |||||
| 1996 | - | 0 | 40 | 1 | |||||
| 1997 | 19; 23; 50 | 3 | 12; 16; 21; 36; 37; 42; 44; 47; 48; 49; 50; 51 | 12 | 2003 | 1; 2; 3; 4; 28; 30; 32; 37; 38 | 9 | - | 0 |
| 2004 | 11; 29; 33 | 3 | - | 0 | |||||
| 1998 | 18; 24 | 2 | 7; 10; 14; 39; 45 | 5 | 2005 | - | 0 | - | 0 |
| SUM | 39 | 32 | |||||||
| Period | Avg AP (mm)/Rate (mm·a−1 1) | Avg AMDI/Rate (10·a−1) | ||||
|---|---|---|---|---|---|---|
| Mean | Min | Max | Mean | Min | Max | |
| 1979–1988 | 523/−5.4 | 186/−0.1 | 890/−14.6 | 1.75/−0.10 | 1.41/−0.09 | 2.27/−0.24 |
| 1988–1997 | 497/−2.0 | 166/1.8 | 844/−13.4 | 1.69/0.08 | 1.32/−0.02 | 2.27/0.14 |
| 1997–2006 | 529/9.8 | 237/12.0 | 896/15.3 | 1.77/0.08 | 1.30/−0.03 | 2.41/0.09 |
| 2006–2015 | 596/2.8 | 314/4.9 | 920/9.2 | 1.78/−0.04 | 1.34/0.02 | 2.37/0.09 |
| 1979–2015 | 540/2.7 | 229/5.0 | 895/1.4 | 1.75/0.01 | 1.35/−0.03 | 2.34/0.04 |
© 2020 by the authors. Licensee MDPI, Basel, Switzerland. This article is an open access article distributed under the terms and conditions of the Creative Commons Attribution (CC BY) license (http://creativecommons.org/licenses/by/4.0/).
Share and Cite
Gu, H.; Yu, Z.; Li, G.; Luo, J.; Ju, Q.; Huang, Y.; Fu, X. Entropy-Based Research on Precipitation Variability in the Source Region of China’s Yellow River. Water 2020, 12, 2486. https://doi.org/10.3390/w12092486
Gu H, Yu Z, Li G, Luo J, Ju Q, Huang Y, Fu X. Entropy-Based Research on Precipitation Variability in the Source Region of China’s Yellow River. Water. 2020; 12(9):2486. https://doi.org/10.3390/w12092486
Chicago/Turabian StyleGu, Henan, Zhongbo Yu, Guofang Li, Jian Luo, Qin Ju, Yan Huang, and Xiaolei Fu. 2020. "Entropy-Based Research on Precipitation Variability in the Source Region of China’s Yellow River" Water 12, no. 9: 2486. https://doi.org/10.3390/w12092486
APA StyleGu, H., Yu, Z., Li, G., Luo, J., Ju, Q., Huang, Y., & Fu, X. (2020). Entropy-Based Research on Precipitation Variability in the Source Region of China’s Yellow River. Water, 12(9), 2486. https://doi.org/10.3390/w12092486


