Article

Assessment of the Impact of Sewage Storage Ponds on the Water Environment in Surrounding Area

1
Institute of Geology, Petroleum and Mining Engineering, Stabayev University, Satbayev str. 22, Almaty 0500013, Kazakhstan
2
Department of Engineering Systems and Environment Protection, Stabayev University, Satbayev str. 22, Almaty 0500013, Kazakhstan
3
Faculty of Civil Engineering and Environmental Sciences, Bialystok University of Technology, Wiejska 45E, 15-351 Białystok, Poland
*
Author to whom correspondence should be addressed.
Water 2020, 12(9), 2483; https://doi.org/10.3390/w12092483
Submission received: 8 August 2020 / Revised: 1 September 2020 / Accepted: 3 September 2020 / Published: 5 September 2020
(This article belongs to the Special Issue Innovations in Water Research 2020)

Abstract

:
Due to geographical limitations (lack of natural receivers of treated wastewater) large sewage storage ponds are the main method of sewage disposal in the Republic of Kazakhstan. The paper presents the results of research on the environmental impact of sewage ponds serving the city of Kostanay (Kazakhstan). The scope of the research included the determination of basic quality parameters of raw and treated wastewater, the analysis of the chemical composition of groundwater in the vicinity of sewage ponds, and the analysis of the water quality of the Tobol River. The obtained results showed that efficiency of treatment facilities was unsatisfactory and water quality in the ponds did not meet requirements for surface waters for fishery. Highest contamination of groundwater was observed in sampling points close to the sewage ponds and was decreasing while the distance from the ponds was increasing. Multivariate analysis of the research data indicated that sewage from storage ponds, infiltrating into the ground, may affect quality of groundwater, which in turn supplying the Tobol River may also determine the quality of the river water.

1. Introduction

Requirements and activities related to the rational use and protection of water resources and the prevention of their pollution are among the most important tasks in the environmental protection system [1,2,3]. Properly conducted wastewater management, especially the collection and disposal of municipal wastewater, undoubtedly plays a key role in this system [4,5]. For this purpose, in addition to advanced and complex technical and technological systems, methods of natural wastewater treatment and management with the use of sewage ponds and lagoons are still widely used. Due to their simple structure, low energy consumption, and low operating costs, these methods are popular not only in developing countries, but also in developed countries, especially in small systems and in rural areas [6,7].
Systems that use large natural reservoirs for the collection and disposal of wastewater can have a negative impact on the environment. In this case, it is particularly important to protect groundwater and surface water resources against recontamination with substances present in sewage. It was found that both wastewater treatment systems with infiltration of sewage into the ground [8,9,10,11] and sewage reservoirs, in which infiltration into the ground is limited by the sealing of the bottom [12,13,14] may affect the quality of ground and surface waters in their vicinity. Another factor hazardous to the aquatic environment and related to the collection of wastewater in natural conditions are surfactants, especially anionic surfactants, which are among the most common pollutants. Anionic surfactants accumulating in water bodies have a strong toxic effect on flora and fauna and worsen the organoleptic properties of water [15]. Other hazards are related to the presence of nutrients in wastewater, which is one of the main pollutants that can lead to eutrophication [16]. For this reason, sewage ponds should be the subject of special attention during the environmental impact assessment, both at the stage of designing new ones, as well as during the reconstruction and operation of existing plants [17].
The above factors are of particular importance in the Republic of Kazakhstan, where the main method of sewage disposal after its mechanical and biological treatment is its discharge into storage ponds. In some areas, wastewater is discharged into storage ponds even without pretreatment [18]. The real threat in the Republic of Kazakhstan are sewage storage ponds located near large cities and industrial centers (there are 540 such reservoirs). These sewage ponds often operate at the limit of capacity, and their construction and equipment are outdated, which increases the risk of failure and poses a threat not only to the environment, but also the health and life of people living nearby [19,20,21].
Intensive use of sewage storage ponds in Kazakhstan’s water management system may also have a positive effect. According to the World Bank’s assessment, one of the most important challenges in the sanitation sector in the nearest future will be implementation of low cost sewage treatment that will at the same time permit selective reuse of treated effluents for agricultural and industrial purposes. Properly designed and effectively operating sewage ponds can be an important element of these activities [22,23]. Meanwhile, according to experts, Kazakhstan may soon face a shortage of good-quality water due to its wasteful use and pollution of the existing resources [24]. Satisfying the growing demand for water in conditions of its shortage can be achieved by intensifying the use of wastewater from sewage ponds for irrigation in agriculture [25]. The potential in this field is shown, for example, by the Sorbulak Lake—the largest reservoir in Kazakhstan, collecting treated wastewater from Almaty city. The reservoir has a maximum capacity of approximately 109 m3. The quality of water collected in the reservoir meets all the requirements for maximum allowable concentrations (MAC) for irrigation of industrial crops, however, these waters have not been used for economic purposes so far [26].
The aim of this paper is to assess the ecological conditions as well as the nature and degree of impact of the sewage storage ponds from the city of Kostanay in Kazakhstan on the water environment in their vicinity.

2. Materials and Methods

The city of Kostanay is located in the steppe zone in the north of the Turgay Plateau, in the southwestern part of the West Siberian Plain, on the Tobol River (53°15′ N 63°35′ E). As of 1 January 2019, the population was 243,031 people. The climate is sharply continental, with hot, dry summers and cold snowy winters. Average temperature in July: +20.9 °C and in January: −14.5 °C; rapid changes in temperature during the day are characteristic. Average annual rainfall is 300–350 mm, maximum rainfall occurs in summer. The average annual humidity is 71%.
In the city of Kostanay there is a separate sewer system. Wastewater from residential districts and industrial plants is collected and transported through gravity sewers to seven local sewage pumping stations, and then directed to the main pumping station, which delivers all wastewater from the city to the treatment facilities located about 14 km north of the city. There, the wastewater goes initially to the mechanical treatment section, which consists of three pairs of earth (clay) horizontal settling tanks. The settling tanks work alternately—each year, in summer, one of the settling tanks is turned off, the sludge collected in it is dried and removed in order to complement and strengthen the outer side of the dams of the storage ponds. After the sedimentation process, the wastewater flows through a gravity collector, approximately 1 km long, to the system of sewage storage ponds. In the sewage ponds, additional treatment is carried out in natural conditions—in spring and summer as a result of the sunlight, photosynthesis, biochemical oxidation, evaporation, etc., and in winter—as a result of freezing. The water from the ponds is not reused. The annual amount of wastewater delivered to the system in 2018 was 15,187,000 m3, which gives an average of 41,600 m3 per day. The scheme of the wastewater treatment plant for the city of Kostanay is shown in Figure 1
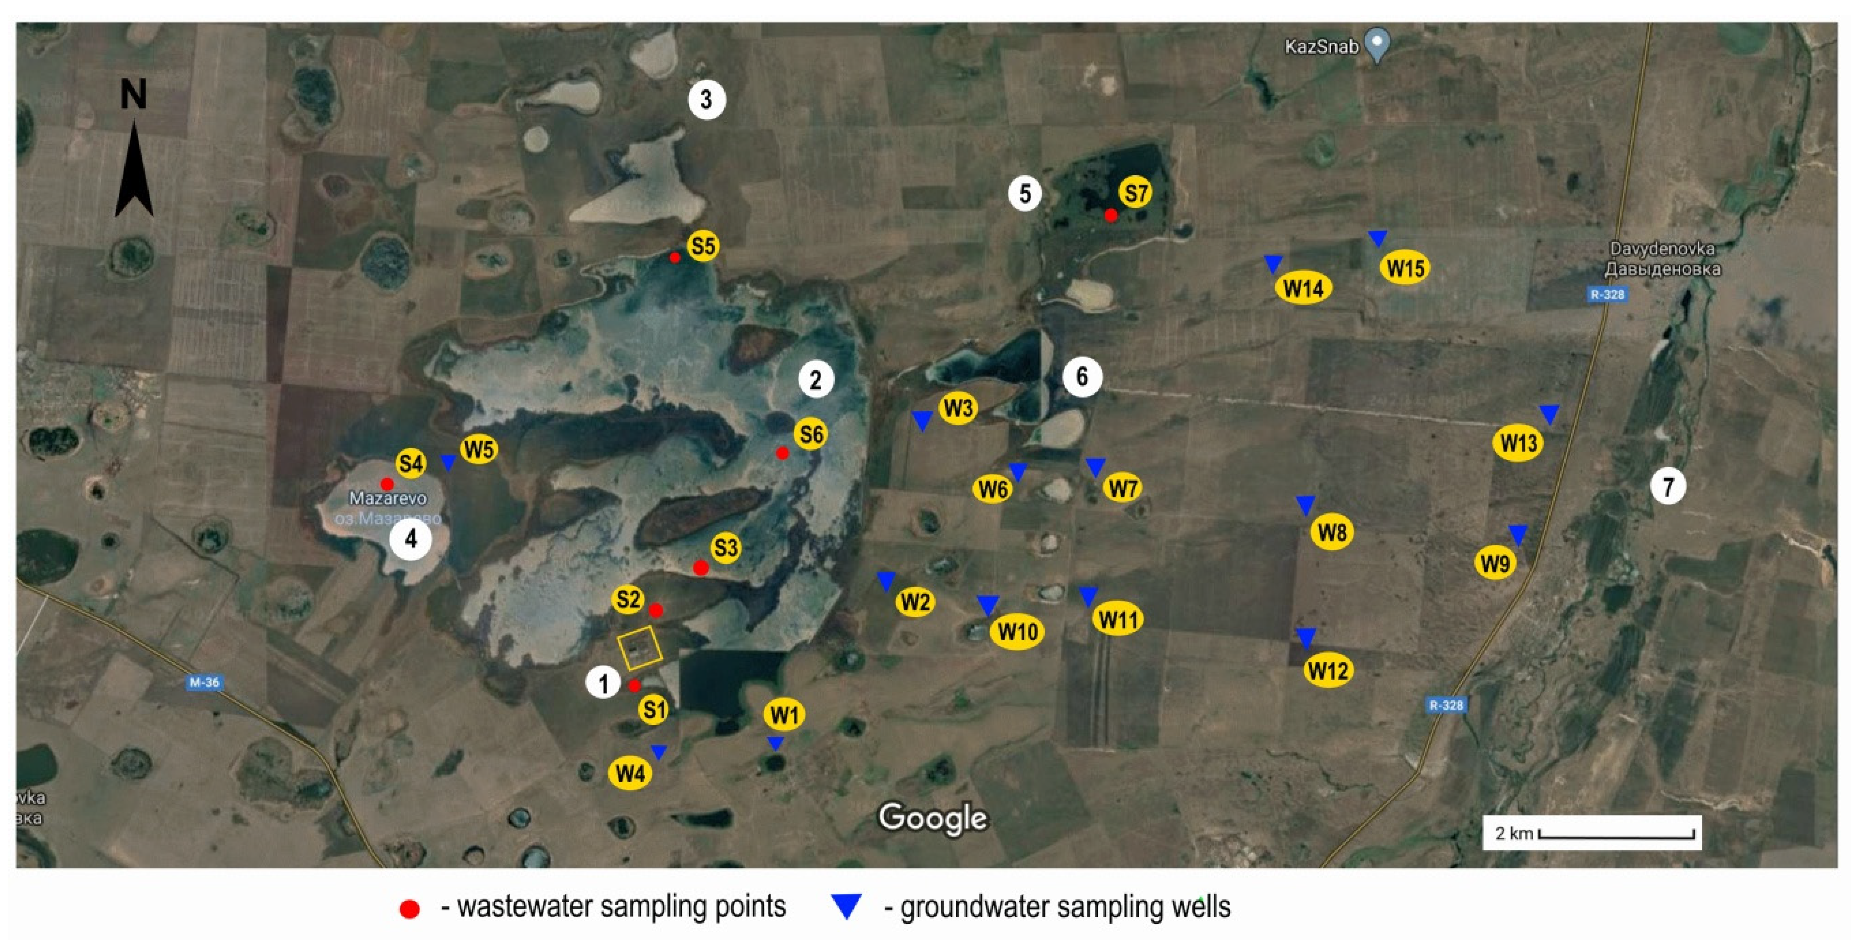
The main sewage pond, which consists of Lakes Rybnoye and Mazarevo, was built in 1966 and has a total volume of 94.1 km3. In 1989, the system was expanded. In order to provide additional capacity for wastewater storage, a set of ponds adjacent to the main reservoir from the north (Kurgan Reservoir with a total volume of 11.73 km3) and eastern side (Lakes Popova, Kolesnikov and Tomarkol with a total volume of 14.8 km3) was designed. The reservoirs are filled in cascades, from the highest level of 183.80 m above sea level (m a.s.l.) in Lake Rybnoye to the lowest level of 175.00 m a.s.l. in Lake Popov. The basic spatial distribution of the wastewater treatment system in Kostanay is shown on the map in Figure 2 and technical characteristics of sewage ponds is presented in Table 1.
Research work was conducted in 2018–2019 and included: Determination of raw and treated wastewater quality at various points in the treatment system; determining the location and quality of groundwater aquifer in the vicinity of sewage ponds; and determination of the water quality in the Tobol River, in the profile located downstream the sewage ponds.
Wastewater samples were collected in accordance with ST RK GOST R 51592-2003 [27] from the following locations: S1—distribution chamber before settling tanks, S2—collector after settling tanks, S3—influent to Rybnoye Lake, S4—Rybnoe Lake, S5—overflow from Rybnoe Lake to Kurgan Lake, S6—Mazarevo Lake, and S7—Popovo Lake (Figure 2).
Groundwater samples were collected in accordance with GOST 31942-2012 [28], from existing monitoring wells (W1–W5) and additional 10 test wells (W6–W15) located in the vicinity of sewage ponds (Figure 2). Depth of test wells was 20–30 m. Sampling was carried out using continuous pumping of water from the wells with capacity of 0.1–0.3 dm3/s. The submersible pump worked until a constant value of the temperature of the discharged water was established and until at least five well volumes of water were purged. All wastewater and groundwater samples were collected in sterile containers and transported to laboratories in Kostanay or Almaty. Analysis of water samples in the Kostanay laboratories was performed on the same working day as the sampling was carried out. Some samples were transported to the city of Almaty, hence the laboratory analysis was performed the next working day after sampling.
Due to complexity of data set containing large number of variables collected at several sampling points, statistical analysis of data was based on multivariate analysis (MVA) techniques, including cluster analysis (CA) and principal component analysis (PCA). Analyses were performed using R software environment [29]. The idea of CA is to use the values of the variables to devise a scheme for grouping the objects into classes so that similar objects are in the same class [30]. The grouping algorithm used in this study was based on n-dimensional Euclidean distances (n determines number of variables measured in sampling points) determined for all sampling points (S1–S7, W1–W15 and Tobol River), and thus creating 23 × 23 distance matrix. PCA is a MVA technique that allows the reduction of a large set of correlated variables to a smaller set of uncorrelated variables that are called principal components (PC). Such reduced set of variables is usually easier to analyze and interpret. Nine variables (parameters measured in all sampling points: TSS, BOD5, COD, N-NH4, N-NO3, Fe, Mn, SO4, Cl) were used in statistical analyses.

3. Results and Discussions

3.1. Treatment Facilities and Sewage Storage Ponds

Wastewater samples collected from treatment facilities (S1–S3) and sewage ponds (S4–S7) allowed to determine changes in the qualitative characteristics of wastewater at various stages of treatment. The average values of the wastewater quality parameters are summarized in Table 2.
Analysis of the results presented in Table 2 indicates that the efficiency of wastewater treatment in sewage ponds increases with the duration of sewage retention—the lowest concentrations of pollutants occurred at the sampling points furthest from the wastewater influent (points S6 and S7). However, it should be clearly stated that the effect of wastewater treatment in both settling tanks and sewage ponds is insufficient. As presented in Table 3, overall efficiency of BOD removal is satisfactory (>90%) only in additional sewage ponds (Mazarevo Lake—S6, Popowo Lake—S7), while in the main storage—Rybnoye Lake (S4) it is only 85.6%. Efficiency of TSS removal was lower than 90% in all sampling points and for settling tanks (S2) it was only 72.6%.
It is also important to compare the results obtained with the environmental protection regulations in force in Kazakhstan. Taking into account the officially established as required for sewage discharged into Kostanay sewage ponds (sampling point S3) MAC1 values of the basic wastewater quality indicators (BOD, COD, TSS, N-NH4, N-NO3, phosphates) only TSS removal meets the requirements. Comparing the quality of water in sewage ponds with the requirements for waters for the needs of fisheries (MAC2), it can be concluded that most of the measured parameters do not meet the official requirements.

3.2. Groundwater Analyses

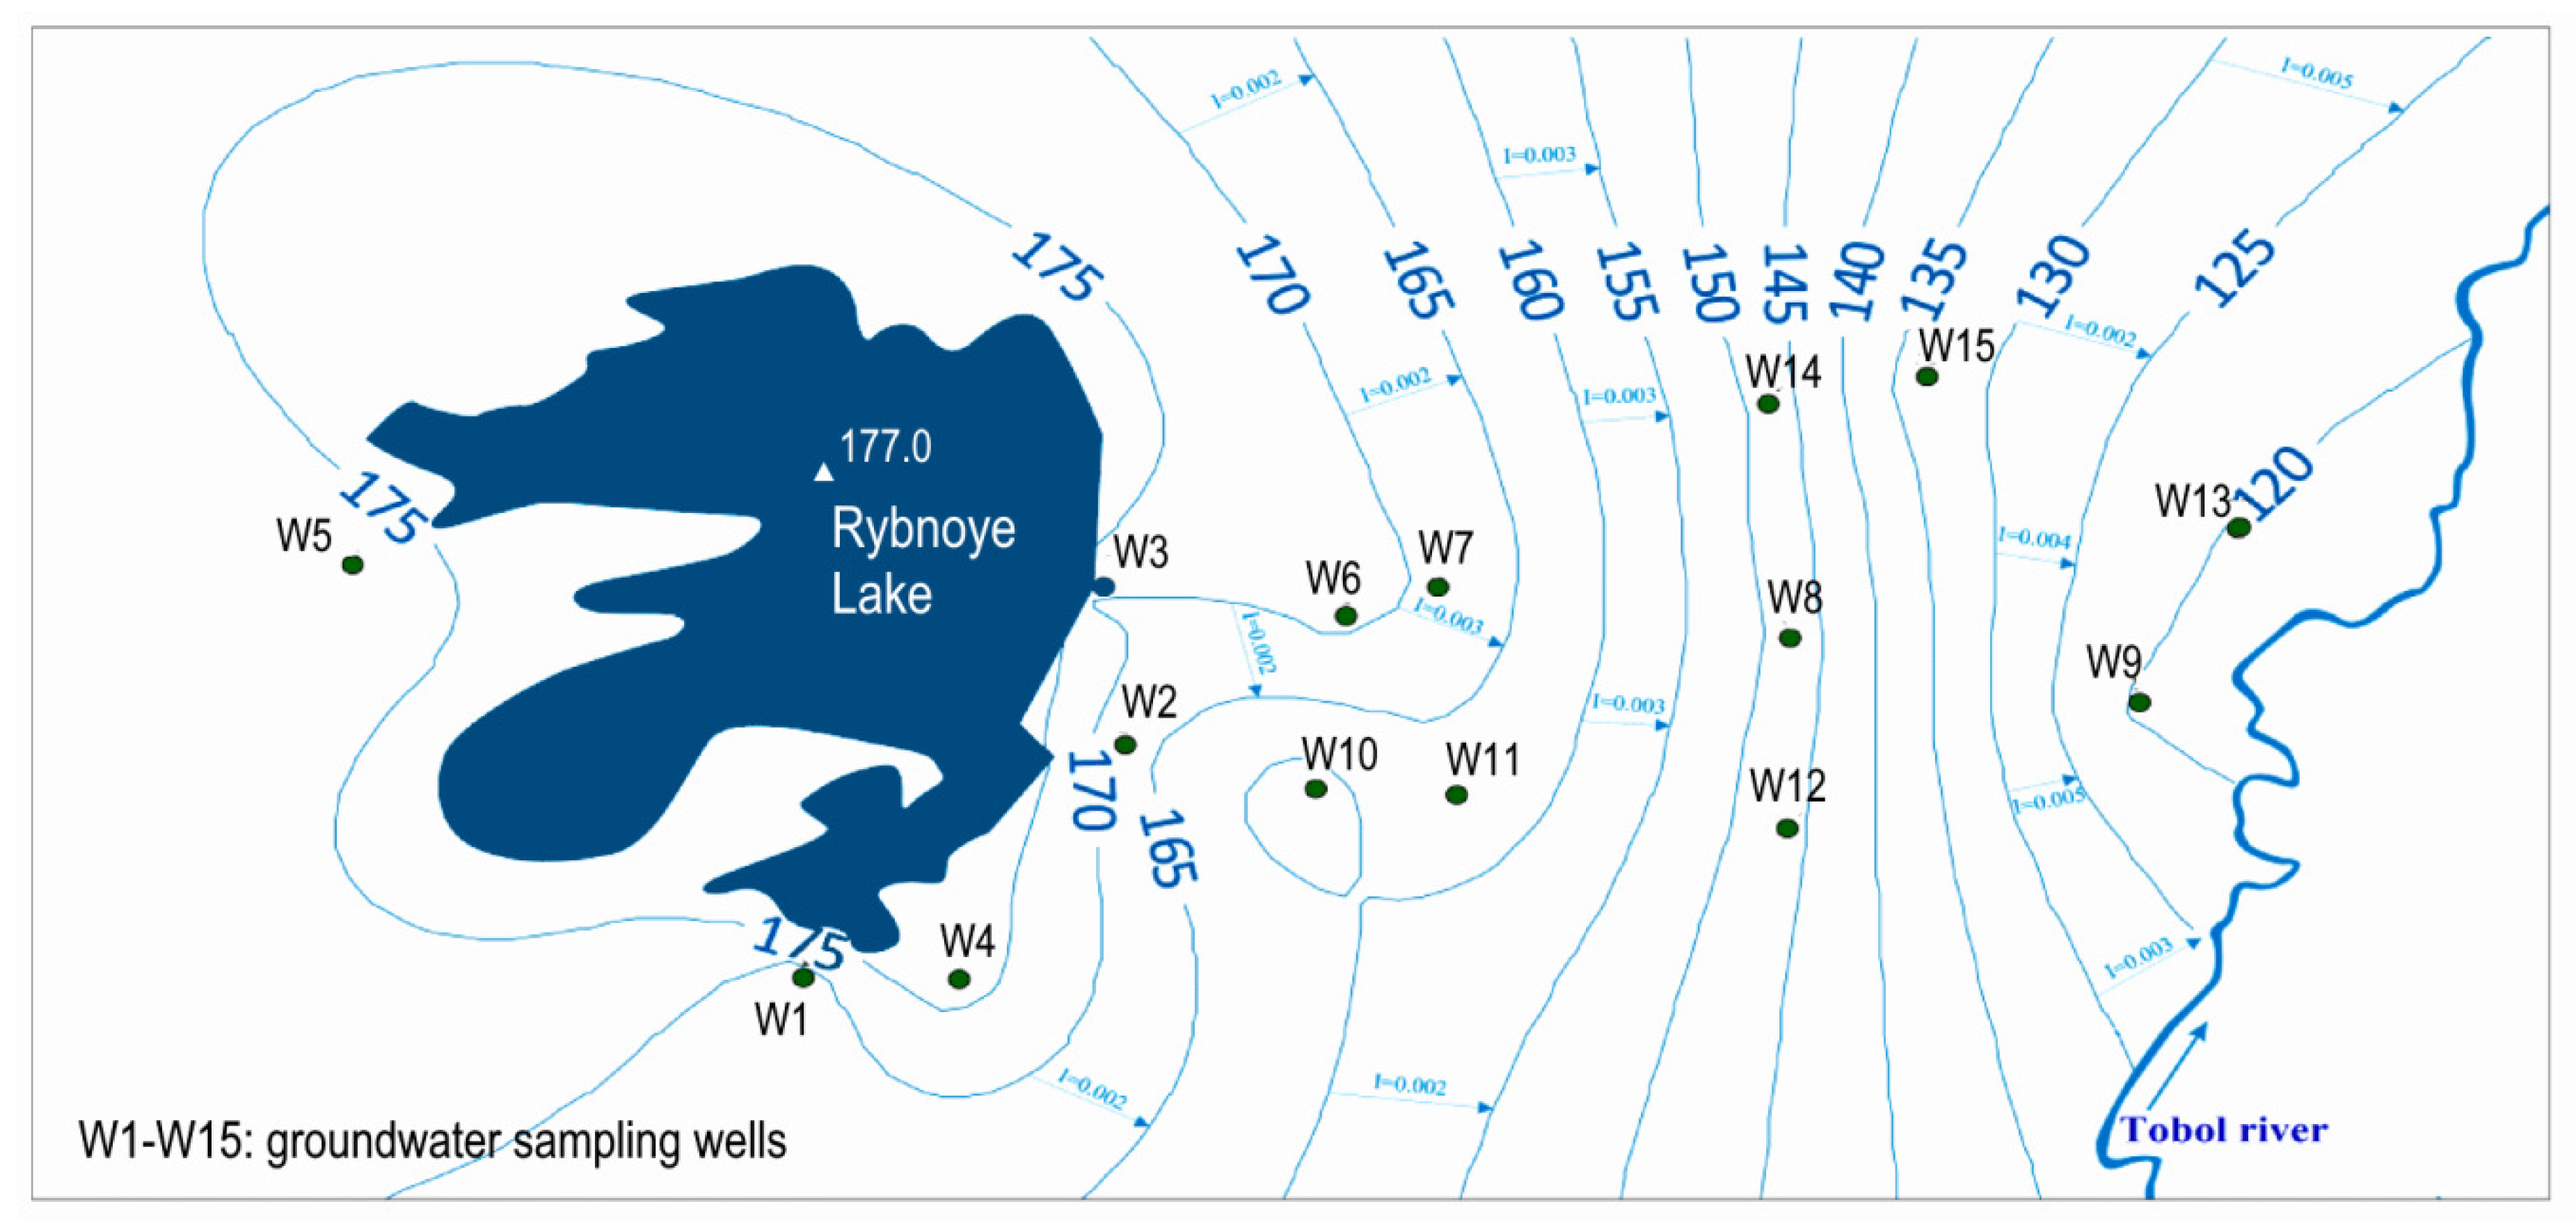
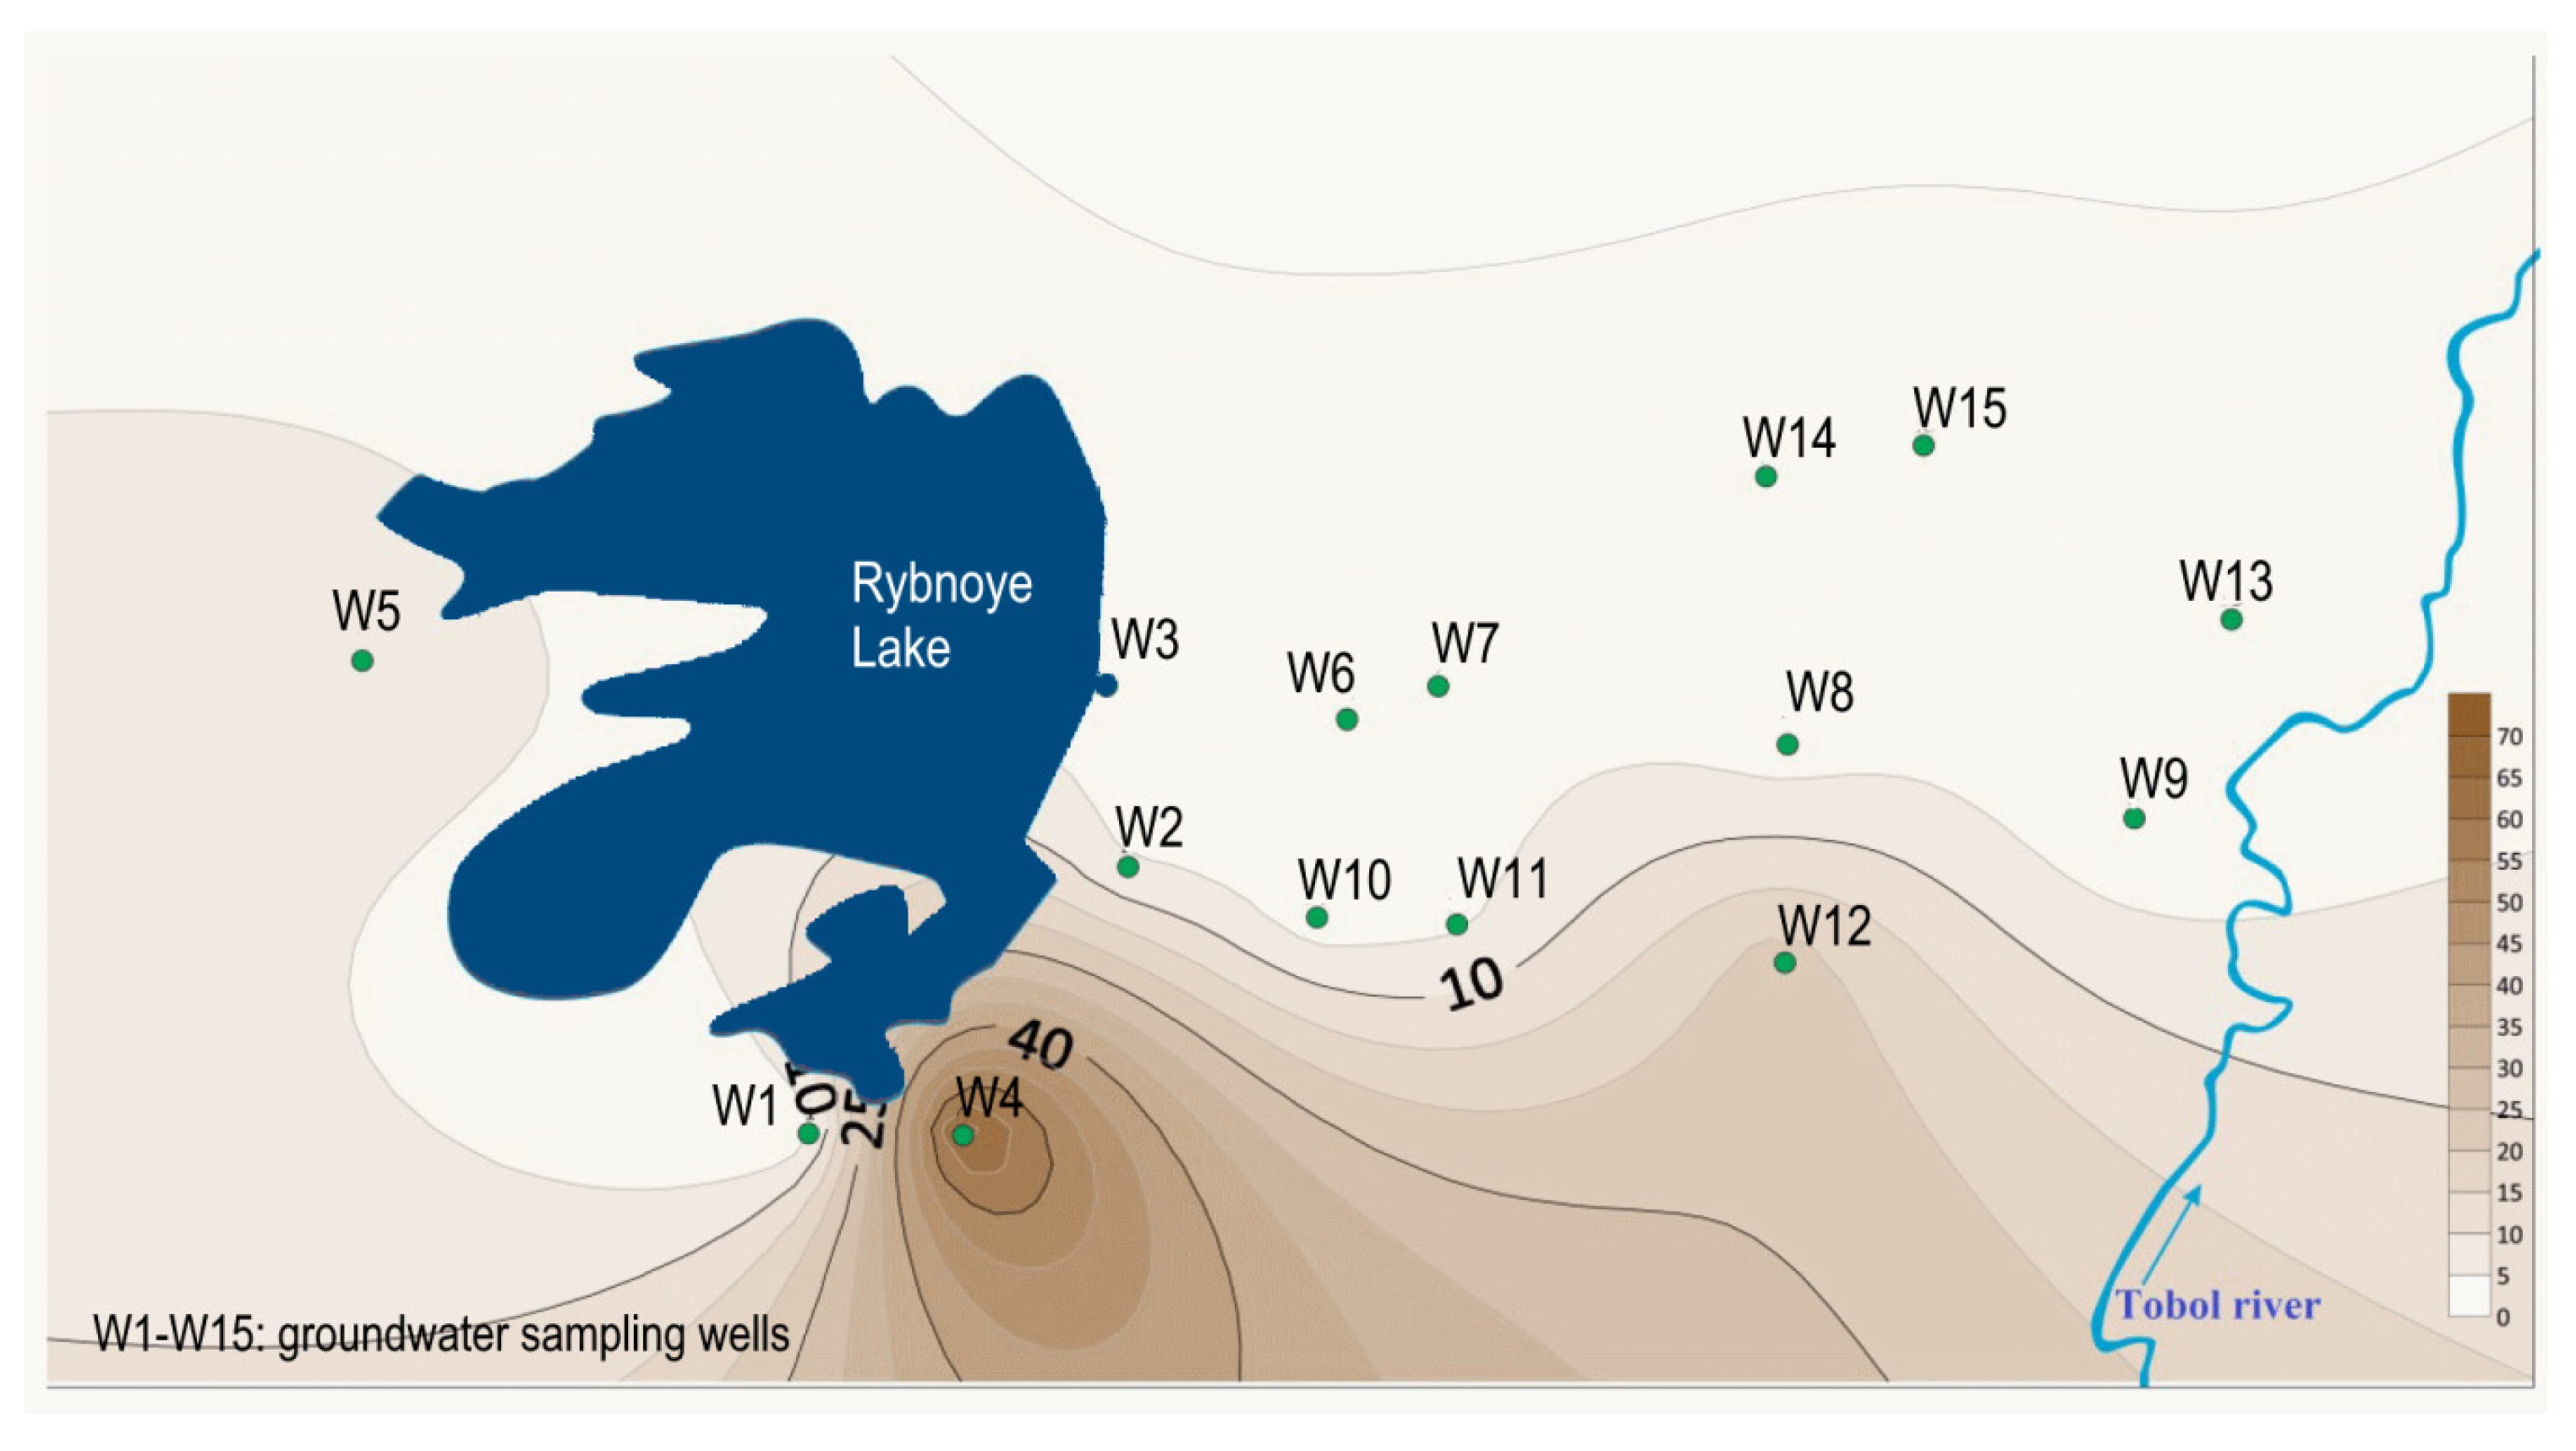
The next stage of our study was determination of hydrological characteristics of groundwater aquifer in the area surrounding the sewage ponds and quality of groundwater sampled from the wells in the study area and water from the Tobol River. The data obtained from the test wells showed that the groundwater in the studied area forms an unconfined aquifer with static water level located 4.42–17.13 m below terrain. Considering terrain elevation at sampling points, estimated groundwater level in the studied area is located at a height of 175 m a.s.l. around sewage ponds down to 120 m a.s.l. near the Tobol River. The groundwater table decreases uniformly towards the Tobol River with a hydraulic grade from 0.002 to 0.005. Seasonal water level fluctuations amount to approx. 1.0 m. The map of groundwater levels prepared using the SURFER software is presented in Figure 3.
Depression height measured while pumping water from the test wells ranged from 3.97 to 13.84 m, which allowed to determine the hydraulic conductivity of soil on the tested terrain as 0.011 to 0.38 m/d. These results are consistent with the analysis of the geological profile of the test boreholes which are dominated by clay soils. Such properties may indicate that precipitation and infiltration from surface water reservoirs have a significant share in the aquifer supply.
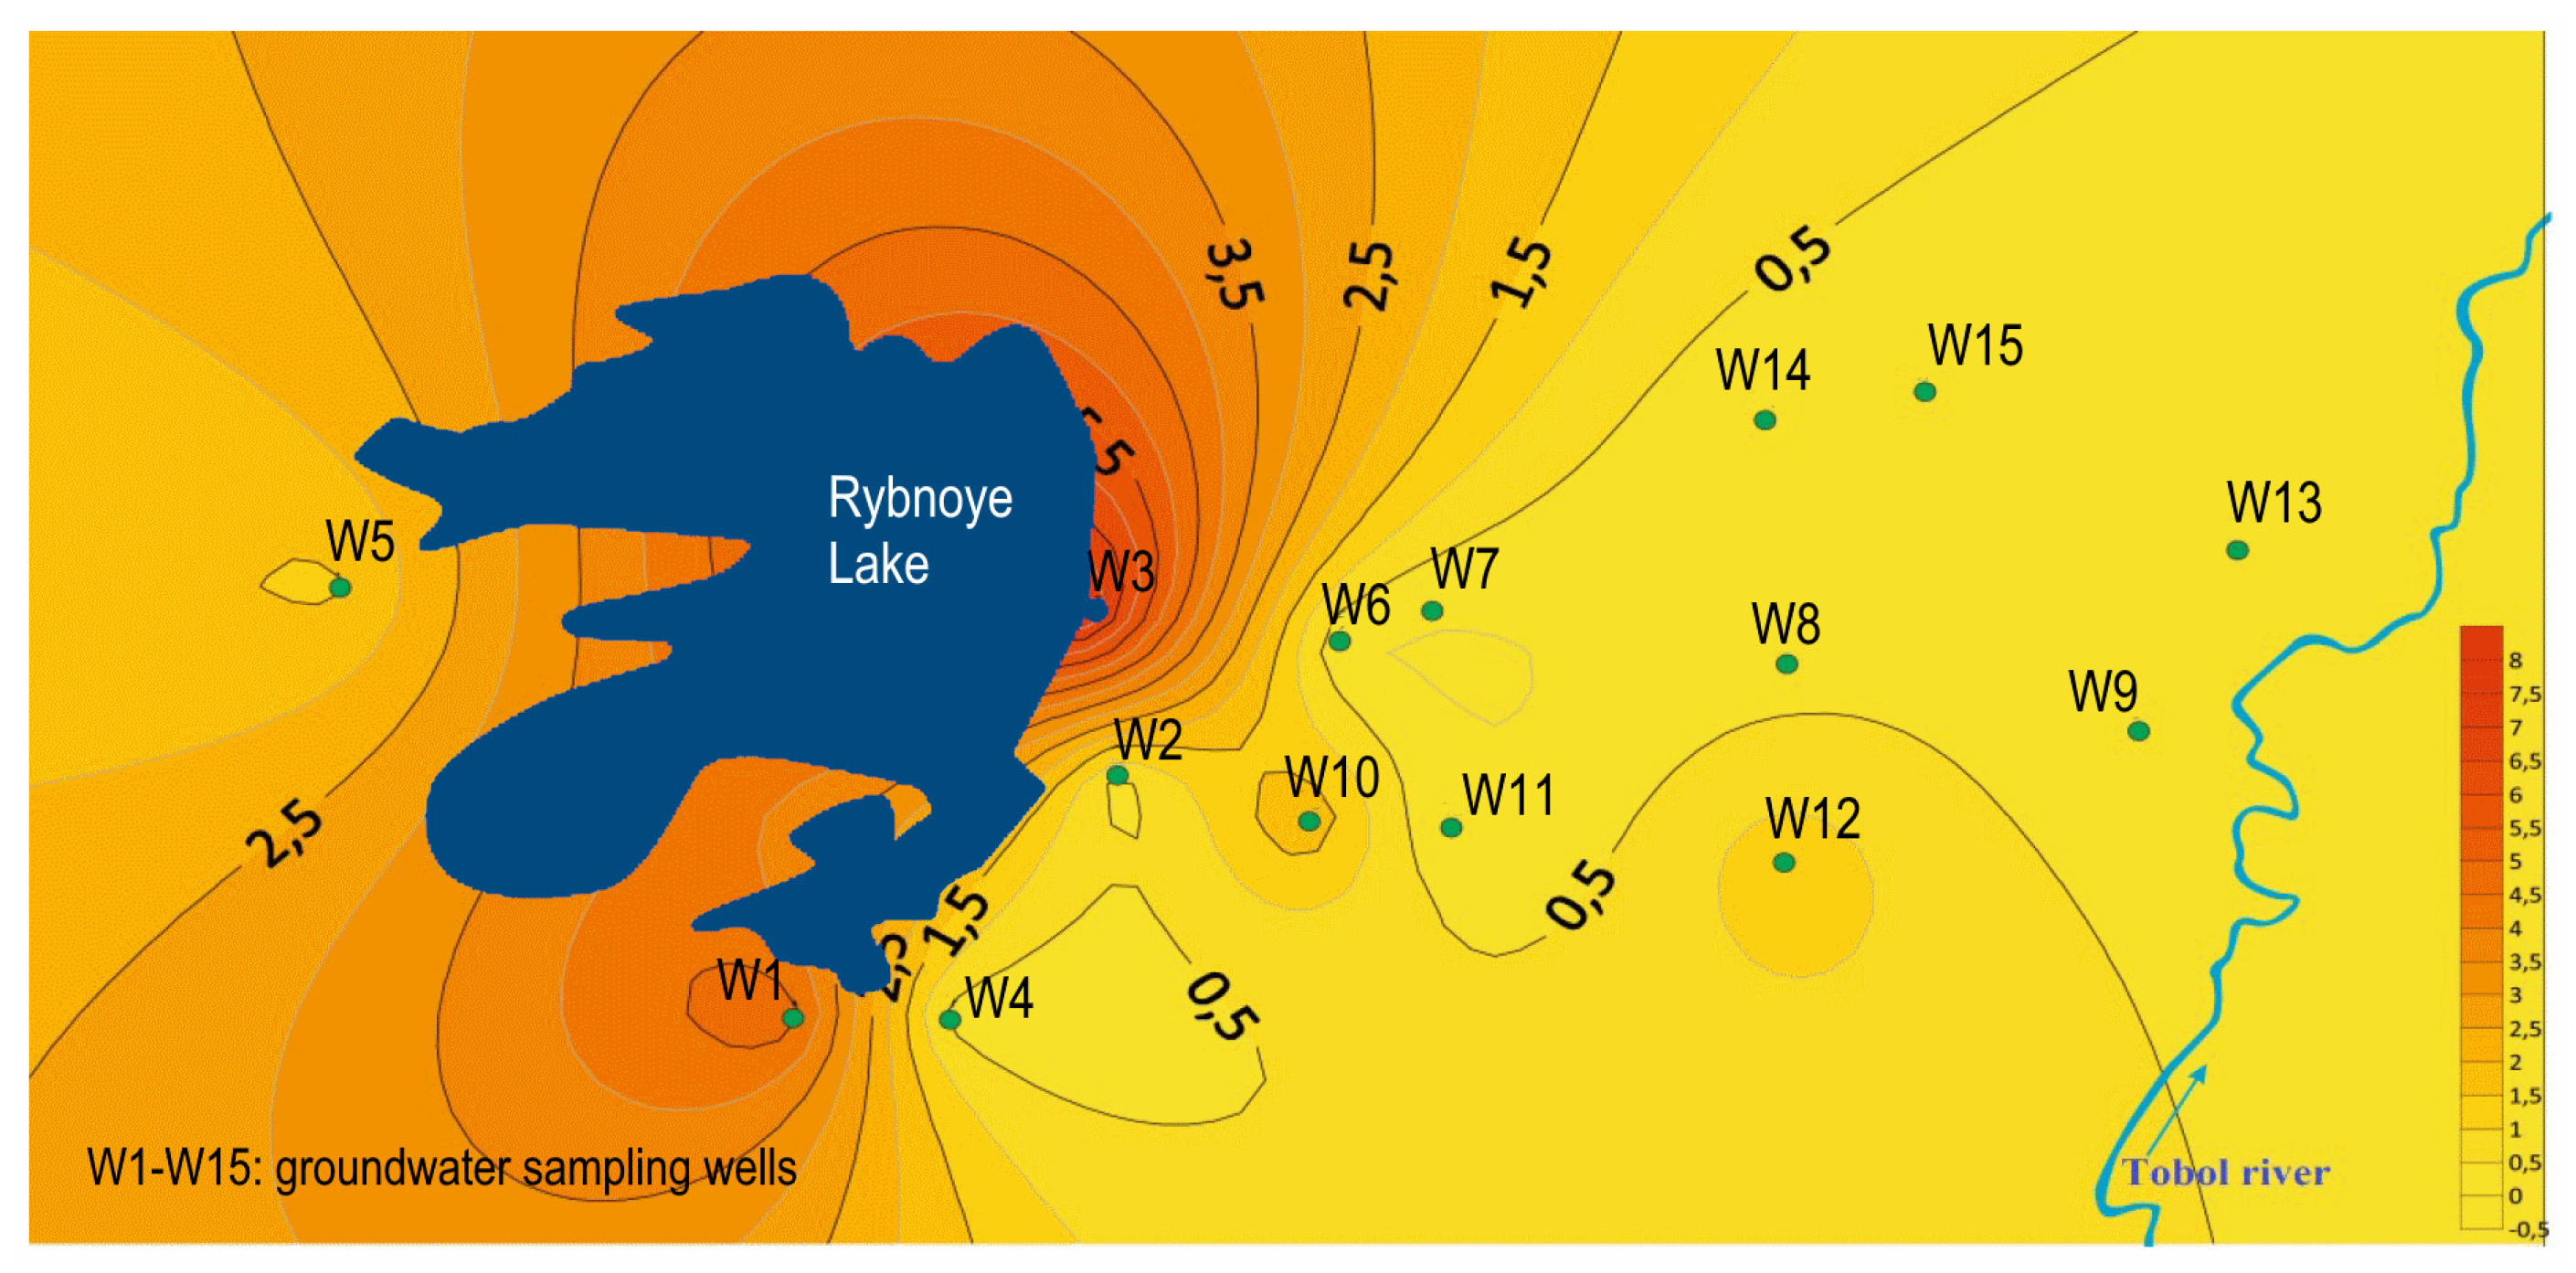
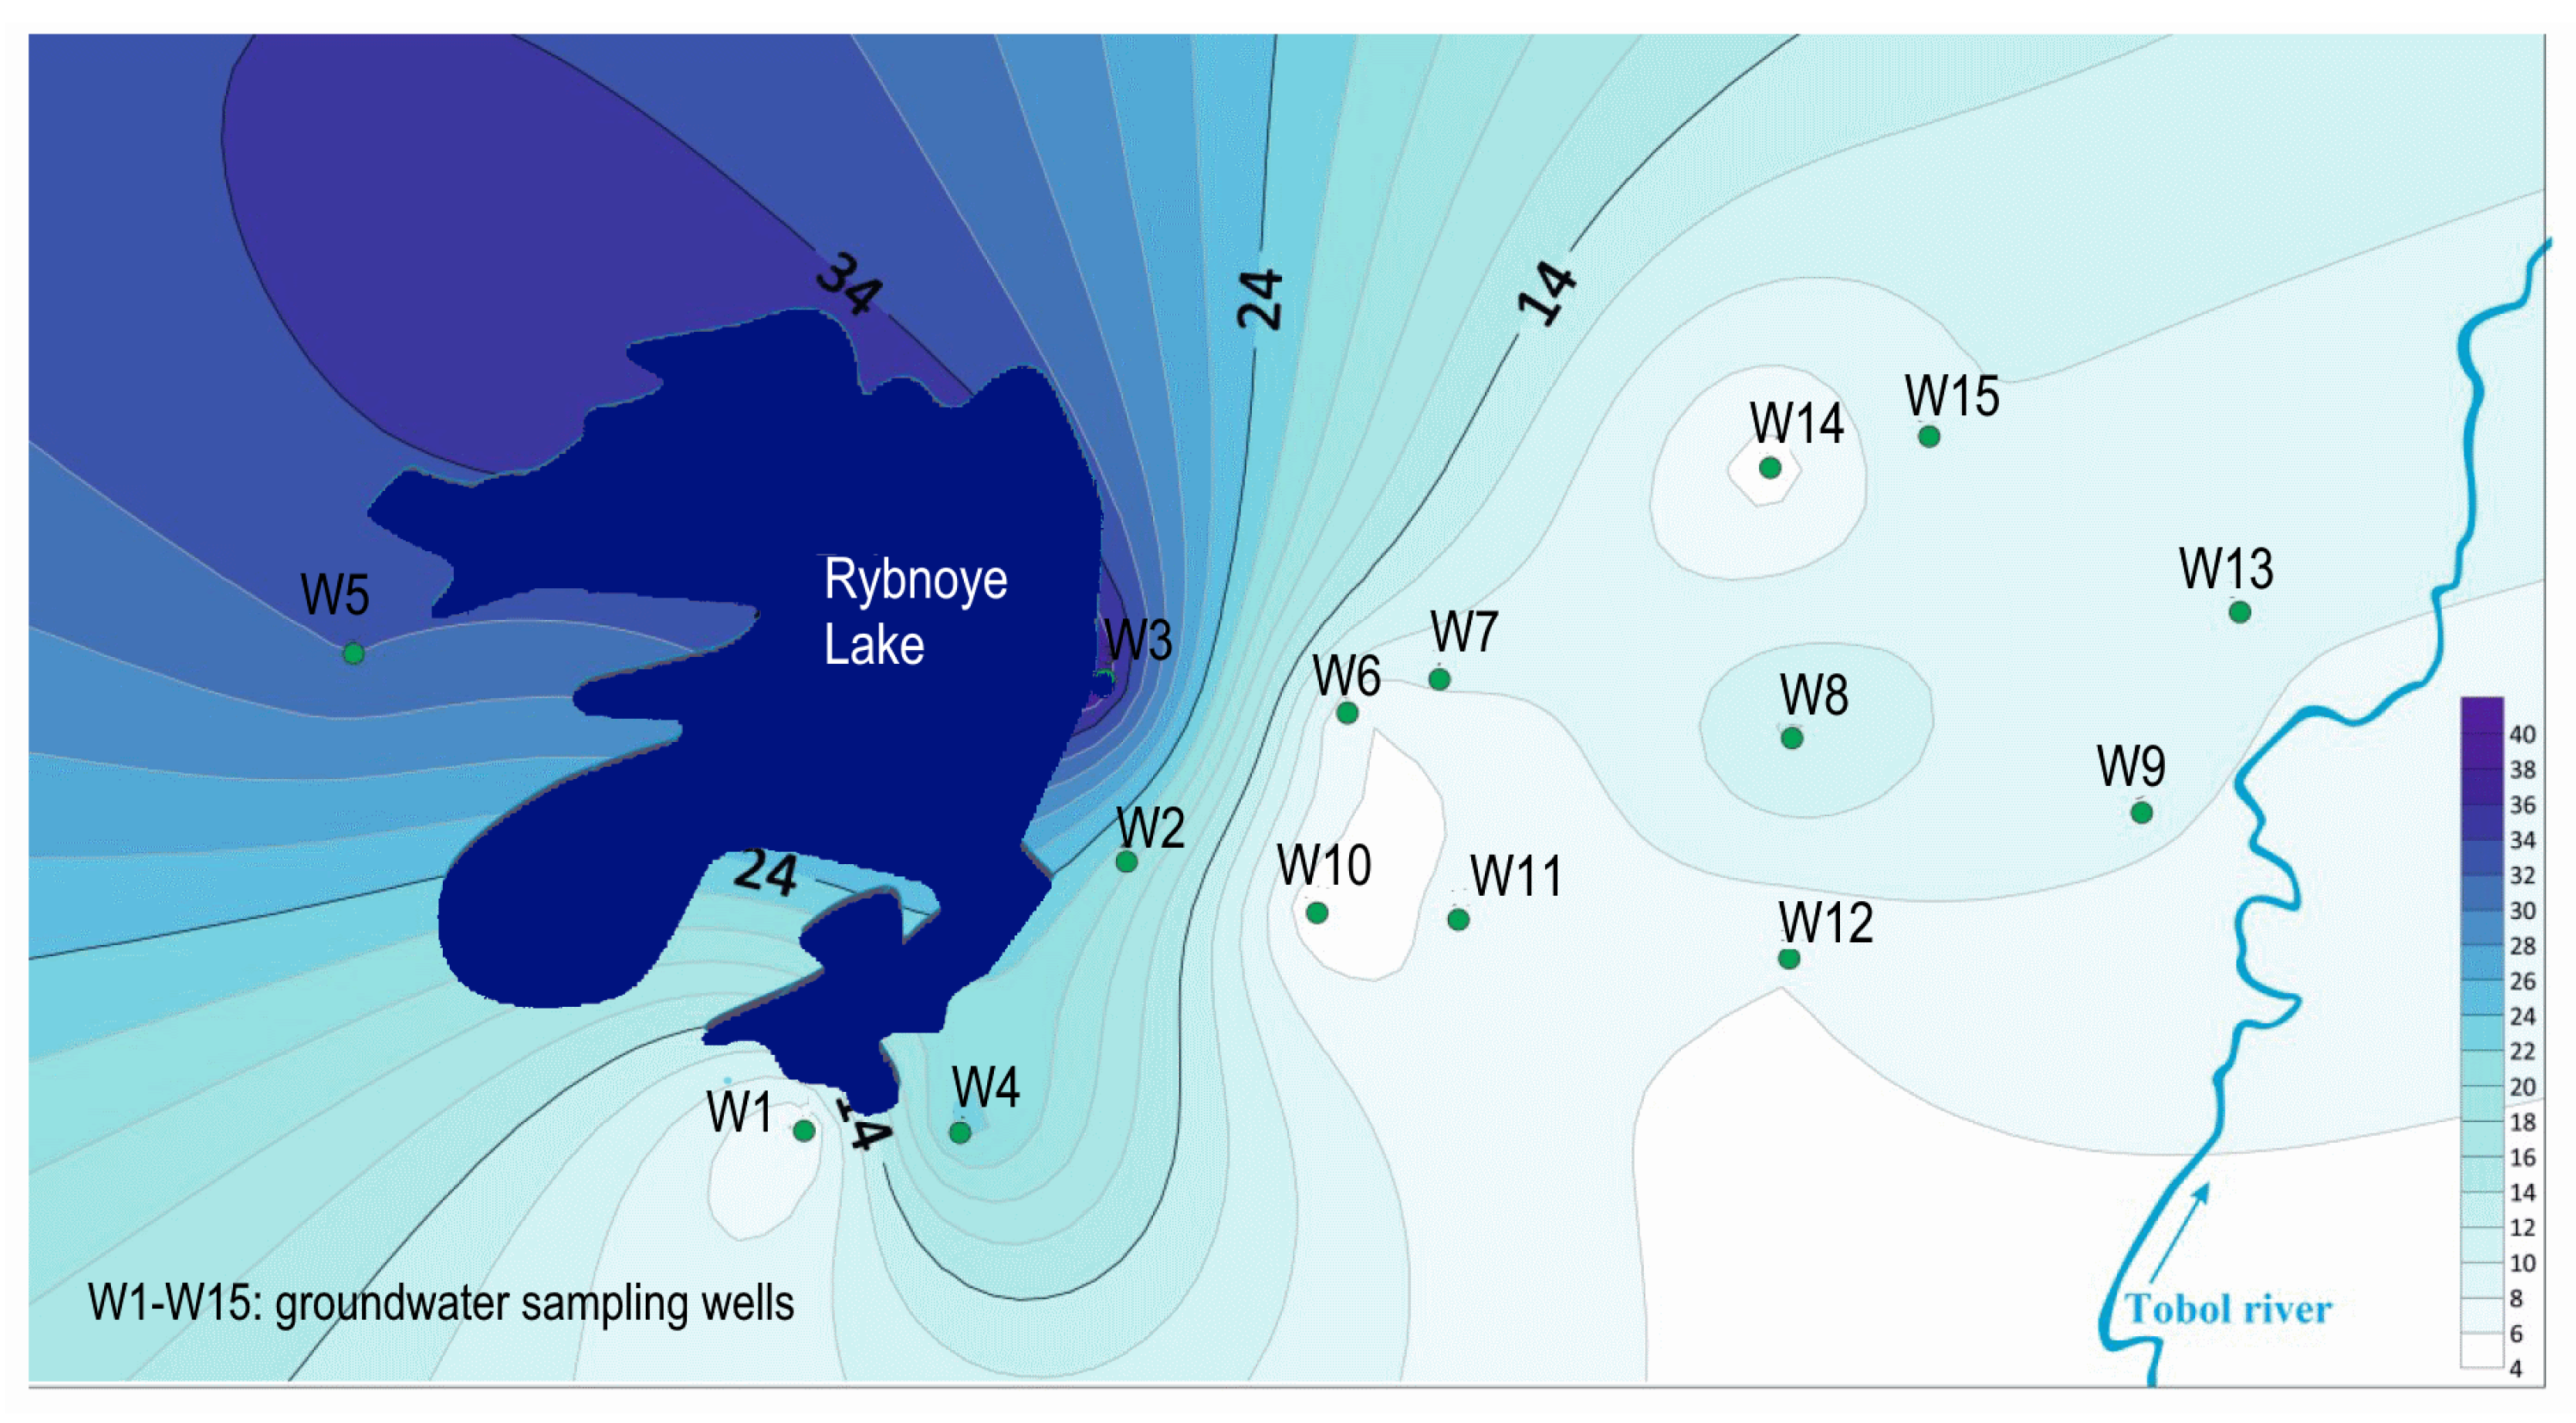
The qualitative characteristics of groundwater in the studied area are presented in Table 4 and the graphical representation of the obtained results for selected groundwater parameters is shown in the Figure 4, Figure 5 and Figure 6.
The data in Table 2 and Table 4 and their graphical representation in Figure 4, Figure 5 and Figure 6 show that there is some link between water quality in sewage ponds and groundwater. In the case of indicators such as BOD5 or N-NH3 it is clear that the concentration of these substances in groundwater decreases with increasing distance from the ponds. Also, concentrations of chlorides were in many cases higher in wells near those sewage ponds where the salinity of water increases due to long retention time (Mazarevo and Popovo lakes and W5, W7 wells respectively). It can be also noticed that there are abrupt changes in the values of some quality parameters of groundwater, regardless the well location. For example, in the wells W7, W10, W14, and W15 there are much higher concentrations of sulphates than in the surrounding wells, while in the W8 well the chloride concentration is more than twice the values observed in other wells. Such a local increase in groundwater pollution may be related to agricultural activity carried out in this area (decomposition and oxidation of organic matter, extensive use of fertilizers etc.).
There are also some connections between the water quality in the Tobol River and the quality of groundwater in the aquifer that feeds the river valley. It can be assumed that the increased content of e.g., sulfates, iron or manganese in the river is caused by the quality of the inflowing groundwater. Moreover, in the Tobol river, exceedances of maximum admissible concentrations (MAC) were found for most of the parameters tested (BOD5, TSS, SO4, N-NH4, and Mn), however, it cannot be associated only with the quality of groundwater in the river valley.

3.3. Multivariate Analysis of Data

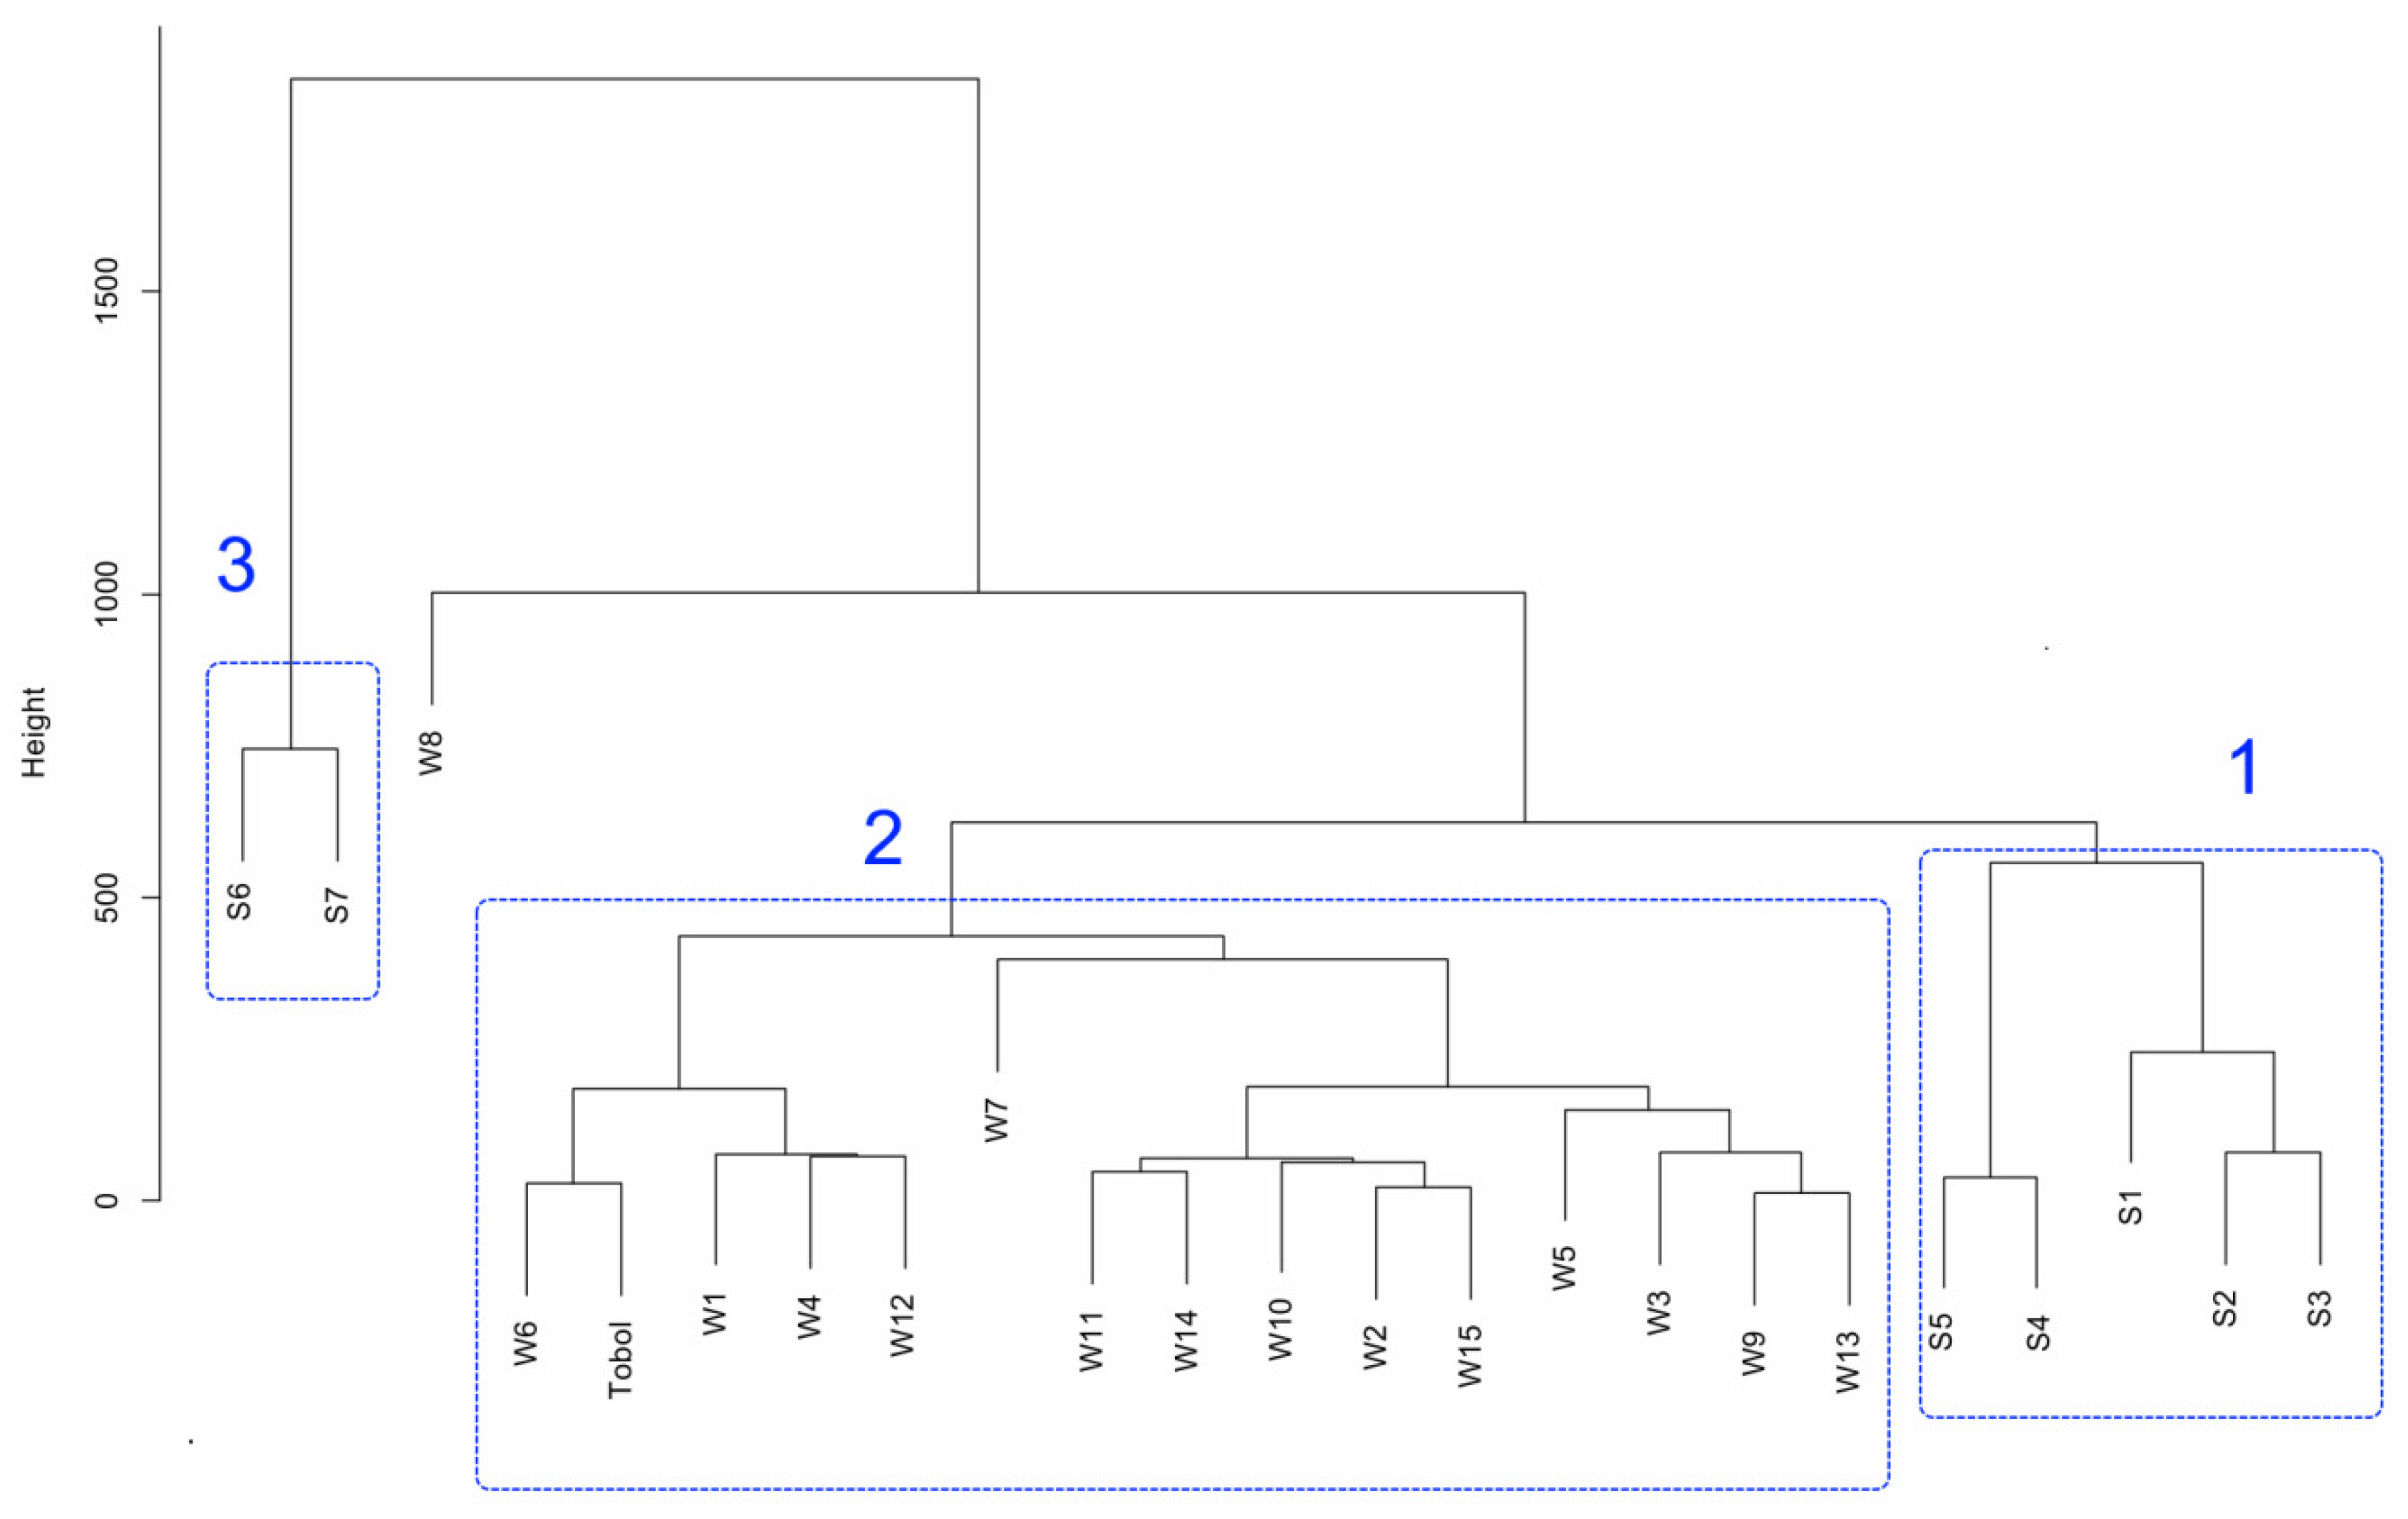
To find more common properties of the data presented in Table 2 and Table 4, multivariate analysis (MVA) was performed using statistical package R. First, cluster analysis (CA) was chosen to find groups of sampling points with similar physico-chemical properties. Based on 23 × 23 distance matrix determined on 9-dimensional variables space (23 sampling points and 9 variables) three main groups of sampling points (clusters) were extracted, as presented in Figure 7.
Cluster 1 contains sampling points related with wastewater and main sewage pond which allows us to believe that the quality of water in Rybnoye Lake (S4, S5) is significantly related to the quality of both raw (S1) and treated wastewater (S2, S3) that are discharged there. On the other hand, cluster 3 contains sampling points from Mazarevo (S6) and Popovo (S7) lakes which are characterized by much longer retention time than Rybnoye Lake. This may mean that the physico-chemical characteristics of these lakes is more related to the water age and evaporation processes than the inflow of sewage from the treatment plant. The largest cluster (No. 3) is formed by groundwater sampling points and the Tobol River (except for the W8 forming an independent cluster), which may indicate that the quality of the Tobol River water is physico-chemically related to the quality of groundwater aquifer supplying the river valley. In this cluster, three subgroups of wells can be distinguished; however, it is difficult to indicate between them such unambiguous connections as in the case of clusters 1 and 2. However, it should be noticed that the quality of the groundwater is not the main determinant of the water quality in the Tobol River, because the wells located in the immediate vicinity of the river (W9, W13) are in a different subgroup than the river.
PCA distinguished nine primary components presented in the Table 5, of which PC1, PC2, and PC3 were used for further analysis, as they cumulate over 78% of the variance present in the data.
The correlation matrix presented in Table 6 shows that PCA is justified because the analyzed variables are correlated with each other, which may suggest that some of them measure the same underlying property of water/wastewater.
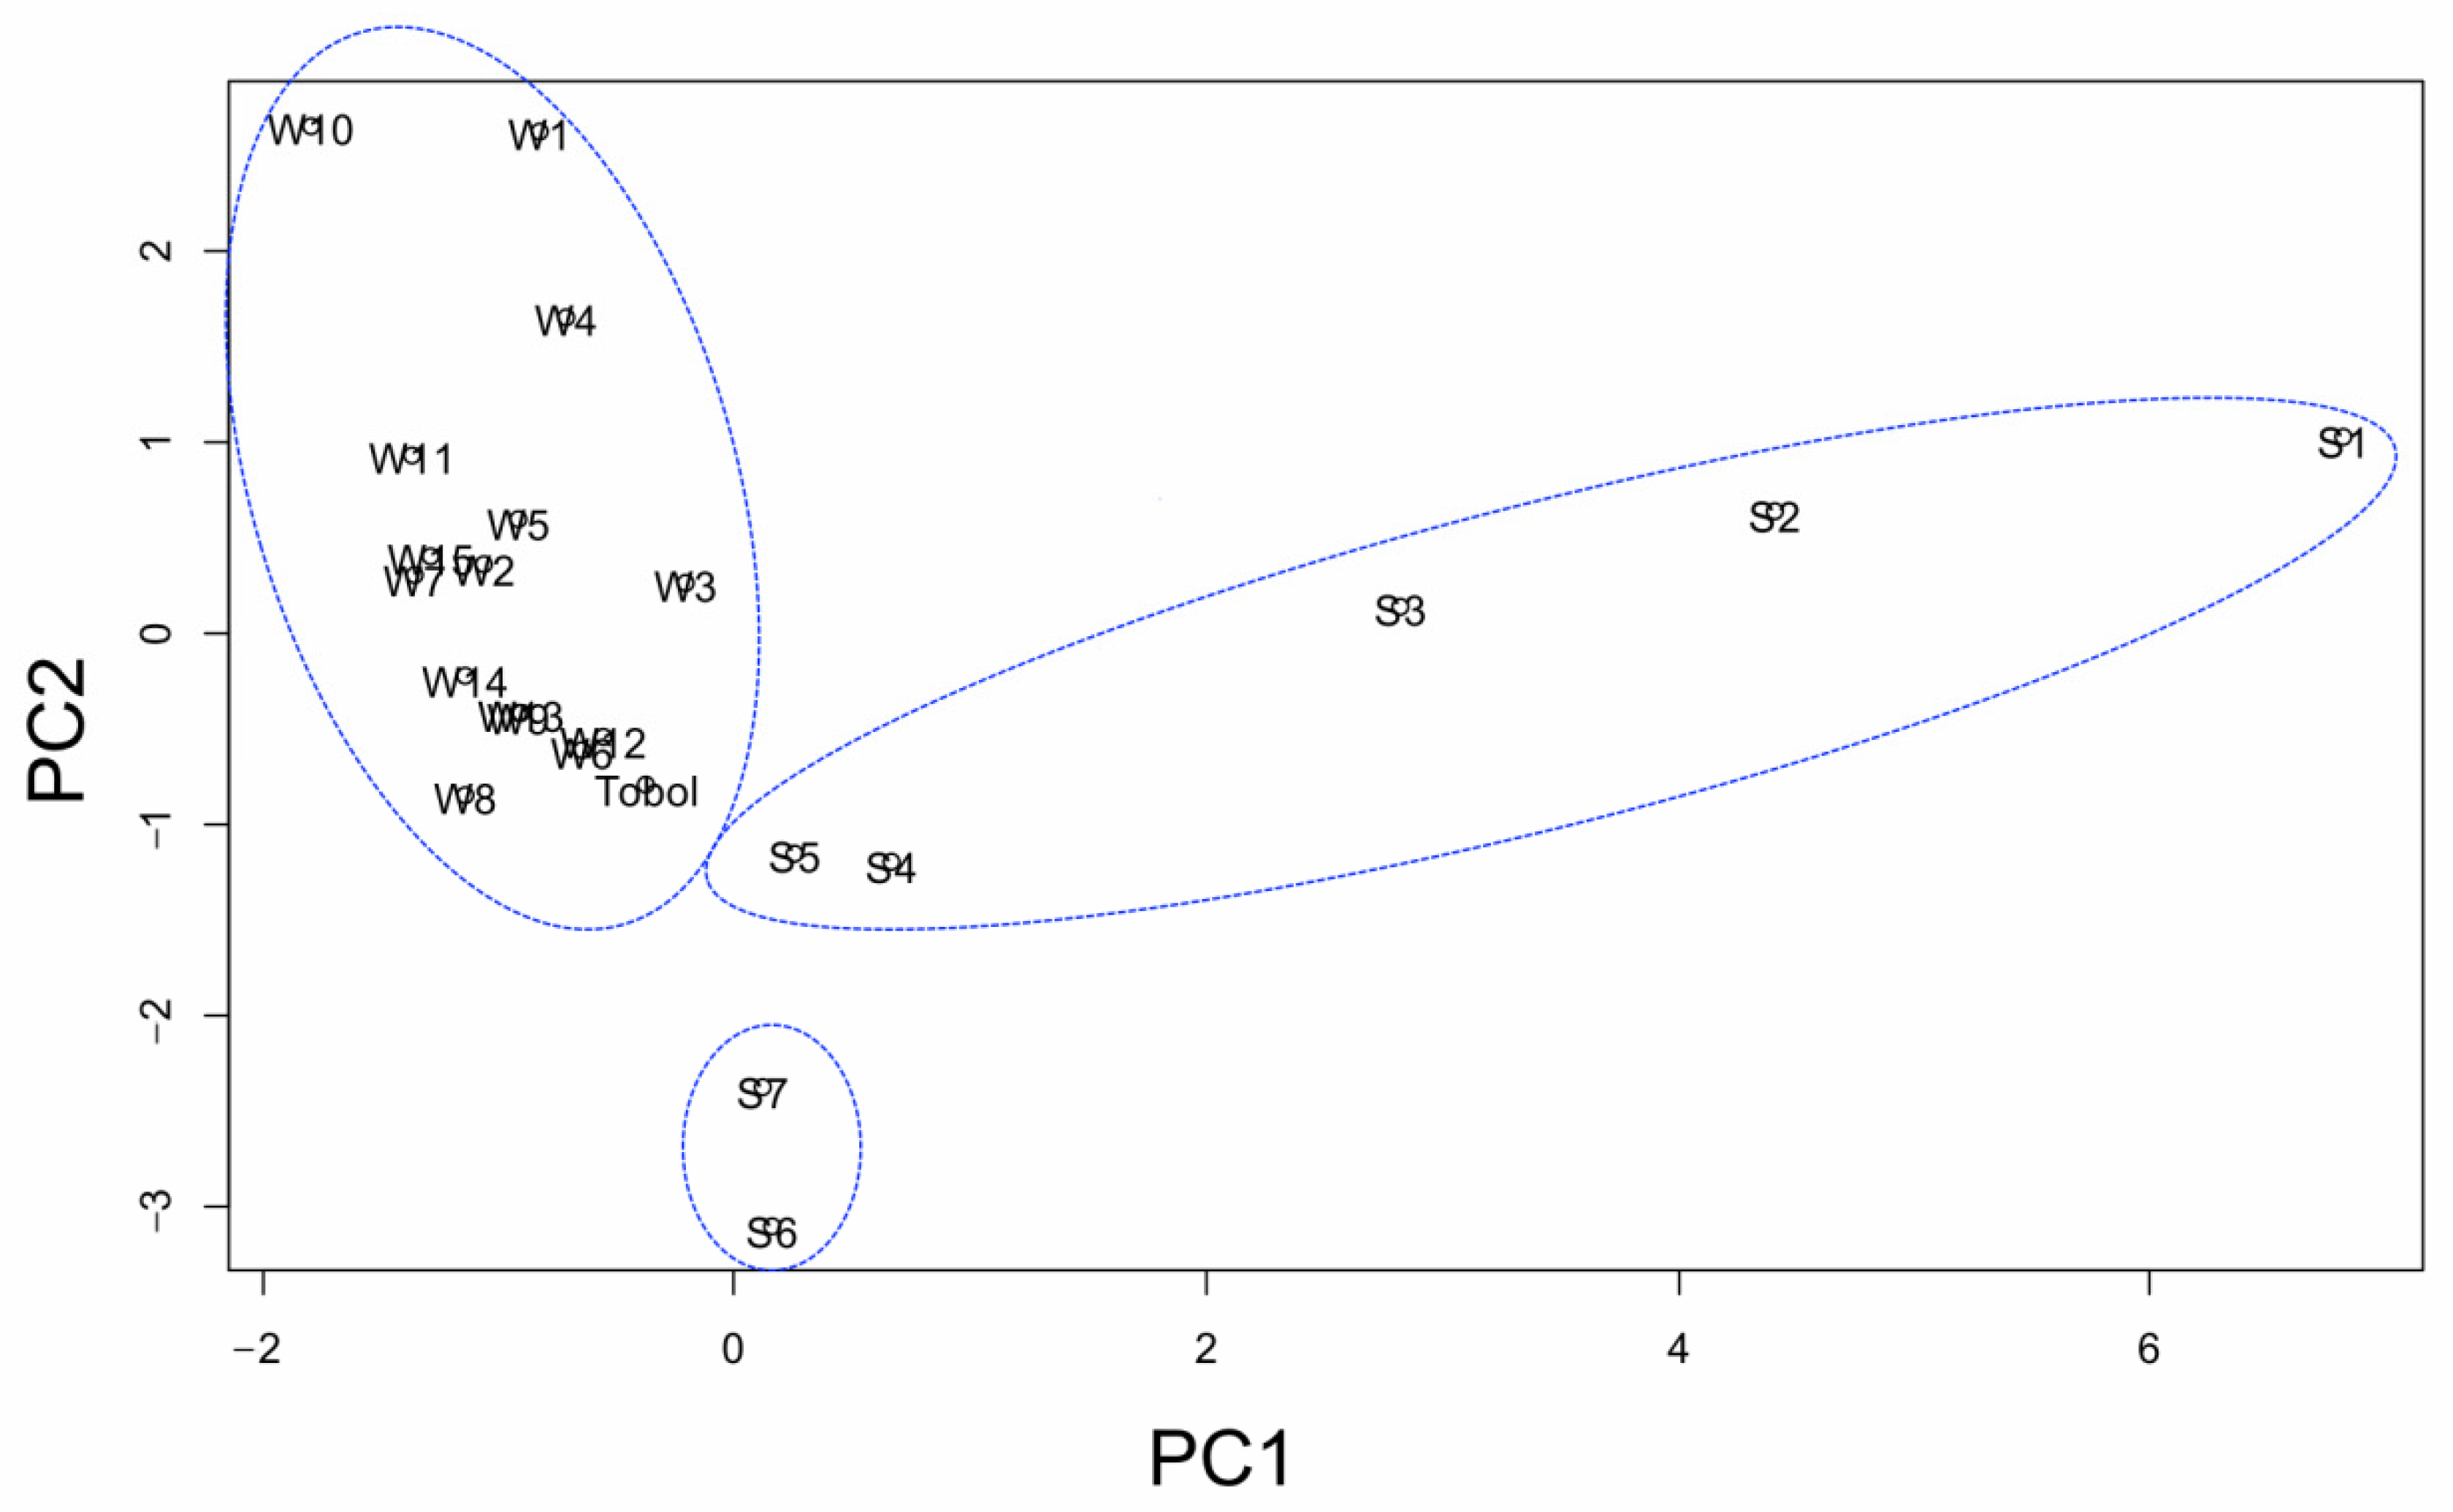
As shown in Table 6, PC1 is positively correlated with parameters characteristic for raw sewage (BOD. COD, TSS, N-NH4), which suggests that this component describes the share of raw sewage in the sampling point. On the other hand, PC2 has a high positive correlation with parameters such as Fe and Mn and a negative correlation with Cl, which clearly links this component with the properties of groundwater. PC3 has the highest positive correlation with nitrates and high negative correlation with sulfates, which may indicate the relationship of this component with natural biochemical processes taking place in surface waters (nitrification) and underground waters (leaching). Influent of PC1 and PC2 on sampling points is presented in Figure 8.
Principle components plot shown in Figure 8 suggests that influence of raw sewage decreases as treatment process takes place and retention time in sewage ponds increases. Additionally, samples S4 and S5 show some relationship to the properties of groundwater. Low impact of raw sewage is also evident for samples S6 and S7 but in this case link with groundwater samples does not exist. All groundwater samples create one group dominated by the PC2 factor. The Tobol River also belongs to this group, which more clearly indicates the impact of groundwater on the quality of the river water. It is also worth noting that the PCA has distinguished the same groups of sampling points as the cluster analysis.

4. Conclusions

Data obtained from the analysis of wastewater samples showed that primary settling tanks of the Kostanay city wastewater treatment plant are not working as required. This causes the discharge of excessive loads of organic pollutants and biogenic compounds to the sewage ponds and prevents the economic reuse of water from the ponds. Although no direct impact of sewage ponds on groundwater and Tobol river pollution has been found, studies showed that the water samples taken from the main sewage pond (Rybnoye Lake), in terms of their physico-chemical composition, have many features in common with groundwater samples, and groundwater samples—with the Tobol River. Such results indicate that sewage ponds may have impact on the quality of groundwater in their vicinity. It was also noted that the quality of groundwater may be affected by agricultural activities, as evidenced by high sulfate concentrations in selected wells, which was not related directly to the properties of the surrounding aquifer and nearby sewage ponds.

Author Contributions

Conceptualization, M.M. and K.O.; methodology, K.O., T.R., M.M. and D.A.; formal analysis, K.O., D.A. and M.M.; investigation, T.R. and K.O.; resources, T.R. and K.O.; data curation, T.R.; writing—original draft preparation, K.O., M.M. and T.R.; writing—review and editing, D.A. and K.O.; visualization, T.R. and D.A.; supervision, M.M. and K.O.; funding acquisition, K.O., M.M. and D.A. All authors have read and agreed to the published version of the manuscript.

Funding

This research was funded by public company “Kostanay SU”, grant number 4.012.18. Part of the research carried out at BUT was financed from subsidy provided by the Minister of Science and Higher Education, grant number WZ/WBIIS/2/2019. The APC was funded by Ministry of Education and Science of the Republic of Kazakhstan, grant number 2018/AP05132198.

Acknowledgments

The authors greatly appreciate the support of the administration of the city of Kostanay during the field research. We extend special thanks to the employees of Kostanay SU company, for their help in carrying out laboratory tests and the sampling process and to the laboratory team of “Institute of Hydrogeology and Geo-ecology named after U.M. Ahmedsafin” in Almaty.

Conflicts of Interest

The authors declare no conflict of interest.

References

  1. Code of Environmental Protection of the Republic of Kazakhstan No. 212-III–SAM, Astana (rev. 26.12.2019). 2007. Available online: https://online.zakon.kz/document/?doc_id=30085593#pos=11;46 (accessed on 25 January 2020).
  2. Directorate-General for the Environment. Water for Life—LIFE for Water—Protecting Europe’s Water Resources; Publications Office of the European Union: Luxembourg, 2010. [Google Scholar] [CrossRef]
  3. Directive 2000/60/EC of the European Parliament and of the Council of 23 October 2000 Establishing a Framework for Community Action in the Field of Water Policy. Available online: https://eur-lex.europa.eu/legal-content/EN/TXT/?uri=CELEX:32000L0060 (accessed on 23 March 2020).
  4. Millennium Ecosystem Assessment. Ecosystems and Human Well-Being: Synthesis; Island Press: Washington, DC, USA, 2005. [Google Scholar]
  5. American Academy of Environmental Engineers (AAEE). Environmental Engineering Body of Knowledge, 2009. Environmental Engineering Body of Knowledge Task Force. Available online: https://www.aaees.org/publications/eebodyofknowledge.php (accessed on 20 July 2020).
  6. US EPA. Principles of Design and Operations of Wastewater Treatment Pond Systems for Plant perators, Engineers, and Managers. EPA/600/R-11/088. August 2011. Available online: https://www.epa.gov/sites/production/files/2014-09/documents/lagoon-pond-treatment-2011.pdf (accessed on 20 July 2020).
  7. Racault, Y.; Boutin, C. Waste stabilization ponds in France: State of the art and recent trends. Water Sci. Technol. 2005, 51, 1–9. [Google Scholar] [CrossRef] [PubMed]
  8. Coble, L.W., Jr. Influence on Groundwater from the Bermed Infiltration Pond. J. Environ. Health 1981, 44, 27–31. [Google Scholar]
  9. Mikkelsen, P.S.; Halfiger, M.; Ochs, M.; Jacobsen, P.; Tjell, J.C.; Boller, M. Pollution of soil and groundwater from infiltration of highly contaminated stormwater—A case study. Water Sci. Technol. 1997, 36, 325–330. [Google Scholar] [CrossRef]
  10. Dzakpasu, M.; Scholz, M.; Harrington, R.; McCarthy, V.; Jordan, S. Groundwater Quality Impacts from a Full-Scale Integrated Constructed Wetland. Groundw. Monit. Remediat. 2014, 34, 51–64. [Google Scholar] [CrossRef] [Green Version]
  11. Gao, Q.; Blum, K.M.; Gago-Ferrero, P.; Wiberg, K.; Ahrens, L.; Andersson, L.P. Impact of on-site wastewater infiltration systems on organic contaminants in groundwater and recipient waters. Sci. Total Environ. 2019, 651, 1670–1679. [Google Scholar] [CrossRef] [PubMed]
  12. Roychoudhury, A.N.; Jacques Petersen, J. Geochemical evaluation of soils and groundwater affected by infiltrating effluent from evaporation ponds of a heavy mineral processing facility, West Coast, South Africa. J. Geochem. Explor. 2014, 144, 478–491. [Google Scholar] [CrossRef]
  13. Mapanda, F.; Nyamadzawo, G.; Nyamangara, J.; Wuta, M. Effects of discharging acid-mine drainage into evaporation ponds. lined with clay on chemical quality of the surrounding soil and water. Phys. Chem. Earth 2007, 32, 1366–1375. [Google Scholar] [CrossRef]
  14. Wang, S.; Changyuan, T.; Xianfang, S.; Qinxue, W.; Yinghua, Z.; Ruiqiang, Y. The impacts of a linear wastewater reservoir on groundwater recharge and geochemical evolution in a semi-arid area of the Lake Baiyangdian watershed, North China Plain. Sci. Total Environ. 2014, 482, 325–335. [Google Scholar] [CrossRef] [PubMed]
  15. Ying, G.G. Fate, behavior and effects of surfactants and their degradation products in the environment. Environ. Int. 2006, 32, 417–431. [Google Scholar] [CrossRef] [PubMed]
  16. Smith, V.H. Eutrophication of freshwater and coastal marine ecosystems a global problem. Environ. Sci. Pollut. Res. 2003, 10, 126–139. [Google Scholar] [CrossRef] [PubMed]
  17. Kovalenko, M.S.; Polozentseva, V.A. Nakopiteli stochnykh vod i promyshlennykh otkhodov kak potentsial’no opasnyye ob’yekty (Stores of sewages and industrial wastes as potentially hazardous objects). East Eur. J. Enterp. Technol. 2012, 12, 27–29. [Google Scholar]
  18. Global Wter Partnership. Regional’nyy obzor. Problemy vodosnabzheniya i kanalizatsii v stranakh Tsentral’noy Azii i Yuzhnogo Kavkaza (Regional review. Water supply and sanitation in the countries of Central Asia and the Southern Caucasus), August 2009, 14–15. Available online: https://www.gwp.org/globalassets/global/gwp-cacena_files/en/pdf/wss_review_2009.pdf (accessed on 3 September 2020).
  19. Zhumartov, E.B. Sovershenstvovaniye Tekhniki i Tekhnologii Ochistki Stochnykh vod v Sistemakh Maloy Kanalizatsii (Improvement of equipment and technologies for wastewater treatment in small sewerage systems). Ph.D. Thesis, Stabayev University, Almaty, Kazakhstan, December 2010. [Google Scholar]
  20. Baekenova, M.K. (Ed.) Natsional’nyy doklad o sostoyanii okruzhayushchey sredy v Respublike Kazakhstan v 2010 godu (State of Environment in the Republic of Kazakhstan in 2010. National Report), Kazakh Research Institute of the Ministry of Environment Protection for Ecology and Climate; RGP “KazNIIEK”: Almaty, Kazakhstan, 2011; p. 241. [Google Scholar]
  21. Andraka, D.; Ospanov, K.; Myrzakhmetov, M. Current State of Communal Sewage Treatment in the Republic of Kazakhstan. J. Ecol. Eng. 2015, 16, 101–109. [Google Scholar] [CrossRef] [Green Version]
  22. US EPA. Guidelines for Water Reuse. AR-1530 EPA/600/R-12/618. 2012. Available online: https://www3.epa.gov/region1/npdes/merrimackstation/pdfs/ar/AR-1530.pdf (accessed on 23 July 2020).
  23. Jhansi, S.C.; Mishra, S.K. Wastewater Treatment and Reuse: Sustainability Options. Consilience 2013, 1, 1–15. [Google Scholar]
  24. Finley, S.; Barrington, S.; Lyew, D. Reuse of Domestic Greywater for the Irrigation of Food Crops. Water Air Soil Pollut. 2009, 199, 235–245. [Google Scholar] [CrossRef] [Green Version]
  25. Programme Integrated Water Resources Management and Water Efficiency in the Republic of Kazakhstan for 2008–2025. Progress Report, UNDP Project #35289 (Draft), Astana 2007. Available online: https://www.gwp.org/globalassets/global/toolbox/about/iwrm/asia/kazakhstan-iwrm-action-plan.pdf (accessed on 20 July 2020).
  26. Tyumenev, S.D. Ispol’zovaniye stochnykh vod na massive Sorbulak (Wastewater use in the Sorbulak massif). In Proceedings of the International Scientific-Practical Conference for the 10th Anniversary of ICWC “Water-2002”, Astana, Kazakhstan, 20–22 February 2002; pp. 257–262. [Google Scholar]
  27. ST RK GOST R 51592-2003. Voda. Obshchiye Trebovaniya k Otboru Prob (Water. General Sampling Requirements); Committee for Technical Regulations and Metrology at the Min. of Industry and Trade of the Republic of Kazakhstan: Astana, Kazakhstan, 2003; p. 77. [Google Scholar]
  28. GOST 31942-2012 (ISO 19458: 2006): Voda. Otbor Prob Dlya Mikrobiologicheskogo Analiza (Water. Sampling for Microbiological Analysis); Standartinform: Moscow, Russia, 2012; p. 18. [Google Scholar]
  29. Introduction to R. Available online: https://www.r-project.org/about.html (accessed on 23 July 2020).
  30. Manly, B.F.J.; Alberto, J.A.N. Multivariate Statistical Methods: A Primer, 4th ed.; Chapman & Hall/CRC: Boca Raton, FL, USA, 2016; p. 163. [Google Scholar]
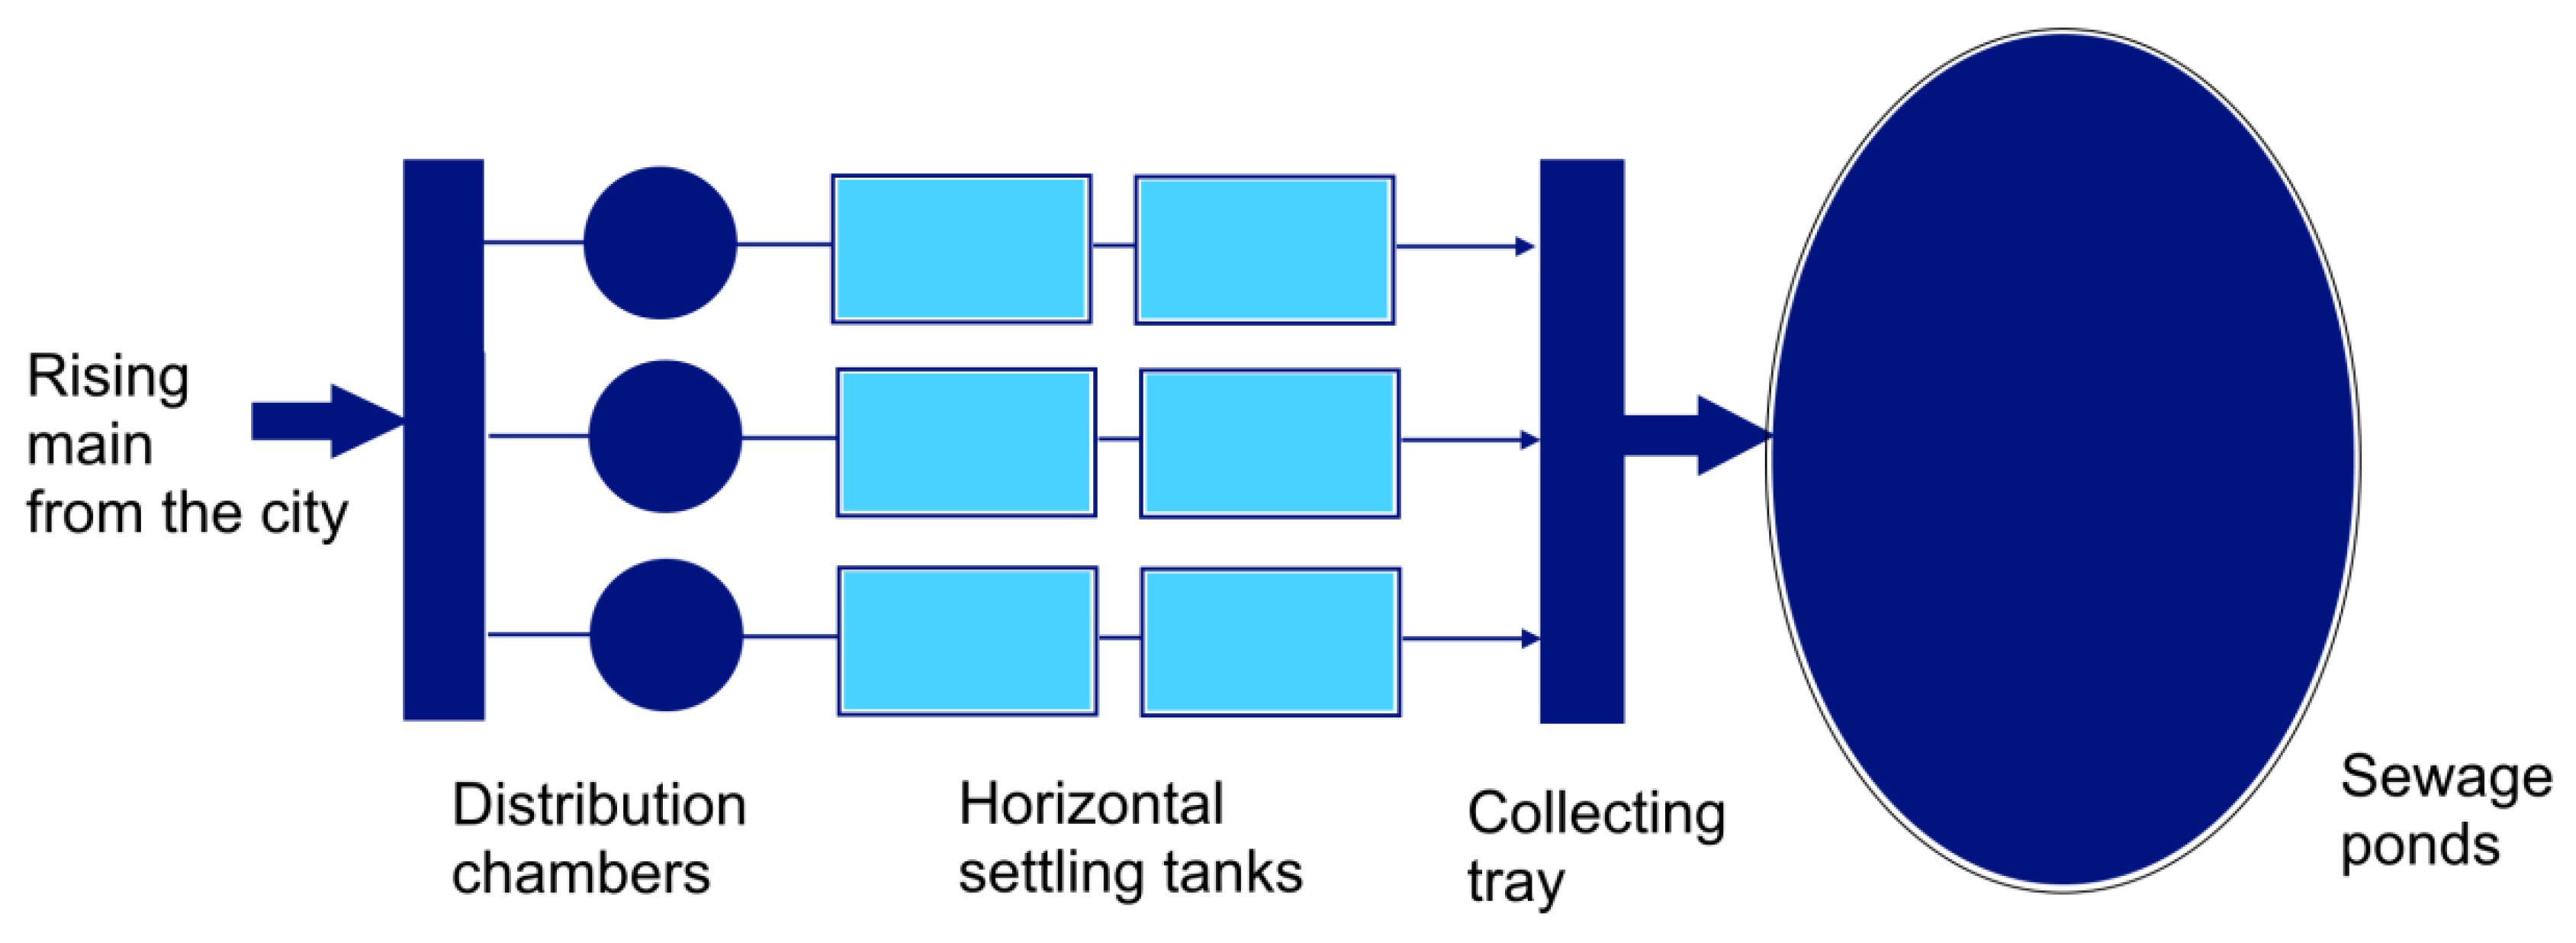
Figure 1. Scheme of wastewater treatment facilities for the city of Kostanay.
Water 12 02483 g001
Figure 2. Arrangement of sewage treatment facilities and sewage, groundwater and soil sampling points used for the research. (1) Mechanical pretreatment units; (2) Rybnoye Lake; (3) Kurgan Lake; (4) Mazarevo Lake; (5) Popov Lake; (6) Kolesnikov and Tomarkol Lake; (7) Tobol River; (S1–S7) wastewater sampling points; (W1–W15) groundwater sampling wells; (B1–B10) soil sampling boreholes.
Water 12 02483 g002
Figure 3. Isolines of groundwater level (m a.s.l.) in the study area.
Water 12 02483 g003
Figure 4. Isolines of ammonia nitrogen in the groundwater in the study area (mg/dm3).
Water 12 02483 g004
Figure 5. Isolines of BOD5 in the groundwater in the study area (mg/dm3).
Water 12 02483 g005
Figure 6. Isolines of nitrates (N-NO3) in the groundwater in the study area (mg/dm3).
Water 12 02483 g006
Figure 7. Clustering of sampling points by physico-chemical composition.
Water 12 02483 g007
Figure 8. Principle components plot, physico-chemical composition in sampling points.
Water 12 02483 g008
Table 1. Technical characteristics of sewage ponds serving Kostanay city.
Name of the
Pond
Nominal Fill HeightAreaNominal CapacityLength of the Coastline
m a.s.l.106 m2106 m3103 m
Rybnoye Lake (main storage)183.840.588.061.25
Kurgan Lake183.78.1911.7315.75
Mazarevo Lake175.74.56.113.0
Popov Lake175.05.15.812.0
Kolesnikov and Tomarkol Lake177.53.19.012.75
Table 2. Average values of selected wastewater quality parameters in the Kostanay wastewater treatment plant and relevant maximum allowable concentrations (MAC) values.
ParameterUnitSampling PointsMAC1MAC2
S1S2S3S4S5S6S7
BOD5mg/dm3282.5231.3190.749.540.720.418.087.023.0
CODmg/dm3470.0310.0275.054.345.538.530.0148.2915.0
TSSmg/dm3199.554.643.566.531.026.031.5166.7310.0
N-NH4mg/dm376.5684.931.871.160.642.140.8631.450.5
N-NO2mg/dm30.030.0250.140.380.030.0060.021.11-
N-NO3mg/dm30.830.541.041.030.590.390.866.9240.0
Phosphatesmg/dm38.76.55.934.23.280.720.465.95-
pH--6.857.27.458.858.458.658.8--
Cuprummg/dm30.010.010.0040000--
Potassiummg/dm33.243.24.14.34.13.2--
Magnesiummg/dm34.834.86.26.712.210.2--
Chloridesmg/dm3267.3272.3262.4678.2673.22425.51683350.0300.0
Sulfatesmg/dm3109.5104.991.391.3100.4123.282.1187.4100.0
Hardnessmg/dm387810.31116.313.4--
Ironmg/dm30.630.870.820.340.190.180.150.760.1
Manganesemg/dm30.220.20.20.030.220.010.050.370.01
Oil productsmg/dm300000000.30.05
Surfactantsmg/dm30.22.21.850.070.120.140.110.91-
Dry residuemg/dm31044.5969972.5160717074271.53191--
S1—distribution chamber before settling tanks, S2—collector after settling tanks, S3—influent to Rybnoye Lake, S4—Rybnoe Lake, S5—overflow from Rybnoe Lake to Kurgan Lake, S6—Mazarevo Lake and S7—Popovo Lake; MAC1—maximum admissible concentration established for discharge of wastewater to Kostanay sewage ponds; MAC2—maximum admissible concentration in surface waters for fishery.
Table 3. Removal efficiency of selected parameters in the Kostanay wastewater treatment plant.
ParameterRemoval Efficiency in Sampling Points
S2S3S4S5S6S7
%
BOD518.1232.5082.4885.5992.7893.63
COD34.0441.4988.4590.3291.8193.62
TSS72.6378.2066.6784.4686.9784.21
Table 4. Average values of the selected quality parameters of groundwater and the Tobol River.
Sampling
Point
TSSBOD5CODSO4ClFeN-NH4N-NO3Mn
(mg/dm3)
Groundwater
W140.55.47102.5252.94.841.112.7
W211.520.527650117.50.360.355.030.8
W327.539.552.84001250.437.92.990.78
W42723.1430.796.347.50.380.367.891.64
W57.3532.0542.2545216.80.721.47.281.05
W66.45.987.682151850.90.053.770.005
W75.88.5111.5672.54800.870.073.770.98
W84.612.516.368511001.680.31.990.028
W94.48.3810.6456.31250.50.050.110.17
W105.44.265.76655556.121.440.99
W115.26.98.64570601.360.043.771.12
W124.66.127.68102.5900.311.322.60.02
W134.38.2510.64501150.450.051.440.17
W145.34.796.72610850.450.051.440.22
W153.69.8413.4640112.50.440.051.770.93
Tobol river
Tobol R.29.53.43.8230.0180.70.30.560.40.04
MAC210.03.015.0100.0300.00.10.540.00.01
MAC2–maximum admissible concentration in surface waters for fishery.
Table 5. Importance of components for analyzed variables.
PC1PC2PC3PC4PC5PC6PC7PC8PC9
Standard deviation1.99360.32260.15380.90310.64950.63650.49590.23240.0507
Proportion of Variance0.44160.19440.14790.09060.04690.04500.02730.00600.0003
Cumulative Proportion0.44160.63600.78390.87450.92140.96640.99370.99971.0000
Table 6. Correlation matrix for analyzed variables.
Primary Components and Variables
PC1PC2PC3TSSBODCODN-NH4N-NO3FeMnSO4Cl
PC11.00
PC20.001.00
PC30.000.001.00
TSS0.880.100.051.00
BOD0.970.15−0.070.801.00
COD0.970.15−0.080.840.991.00
N-NH40.930.21−0.120.740.950.941.00
N-NO3−0.130.260.87−0.08−0.12−0.12−0.141.00
Fe−0.210.62−0.43−0.11−0.11−0.10−0.03−0.121.00
Mn−0.290.760.25−0.10−0.21−0.20−0.160.330.421.00
SO4−0.560.25−0.55−0.50−0.42−0.40−0.37−0.210.290.151.00
Cl0.07−0.75−0.040.05−0.05−0.04−0.09−0.20−0.21−0.38−0.251.00