Article

Spatiotemporal Analysis of Maize Water Requirement in the Heilongjiang Province of China during 1960–2015

1
School of Water Conservancy and Electric Power, Heilongjiang University, Harbin 150080, China
2
College of Ecology and Environment, Hainan University, Haikou 570208, China
3
College of Hydraulic and Environmental Engineering, China Three Gorges University, Yichang 443002, China
4
College of Electronic Engineering, Heilongjiang University, Harbin 150080, China
5
Heilongjiang East Water Saving Equipment Co., Ltd., Suihua 152000, China
*
Author to whom correspondence should be addressed.
Water 2020, 12(9), 2472; https://doi.org/10.3390/w12092472
Submission received: 5 August 2020 / Revised: 29 August 2020 / Accepted: 1 September 2020 / Published: 3 September 2020
(This article belongs to the Special Issue Irrigation Management)

Abstract

:
Climate change will have a significant effect on crop water requirement (ETc). The spatial and temporal variations of water requirement of maize under climate change are essential elements when conducting a global water security assessment. In this paper, annual reference crop evapotranspiration (ET0) and the crop water requirement of maize were calculated by the single crop coefficient method. The crop water surplus deficit index (CWSDI) and coupling degree of ETc and effective precipitation (Pe) were calculated to analyze the relationship between ETc, ET0, and Pe. The result shows that maize average annual ET0, ETc, and precipitation were 552.97, 383.05, and 264.97 mm, respectively. Moreover, ET0, ETc, and Pe decreased by 3.28, 2.56, and 6.25 mm every decade from 1960 to 2015. The ETc decreased less than Pe did, which led to the decreasing of both CWSDI and the coupling degree of ETc and Pe. The tendency of ET0, ETc decreased first and then increased, while Pe and CWSDI increased first and then decreased, from west to east of the Heilongjiang Province. In addition, the highest ET0, ETc, and lowest CWSDI and Pe were found in the western part of Heilongjiang Province. This study indicated that even though the water deficit in the western region was alleviated and the water deficit in the eastern region grew gradually serious from 1960 to 2015, the drought situation in western Heilongjiang Province should still be taken seriously.

1. Introduction

Global warming, characterized by rising temperature, is widely accepted as the main feature of climate change [1]. The Fifth Assessment Report of the United Nations Intergovernmental Panel on Climate Change (IPCC) showed that the annual Northern Hemisphere temperatures from 1983 to 2013 were the warmest for a 30-year period during the past 800 years [2,3]. Global warming due to the greenhouse effect is expected to cause major climatic changes in some areas [4]. Furthermore, climate change has a significant effect on crop water requirement (ETc), actual evapotranspiration, and grain yield due to increased temperature and variable precipitation, wind speed, and sunshine hours, especially in areas with poor adaptability. Actual evapotranspiration, as a major process in the hydrological system and climate systems, plays an important role in explaining the climate change processes and has a substantial effect on weather patterns [5,6]. Climate change is expected to increasingly affect crop actual evapotranspiration and ETc [7]. Such changes are crucial for the prediction of the fate of terrestrial ecosystems under environmental changes [8] and will have an impact on regional and global food security and water security [9].
Maize and other cereal crops are highly important in ensuring global food security. Maize is one of the world’s three most widely cultivated crops and, according to the Food and Agriculture Organization (FAO), accounted for almost 38% of world cereal production in 2007 [10]. To meet the demands of global population growth, the declaration of the 2009 World Summit on Food Security suggested crop production should be increased by almost 70% by 2050 [11]. Therefore, ensuring global agriculture development and food security for an increasing population is a key challenge. China, as the world’s second-largest maize consumer and producer, consumes more than 18% of the global maize yield [12]. In 2017, the FAO reported that China’s maize yield accounted for 23% of global production and 22% of the global harvest area [13]. According to the National Bureau of Statistics of China [14], in 2017 maize yield was 2.15 × 10⁸ tons, the planting area of maize was 3.544 × 10⁸ ha, and the average unit yield was 6090 kg/ha.
Climate change, including increased temperature and other negative effects on maize yield, has occurred in many countries, including China [15,16,17]. The need for explicit knowledge about the changes in reference crop evapotranspiration (ET0), ETc, and effective precipitation (Pe) under climate change is necessary to guide future agricultural policy, development, research, and investment [18]. In recent years, researchers have calculated ET0 using methods such as remote sensing, crop models based on surface observation, and the Penman–Monteith (P-M) equation recommended by the FAO [19,20,21]. Surface observation calculates the water requirement at the farmland scale; however, this is time-consuming and not suitable for use in the region of the current study [21,22]. The remote sensing approach aims to estimate crop water requirements by combining ground meteorological observations and growing stages of the crop, but its accuracy cannot be guaranteed [23,24]. In a previous study, according to analysis of the Penman–Monteith potential evapotranspiration model, Adrian et al. investigated the spatial changes and temporal distribution of ET0 in Moldova [25]. Bios et al. found that climate factors, including wind speed and temporal solar radiation, had a strong impact on the ET0 calculation [26]. Espadafor et al. also used the Penman–Monteith method, and found that solar radiation, air temperature, and relative humidity affected the tendency of ET0 and that forecasts of ET0 had an increasing trend [27]. Wang et al. studied the relationship between water supply and irrigation water requirements using the Penman–Monteith method [28]. Using the P-M method and accounting for vital climate parameters that affect ET0 eliminates the inconsistency in trends when one or more meteorological elements are omitted [25].
Numerous previous studies showed that maize ET0 and ETc had increasing trends. Arshad et al. used the statistical downscaling model to calculate the meteorological parameters during 1961–2099; results showed that the temperature and wind speed will increase, while precipitation and relative humidity may decrease, in future periods [29]. Increasing trends of ET0 and ETc were also shown in Romanian and Mediterranean areas [30,31]. Studies have also indicated that ET0 is expected to maintain an increasing trend in the future. However, due to increasing temperature, studies found ET0 was decreasing in some regions of Asian countries, including most regions of China [27]. Thomas et al. showed that ET0 decreased in all years from 1954 to 1993, especially in northwest and southeast China [32]. Xu et al. found that wind speed and net total radiation were the main factors causing a decreasing trend in the Yangzi River catchment during 1960–2000 [33]. Nie et al. analyzed meteorological elements in districts of northern China and found that ET0 and precipitation showed decreasing trends of −2.98 and −12.04 mm/(10a), respectively [34]. Wang et al. analyzed the water deficit and surplus in Jinlin Province China. Wang’s study showed maize water deficit was in an increasing trend in terms of space and time, while maize ETc was increasing in Jinlin Province [35]. Zhang et al. constructed a drought severity index (DSI) from NDVI and ET/PET as a remotely sensed drought indicator, which indicated the most significant impacts of drought occurred during the grain-filling and heading stages [36]. In this study, crop water surplus deficit index (CWSDI) and the coupling degree of ETc and Pe were used to express the degree of water deficit and surplus, and the relationship between ETc and Pe during maize growth periods from 1960 to 2015. These two parameters can express the relationship between ETc and Pe more intuitively.
Heilongjiang Province is one of the most important grain-producing areas in China. It is located in Northeast China and its grain production accounted for 11.3% of the nation’s grain yield in 2017 [14]. As a result, Heilongjiang Province plays an important part in ensuring China’s agricultural food security. In this region, precipitation is governed by the East Asian summer monsoons, and it has experienced extreme droughts and waterlogging events since the 1970s. Due to climate change and variation of precipitation, water supply and requirements vary in the Heilongjiang Province in a spatiotemporal manner. Spatiotemporal analysis of maize ET0, ETc, Pe, and CWSDI, and the coupling degree of ETc and Pe, provide a theoretical and practical basis for improving the management efficiency of water resources and formulating a reasonable irrigation system.
The purposes of this study were (1) to quantify ET0, ETc, and Pe of maize in Heilongjiang Province; (2) to determine the spatiotemporal distribution characteristics of ET0, ETc, and Pe during the growth stage for maize in Heilongjiang Province during 1960–2015; (3) to quantify the crop water surplus deficit index (CWSDI) using the ratio of ETc and Pe based on actual records during the growth stage of maize for the 55-year period; and (4) to analyze the spatiotemporal distribution characteristics of CWSDI and the coupling degree of ETc and Pe during the growth stage of maize in Heilongjiang Province during 1960–2015.

2. Materials and Methods

2.1. Study Area

In this study, daily meteorological data were collected from 26 agricultural meteorological stations during 1960–2015 in Heilongjiang Province, including the highest temperature, lowest temperature, average relative humidity, wind speed, sunshine hour, precipitation, latitude, longitude, and latitude of each station. The quality of above data were carefully assessed, and the missing data were estimated using methods suggested by the FAO-56 [17]. Observation data during maize growth periods were obtained from 14 agricultural observation stations in the study area from 1991 to 2008. The above data were collected from the China Meteorological Data Sharing Service System [37]. Figure 1 shows the distribution of the research area and observation stations. According to the accumulated temperature zone of crop varieties in Heilongjiang Province [38], issued by Heilongjiang Agricultural Commission, and Area Layout Planning of High-quality and High-yield Main Food Crops in Heilongjiang Province in 2015 [39], the sixth accumulated temperature zone was not suitable for maize planting; thus, the sixth accumulated temperature zone was not included in this paper.

2.2. Effective Precipitation

In this study, we used the method recommended by the Soil Conservation Agency of the U.S. Department of Agriculture to calculate effective precipitation [40], as follows:
P e = { P ( 4.17 0.2 P ) / 4.17 4.17 + 0.1 P   ( P 8.3   mm ) ( P > 8.3   mm )
where Pe is effective precipitation (mm) and P is precipitation (mm).

2.3. Maize Water Requirement

Maize water requirement was calculated with the CROPWAT8.0 for Windows computer program, it was designed for the calculation of ETc from existing climate, crop, and soil data. It has been appropriately used as a tool for calculating ETc under climate change and widely used in Asia, Europe, and Africa with reliable high performance [40,41]. The altitude, latitude, longitude, and daily highest temperature, lowest temperature, average relative humidity, wind speed, sunshine hour data of each station were loaded to the Climate/ET0 module to calculate ET0. The planting date, harvest date, Kc values, and length of each growth period were loaded to the Crop module to calculate ETc. The maize water requirement was calculated by the single crop coefficient method [10]. Total maize water required was accumulated from the daily water requirement during the growth period based on the crop coefficient in different months, as in Equation (2). Crop evapotranspiration under standard conditions, denoted ETc, is the evapotranspiration from disease-free, well-fertilized crops, grown in large fields, under optimum soil water conditions, and achieving full production under the given climatic conditions [40].
E T c = K c × E T 0
where ETc is the crop water requirement (mm), ET0 is the reference crop evapotranspiration (mm), and Kc is the crop coefficient.
FAO-56 divides crop growth period into four periods: The initial stage (Lini) runs from planting date to approximately 10% ground cover, the crop development stage (Ldev) runs from 10% ground cover to effective full cover, the mid-season stage (Lmid) runs from effective full cover to the start of maturity, and the late season stage (Llate) runs from the start of maturity to harvest or full senescence [40]. The whole growth period of maize was divided into four stages: Sowing–Seven leaf stage (Lini), Seven leaf stage–Tasseling stage (Ldev), Tasseling stage–Milk ripening stage (Lmid), and Milk ripening stage–Mature stage (Llate). The FAO-56 method reports generalized Kc values for different growing stages of maize under standard conditions. The single crop coefficient Kc is described by Kc-ini, Kc-mid and Kc-end for the initial, middle, and late growth stages, respectively, with respective recommended values of 0.3, 1.20, and 0.35 for maize. However, to improve the estimation of the Kc curve for a specific site, the recommended values need to be adjusted to obtain a local Kc value. In this paper, Kc-ini, Kc-mid and Kc-end were obtained from the recommended values in the FAO-56 and were internal automatic correction by CROPWAT model based on average infiltration depth, wind speed, humidity, crop height at different growing stage, and the correction formula of Kc has been embedded into the CROPWAT model [41].
ET0 was calculated by the Penman–Monteith method recommended by the FAO, as in Equation (3).
E T 0 = 0.408 ( R n G ) + γ 900 T + 273 T u 2 ( e s e a ) Δ + γ ( 1 + 0.34 u 2 )
where ET0 is reference crop evapotranspiration (mm·day−1); Rn is net radiation at the crop surface (MJ·(m2·d)−1); G is soil heat flux (MJ·(m2·d)−1); T is average air temperature (°C); u2 is wind speed measured at 2 m height (m·s−1); es − ea is the vapor pressure deficit (KPa); Δ   is the slope of the vapor pressure curve (KPa·°C−1); γ is psychrometric constant (KPa·°C−1); 900 is a conversion factor.

2.4. Crop Water Surplus Deficit Index

To accurately reflect water requirements and the water supply status of maize, we established the water requirement index during the maize growth stage ETc and the water supply index Pe, and constructed the crop water surplus deficit index (CWSDI) to describe maize water surplus and deficit during the maize growth stage based on maize water deficit index [42], as in Equation (4):
C W S D I = P e E T c E T c
where CWSDI is the crop water surplus deficit index, Pe is effective precipitation (mm), ETc is crop water requirement (mm).

2.5. Coupling Degree of ETc and Pe

The coupling degree of ETc and Pe, λ i , represents the extent to which Pe meets ETc, as in Equation (5).
λ i = { 1 P e / E T c     ( P e E T c ) ( P e < E T c )

2.6. Climate Tendency Rate

The climatic tendency of factors is expressed by a linear equation using the least squares method, as in Equation (6).
Y ^ = b 0 t + b
where Y ^ represents the fitted values of the studied elements, t is the corresponding year, and b0 and b are the regression coefficients.
10b0 is the climate tendency rate, which means a meteorological element per 10-year(10a) change. A positive value indicates an increasing trend of the corresponding meteorological elements, and negative values indicate a decreasing trend.

2.7. Trend Test

The Mann–Kendall trend test is a non-parametric statistical method that can be used to reveal the changing trend of time series and more prominent adaptability to a non-normal distribution of meteorological data. Positive and negative values of the statistical variable Z represent the trend of data change; when Z has an absolute value greater than or equal to 1.64, 2.32, or 2.56, it means passing the significance test with 95%, 99%, and 99.9% reliability, respectively [30]. This paper used the Mann–Kendall trend test to test the parameter changing trend of ET0, ETc, precipitation, and CWSDI.

2.8. Data Processing

In this study, we used MATLAB 2004b software to (i) calculate ETc, Pe, and the climate tendency rate of maize in 26 meteorological stations of Heilongjiang Province and (ii) for the Mann–Kendall trend test. We used the spatial analysis function of ArcMap 10.2 toolbox to interpolate and map the parameters, the ordinary kriging method was employed to prepare the spatial mapping of ET0, ETc, Pe, and CWSDI and coupling degree of ETc and Pe, as it was widely used in geoscience for interpolating from sparse sample data.

3. Results

3.1. Spatial and Temporal Variation of ET0

The spatial distribution of ET0 and its climate tendency in this study area during 1960–2015 is shown in Figure 2. ET0 ranged from 422.78 to 697.60 mm, with an average of 552.97 mm. Average ET0 values during 1960–1979, 1980–1999, and 2000–2015 were 563.65, 545.42, and 549.82 mm, respectively. Figure 2 shows that there was a marked decrease and a then slight increase of ET0 from west to east in the Heilongjiang region from 1960 to 2015. The high-value areas were mainly distributed in the western region with an average of more than 584.66 mm and the low-value areas were mainly distributed in the northeast area, with an average of less than 477.90 mm. The climate tendency rate of ET0 was between −22.81 and 13.76 mm/(10a) from 1960 to 2015, with an average of −3.28 mm/(10a). The figure shows that there was a gradual decrease of ET0 in the western area, with a climate tendency rate of less than −4.02 mm/(10a), and the climate tendency of ET0 in Anda reached −17.98 mm/(10a). The climate tendency of ET0 in the northern and eastern areas showed an increasing trend, with a climate tendency rate of more than 0.434 mm/(10a).
The average climate rates of ET0 during 1960–1999, 1980–2015, and 1960–2015 were −2.24, −4.19, and −3.28 mm/(10a), respectively. The climate tendency rate of ET0 during 1980–2015 changed most, compared with that of 1960–1999 and 1960–2015. The climate tendency rate of ET0 was a gradual decrease in the western area; that of Anda was less than −10 mm/(10a) during 1960–1999, and there were eight areas less than −10 mm/(10a) during 1980–2015. Other regions showed a slight decrease, except for the northern areas of Heilongjiang. Huma and Sunwu, in the north, showed increasing trends during 1980–2015, which were statistically significant at the level of p < 0.001.

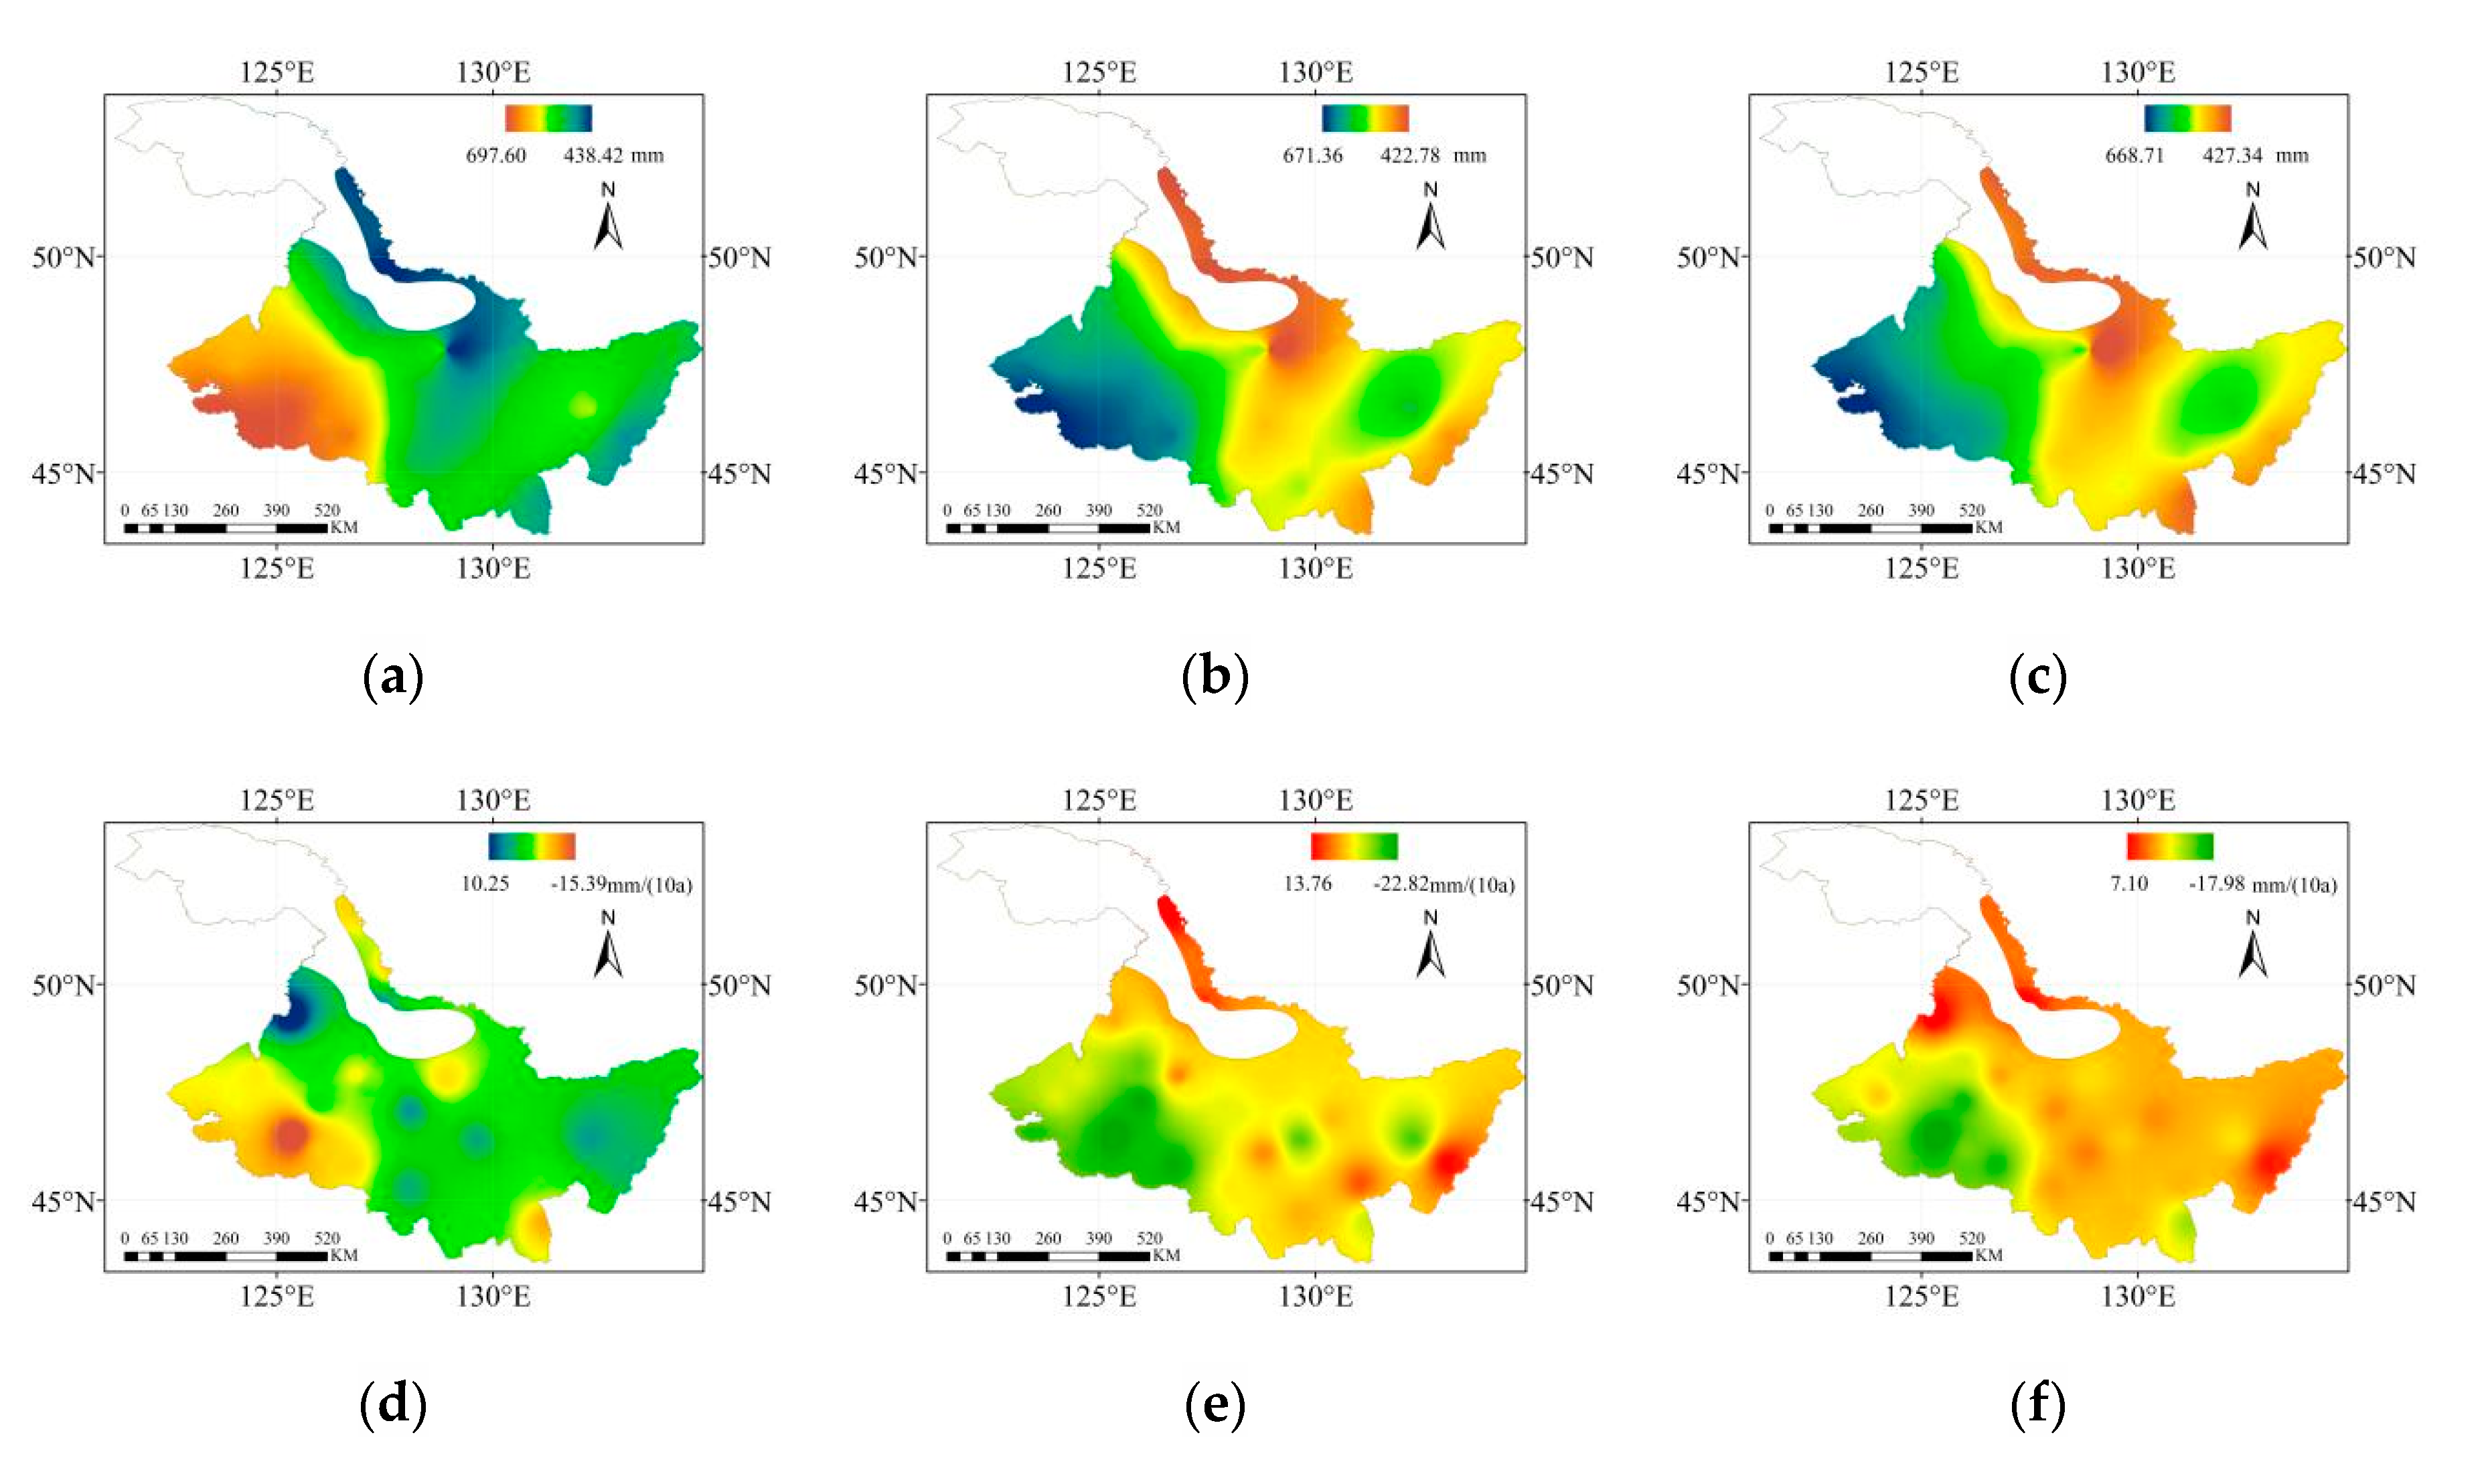
3.2. Spatial and Temporal Variation of Maize ETc

The spatial distribution of ETc and its climate tendency in this study area during 1960–2015 is shown in Figure 3. ETc ranged from 294.82 to 482.74 mm, with an average of 383.05 mm. Average ETc values during 1960–1979, 1980–1999, and 2000–2015 were 393.33, 376.09, and 379.73 mm, respectively. Figure 3 shows that there was a marked decrease and a then slight increase in the value of ETc from west to east in the Heilongjiang region from 1960 to 2015. The high-value areas were mainly distributed in the western part, with an average of more than 401.64 mm. The low-value areas were mainly distributed in the northeast area, with an average of less than 351.85 mm. The climate tendency rate of ETc was between −13.20 and 7.00 mm/(10a) from 1960 to 2015, with an average of −2.56 mm/(10a). There was a gradual increase in the climate tendency rate of ETc from west to east, with 20 stations recording negative values. Although ETc showed a decreasing trend, the climate tendency rate of ETc in northern areas was positive and was statistically significant at the level of p < 0.01.
From 1960 to 2015, the average ETc during 1960–1979 was relatively high compared with that during 1980–1999 and 2000–2015. The average climate rates of ETc during 1960–1999, 1980–2015, and 1960–2015 were −1.85, −2.37, and −2.56 mm/(10a), respectively. The climate tendency rate of ETc during 1960–1999 was the lowest, compared with that during 1980–2015 and 1960–2015. The climate tendency rate in this figure shows a gradual decrease in the western area; only that of Anda was less than −10 mm/(10a) during 1960–1999, and there were seven areas with values less than −10 mm/(10a) during 1980–2015. Compared with these two periods, the highest climate tendency rate was in the eastern area from 1960 to 1999 and in the northern area during other periods.

3.3. Spatial and Temporal Variation of Pe

The spatial distribution of Pe during the maize growing period and its climate tendency in this study area during 1960–2015 is shown in Figure 4. The range of Pe was 350.47–182.29 mm, with an average of 264.97 mm. Average Pe values during 1960–1979, 1980–1999, and 2000–2015 were 258.31, 279.65, and 256.93, respectively. Pe showed an increasing trend from western to central regions, and then decreased from the central to eastern regions. The higher-value regions were generally distributed in the central and southern areas such as Yichun, Tie Li, and Shang Zhi, with average values of more than 280 mm. The low-value areas were mainly distributed in the western and northern areas, such as Huma, Nenjiang, Fuyu, Qiqihar, and Tailai, with average values of less than 275 mm. The climate tendency rate of Pe in the maize growth period ranged between −30.42 and 17.26 mm.
The average climate rates of Pe during 1960–1999, 1980–2015, and 1960–2015 were 0.29, −5.42, and −1.00 mm/(10a), respectively. From Figure 4, the higher climate tendency rates of Pe moved from the western to the central areas. Comparing Figure 4d–f shows that the increasing trend of Pe gradually slowed. The climate tendency rate was positive in 15 areas during 1960–1999, nine areas during 1980–2015, and 14 areas during 1960–2015. Furthermore, in this figure, the decreasing trend changed from north to south.

3.4. Spatial and Temporal Variation of CDSWI

The spatial distribution of the crop water surplus deficit index (CWSDI) and its climate tendency in this study area during 1960–2015 is shown in Figure 5. CWSDI ranged from −60% to 1%, with an average of −28%. Average CWSDI values during 1960–1979, 1980–1999, and 2000–2015 were −32%, −24%, and −30%, respectively. Figure 5 shows almost all areas were in a water deficit state during maize growth periods. From Figure 5, CWSDI shows a trend of slowdown in water deficit from west to east. Furthermore, the water deficit of maize was serious, with CWSDI values of less than −40% in the western and a few northeastern areas. The most serious water deficit area was Tailai in all three periods. In this study, only Yichun was in a water surplus state. The CWSDI climate tendency rate showed little change during the study period; the climate tendency rates of CWSDI were 0.14, −0.96, and 0.09%/(10a), respectively. The worst decline area was Tonghe, and the decreased trend of Tonghe was statistically significant at the level of p < 0.01. The climate tendency rate of CWSDI showed the largest decrease during 1980–2015, compared with that during 1960–1999 and 1960–2015, when it increased.

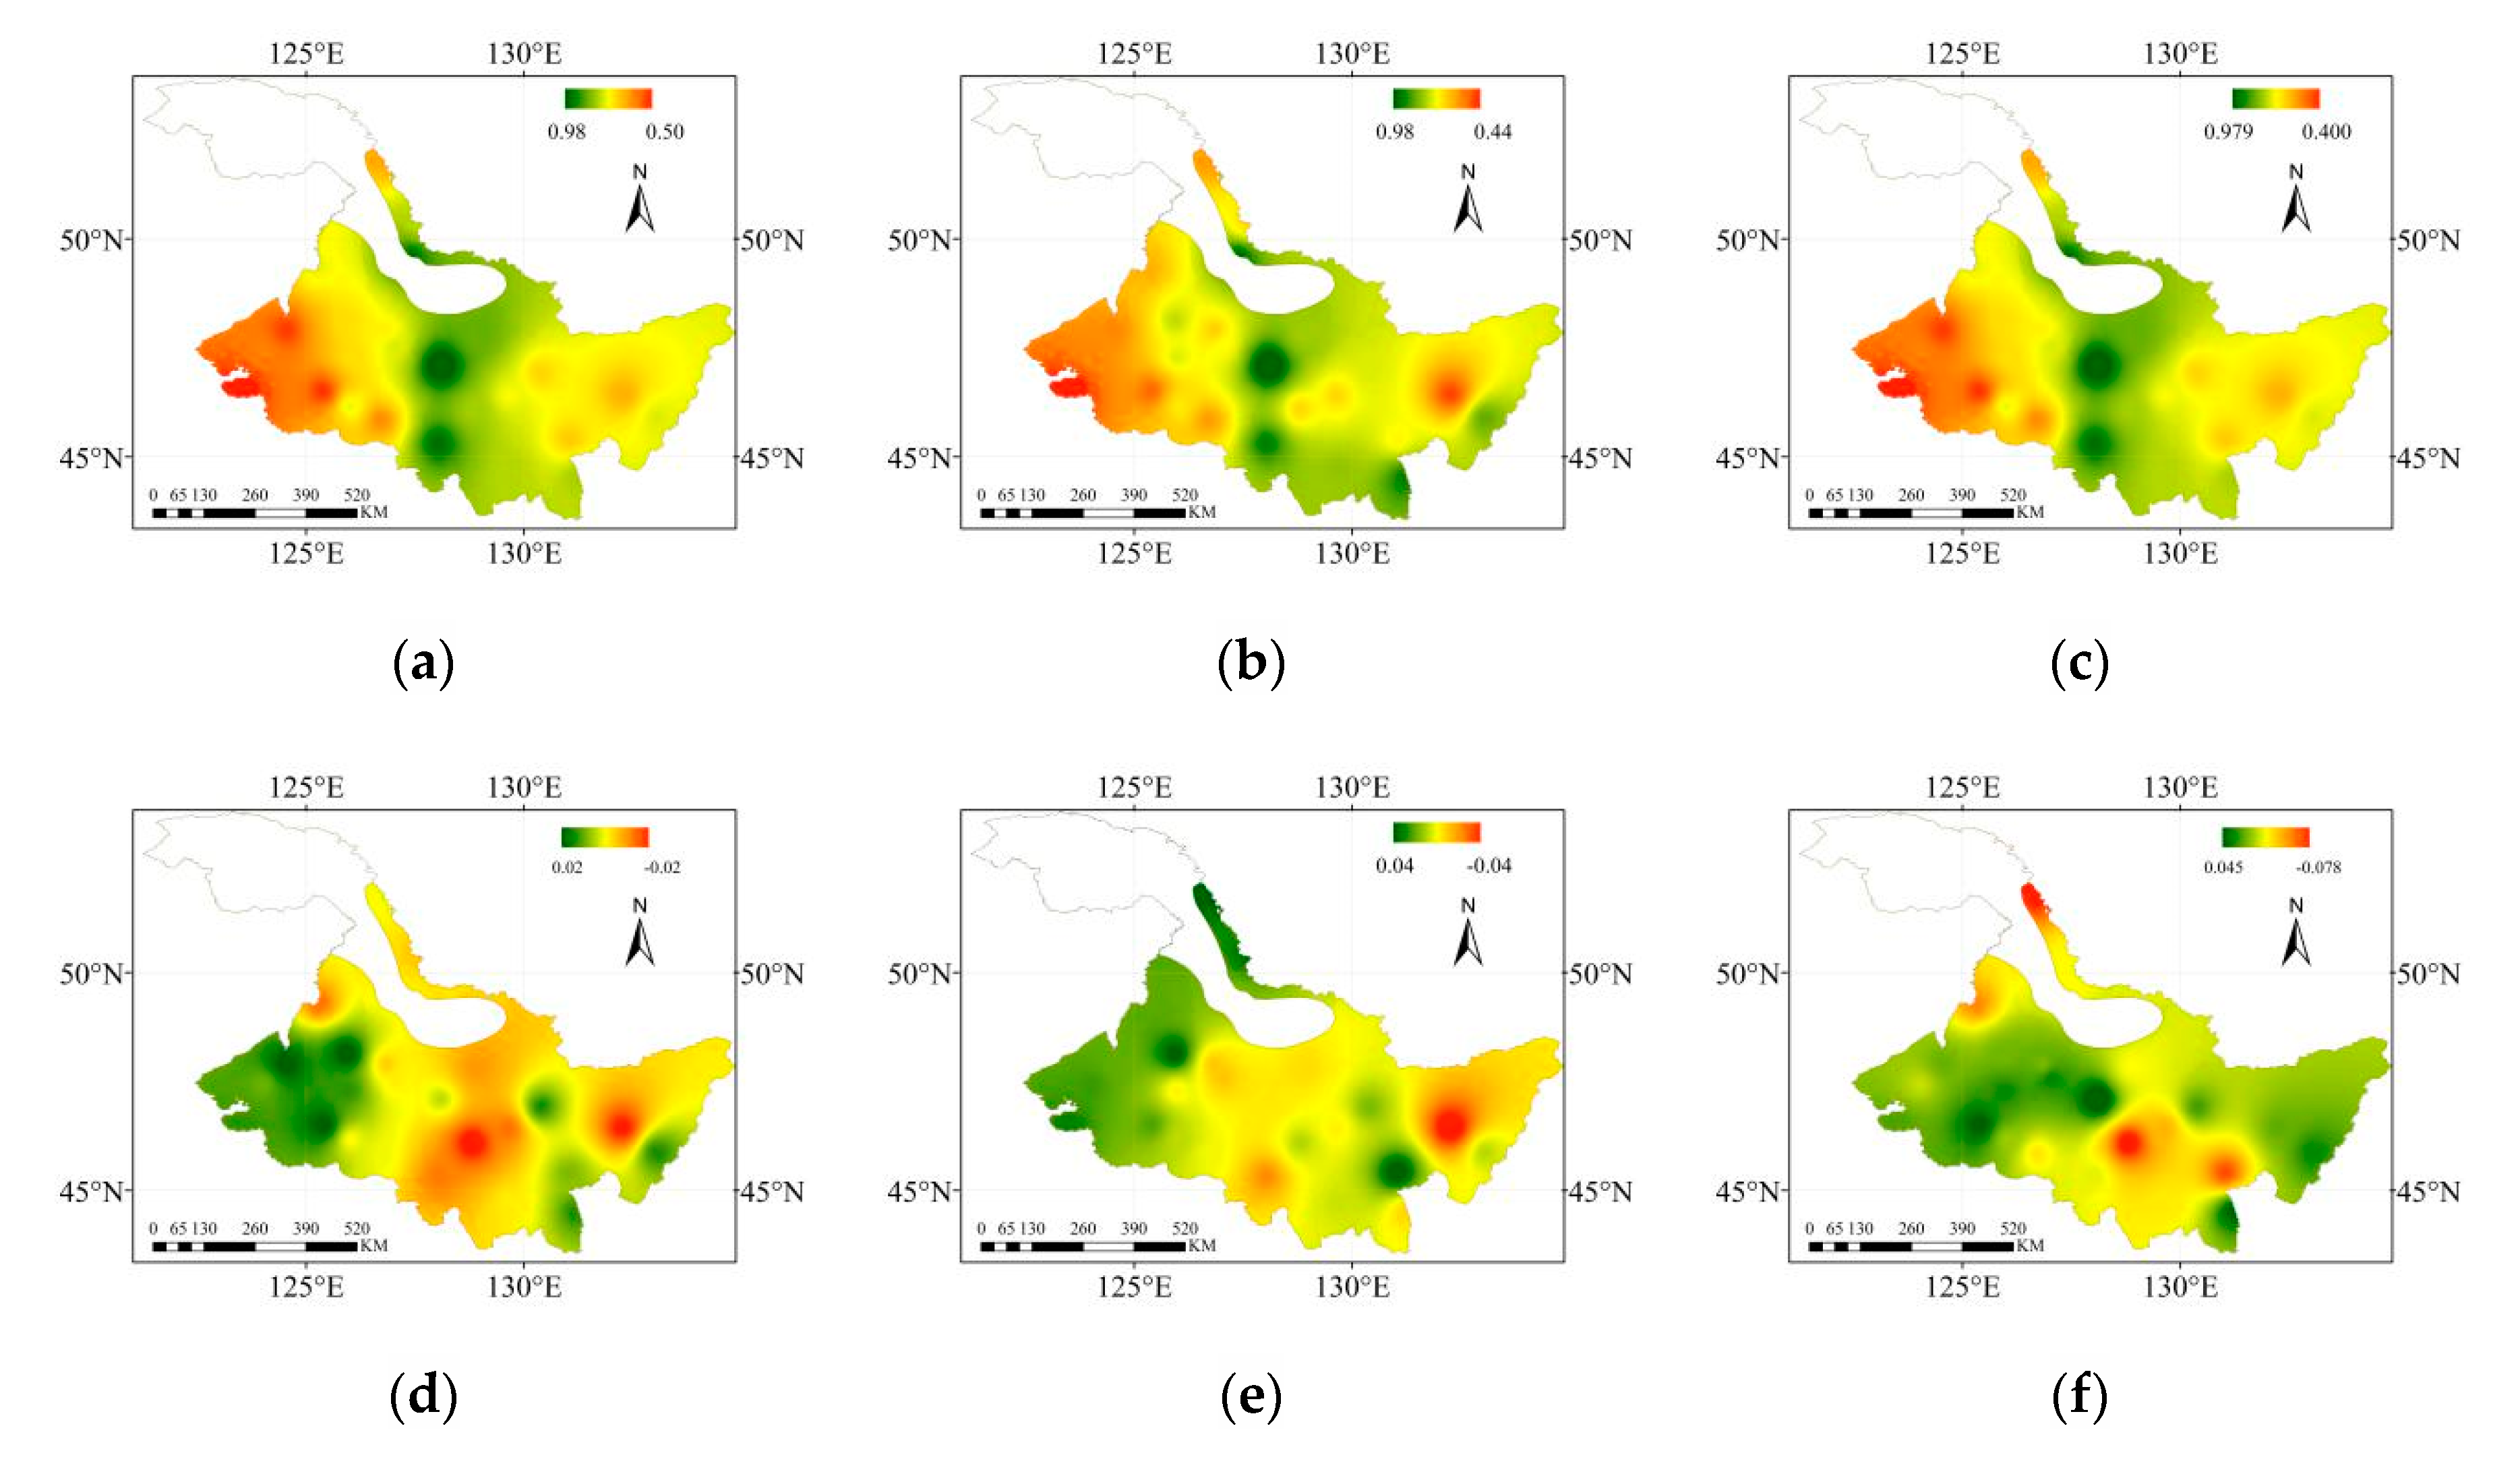
3.5. Spatial and Temporal Variation of Coupling Degree of ETc and Pe

The distribution of the coupling degree of ETc and Pe during the maize growth period in this study from 1960 to 2015 is shown in Figure 6. The coupling degree of ETc and Pe ranged from 0.40 to 1.00, with an average value of 0.71, and first increased and then decreased from west to east. The high-value areas with an average coupling degree of ETc and Pe greater than 0.85 were Yichun, Tieli, and Sunwu in the north, and the low-value areas below 0.5 were Anda, Tailai, and Fuyu in the west. The climate tendency rate of the coupling degree of ETc and Pe in the growth period was between −0.024 and 0.025/(10a); the average was 0.0028/(10a), and it showed an increasing trend. There were 15 stations in which the climate tendency rate was negative. Tonghe, Baoqing, and Fujin in the east showed a declining trend, and the decreasing trend of Tonghe was statistically significant at the level of p < 0.01 from 1980 to 2015.
Comparing the coupling degree during two stages and the whole research period, we found that, although the coupling degree decreased the most from 1980 to 2015, the increasing coupling degree during 1960 to 1999 drove the overall increasing tendency of the coupling degree of ETc and Pe during 1960 to 2015.

3.6. Climate Change Impact on Water Requirement Relationship

The meteorological factors were tested by the Mann–Kendall trend test in the study area from May to September during the maize growing seasons of 1960–2015. The average max and min temperature were increased, and average humidity, average wind speed, and average sunshine hours were decreased, with climate tendency rates of 0.43, 0.20, −0.23, −0.18, and 3.10 mm/(10a), respectively (Table 1). Average values and climate tendency rates of ET0, ETc, Pe, CWSDI, and coupling degree of ETc and Pe during the maize growing seasons of 1960–2015 in the study area are shown in Table 2 and Table 3. The different impacts of climate factors on the water requirement of maize and the relationship between Pe and ETc in this study region are shown in Figure 7. ET0 was reduced by the combined action of wind speed, humidity, sunshine hours, and temperature during the maize growing period, which caused ETc to decrease. The coupling degree of ETc and Pe, and CWSDI were increased by the combined action with ETc reduced and Pe increased.

4. Discussion

This paper aims to estimate the relationship between maize ET0, ETc, and Pe, and the impact of climate change on the water requirement of maize from 1960 to 2015 in Heilongjiang Province. The results showed that climate change during the recent 55-year timespan caused a decrease of ET0 in maize growing periods. The increase in the highest and lowest temperatures did not cause an increase in ET0. The decrease in ET0 may be due to the decrease in wind speed and sunshine. In a previous study, Adrian Piticar et al. found that ET0 experienced positive trends in the Republic of Moldova from 1981 to 2012 [25]. In Adrian Piticar’s study, the maximum and minimum air temperatures showed increasing trends, and wind speed and relative humidity showed decreasing trends, results that were the same as those of the current study. In his study, the sunshine duration increased in all the analyzed locations, in contrast to the current study, in which they decreased. Wu Xia et al. found that the decrease of ET0 in China from 1961 to 2015 was due to the combined action of the decrease of wind speed, sunshine, and vapor pressure. Comparing these studies, we found wind speed and sunshine hours influenced the ET0 change, which explained the different tendency change of ET0 between this study and that of Adrian Piticar [2]. Therefore, the impact of various climatic factors should be considered comprehensively when discussing ET0. Only considering the effect of temperature rise on ET0 will result in a large deviation between the estimated values and the true value [43]. The decrease in sunshine hours in this study may be due to an increase in cloud cover or aerosols, resulting in radiation change [44]. The cloud temperature was not decreased by the negative trend of the radiation. On the other hand, the greenhouse gas effects of clouds and aerosols are more conducive to capturing heat, reducing solar radiation, and increasing air temperature, resulting in a decrease in crop evapotranspiration.
Wang et al. [45] pointed out in his paper that under the condition of sufficient irrigation in Zhaozhou county, the maize ETc was 381.0 mm in 2014. In this study, the calculated maize ETc was 375.1 mm in the same region in 2014, which was 1.5% less than his results. Li et al. [46] measured the maize ETc by Lysimeter as 370 mm in Haerbin in 2014, this paper calculated that maize ETc in Haerbin in 2014 was 392.3 mm, which was 6% larger than the experimental result. According to a study of a contour map of water demand of the main crops in China, the average ETc in 17 stations of Heilongjiang Province from 1961 to 1980 was 427 mm and the average water shortage was 103 mm [47]. The average value of maize ETc in this study was 393.33 mm from 1961 to 1980, 7.88% lower than the value of the previous study [42]. The range of ETc in Heilongjiang Province was 294.82 to 482.74 mm from 1961 to 2015. This is mainly because the Kc value for each station during the whole growth period in the previous study was 0.8. The crop type, climate data, soil evaporation, and growth determined the Kc value. In the current study, Kc was divided and corrected according to different growth stages of maize and different regions, which increased the accuracy of the calculation. Previous research (Gao et al.) found that the climate tendency of maize ETc in Northeast China (Heilongjiang, Jilin, and Liaoning Provinces) from 1961 to 2010 was 1.2 mm/(10a) and Pe showed a downward trend [42]. In the current study, the climate tendency of maize ETc was −2.27 mm/(10a) and the climate tendency of Pe in Heilongjiang Province was −2.04 mm/(10a). The length of the growth period also affects ETc. ETc requires more water during dry years than in rainy years. This is consistent with FAO-56, which notes that crops need more water in dry seasons than in rainy seasons during growth periods [28]. The current study showed the same phenomenon. Regions with the greater water deficits, such as Tailai and Anda, had the lowest CWSDI (−55% and −48% for these two regions, respectively) and higher ETc (458.51 and 434.80 mm, respectively). Regions in which the climate tendency of CWSDI showed a decreasing trend also showed a decreasing tendency of ETc. The current results were similar; it was found that the tendency of Pe and maize ETc during the growth period in Heilongjiang Province showed the same trend as in Northeast China. The decrease of ETc in Heilongjiang Province was faster than that in Northeast China, and the decrease of Pe in this study was slower than that in Northeast China in general.
Previous results show that the increase of temperature in recent years has led to an advance in the sowing date of maize, an increase in the total accumulated temperature of the maize growing season, an extension of the growing period, and a shift in the planting boundary to the north and expansion to the east. To realize the effective utilization of heat resources and improve yield, many new cultivars have emerged, cultivation measures have changed, and early cultivars have been gradually replaced by middle–late cultivars [48,49]. These problems extend the growth period length and increase the maize leaf number, leading to an increase of ETc increases. In this study, the sowing time and duration of each growth stage of maize were controlled by CROPWAT, which reduces the differences of maize plant characteristics caused by different cultivars in different regions, and reduces the influence of variety differences on water requirement distribution. Therefore, the rate of ETc decrease was not faster than this study, as the CWSDI decreased in the western region of Heilongjiang Province, and more irrigation water was needed in these regions. The analysis of ETc, CWSDI, Pe, and the coupling degree of ETc and Pe showed that the situation of maize irrigation water requirement was still severe. Water-saving irrigation measures should be given attention. Agricultural water-saving measures, such as lower irrigation or sprinkling irrigation, and drip irrigation under mulch, are beneficial to improve water use efficiency and ensure large yields in areas of water shortage. In future research, the relationship between irrigation water requirement, ETc, and ET0 will be examined.

5. Conclusions

During the past 55 years, wind speed, humidity, and sunshine hours have decreased, and the temperature has increased. These factors impact ET0, ETc, and Pe. Results of the current study show that reference crop evapotranspiration (ET0) decreased, with a declining trend of 3.29 mm/(10a) in Heilongjiang Province. ETc also showed a decreasing trend of 2.37 mm/(10a). The results showed that Pe was reduced, with a climate tendency rate of −5.42 mm/(10a). Moreover, CWSDI and coupling degree of ETc and Pe was increased, with climate tendency rates of 0.0888 and 0.0028/(10a), respectively. Climate change was found to have had a negative impact on the water security of Heilongjiang Province, especially for the western region, as shown by strong ETc and low precipitation. In future research, we will focus on relieving these negative influences and continue to focus on the irrigation water requirement in Heilongjiang Province, with the aim of producing an irrigation schedule and offering advice for local food security.

Author Contributions

T.N. collected the data; T.W. and T.N. analyzed the data; T.W. wrote the paper; C.D. (Chong Du), C.F. and T.W. drew the figures for this paper; Z.S., S.Z., L.C., C.D. (Changlei Dai), Y.L. and Q.L. reviewed and edited the paper. All authors have read and agreed to the published version of the manuscript.

Funding

This work was fund by Basic Scientific Research Fund of Heilongjiang Provincial Universities, grant number RCCXYJ201912&2018-KYYWF-1570, National Natural Science Foundation Project of China, grant number 51779046.

Acknowledgments

We thank the Chinese meteorological data sharing service (http://data.cma.cn) for providing the meteorological data. We thank the anonymous reviewers and the editor for their suggestions, which substantially improved the manuscript.

Conflicts of Interest

The authors declare no conflict of interest.

References

  1. Wheeler, T.; Von Braun, J. Climate Change Impacts on Global Food Security. Science 2013, 341, 508–513. [Google Scholar] [CrossRef] [PubMed]
  2. Intergovernmental Panel on Climate Change (IPCC). Climate Change 2013: The Physical Basis. Contribution of Working Group I to the Fifth Assessment Report of the Intergovernmental Panel on Climate Change; Cambridge University Press: Cambridge, UK, 2013. [Google Scholar]
  3. Denman, K.; Brasseur, G. The physical science basis contribution of working group I to the fourth assessment report of the intergovernmental panel on climate change. Discret. Comput. Geom. 2007, 18, 95–123. [Google Scholar]
  4. Goyal, R.K. Sensitivity of evapotranspiration to global warming: A case study of arid zone of rajasthan (India). Agric. Water Manag. 2004, 69, 1–11. [Google Scholar] [CrossRef]
  5. Doucett, R.R.; Marks, J.C.; Blinn, D.W.; Caron, M.; Hungate, B.A. Recent decline in the global land evapotranspiration trend due to limited moisture supply. Nature 2010, 467, 951–954. [Google Scholar]
  6. Hao, Z.; Jian, S.; Junnan, X. Spatial-temporal patterns and controls of evapotranspiration across the tibetan plateau (2000–2012). Adv. Meteorol. 2017, 7082606. [Google Scholar] [CrossRef] [Green Version]
  7. Tubiello, F.N.; Fischer, G. Reducing climate change impacts on agriculture: Global and regional effects of mitigation, 2000–2080. Technol. Forecast. Soc. Chang. 2007, 74, 1030–1056. [Google Scholar] [CrossRef]
  8. Chen, Y.; Xue, Y.; Hu, Y. How multiple factors control evapotranspiration in North America evergreen needleleaf forests. Sci. Total Environ. 2018, 622–623, 1217–1224. [Google Scholar] [CrossRef]
  9. Ti, J.; Yang, Y.; Yin, X.; Liang, J.; Pu, L.; Jiang, Y.; Wen, X.; Chen, F. Spatio-temporal analysis of meteorological elements in the north china district of china during 1960–2015. Water 2008, 10, 789. [Google Scholar]
  10. Frere, M.; Popov, G.F. Agrometeorological Crop Monitoring and Forecasting; FAO: Rome, Italy, 1979. [Google Scholar]
  11. Tester, M.; Langridge, P. Breeding Technologies to Increase Crop Production in a Changing World. Science 2010, 327, 818–822. [Google Scholar] [CrossRef]
  12. Wu, X.; Wang, P.; Huo, Z.; Wu, D.; Yang, J. Crop Drought Identification Index for winter wheat based on evapotranspiration in the Huang-Huai-Hai Plain. Agric. Ecosyst. Environ. 2018, 263, 18–30. [Google Scholar] [CrossRef]
  13. FAO. OECD-FAO Agricultural Outlook; OECD Publishing, Food and Agriculture Organization of the United Nations: Rome, Italy, 2009; pp. 2011–2020. [Google Scholar]
  14. China Grain Production. Available online: http://www.stats.gov.cn/tjsj/ (accessed on 2 September 2020).
  15. Challinor, A.J.; Watson, J.; Lobell, D.B.; Howden, S.M.; Chhetri, N.B. A meta-analysis of crop yield under climate change and adaptation. Nature Climate Change. Nat. Clim. Chang. 2014, 4, 287–291. [Google Scholar] [CrossRef]
  16. Gabaldón-Leal, C.; Webber, H.; Otegui, M.E.; Slafer, G.A.; Ordóñez, R.A.; Gaiser, T.; Lorite, I.J.; Ruiz-Ramos, M.; Ewert, F. Modelling the impact of heat stress on maize yield formation. Field Crop. Res. 2016, 198, 226–237. [Google Scholar] [CrossRef]
  17. Liu, Z.; Yang, X.; Hubbard, K.G.; Lin, X. Maize potential yields and yield gaps in the changing climate of northeast china. Glob. Chang. Biol. 2012, 18, 3441–3454. [Google Scholar] [CrossRef]
  18. Zhao, J.; Yang, X.; Liu, Z.; Pullens, J.W.M.; Sun, S. Greater maize yield improvements in low/unstable yield zones through recommended nutrient and water inputs in the main cropping regions, China. Agric. Water Manag. 2020, 232, 106018. [Google Scholar] [CrossRef]
  19. Zotarelli, L.; Dukes, M.D.; Romero, C.C.; Migliaccio, K.W.; Morgan, K.T. Step by Step Calculation of the Penman-Monteith Evapotranspiration (FAO-56 Method); Institute of Food and Agricultural Sciences, University of Florida: Gainesville, FL, USA, 2010; pp. 1–10. [Google Scholar]
  20. Peel, M.C.; Mcmahon, T.A. Estimating evaporation based on standard meteorological data—Progress since 2007. Prog. Phys. Geogr. 2014, 38, 241–250. [Google Scholar] [CrossRef]
  21. Wang, F.; Chen, Y.; Li, Z.; Fang, G.; Li, Y.; Xia, Z. Assessment of the Irrigation Water Requirement and Water Supply Risk in the Tarim River Basin, Northwest China. Sustainability 2019, 11, 4941. [Google Scholar] [CrossRef] [Green Version]
  22. Tian, F.; Yang, P.; Hu, H.; Dai, C. Partitioning of Cotton Field Evapotranspiration under Mulched Drip Irrigation Based on a Dual Crop Coefficient Model. Water 2016, 8, 72. [Google Scholar]
  23. Thevs, N.; Peng, H.; Rozi, A.; Zerbe, S.; Abdusalih, N. Water allocation and water consumption of irrigated agriculture and natural vegetation in the aksu-tarim river basin, xinjiang, china. J. Arid. Environ. 2015, 112, 87–97. [Google Scholar] [CrossRef]
  24. Uniyal, B.; Dietrich, J.; Vu, N.Q.; Jha, M.K.; Arumi, J.L. Simulation of regional irrigation requirement with SWAT in different agro-climatic zones driven by observed climate and two reanalysis datasets. Sci. Total Environ. 2018, 649, 846–865. [Google Scholar] [CrossRef]
  25. Piticar, A.; Mihaila, D.; Lazurca, L.G.; Bistricean, P.I.; Putuntica, A.; Briciu, A.E. Spatiotemporal distribution of reference evapotranspiration in the republic of moldova. Theor. Appl. Climatol. 2016, 124, 1133–1144. [Google Scholar] [CrossRef]
  26. Gong, L.; Xu, C.Y.; Chen, D.; Halldin, S.; Chen, Y.D. Sensitivity of the penman–monteith reference evapotranspiration to key climatic variables in the Changjiang (Yangtze river) basin. J. Contam. Hydrol. 2006, 329, 620–629. [Google Scholar] [CrossRef]
  27. Espadafor, M.; Lorite, I.J.; Gavilán, P.; Berengena, J. An analysis of the tendency of reference evapotranspiration estimates and other climate variables during the last 45 years in southern Spain. Agric. Water Manag. 2011, 98, 1045–1061. [Google Scholar] [CrossRef]
  28. Wang, R.; Zhang, J.; Wang, C.; Guo, E. Characteristic Analysis of Droughts and Waterlogging Events for Maize Based on a New Comprehensive Index through Coupling of Multisource Data in Midwestern Jilin Province China. Remote Sens. 2020, 12, 60. [Google Scholar] [CrossRef] [Green Version]
  29. Chandhok, S.; Williams, J.L.; Schwartzman, D. Anatomical analysis of recurrent conduction after circumferential ablation. J. Interv. Card. Electrophysiol. 2010, 29, 41–50. [Google Scholar] [CrossRef] [PubMed]
  30. Cohen, S.; Ianetz, A.; Stanhill, G. Evaporative climate changes at bet Dagan, Israel, 1964–1998. Agric. For. Meteorol. 2002, 111, 83–91. [Google Scholar] [CrossRef]
  31. Croitoru, A.E.; Piticar, A.; Dragota, C.S.; Burada, D.C. Recent changes in reference evapotranspiration in Romania. Glob. Planet. Chang. 2013, 111, 127–136. [Google Scholar] [CrossRef]
  32. Thomas, A. Spatial and temporal characteristics of potential evapotranspiration trends over china. Int. J. Climatol. 2000, 20, 381–396. [Google Scholar] [CrossRef]
  33. Xu, C.Y.; Gong, L.; Jiang, T.; Chen, D.; Singh, V.P. Analysis of spatial distribution and temporal trend of reference evapotranspiration and pan evaporation in Changjiang (Yangtze river) catchment. J. Contam. Hydrol. 2006, 327, 81–93. [Google Scholar] [CrossRef]
  34. Nie, T.; Zhang, Z.; Qi, Z.; Chen, P.; Sun, Z.; Liu, X. Characterizing Spatiotemporal Dynamics of CH4 Fluxes from Rice Paddies of Cold Region in Heilongjiang Province under Climate Change. Water 2019, 16, 692. [Google Scholar] [CrossRef] [Green Version]
  35. Wang, R.; Zhang, J.; Guo, E.; Li, D.; Ha, S.; Alu, S. Spatiotemporal characteristics of drought and waterlogging during maize growing season in midwestern Jilin province for recent 55 years. J. Nat. Disasters 2018, 27, 186–197. (In Chinese) [Google Scholar]
  36. Zhang, J.; Huang, J.; Mu, Q. Assessing the remotely sensed Drought Severity Index for agricultural drought monitoring and impact analysis in North China. Ecol. Indic. 2016, 63, 296–309. [Google Scholar] [CrossRef]
  37. China Meteorological Data Sharing Service System. Available online: https://data.cma.cn/ (accessed on 2 September 2020).
  38. Accumulated Temperature Zone of Crop Varieties in Heilongjiang Province. Available online: http://www.hljagri.gov.cn/ (accessed on 2 September 2020).
  39. Area Layout Planning of High-Quality and High-yield Main Food Crops in Heilongjiang Province in 2015. Available online: http://dszz.hljagri.gov.cn/tjxxw/jrtj/tzgg/201501/ (accessed on 2 September 2020).
  40. Moriondo, M.; Jones, G.V.; Bois, B.; Dibari, C.; Ferrise, R.; Trombi, G. Projected shifts of wine regions in response to climate change. Clim. Chang. 2013, 119, 825–839. [Google Scholar] [CrossRef]
  41. Smith, M. CROPWAT: Manual and Guidelines; FAO of UN: Rome, Italy, 1991. [Google Scholar]
  42. Gao, X.; Wang, C.; Zhang, J. Crop water requirement and temporal-spatial variation of drought and flood disaster during growth stages for maize in Northeast during past 50 years. Trans. CSAE 2012, 28, 101–109. (In Chinese) [Google Scholar]
  43. Bouraima, A.-K.; Zhang, W.H.; Wei, C.F. Irrigation water requirements of rice using Cropwat model in Northern Benin. Int. J. Agric. Biol. 2015, 8, 58–64. [Google Scholar]
  44. Stanhill, G.; Cohen, S. Global dimming: A review of the evidence for a widespread and significant reduction in global radiation with discussion of its probable causes and possible agricultural consequences. Agric. For. Meteorol. 2001, 107, 255–278. [Google Scholar] [CrossRef]
  45. Wang, D.; Zhang, Z.X.; Liang, Q.P.; Nie, T.Z. Experimental study on water and fertilizer coupling effect of maize spray irrigation in semi-arid area of Heilongjiang Province. Water Sav. Irrig. 2016, 6, 15–18. (In Chinese) [Google Scholar]
  46. Li, H.; Wang, Z.B.; Li, W.R. Effects of different soil properties on maize growth and water consumption in Northeast Cold Region. Water Sav. Irrig. 2015, 2, 5–8. (In Chinese) [Google Scholar]
  47. Collaboration Group on Isoline Map of Water Demand of Main Crops in China. Study on Isoline Map of Water Demand of Main Crops in China; Agricultural Science and Technology Press: Beijing, China, 1993. [Google Scholar]
  48. Shuo, L.; Yang, X.; Zhao, J. Effects of climate change and variety alternative on potential yield of spring maize in Northeast China. Trans. CSAE 2013, 29, 179–190. (In Chinese) [Google Scholar]
  49. Yuan, B.; Guo, J.P.; Ye, M.Z. Variety distribution pattern and climatic potential productivity of spring maize in Northeast China under climate change. Chin. Sci. Bull. 2012, 57, 3497–3508. (In Chinese) [Google Scholar] [CrossRef] [Green Version]
Figure 1. Study area and distribution of meteorological stations in Heilongjiang Province.
Water 12 02472 g001
Figure 2. Average annual reference crop evapotranspiration (ET0) during (a) 1960–1979, (b) 1980–1999, and (c) 2000–2015. Climate tendency rate of ET0 during (d) 1960–1999, (e) 1980–2015, and (f) 1960–2015.
Water 12 02472 g002
Figure 3. Average crop water requirement (ETc) during (a) 1960–1979, (b) 1980–1999, and (c) 2000–2015. Climate tendency rate of ETc during (d) 1960–1999, (e) 1980–2015, and (f) 1960–2015.
Water 12 02472 g003
Figure 4. Average effective precipitation (Pe) during (a) 1960–1979, (b) 1980–1999, and (c) 2000–2015. Climate tendency rate of Pe during (d) 1960–1999, (e) 1980–2015, and (f) 1960–2015.
Water 12 02472 g004
Figure 5. Average crop water surplus deficit index (CWSDI) during (a) 1960–1979, (b) 1980–1999, and (c) 2000–2015. Climate tendency rate of CWSDI during (d) 1960–1999, (e) 1980–2015, and (f) 1960–2015.
Water 12 02472 g005aWater 12 02472 g005b
Figure 6. Average coupling degree of ETc and Pe during (a) 1960–1979, (b) 1980–1999, and (c) 2000–2015. Climate tendency rate of coupling degree of ETc and Pe during (d) 1960–1999, (e) 1980–2015, and (f) 1960–2015.
Water 12 02472 g006
Figure 7. Consequences of climate change on water requirement relationships of maize during 1960–2015, arrows in the figure indicate the trend of each parameter, and a plus or minus sign indicates the promotion or inhibition of a parameter on the parameter to which it is connected.
Water 12 02472 g007
Table 1. Climatic tendency changes of each meteorological factor during the maize growing seasons of 1960–2015.
MonthClimate Tendency Change Rate
Average Max Temperature (°C·(10a)−1)Average Min Temperature (°C·(10a)−1)Average Humidity (%·(10a)−1)Average Wind Speed (m·s−1(10a)−1)Average Sunshine Hours (h·(10a)−1)
May0.58 ***0.130.55−0.28 ***−4.93
June0.63 ***0.30 **−0.37−0.16 ***−4.92
July0.35 ***0.10−0.12−0.15 ***−4.87
August0.29 ***0.20−0.37−0.13 ***−0.54
September0.28 **0.27 ***−0.84 *−0.18 ***−0.25
Annotations: *, **, and *** are significant at the levels of p < 0.05, p < 0.01, and p < 0.001, respectively.
Table 2. Average ET0, ETC, Pe, CWSDI, and coupling degree of ETc and Pe during the maize growing seasons of 1960–2015 in the study area.
PeriodsET0/mmETc/mmPe/mmCWSDICoupling Degree of ETc and Pe
1960–1979563.65393.33258.31−32.00%0.6723
1980–1999545.42376.09279.65−24.00%0.7512
2000–2015549.82379.73256.93−30.00%0.6943
Table 3. Climate tendency rate of ET0, ETC, Pe, CWSDI, and coupling degree of ETc and Pe during the maize growing seasons of 1960–2015 in the study area.
PeriodsET0/mm·(10a)−1ETc/mm·(10a)−1Pe/mm·(10a)−1CWSDI/(10a)−1Coupling Degree of ETc and Pe/(10a)−1
1960–1999−2.2430−1.85670.29720.13940.0086
1980–2015−4.1972−2.3724−5.4242−0.9620−0.0095
1960–2015−3.2891−2.5697−1.0010.08880.0028

