Article

Characterization of Surface Evidence of Groundwater Flow Systems in Continental Mexico

by
Alessia Kachadourian-Marras
1,
Margarita M. Alconada-Magliano
2,
José Joel Carrillo-Rivera
3,
Edgar Mendoza
1,*,
Felipe Herrerías-Azcue
1 and
Rodolfo Silva
1
1
Engineering Institute, National Autonomous University of Mexico, Mexico City 04510, Mexico
2
Faculty of Agricultural and Forestry Sciences, National University of La Plata, Buenos Aires 1900, Argentina
3
Geography Institute, National Autonomous University of Mexico, Mexico City 04510, Mexico
*
Author to whom correspondence should be addressed.
Water 2020, 12(9), 2459; https://doi.org/10.3390/w12092459
Submission received: 2 July 2020 / Revised: 27 August 2020 / Accepted: 28 August 2020 / Published: 2 September 2020
(This article belongs to the Special Issue Characterizing Groundwater - Surface Water Interaction Using GIS)

Abstract

:
The dynamics of the underground part of the water cycle greatly influence the features and characteristics of the Earth’s surface. Using Tóth’s theory of groundwater flow systems, surface indicators in Mexico were analyzed to understand the systemic connection between groundwater and the geological framework, relief, soil, water bodies, vegetation, and climate. Recharge and discharge zones of regional groundwater flow systems were identified from evidence on the ground surface. A systematic hydrogeological analysis was made of regional surface indicators, published in official, freely accessible cartographic information at scales of 1:250,000 and 1:1,000,000. From this analysis, six maps of Mexico were generated, titled “Permanent water on the surface”, “Groundwater depth”, “Hydrogeological association of soils”, “Hydrogeological association of vegetation and land use”, “Hydrogeological association of topoforms”, and “Superficial evidence of the presence of groundwater flow systems”. Mexico’s hydrogeological features were produced. The results show that 30% of Mexico is considered to be discharge zones of groundwater flow systems (regional, intermediate, and recharge). Natural recharge processes occur naturally in 57% of the country. This work is the first holistic analysis of groundwater in Mexico carried out at a national–regional scale using only the official information available to the public. These results can be used as the basis for more detailed studies on groundwater and its interaction with the environment, as well as for the development of integrative planning tools to ensure the sustainability of ecosystems and satisfy human needs.

1. Introduction

The prevailing belief is that the water in the hydrological cycle exists in independent phases. Without a comprehensive understanding of its nature, water is simply described as changing in time, space, physical state, and physicochemical composition, without the understanding of its systemic and dynamic functioning. Of all freshwater, 1.2% is surface water (ground ice, permafrost, lakes, atmosphere, soil water, living organisms, swamps, marshes, rivers), 30.1% is under the Earth´s surface, in its underground part, and more than two-thirds is frozen in glaciers and ice caps. Of the nonfrozen part, 97% is in the underground part of the water cycle [1] and “present in the entire porous section of the Earth’s upper crust, possibly penetrating by cross formational communication to depths of 15–20 km” [2].
The idea of considering water as an integral whole was explained scientifically in Tóth’s theory of regional groundwater flow systems [2,3,4,5,6]. This theory forms the basis of modern hydrology worldwide and is still considered the only scientific theory that explains the environmental dynamics of water from and through the contribution of groundwater to ecosystems [7]. Tóth’s theory caused a major shift in hydrogeology and in basic hydraulics, from the traditional perception of “confined” or “artesian” aquifers to a modern understanding of “regionally unconfined cross-flow systems” [6].
The underground part of the water cycle begins at recharge zones, i.e., places of infiltration, from which it flows towards discharge zones, i.e., zones where water emerges to the surface [2]. The depth, length, and speed intensity of these flows are geologically determined, as its degree of interaction with the rocks; thus, the rock–water characteristics and topographic relief produce distinct flow systems (Figure 1). The mechanisms, processes, and effects of groundwater are manifest at the surface, with specific characteristics of each flow system. At least 50% of the fresh water in the sea comes via submarine groundwater discharge (SGD) [8]. The concept of fresh groundwater refers to local groundwater flows, as well as regional and intermediate flow order. Coastal ecosystems are highly dependent on fresh water [9], therefore, it is necessary to incorporate groundwater flow systems, which will show that the percentage of groundwater contribution to seawater is relevant [10].
Groundwater can permanently and simultaneously produce in situ interactions with the environment and can determine the organized spatial distribution of the products of that interaction (heat, solutes, particles of dissolved material, nutrients, etc.). Groundwater flow systems are now recognized as the most important general geological agent responsible for controlling a great number and variety of natural processes and phenomena [6].
In Tóth’s theory, natural effects induced by groundwater and modified by environmental conditions are identified [11]. Some of these effects and/or results can be seen on the surface, generally through the analysis of permanent surface water, soil type, vegetation, and geomorphology. These environmental elements are known as surface indicators of groundwater flow systems [5]. Most of the studies on groundwater focus on estimating its volume rather than understanding its environmental interactions, which in turn define water quantity and quality. This is because studies on groundwater are generally carried out using surface hydrological information or, when studying groundwater, its variations are generally associated with local changes, such as rainfall. In general, in México, studies of the dynamic functioning between environmental elements are not included.
Investigations into groundwater flow systems, as proposed by József Tóth [2,3,4,5,6], have been reported in several countries, e.g., Australia [12], Canada [13], China [14,15,16], Hungary [17,18], Japan [19]. In Mexico, local studies on the application of the groundwater flow systems have been carried out by Carrillo-Rivera et al. [20,21], Huizar-Álvarez et al. [22,23], Carrillo-Rivera et al. [24,25,26], Cardona et al. [27], and Ouysse et al. [28].
Preliminary analyses of regional surface indicators based on Tóth’s theory have been carried out for central Mexico by Peñuela-Arévalo and Carrillo-Rivera [29]. These works propose the determination of groundwater flow systems as a basic tool to support recommendations for adequate water and environmental management.
There is enough official and public geographical information concerning the presence of surface water, soil, vegetation, ecosystems, geomorphology, and climate distribution to generate scientific knowledge regarding the possible regional functioning of groundwater in Mexico. The objective of this study is to interpret the natural relations between geomorphology, soil, water, vegetation, and climate that exist in the environment, from a hydrogeological perspective, by applying Tóth’s theory. Using these relationships as indicators of groundwater discharge conditions, it should then be possible to describe elements related to recharge and throughflow zones. This study is expected to provide a basis for better understanding of groundwater flow systems in México and may lead to more detailed studies.

2. Materials and Methods

2.1. Site Description

México is located in the northern hemisphere, stretching from southern USA to Guatemala and Belize. It is home to almost 70% of the biodiversity of flora and fauna on Earth. The biodiversity that occurs in Mexico is due to its intricate geological framework, which results in complex physiography and varied climate distribution [30]. The biodiversity is a product of systemic natural balance, conditioned by the climate, geological context, water, soil, and vegetation of the environment [21]. About two-thirds of Mexico is characterized as arid or semiarid, with annual precipitation of less than 500 mm, while one-third of the country has annual precipitation of over 2000 mm. The rivers constitute 633,000 km and there are 100,000 km2 of wetlands [31].

2.2. Surface Indicators of Groundwater

As there are slight variations in the definitions of some of the indicators related to groundwater characterization, these terms are described here to assist in their understanding as related to the present investigation.

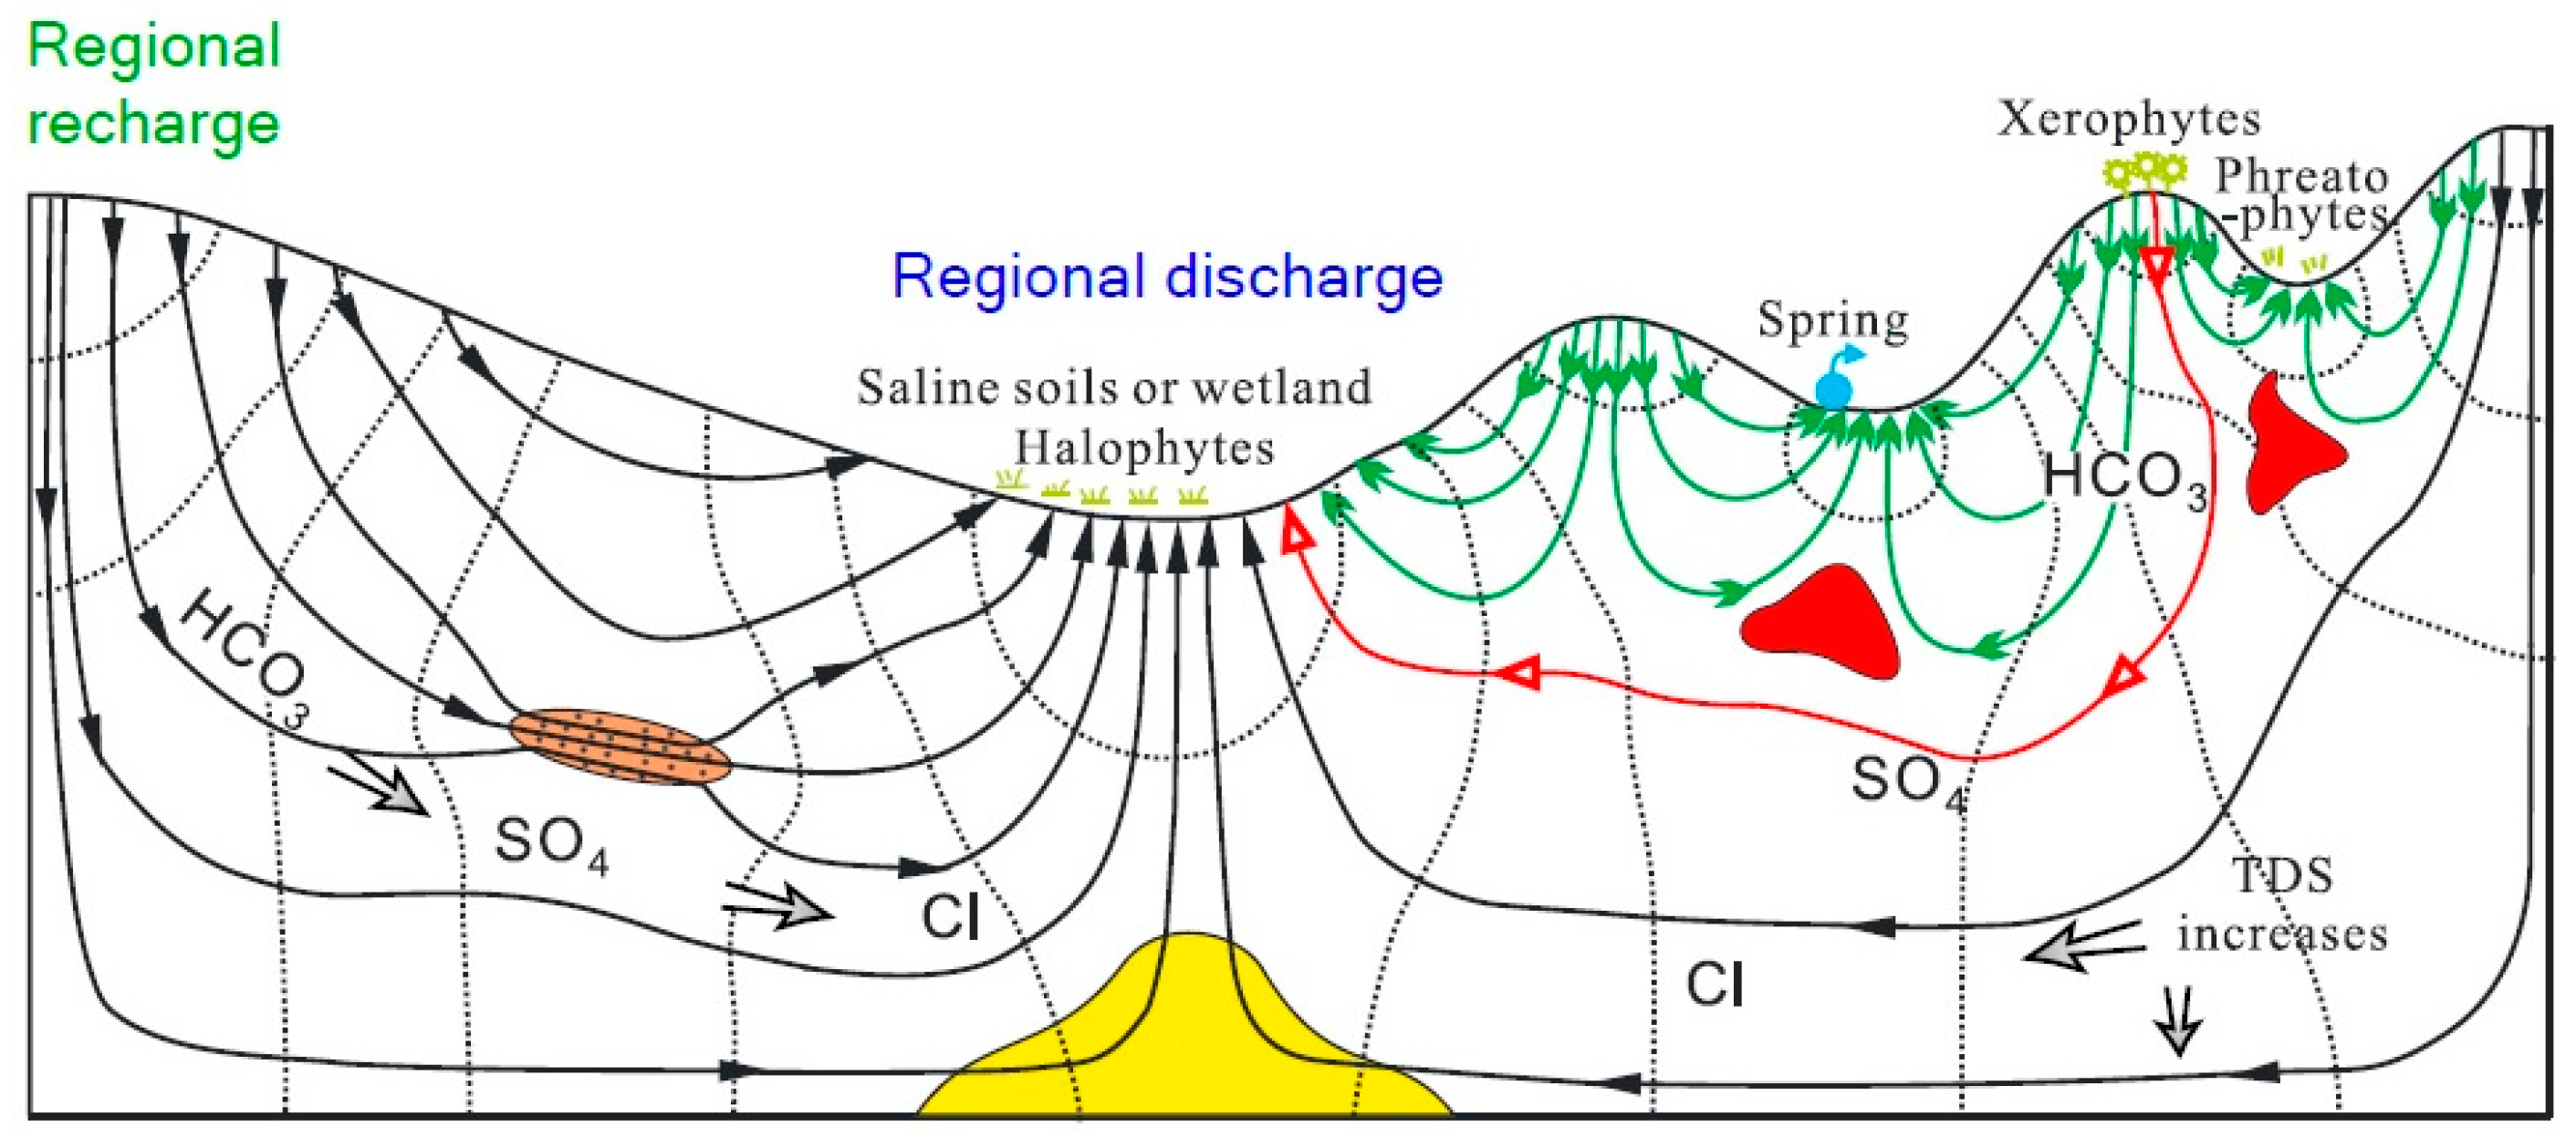
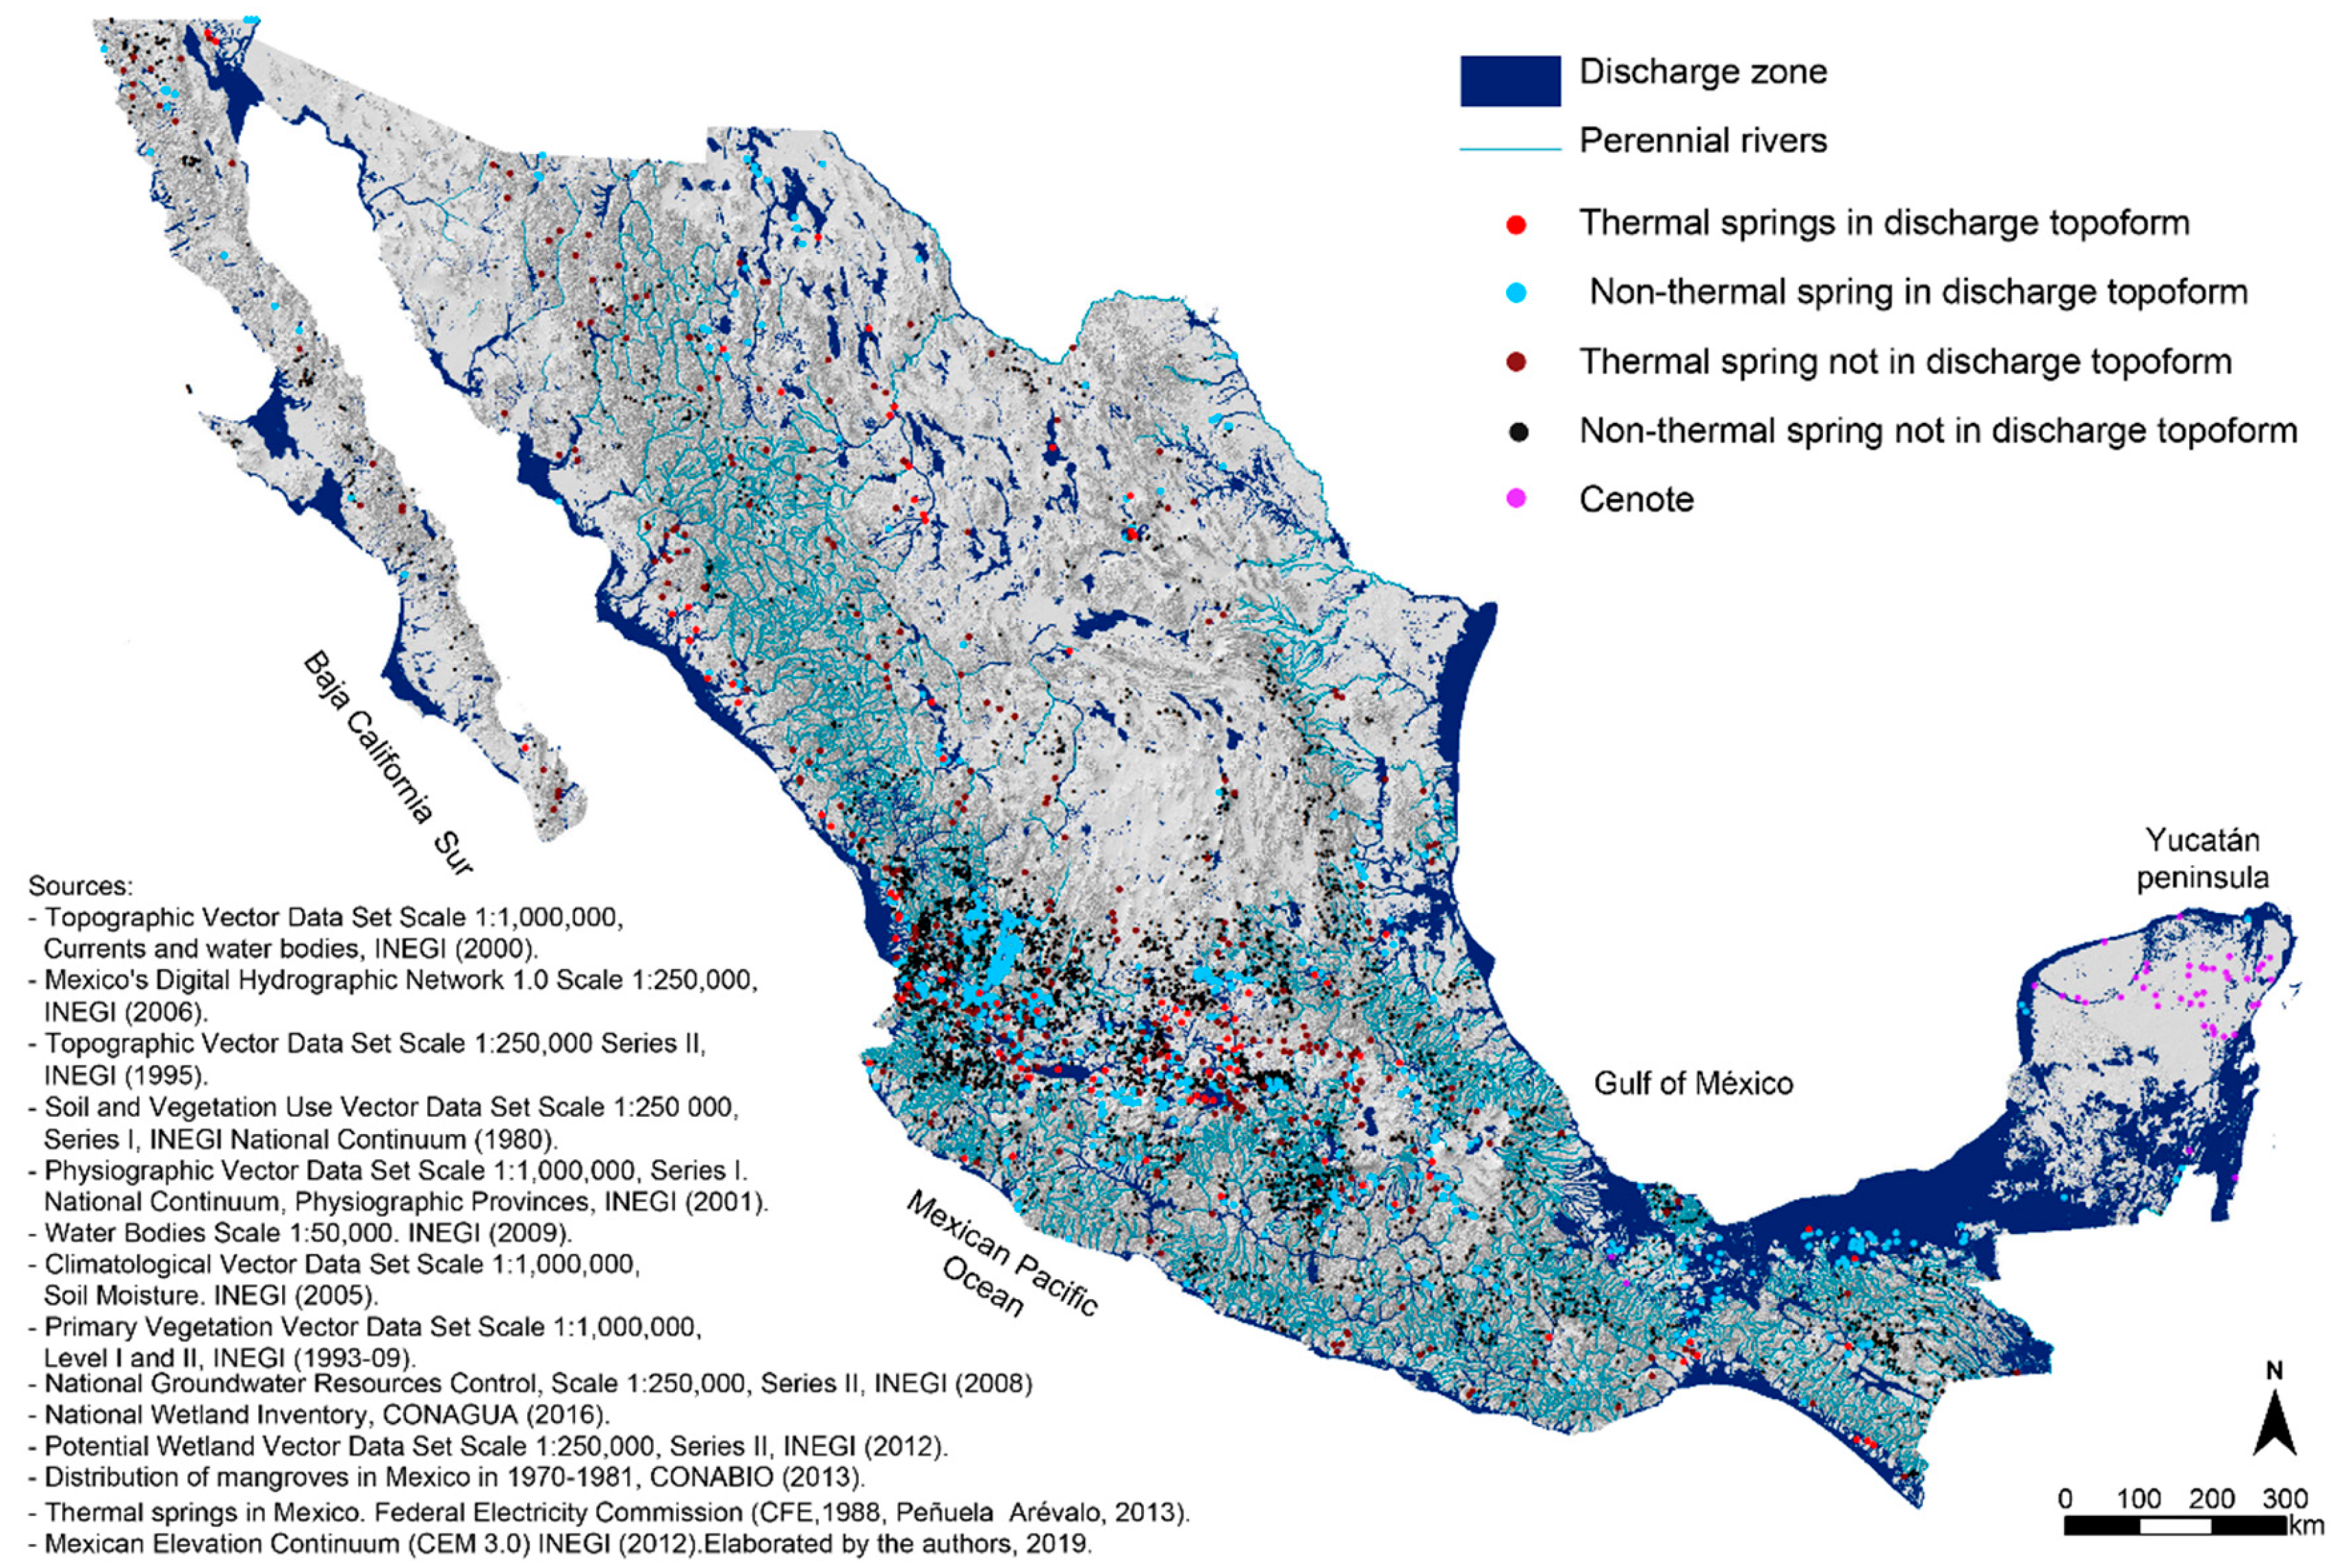
2.2.1. Groundwater and Perennial Surface Water

A surface water body is described as perennial when it is present throughout the year, regardless of seasonal rain or runoff water. The water that is present in low water periods is known as the baseflow. Baseflow is the proportion of stream discharge sustained by groundwater discharge [32]. A water flow that emerges directly from the ground is known as a spring and occurs where there is enough hydraulic conductivity in the rocks, the groundwater table, topoform, and soil intersect to allow this. No matter how small the spring is, perennial water bodies occur when the water flow is protected from evaporation and absorption by nearby plants. In discharge zones, processes of recharge and/or throughflow may also take place as superimposed flow systems, with their discharge occurring in other zones [4]. The principal feature indicating a discharge zone is the permanent presence of water, waterlogging, mud, and/or flooding, and a shallow static water level.

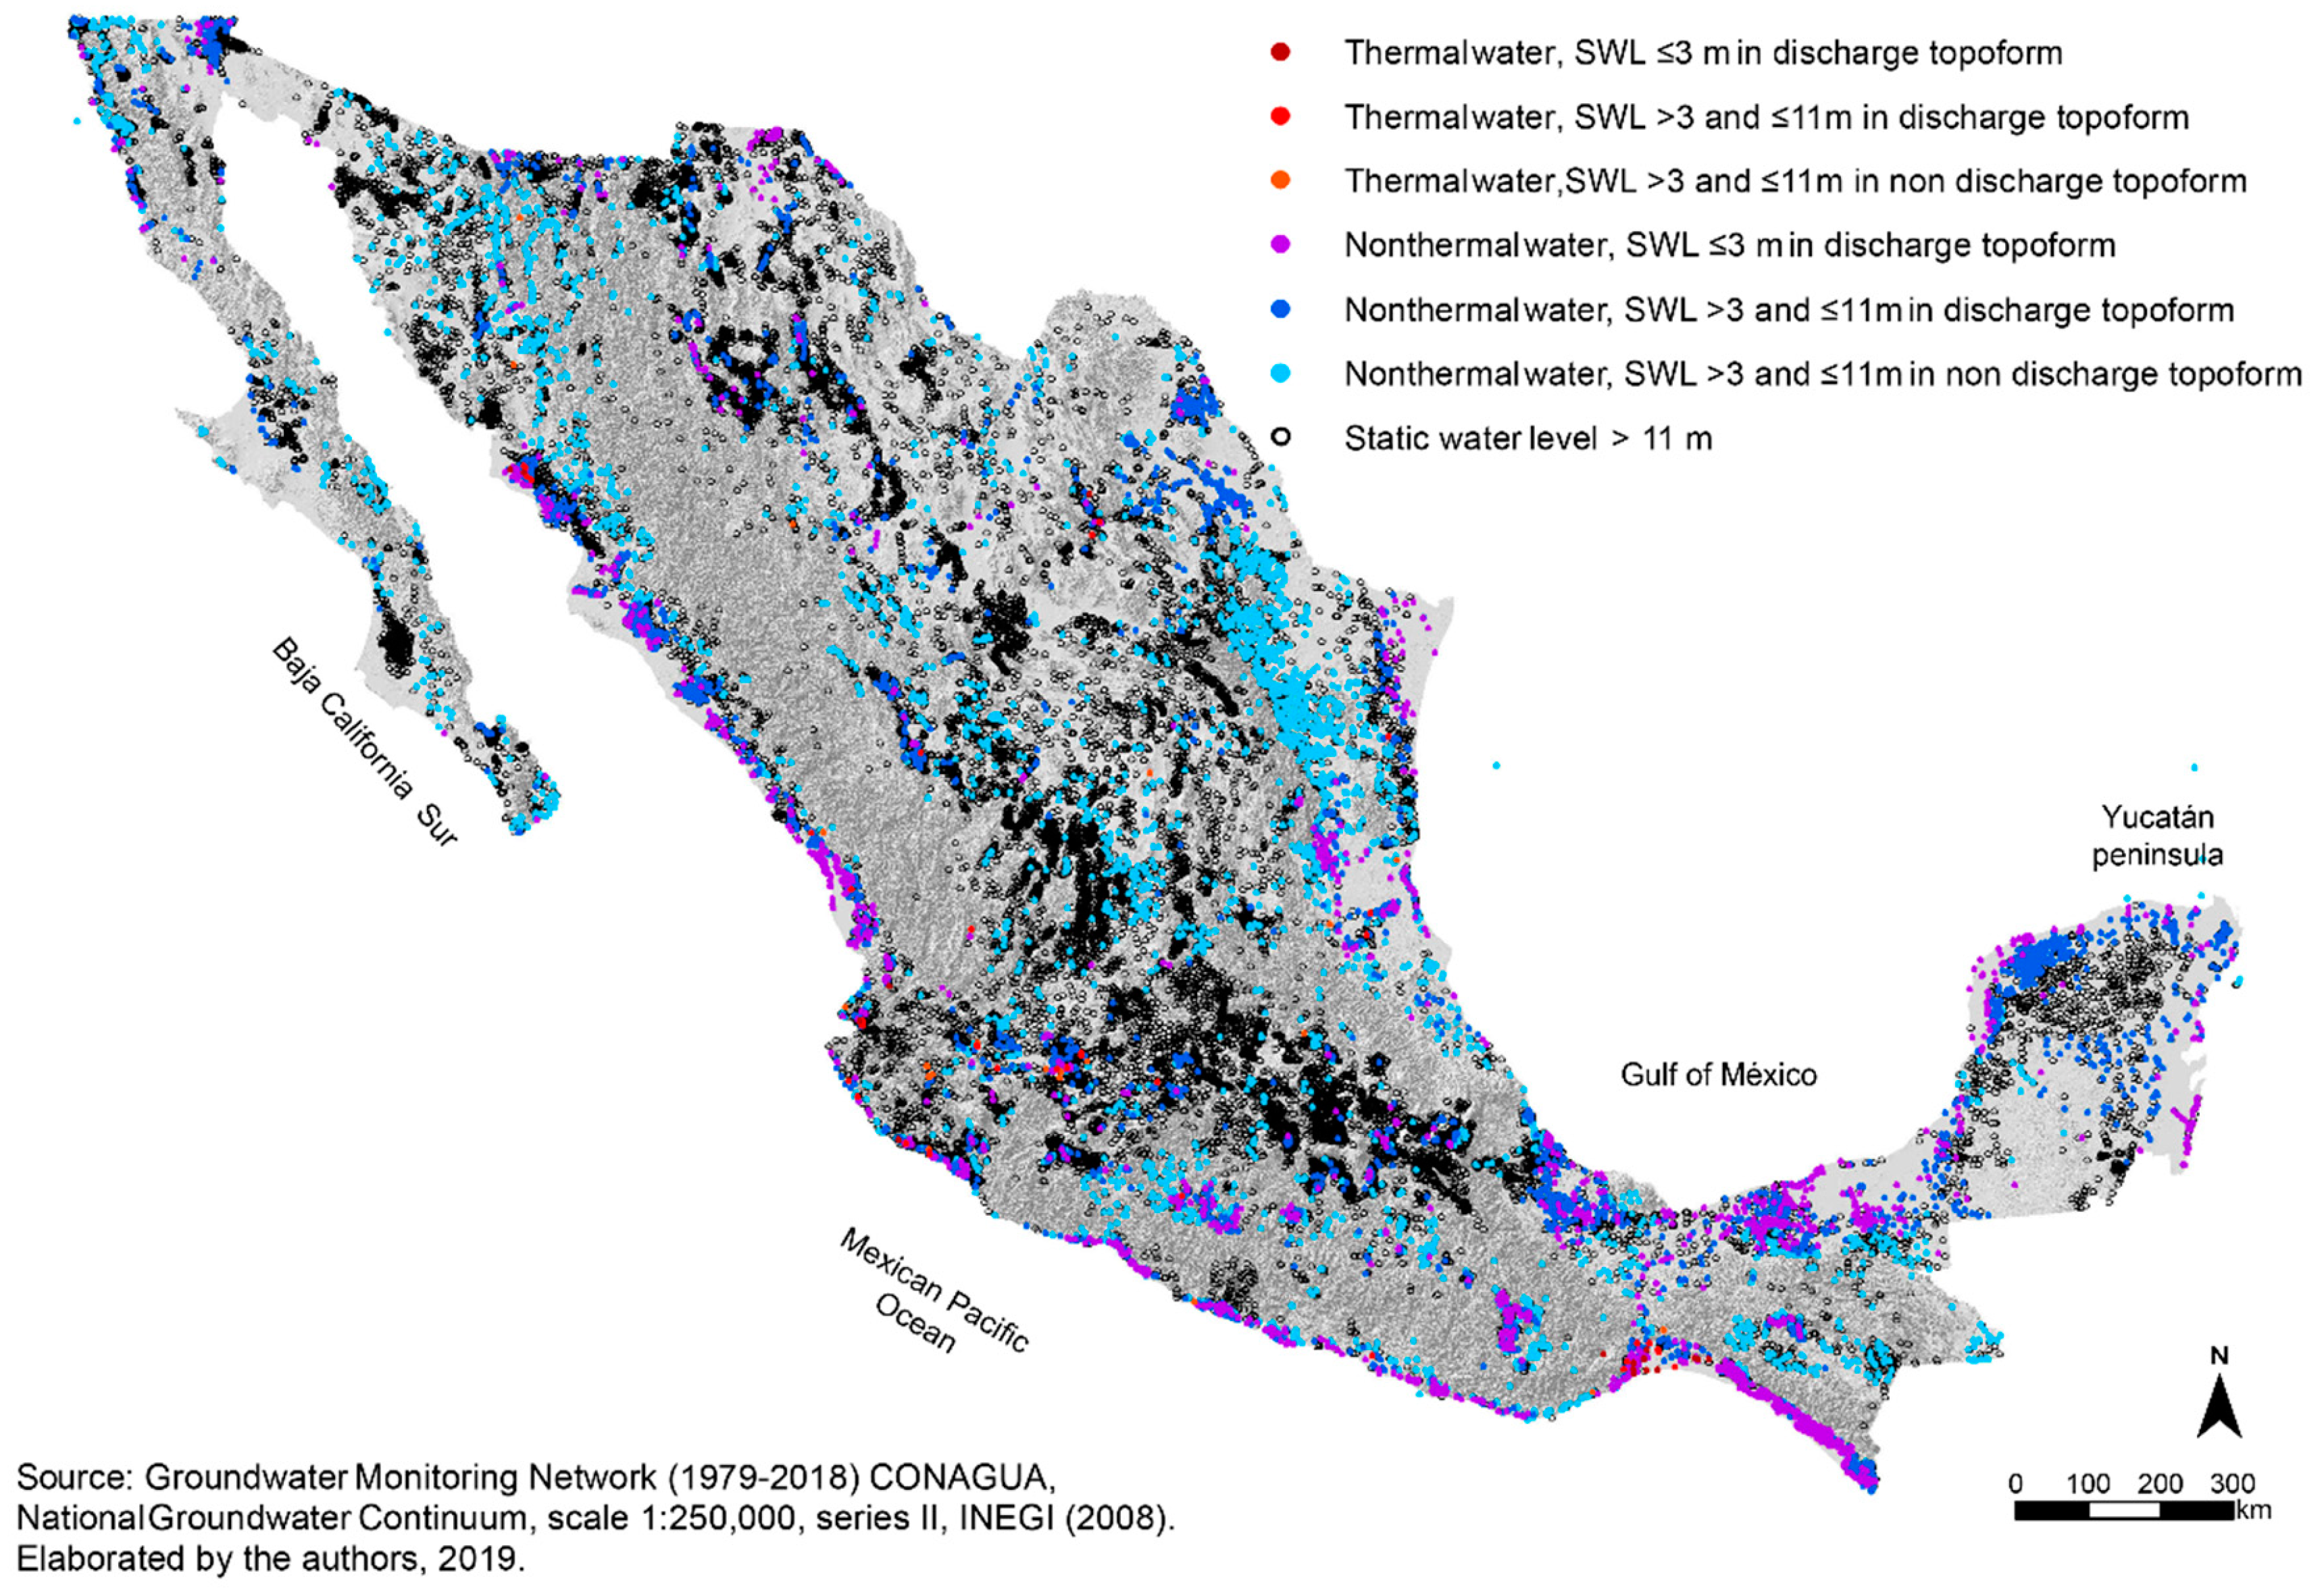
2.2.2. Groundwater Depth

The depth of the groundwater table is essential information for the identification of the groundwater flow system hydraulic regime. Although groundwater depth is a strong indicator, it should be analyzed along with the main hydraulic and hydrological characteristics, as well as other surface indicators [2]. In recharge zones, shallow groundwater depths are rare, while in discharge zones, groundwater is usually on or close to the surface [2].

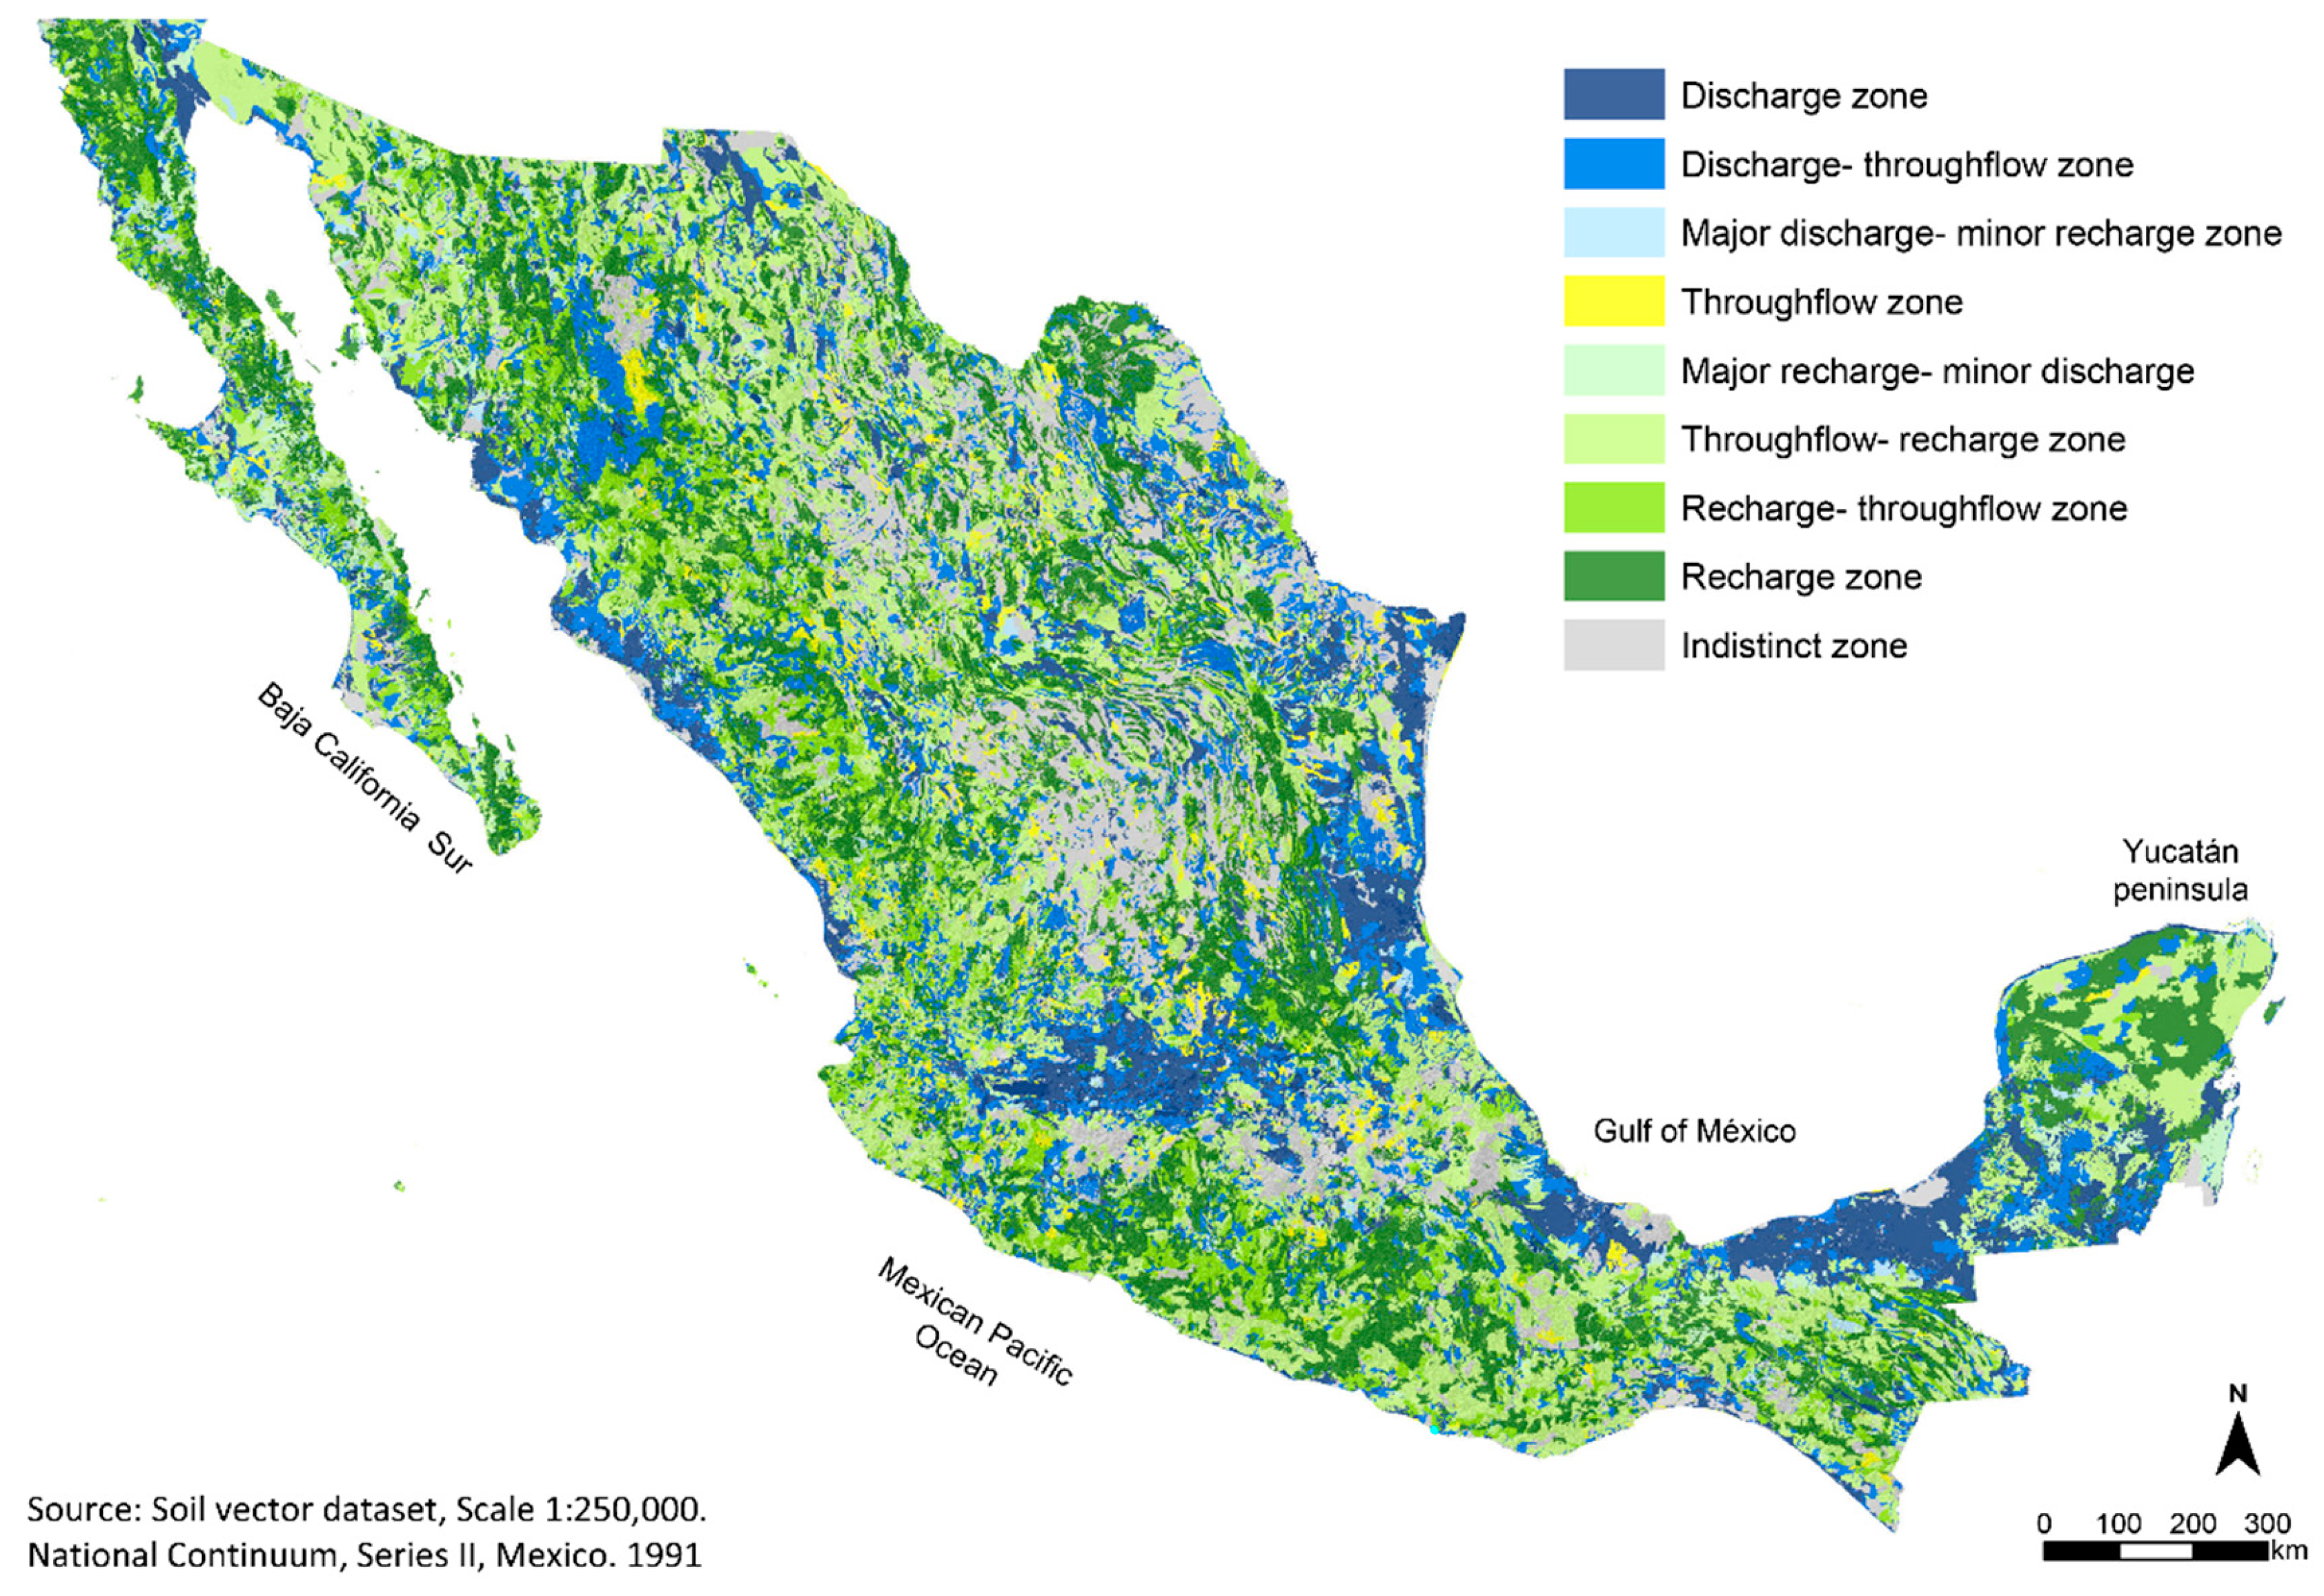
2.2.3. Groundwater and Soil

Soil is the surface layer of the Earth and defined as a natural body with distinctive, repeatable, and foreseeable properties [33] as a result of the combination and evolution of the soil-forming factors. These factors were defined by Jenny [34] as original material, relief, climate, time, and biota. International systems of edaphic classification, which generally refer to a maximum depth of 2 m below the surface, establish the morphological traits and analytical properties of the edaphic profile in a specific time and space [35]. Soil moisture and temperature regimes are considered and are generally associated with general climate conditions (temperature and precipitation). Likewise, to consider the water regime of the soil, the occurrence of hydromorphic features and the water table depth are analyzed. However, the physicochemistry of the groundwater and its functioning in the soil are not included. If these last aspects were considered, it would be possible to establish the behavior of the local soil in the regional context, and to define sustainable management [36,37]. In the present study, all soil formation agents are considered, as well as the way in which groundwater flows could affect its formation and development, based on Tóth’s theory [4,11], which considers soil as a component of local ecosystems, linked to groundwater flow systems [37,38,39,40]. The soil types described in the maps available were analyzed with reference soil groups and principal and supplementary qualifiers [41]. The aspects in the soil that define the relationship with groundwater are taxonomic classification, analytical (pH, salinity, alkalinity, organic matter, base saturation, presence of limestone, etc.), and morphological properties (texture, structure, color, consistency), with special emphasis on the presence or absence of hydromorphic features (redoximorphic, such as colors, spots, Fe and Mn concretions, and water table depth). These features indicate that Fe–Mn oxidation–reduction processes have existed and/or exist (when they are present), depending on the hydric state of the soil (aeration and anoxia).

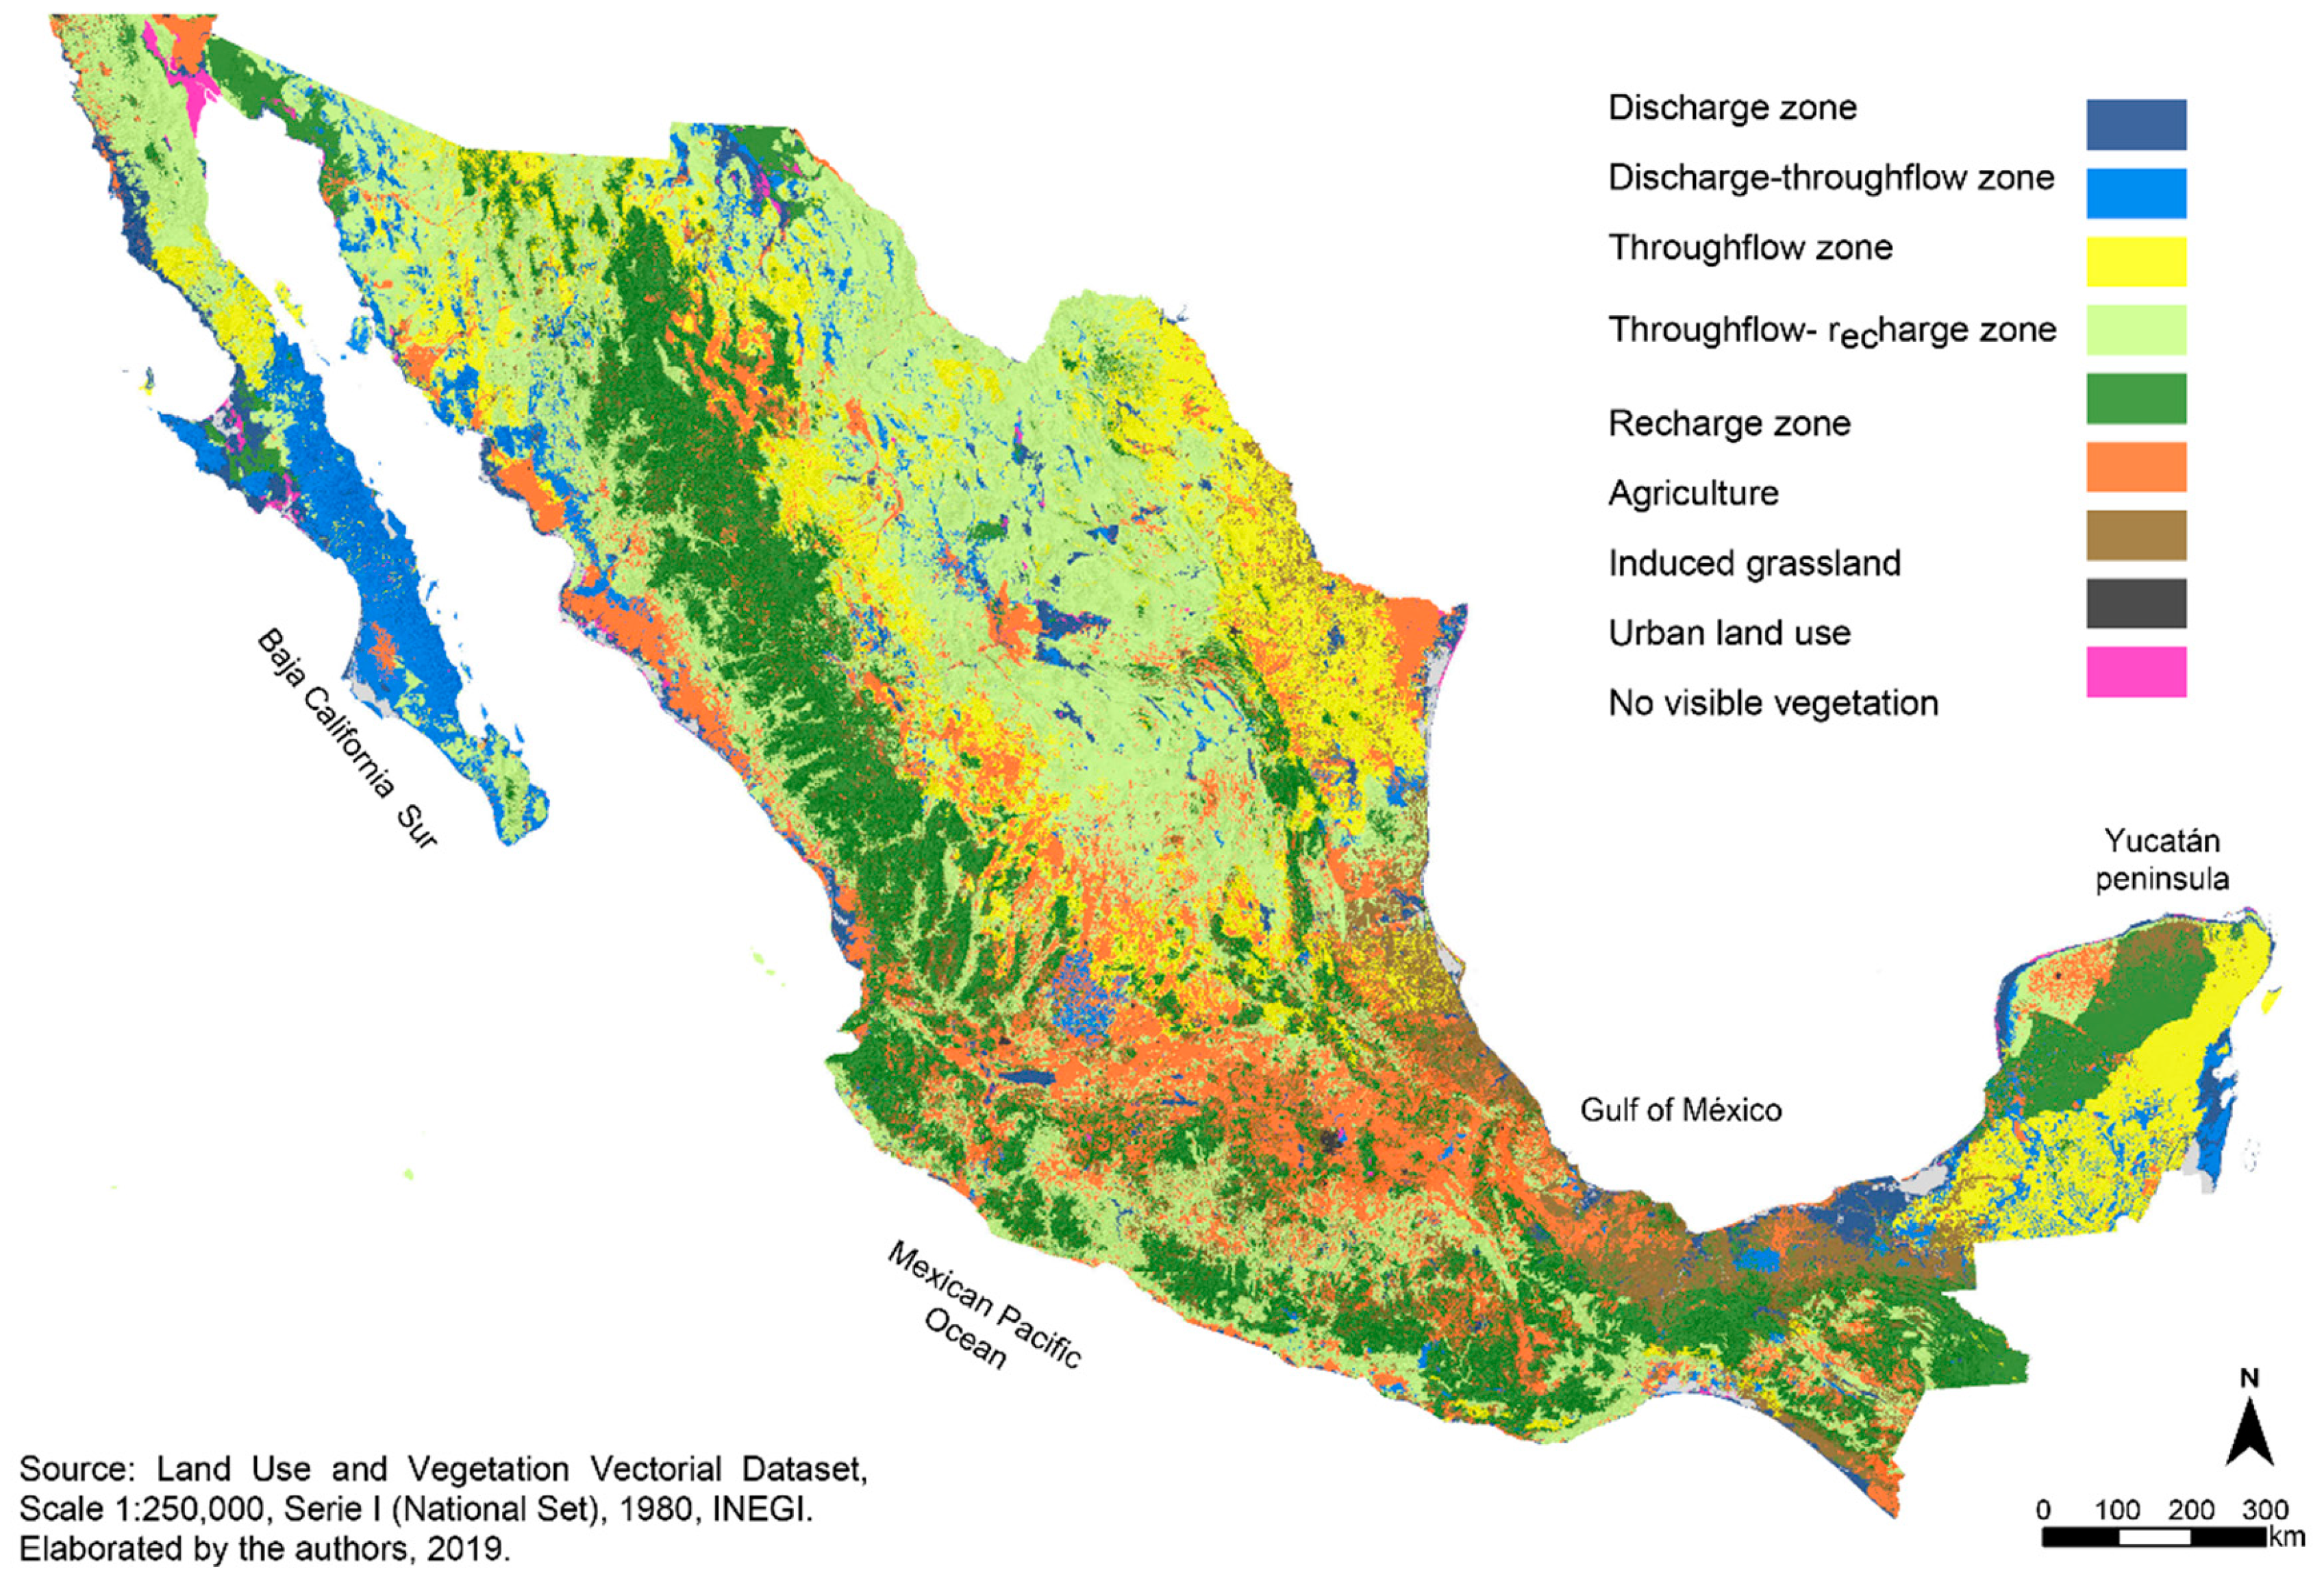
2.2.4. Groundwater and Vegetation

Worldwide, plants have been classified into xerophytes and phreatophytes. In between these two groups are plants that usually do not directly depend on groundwater, except under certain spatial and temporal conditions. Therefore, they do not easily fit into these classifications, since they only obtain groundwater under very specific conditions, or as a mixture of groundwater and rainwater [42,43,44]. Considering that local, intermediate, and regional flow systems can coexist at the same site, the vegetation can alternate their dependence on different types of groundwater flow (local, intermediate, or regional). Therefore, there is a temporal variation in the proportional dependence on groundwater in terms of volumetric proportion and quality. There are some types of vegetation, or dominant species, which belong to ecosystems that are directly dependent on groundwater, globally recognized as groundwater dependent ecosystems (GDEs).

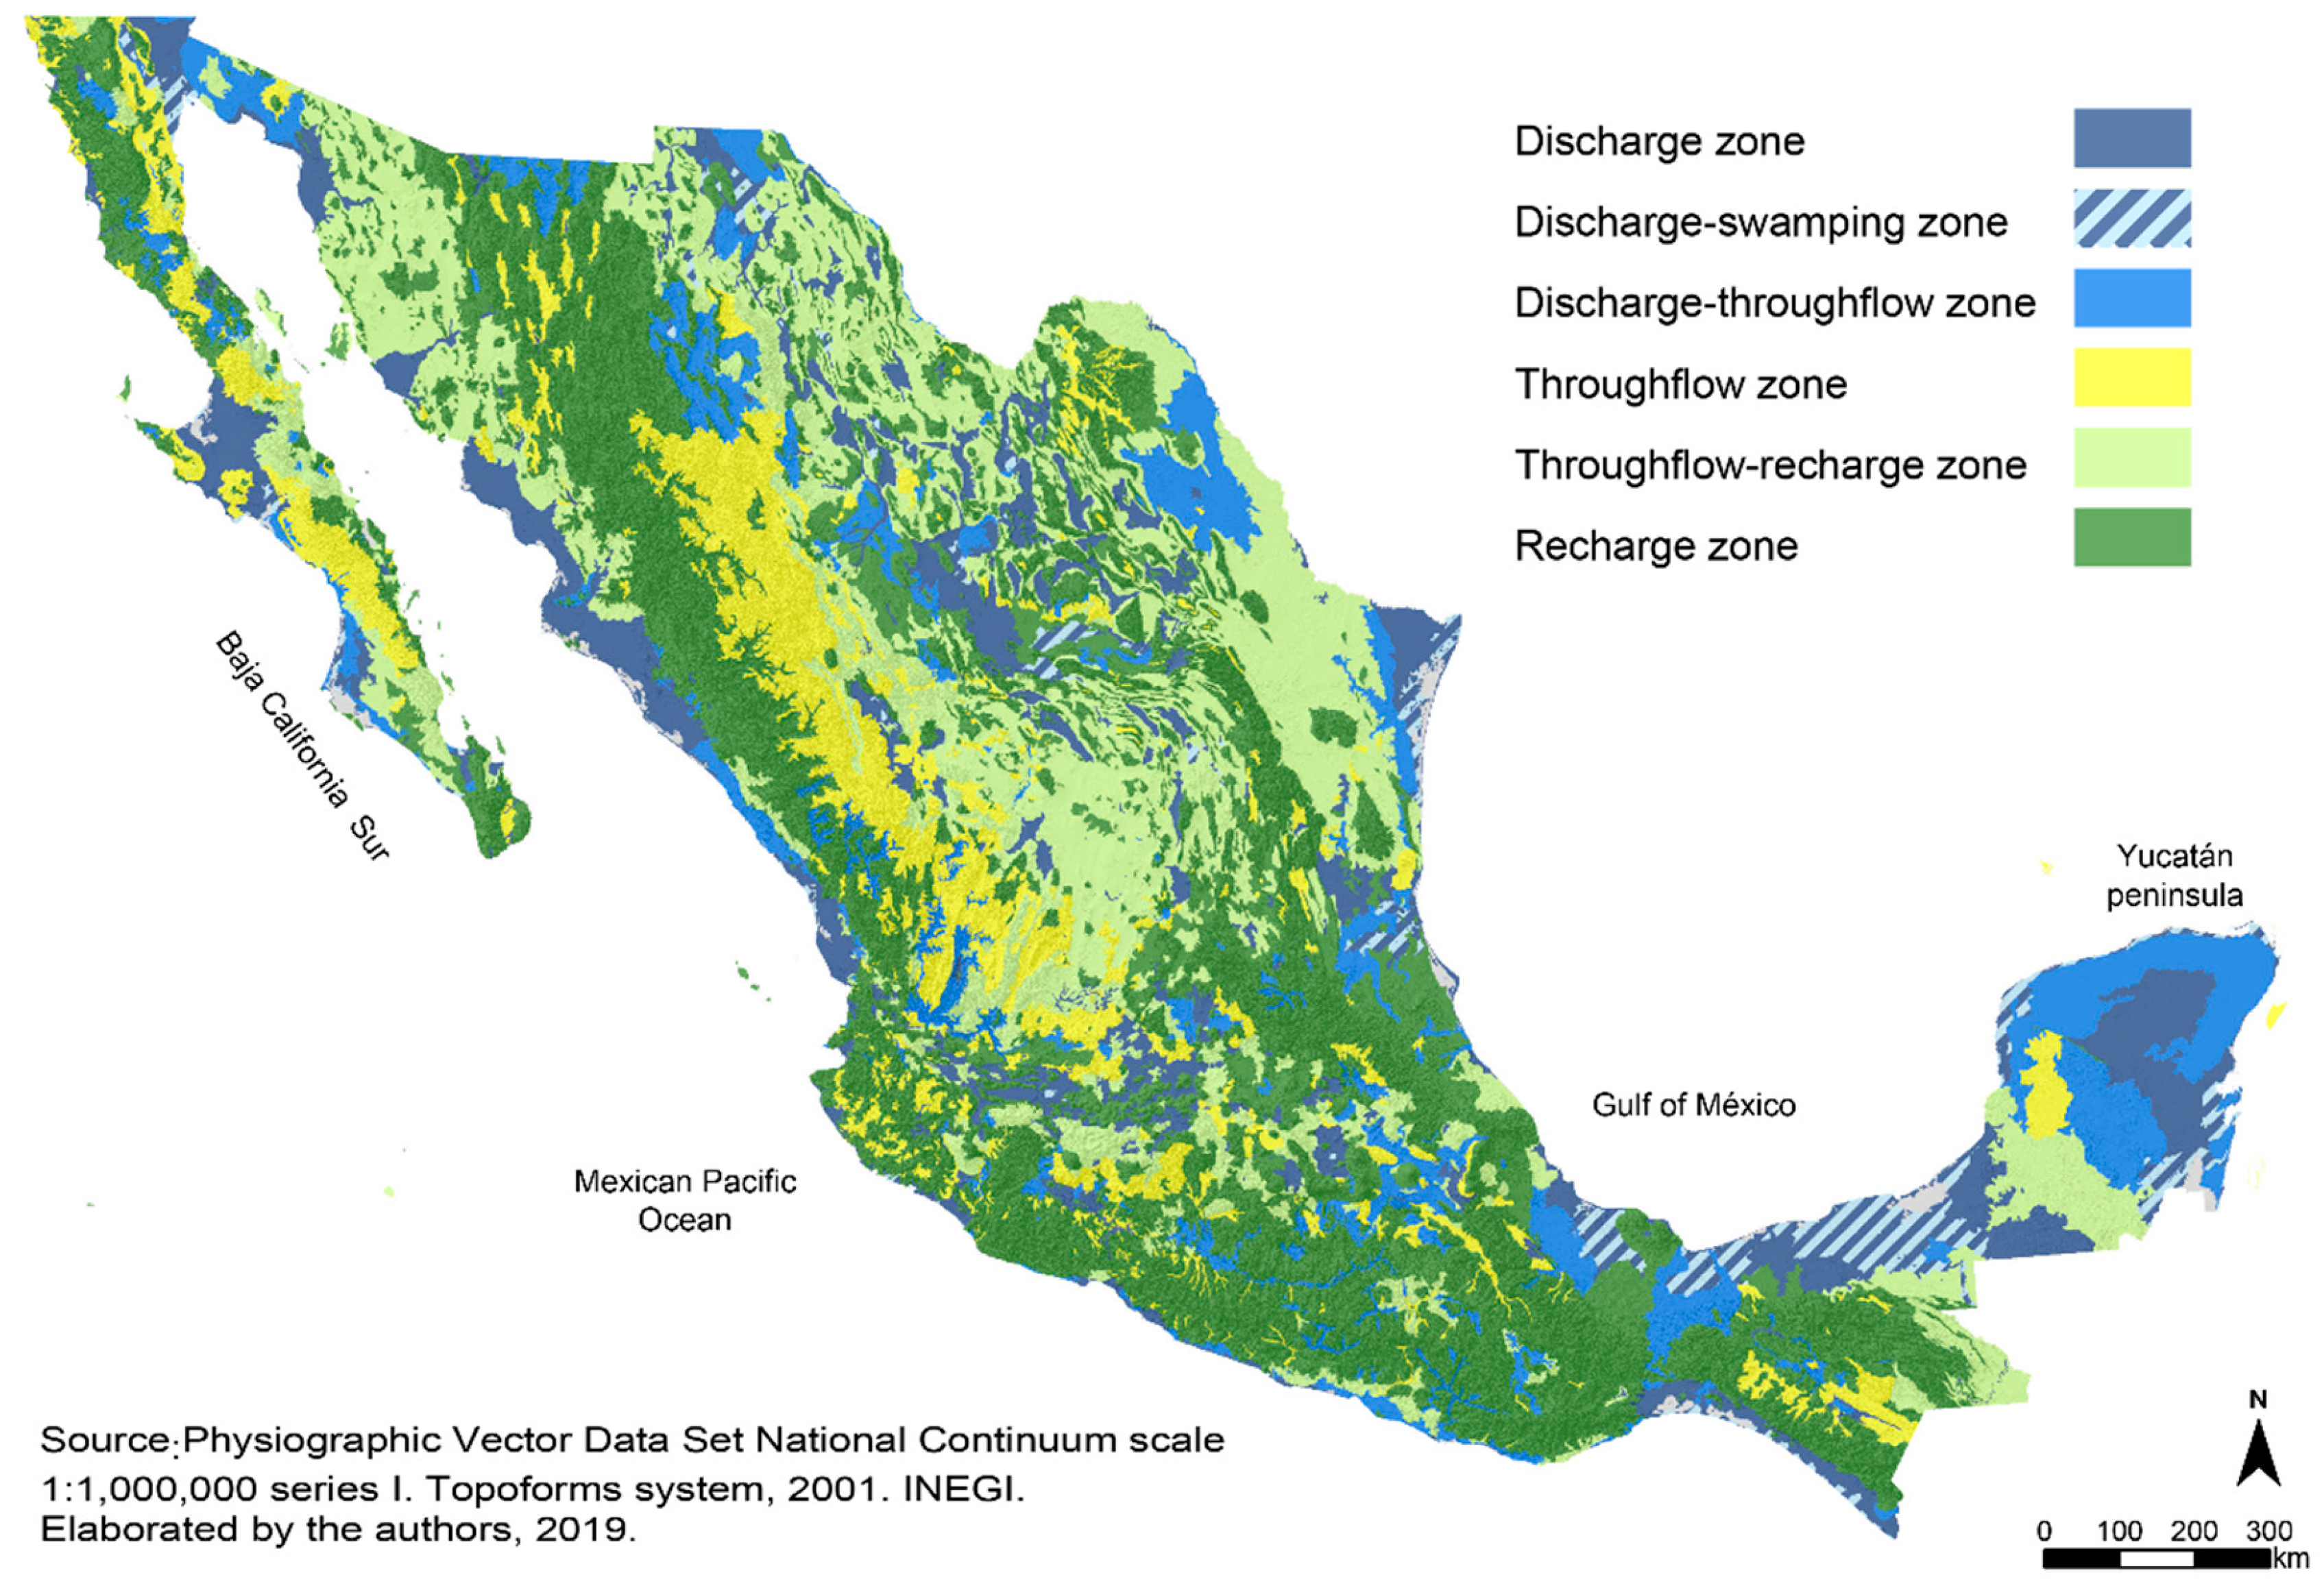
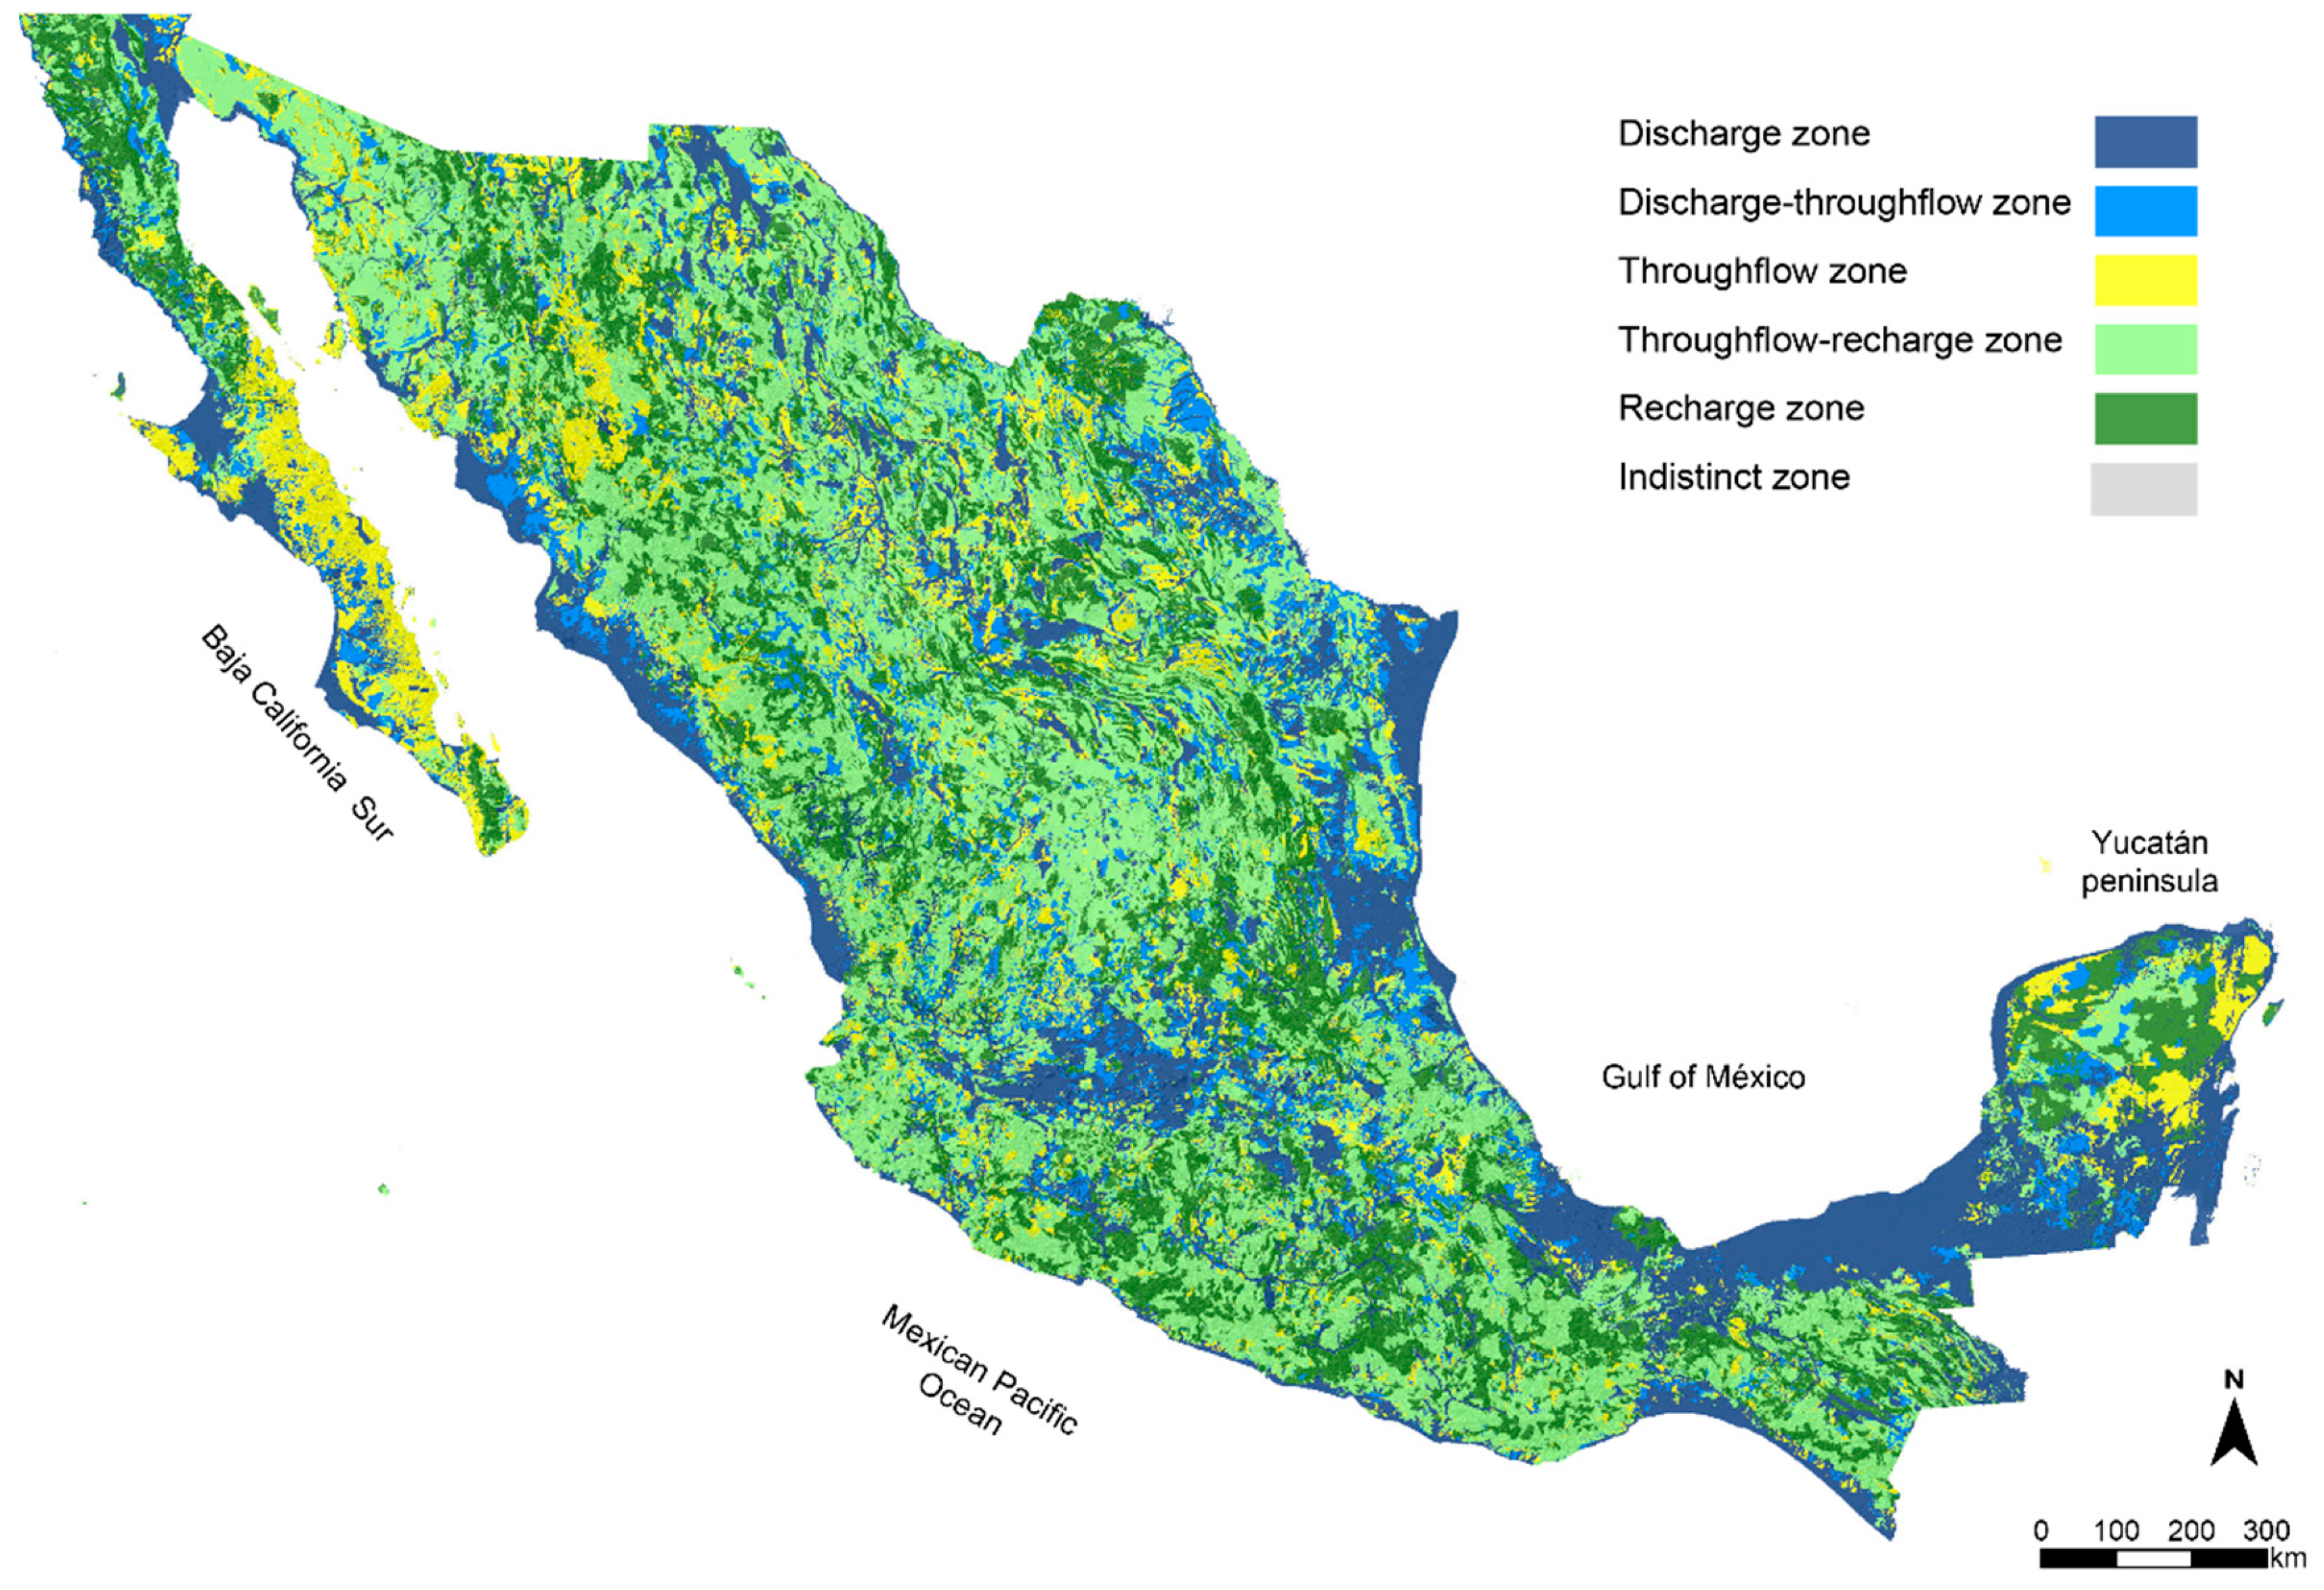
2.2.5. Groundwater and Topoforms

Some topographical features provide the energy necessary to induce the movement of water, determining the distribution of flow energy and shaping the limits of the dominant flows or “effects of major regional landforms” [2]. Tóth’s theory explains that regional relief controls the pattern and direction of flow systems. Flow is generally downward in positive morphological features, while it is upward in topographic depressions. However, this is a relative phenomenon and variable upward and downward movement of groundwater flow in systems is possible [2,11]. The topographical aspects are relative to the spatial scale in which the analysis is performed and the geomorphological aspects are considered.

2.2.6. Groundwater and Geological Framework

The geological context controls the presence, speed, and direction of groundwater flow and its physicochemical characteristics; interaction with tectonic activity, surface water and climate are also relevant. In the geological context, a wide range of effects in the pattern and direction of groundwater movement (vertical ascending, vertical descending, horizontal, inclined) are due mainly to the permeability of the media, in combination with the position of the water table and the depth of the basement rock [2]. The same rock, or groups of rocks, may generate different types of soil and therefore different types of vegetation. Conversely, different types of rocks can produce the same type of soil and associated vegetation. This is because of the combination of geological framework, groundwater flow systems, and climate. Groundwater is a shaping agent, both underground and on the surface. However, it is incorrect to use rock cover in a regional analysis of groundwater flow systems. In this work, it was not considered acceptable to make a simplistic, linear association of surface rock type with respect to permeability and chemical features.

2.2.7. Groundwater and Climate

The climate directly establishes the amount of water in a region, and its distribution over time. Air temperature, precipitation, and rate of evaporation are climatic elements to be evaluated, along with other hydrogeological components. Due to the large area of this study and the cartographic scale of the climatic information, climate is used as a regional reference for the superficial indicators, e.g., to explain the continued perennial presence of water bodies in an arid context.

2.2.8. Discharge, Throughflow, and Recharge Zones

The journey of groundwater will end in discharge zones, where the water emerges onto or close to the surface. Discharge zones are characterized by primary attributes [4]: (i) positive potential slope, (ii) relatively low-lying position, (iii) allochthonous physicochemical composition of water, and (iv) allochthonous water temperature. One or more of these attributes may be present. The appearance and intensity of the primary attributes depends on the combination of hydrogeological conditions: air temperature, slope of the relief, physicochemical composition of the rocks, permeability of the rocks, vegetation, land uses, etc.
Natural features resulting in the discharge of groundwater, either directly onto the surface or in a diffused manner, include perennial surface water bodies, baseflow, springs, geysers, marshland, lands with quicksand, salt accumulations, landslips or landslides, shallow phreatic level, river valleys, swamp, eutrophicated water bodies, topographic depressions, excess humidity in the soil, hydrophilic vegetation, and/or halophyte vegetation. The permanent presence of water, waterlogging, mud, and/or flooding, and shallow static water level depth are the first and main indicators that a site is in a discharge zone of a groundwater flow system.
In recharge zones, the phreatic level varies throughout the year and is usually at considerable depth. Depending on the size of the study area, there may be no sign of permanent water on the surface in relation to the local or regional conditions. The size of the study area is usually meant to be related to the geological framework, i.e., depth of the basement rock, the water bearing and transmissive rocks, rainfall regime, and soil–vegetation associations [11]; if possible, the area should include discharge zones. Throughflow zones are those between the discharge and recharge zones of a groundwater flow system. In surface indicator analysis, throughflow zones are those in which there are no evident characteristics of a discharge or recharge zone.

2.3. Data Processing and Interpretation

The methodology used included data collection, definition and analysis of spatial attributes, analysis of surface indicators, and uploading of a GIS (geographical information system) database.
Data collection involved the direct request for data from the National Water Commission (CONAGUA) and National Institute of Statistics and Geography (INEGI), reviewing, and systematizing databases via Excel Office 365 and ArcMap 10.4.1 software.
The geographic information used is official and publicly available. It is presented in shape format at a 1:250,000 scale: (a) topography, continental relief, hydrography, piezometric level, climate (1:1,000,000 scale), edaphic coverage, physiography (1:1,000,000 scale), hydrology, potential wetlands, land use, and vegetation. For each theme, the oldest available national datasets in vector version were used to characterize the most natural context, which may in fact still be operative despite changes in land use [45,46,47,48,49,50,51,52,53,54,55,56,57]; (b) national mapping of mangroves [58], and (c) Groundwater Monitoring Network piezometric data 1979–2019 provided by the Mexican National Water Commission, and the National Inventory of Wetlands [59,60].
To analyze the attributes of the spatial database evaluation and selection of the INEGI spatial attributes, the respective guides for cartographic interpretation and data dictionaries were used [61,62,63,64,65,66,67]. For the analysis of the edaphic properties of soils, the criteria from the Global Soil Resource Reference Base [41] and the Keys to Soil Taxonomy [35] were used.

2.3.1. Analysis of Surface Indicators

With an interdisciplinary, wide-view system interpretation, a systematic, nonlinear analysis of surface indicators of the effects and/or manifestations of groundwater flow systems took the following order of importance and scientific validity: (i) perennial surface water, including springs; (ii) depth of static water level; (iii) soil cover; (iv) vegetation and land use; and (v) topoforms.
For each dataset theme, based on the previously defined criteria and the characteristics of the original thematic charts, Excel matrices were made. For the systematic classification of these criteria and a groundwater flow zone classification was associated to every feature into a new attribute in each dataset. Conditional statements were programmed in Python and implemented through ArcGIS (v. 10.4.1).
After associating each of the thematic datasets, they were combined into a single feature class using the ArcGIS Identity tool (v10.4.1) which computes a geometric intersection of the input features inheriting all the attributes of those intersecting features. This process has limitations, as it combines different thematic datasets with different spatial resolution and accuracy, and should be interpreted with caution and only in a general, regional approach. From the attribute table of the feature class obtained, a comprehensive analysis of all the conditions defined for each of the surface indicators was carried out. Then, a final groundwater flow association was assigned to each feature using the same method as with the thematic datasets. Zones associated with discharge on the natural surface water and soil coverage datasets were associated with discharge; the rest of the combinations were analyzed separately in a systematic manner. In all, 2335 unique conditions were analyzed and classified, defining the groundwater flow systems zones, from which the final map “Superficial evidence of the presence of groundwater flow systems” was obtained (Figure 7). The aspects considered relevant to establish the associations between natural elements and groundwater are described as follows.

2.3.2. Natural Surface Water

The first surface indicator examined was the presence of natural, perennial water on the surface. From the 15 maps that contain spatial information regarding surface water, the spatial attributes that are directly associated with discharge zones are perennial freshwater bodies, perennial water currents, water body central line, springs, muddy terrains, wetlands, flood plains, natural water bodies (such as perennial lakes, lagoons and pools, marsh, swamp, humidity-type H2O, and perennial rivers of Horton–Strahler 5–7 order, at a scale of 1:250,000). In different official thematic charts related to surface water, the spatial attributes called saline soils and moisture agriculture are included, which, due to their definition in the respective dictionaries, are associated to discharge zones in this study [45,48,49,50,51,52,53,54,55,56,58,59,68]. The spatial scale at which this study is developed suggests that the process of discharge is the most important of the above-mentioned spatial attributes.

2.3.3. Groundwater Depth

The depth at which groundwater is found was analyzed from CONAGUA and INEGI [60,69]. Boreholes and wells with static water level depth data were classified according to water depth (less or equal to 3 m, between 3 and 11 m, greater than 11m) and temperature. The depth of 3 m was assigned because it is a value used as the lower limit in evapotranspiration processes. The range of between 2 and 11 m is an interval in which natural temporal fluctuation is observed. The boreholes were grouped into seven categories and analyzed in relation to the topoforms associated with discharge and swamping–discharge: (1) thermal water with static water level ≤3 m in discharge topoform, (2) thermal water with static water level between >3 m and ≤11 m in discharge topoform, (3) thermal water with static water level between >3 m and ≤11 m not in discharge topoform, (4) no thermal water with static water level ≤3 m in discharge topoform, (5) no thermal water with static water level between >3 m and ≤11 m in discharge topoform, (6) no thermal water with static water level between >3 m and ≤11 m not in discharge topoform, and (7) static water level >11 m. The CONAGUA database has no temperature record, so their data are displayed as nonthermal. When the depth of the static level is greater than 11 m, a mixture of flows of different order may be occurring, and therefore it is incorrect to assume a single thermal value as an indicator of a flow order (local or regional). The INEGI database contains only one value per well, but the average was used for the CONAGUA database records with more than one value.

2.3.4. Soil Analysis

Soils of 25 types were analyzed and grouped into three categories: (i) soils associated with discharge zones: Fluvisol, Gleysol, Histosol, Lixisol, Planosol, Plinthosol, Solonchak, Solonetz, and Vertisol; (ii) soils associated with recharge zones: Leptosol, Luvisol, Nitisol, and Regosol; and (iii) soils found in indistinct zones, considering their taxonomy: Acrisol, Alisol, Andosol, Arenosol, Calcisol, Cambisol, Chernozem, Durisol, Gypsisol, Kastanozem, Phaeozem, and Umbrisol.
Each spatial polygon that forms the edaphic map has three main attributes [64]: (i) dominant soil, covers ≥ 60% of the edaphic polygon; (ii) main qualifier of the dominant soil, indicating its quality; and (iii) secondary soil, which is estimated to cover 20–40% of the edaphic polygon. The main qualifiers associated with discharge processes were: albic, alkali, endogleyic, endopetrocalcic, endopetroduric, endoplinthic, endosalic, endosodic, epigleyc, epiplinthic, episalic, episodic, ferric, fibric, fluvic, folic, gelic, gypsic, gypsyric, gleyc, grumic, hypersalic, hypersodic, hypogleyc, hyposalic, hyposodic, mazic, mesotrophic, natric, petrosalic, plinthic, rheic, rhodic, rubic, salic, stagnic, takyric, and vertic. The rest of the qualifiers are edaphic characteristics that may occur due to both recharge and discharge processes, so they were assigned as indistinct. The analysis of the soil attributes gave nine soil classifications that show the processes of groundwater flow in each polygon of the soil cover (Table 1). The last two classifications result from polygons with two hydrogeologically contrasting soil types. In the original soil map this polygon is recorded with ≥60% of the soil of one type and 20–40% of another soil type [64]. The category proposed as major discharge with minor recharge surface, indicates that 60% of the polygon is discharge soil, and 20–40% is a soil with conditions associated with groundwater recharge. The major recharge with minor discharge surface category is an edaphic polygon with ≥60% covered by a soil type associated with recharge zones and that 20–40% of the polygon has a typical groundwater discharge soil.

2.3.5. Vegetation and Land Use Analysis

The map of vegetation and land use contains 61 spatial attributes, as found by INEGI [45] and associated with (i) discharge zones: gallery vegetation, halophyte vegetation, mangroves, popal-tular vegetation (hydrophilous grassland), gallery forest, huizache (Acacia or Prosopis juliflora, Prosopis velutina, Acacia greggii, Acacia constricta), coastal dune vegetation, palm grove, gallery jungle, gypsophilic vegetation, wetland agriculture; (ii) discharge–throughflow zones: Sarcocaule scrub, sarco–crasicaule mist thickets, subcaducifolia low forest, pastizal–huizachal, gypsophilic grassland, halophilic grassland, savanna, spiny lowland forest, subperennifolia lowland forest medium evergreen forest; (iii) throughflow zones: submontane thicket, medium evergreen rainforest, tamaulipean spiny thicket, coastal rosettophilous thicket, mesquite, high evergreen rainforest, sandy desert vegetation; (iv) throughflow–recharge zones: chaparral, low open forest, cultivated forest, medium deciduous forest, mesophilic mountain forest, low deciduous forest, crasicaule thicket, microfilo desert thicket, rosetophilic desert thicket, subtropical thicket; (v) recharge zones: pine forest, oak forest, pine–oak forest, oak–pine forest, cedar forest, táscate forest, oyamel forest, ayarin forest, coniferous thicket, high mountain meadow, high evergreen jungle, low evergreen forest, medium evergreen forest; and (vi) indefinite: induced pastureland, natural grassland and cultivated pasture. In this study GDE are taken as a direct surface indicator of discharge zones. Confirmation is made when other conditions, such as permanent shallow groundwater depth, low rainfall in dry and/or hot climate, low regional topoforms, or soil with hydromorphic features, are also present [39,45].

2.3.6. Relief Analysis

The relief of Mexico has ten regional geoforms [51], which were grouped into (i) regional discharge zones, valleys, plains, depressions, sinkholes, beach/bar, plateau, and dune fields; (ii) regional recharge zones, mountain ranges, mountains, and hills. The spatial scale of topoform mapping is 1:1,000,000, so the hydrogeological association is of a regional nature where natural discharge processes of a different order may be taking place (regional, local, intermediate).
The association of these geoforms was refined by classifying deposition material, location, and phase [51], associated with the discharge processes: flood prone, saline, barrier, coastal, deltaic, alluvial, and lacustrine deposits.
In a regional context, the topoforms associated with discharge, swamping–discharge and discharge–throughflow zones, are found in the regional relief (scale of 1:1,000,000) with little or no slope. In order to ensure the degree of influence on the subsurface of the presence of shallow perennial natural water (springs, perennial water bodies, lakes, lagoons, wetlands, perennial rivers with Horton–Strahler 5–7 order, swamping areas, pond, mud, marshland, and locations with a static water level depth of ≤3 m), a buffer of 1 km was applied to those attributes when in topoforms associated with discharge.

3. Results and Discussion

Figure 2 shows the hydrogeological surface landforms that are associated surface indicators of the groundwater flow systems analyzed in the present study. Based on the geomorphological features, 339 types of topoforms, in six classifications, were found: discharge, 11.3% (48 types); swamping discharge 3.26% (24 types); discharge–throughflow, 10.8% (46 types); throughflow, 11.4% (63 types); throughflow–recharge, 24.5% (49 types); and recharge, 38.7% (108 types). According to the definition in the data dictionary, the term swamping discharge (floodable) refers to intertidal zones or seasonally continental water inundation [51].
Figure 3 shows permanent surface water. The discharge zones of regional groundwater flow systems are shown by blue shading. Approximately 15.5% of the surface is covered by natural perennial water bodies. Nonthermal springs located in topoforms that are not associated with discharge zones indicate discharge points. They indicate discharge zones when found in discharge topoforms. The presence of thermal springs in, or near, confirms that the discharge zones have regional flow system characteristics, because of the range of water temperatures; however, isotopic stable analysis should be carried out. Where regional flow systems occur, local and intermediate flows coexist. All rivers travel through recharge, throughflow and discharge sections. In turn, rivers in discharge topoforms, show that the systemic process of discharge is dominant.
Figure 4 shows the groundwater depth. The static water level depths were classified in terms of depth ranges, temperature, and their regional topographic context. There are 23,767 boreholes and wells that have static water level depth records. Of them, 53% have an average groundwater depth of >11 m; 33% of between 3 and ≤11 m; and 14% of ≤3 m. Sink holes (known as cenotes) have groundwater depths of 2–6 to 20.5 m [60,69].
Where static water depths of ≤11 m were found in topoforms classified as discharge, flooding discharge and discharge–throughflow attributes, this was considered as an indicator suggesting the location is in a discharge zone. The static depth level of >11 m in topoforms related to recharge may indicate throughflow or recharge zones; when found in discharge topoforms, they may be classified as throughflow zones. Shallow water depths, close to perennial water bodies in lowlands and plains, were also found in many instances. Data without temperature records are shown as nonthermal.
Figure 5 shows the hydrogeological association of soils. Here, the distribution of edaphic covers suggests the edaphic coverage as discharge 11.3% (discharge 10.3%, discharge–recharge 1%); discharge–throughflow 14.3%; recharge 24%; throughflow–recharge 37% (throughflow–recharge, recharge–throughflow, throughflow); recharge–discharge 2.6%; and indistinct 11%. It is interesting to see the similitude that exists, in terms of magnitude of spatial coverage, between the 11.3% of the soil surface associated with discharge processes and the 15.5% of the surface covered with perennial natural water (Figure 3), as well as the 37% of soil coverage associated with recharge processes, which is almost equal to the 38% for relief associated with recharge processes (Figure 5).
The national coverage of land and vegetation uses in [45] is the reference with the oldest original conditions. At that time, urban zones covered 0.1% of Mexico, 13% was agricultural, and 7.4% induced pastureland. Agriculture and induced pastureland were classified as indistinct since they can occur in many environments.
Figure 6 shows the hydrogeological association of vegetation and land use. From a groundwater flow system perspective, the vegetation and land use attributes were associated as zones of (i) discharge 3.8%; (ii) discharge–throughflow, 6.4%; (iii) throughflow, 14.5%; (iv) throughflow–recharge 31.6%; and (v) recharge 22.4%.
It was found that the relationship between the vegetation associated with discharge and throughflow zones was 10.2% in the 1980s. In discharge zones with perennial water on the surface, the relation was 15.5%, and in soils related to discharge, 11.3% (Figure 3 and Figure 5). A correlation was carried out for recharge zones based on vegetation and soil analysis, yielding 22.4% and 24.0%, respectively.
The conceptual criteria of Tóth’s theory for soils and vegetation must be considered as a first reference and a more detailed multifactorial procedure should be carried out, avoiding a linear and direct process. Furthermore, it should be remembered that groundwater flows in multidimensional ways (Figure 1). From this perspective, the vegetation types with the highest degree of certainty are those related to discharge and recharge environments, as explained previously.
Figure 7 was produced from the maps shown in Figure 2, Figure 3, Figure 4, Figure 5 and Figure 6, based on the methodology described in the methods. This figure shows that in at least 21.4% of Mexico there is strong evidence of discharge from groundwater flow systems. The classification of discharge–throughflow (~9.3%) indicates characteristics, phenomena, and/or manifestations of groundwater discharge into the soil, vegetation, and/or topoforms. The recharge processes may be occurring naturally in ~23% of the territory (recharge zones); this could be higher if it is considered that ~34.7% of the territory was classified as throughflow–recharge zones. The throughflow zones are those where, at the time the spatial information was recorded, there were no clear discharge or recharge zone features. They are found in ~11.5% of México.
In the discharge zones shown in Figure 7, water is present permanently, either at the surface or at a shallow depth. However, there is no confirmation of groundwater at a point here, for two reasons, (i) the origin and temporality of the data for each of the surface indicators, as pointed out in the methodology, and (ii) due to the constant dynamics to which the groundwater flow systems are subject, mainly from human activity, directly or indirectly. Groundwater discharge and recharge are affected mainly by water extraction through boreholes and dug wells, evapotranspiration, in soil and agricultural activity, loss/alteration of natural vegetation, alteration of the natural channels of perennial runoff, loss of soil permeability, and compaction–collapse of soil.
Understanding the links between the discharge, throughflow, and recharge zones of a groundwater flow system requires more detailed analysis. Indeed, the definition of the order of groundwater flow (i.e., local, intermediate, regional) should be investigated more fully. Using systematic analysis of the physical parameters, piezometric information (water static level) and the nature of the chemical and isotope water fingerprint, to understand recharge altitude, flow path through different rock formations, water–rock interaction, depth of circulation different groundwater flows can be separated and discharge conditions established. These characteristics might assist in relating groundwater flow with the environment and accurately define its links to ecosystems.
If the reader wishes to reproduce Figure 2, Figure 3, Figure 4, Figure 5, Figure 6 and Figure 7, the necessary files and vectors have been provided at https://doi.org/10.5281/zenodo.3928750 as Supplementary Materials.
The dynamics of groundwater do not stop at the coast; there are also maritime discharge zones [70]. The discharge zones on the Mexican coast show the importance of the fresh groundwater component in the submarine groundwater discharge (SGD). In agreement with [10], “The total flux of submarine groundwater discharge, SGD, to the Atlantic Ocean is similar in volume to the riverine flux”, SGD is a very important process of the hydrological cycle in México. Certainly SGD is related to the nature of the geological framework; for instance, the presence of submarine springs has been documented offshore from the limestone rocks of the Yucatán Peninsula, as well as those of rhyolitic nature in Baja California Sur, contrasting with the dispersed submarine discharges of groundwater in the Gulf of Mexico [71] or elsewhere in the Mexican Pacific and the Gulf of Mexico.
More than half of Mexico has dry or very dry climates, with an average annual precipitation range of 100–600 mm, and an average annual temperature in the range of 20–26 °C [54]. Dry climates are commonly associated with environments where there is little perennial water on the surface. Of the total area classified as discharge zones, 39.7% have a dry climate. This is consistent with about two-thirds of Mexico having dry conditions, suggesting that the main source of groundwater recharge occurs, as usual, in the highlands, where most of the rainfall occurs.
One of the limitations of this study is the low resolution of the spatial information used. This is due to the large size of the country. From the correlation of results of the systematic analysis of the groundwater flow system indicators at the surface, the discharge zones can be identified with a high degree of certainty. However, this certainty decreases with the classification type: discharge–throughflow, throughflow, throughflow–recharge, recharge, and indistinct. As was mentioned earlier, in smaller recharge/throughflow zones, discharge processes also occur, and in discharge zones processes of recharge/throughflow may also occur locally.
Hydrogeological studies are often approached from the local characteristics of an area without full consideration of the regional context and interactions to and from the local and regional hydrogeological environments. This study provides the regional context for local understanding, in order to preserve, recover, or evaluate a site or landscape and promote sustainable interventions.
The results of studies of greater detail are compared with those obtained in the present study, at regional level, and are worth noting. A study of the importance of coastal wetlands was carried out on a coastal floodplain, in central Veracruz state, by Neri-Flores et al. [72]. The study area has coastal dunes and diverse wetland vegetation, riverine vegetation, salt marshes, and an elevation range of <10 m a.s.l. With 31 piezometers installed near the Jamapa and Cotaxtla Rivers and in surrounding urban areas in 2007, 2012, and 2017, the depth of groundwater was registered as between 0.9 and 7.4 m, with an average of 3.1 m. The groundwater table naturally rose by an average 1.3 m in the rainy season, causing groundwater flooding in wetlands and dune lakes. Figure 7 shows this study area to be in a discharge zone (Figure 8), where Neri-Flores et al. [72] conclude that “groundwater and surface water in coastal floodplains are linked and are important to wetland ecosystem functioning” and that “groundwater floods occur every year in the lower-lying areas of the floodplain, which are discharge zones covered with wetlands”. In practical terms, it was found that the results of this independent study, with direct field measurements, agrees with the discharge conditions found with the indirect data obtained for the present work from inexpensive published official data.

4. Conclusions

From the available environmental information new maps were produced that link components of the environment with groundwater function by following Toth’s theory.
There is good correlation between the maps that allows the identification of the natural hydrologic functioning in most Mexican environments at a regional level. When all the elements of the groundwater regional flow system in Mexico are connected, 30% are regarded as discharge zones, and 57% as recharge zones. From the results, only <0.05% of the territory was classified as indistinct in terms of hydrogeological context. These findings are important tools in understanding the interaction of ecosystems and the environmental dynamics related to the groundwater.
Another direct application of the cartography developed is the identification of regional discharge and recharge zones in relation to the stability of protected natural areas and their ecosystem services; the regional discharge zones are zones vulnerable to flooding and inundation, collapse, landslides, and subsidence. On the other hand, discharge zones located on the coast could be potential sites for the development of salinity-gradient energy projects.
At the regional level, while areas of recharge, throughflow, or discharge can be identified, more detailed studies will make more evident the coexistence of areas and flow systems. Ideally, this work should be continued, to identify the recharge and throughflow zones with their specific links to discharge zones. This would make it feasible to determine the length and the depth of groundwater flows and define flows of different hierarchies (regional, intermediate or local), as well as identify their possible interactions with valuable environmental components [73]. The methodology used can easily be implemented in other regions like Mexico, where monitoring is scarce and sources of information are not always universally accessible.
The cartography elaborated offers base material in defining environments to be studied in more detail in order to encourage sustainable management. It is hoped that these maps will become the reference for the national–regional context of any study on groundwater and its land-based environmental interaction.

Supplementary Materials

The following are available online at https://www.mdpi.com/2073-4441/12/9/2459/s1. All the necessary files for reproducing Figure 3, Figure 4, Figure 5, Figure 6, Figure 7 and Figure 8 and to set them into a GIS are available at https://doi.org/10.5281/zenodo.3928750.

Author Contributions

Conceptualization, A.K.-M., E.M., and R.S.; methodology, A.K.-M., J.J.C.-R. and M.M.A.-M.; software, F.H.-A.; validation, J.J.C.-R. and M.M.A.-M.; formal analysis, A.K.-M., F.H.-A., E.M., and R.S.; investigation, A.K.-M., J.J.C.-R., and M.M.A.-M.; resources, E.M. and R.S.; data curation, A.K.-M. and F.H.-A.; writing—original draft preparation, A.K.-M. and E.M.; writing—review and editing, R.S., J.J.C.-R., and M.M.A.-M.; visualization, A.K.-M. and F.H.-A.; supervision, J.J.C.-R., M.M.A.-M., and R.S.; project administration, E.M. and R.S.; funding acquisition, E.M. and R.S. All authors have read and agreed to the published version of the manuscript.

Funding

This research received no external funding.

Acknowledgments

The authors wish to thank the National Water Commission (CONAGUA), México for providing official data. In addition, acknowledgment is given to CEMIE-Océano (CONACYT project 249795) and Evaluación de Riesgos Bioeconómicos Debidos a la Sobreexplotación de Acuíferos en Regiones Áridas y Costeras Urbanas y Agricolas (CONACYT project 267712) for partially funding this research.

Conflicts of Interest

The authors declare no conflict of interest.

References

  1. Gleick, P.H. Water in Crisis: A Guide to the World’s Freshwater Resources; Copyright by Pacific Institute for Studies in Development, Environment, and Security & Stockholm Environment Institute; Oxford University Press: New York, NY, USA, 1993. [Google Scholar]
  2. Tóth, v. Gravitational Systems of Groundwater Flow. Theory, Evaluation, Utilization; University of Alberta: Edmond, AL, Canada; Eotvos Loránd University: Budapest, Hungary; Cambridge University Press: Cambridge, UK, 2009. [Google Scholar]
  3. Tóth, J. A conceptual model of the groundwater regime and the hydrogeologic environment. J. Hydrol. 1970, 10, 164–176. [Google Scholar] [CrossRef]
  4. Tóth, J. Groundwater Discharge: A common generator of diverse geologic and morphologic phenomena. International Association of Scientific Hydrology. Bulletin 1971, 16, 7–24. [Google Scholar]
  5. Tóth, J. Groundwater as a geologic agent: An overview of the causes, processes, and manifestations. Hydrogeol. J. 1999, 7, 1–14. [Google Scholar] [CrossRef]
  6. Tóth, J. The evolutionary concepts and practical utilization of the tóthian theory of regional groundwater flow. Int. J. Earth Envrion. Sci. 2016, 1, 111. [Google Scholar] [CrossRef] [PubMed] [Green Version]
  7. Carrillo-Rivera, J.J. Application of the groundwater-balance equation to indicate interbasin and vertical flow in two semi-arid drainage basins. Hydrogeol. J. 2000, 8, 503–520. [Google Scholar]
  8. Povinec, P.P.; Aggarwal, P.K.; Kulkarni, K.M.; Groening, M.; Han, L.F. Isotopic Characterization of Groundwater—Seawater; IAEA–CN–151/131 International Atomic Energy Agency, Marine Environment Laboratories: Monaco, Monaco; International Atomic Energy Agency: Viena, Austria, 2007. [Google Scholar]
  9. Silva, R.; Chávez, V.; Bouma, T.J.; van Tussenbroek, B.I.; Arkema, K.K.; Martínez, M.L.; Oumeraci, H.; Heymans, J.J.; Osorio, A.F.; Mendoza, E.; et al. The incorporation of biophysical and social components in coastal management. Estuar. Coasts 2019, 42, 1695–1708. [Google Scholar] [CrossRef] [Green Version]
  10. Moore, W.S. The effect of submarine groundwater discharge on the ocean. Ann. Rev. Mar. Sci. 2010, 2, 59–88. [Google Scholar] [CrossRef] [Green Version]
  11. Tóth, J. Las aguas subterráneas como agente geológico: Causas procesos y manifestaciones. Bol. Geol. Min. Inst. Tecnol. GeoMin. Esp. 2000, 8, 9–26. [Google Scholar]
  12. Cartwright, I.; Wever, T.R.; Tweed, S.A. Integrating physical hydrogeology, hydrogeochemistry, and environmental isotopes to constrain regional groundwater flow. In Groundwater Flow Understanding: From Local to Regional Scale, Proceedings of the Zacatecas International Congress, Zacatecas, Mexico, 27–31 October 2008; IAH Selected Papers; Carrillo-Rivera, J.J., Ortega, A., Eds.; CRC Press: Boca Raton, FL, USA, 2008; Volume 12, pp. 86–105. [Google Scholar]
  13. Cloutier, V.; Lefebvre, R.S.; Martine, B.É.; Therrien, R. Hydrogeochemistry and groundwater origin of the Basses-Laurentides sedimentary rock aquifer system, St. Lawrence Lowlands, Quebec, Canada. Hydrogeol. J. 2006, 14, 573–590. [Google Scholar] [CrossRef]
  14. Han, D.; Liang, X.; Jin, M.; Currell, M.J.; Han, Y.; Song, X. Hydrogeochemical indicators of groundwater flow systems in the Yangwu River alluvial fan, Xinzhou Basin, Shanxi, China. Environ. Manag. 2009, 44, 243–255. [Google Scholar] [CrossRef]
  15. Jiang, X.W.; Wan, L.; Wang, X.S.; Ge, S.; Liu, J. Effect of exponential decay in hydraulic conductivity with depth on regional groundwater flow. Geophys. Res. Lett. 2009, 36, L24402. [Google Scholar] [CrossRef]
  16. Xing, L.; Yu, L.; Mengugui, J.; Xingchen, L.; Renquan, Z. Direct observation of complex Tóthian groundwagter flow systems in the laboratory. Hydrol. Process. 2010, 24, 3568–3573. [Google Scholar]
  17. Mádl-Szőnyi, J.; Tóth, Á. Basin-scale conceptual groundwater flow model for an unconfined and confined thick carbonate region. Hydrogeol. J. 2015, 23, 1359–1380. [Google Scholar] [CrossRef]
  18. Erőss, A.; Mádl-Szőnyi, J.; Surbeck, H.; Horváth, Á.; Goldscheider, N.; Csoma, A.É. Radionuclides as natural tracers for the characterization of fluids in regional discharge areas, Buda Thermal Karst, Hungary. J. Hydrol. 2012, 426, 124–137. [Google Scholar] [CrossRef]
  19. Ono, M.; Machida, I.; Ikawa, R.; Kamitani, T.; Oyama, K.; Muranaka, Y.; Marui, A. Regional groundwater flow system in a stratovolcano adjacent to a coastal area: A case study of Mt. Fuji and Suruga Bay, Japan. Hydrogeol. J. 2018, 27, 717–730. [Google Scholar] [CrossRef]
  20. Carrillo-Rivera, J.J.; Cardona, A.; Edmunds, W.M. Use of abstraction regime and knowledge of hydrogeological conditions to control high fluoride concentration in abstracted groundwater: Basin of San Luis Potosi, Mexico. J. Hydrol. 2002, 261, 24–47. [Google Scholar] [CrossRef]
  21. Carrillo-Rivera, J.J.; Cardona, A.; Huizar-Alvarez, R.; Graniel, E. Response of the interaction between groundwater and other components of the environment in Mexico. Environ. Geol. 2008, 2, 303–319. [Google Scholar] [CrossRef]
  22. Huizar-Alvarez, R.; Carrillo-Rivera, J.J.; Angeles-Serrano, G.; Hergt, T.; Cardona, A. Chemical response to groundwater extraction southeast of México City. Hydrogeol. J. 2004, 12, 436–450. [Google Scholar] [CrossRef]
  23. Huizar-Alvarez, R.; Ouysse, S.; Espinoza, M.M.; Carrillo-Rivera, J.J.; Mendoza-Archundia, E. The effects of water use on Tothian flow systems in the Mexico City conurbation determined from the geochemical and isotopic characteristics of groundwater. Environ. Earth Sci. 2016, 75, 1060. [Google Scholar] [CrossRef]
  24. Carrillo-Rivera, J.J.; Cardona, A. Groundwater flow system response in thick aquifer units, theory and practice in Mexico. In Groundwater Flow Understanding: From Local to Regional Scale, Proceedings of the IAH Selected Papers of the Zacatecas International Congress, Zacatecas, Mexico, 27–31 October 2008; Carrillo-Rivera, J.J., Ortega, A., Eds.; Taylor & Francis Group: Abingdon, UK, 2008; Volume 12, pp. 25–46. [Google Scholar]
  25. Carrillo-Rivera, J.J.; Ouysse, S. Enhancement in salinity of extracted groundwater due to urban growth. In Encyclopaedia of Sustainability Science and Technology; Geoenvironmental Section of the upcoming 10-volume; Springer International: New York, NY, USA, 2011. [Google Scholar]
  26. Carrillo-Rivera, J.J.; Cardona, A. Groundwater flow systems and their response to climate change: A need for a water-system view approach. Am. J. Environ. Sci. 2012, 8, 220–235. [Google Scholar]
  27. Cardona, A.; Banning, A.; Carrillo-Rivera, J.J.; Aguillón-Robles, A.; Rüde, T.; Aceves de Alba, J. Natural controls validation for handling elevated fluoride concentrations in extraction activated Tothian groundwater flow systems: San Luis Potosí, Mexico. Environ. Earth Sci. 2018, 77, 121. [Google Scholar] [CrossRef]
  28. Ouysse, S.; Wehncke, E.V.; Carrillo-Rivera, J.J. Investigating regional groundwater flow systems in Baja California central desert region. J. Hydrol. Reg. Stud. 2018, 2, 83–93. [Google Scholar] [CrossRef] [Green Version]
  29. Peñuela-Arévalo, L.A.; Carrillo-Rivera, J.J. Definición de zonas de recarga y descarga de agua subterránea a partir de indicadores superficiales: Centro-sur de la Mesa Central, México. Investig. Geogr. Bol. Inst. Geogr. UNAM 2013, 81, 18–32. [Google Scholar] [CrossRef] [Green Version]
  30. National Commission for the Knowledge and Use of Biodiversity (CONABIO). Capital Natural de México, Vol. I: Conocimiento Actual de la Biodiversidad; National Commission for the Knowledge and Use of Biodiversity: Mexico City, Mexico, 2008. [Google Scholar]
  31. National Water Commission (CONAGUA). Estadísticas del Agua en México; National Water Commission: Coyoacan, Mexico, 2018. [Google Scholar]
  32. US Geological Survey, US Department of the Interior, Office of Water Data Coordination. August 1989. The Federal Glossary of Selected Terms: Subsurface-Water Flow and Solute Transport. Available online: https://or.water.usgs.gov/projs_dir/willgw/glossary.html (accessed on 15 May 2020).
  33. Porta, J.; López-Acevedo, M.; Roquero, C. Edafología para la Agricultura y el Medio Ambiente; Editorial Mundi Prensa: Madrid, Spain, 1994; p. 804. [Google Scholar]
  34. Jenny, H. Factors of Soil Formation; McGrawll-Hill: New York, NY, USA; London, UK, 1941. [Google Scholar]
  35. Ortiz Solorio, C.A.; Gutiérrez Castorena, M.C.; Gutiérrez Castorena, E.V. Claves para la Taxonomía de suelos. USDA. In Soil Survey Staff, 12th ed.; Traducción; Departamento de Agricultura USA: Washington, DC, USA, 2014; p. 410. [Google Scholar]
  36. Alconada-Magliano, M.M.; Fagundo-Castillo, J.R.; Carrillo-Rivera, J.J.; Hernández, P.G. Origin of flooding water through hydrogeochemical identification, the Buenos Aires plain, Argentina. Environ. Earth Sci. 2011, 64, 57–71. [Google Scholar] [CrossRef]
  37. Alconada-Magliano, M.M.; Damiano, F.; Carrillo-Rivera, J.J.; Fagundo-Castillo, J.R. Arsenic & fluoride in water in Northwestern Buenos Aires: Their association with natural landscape elements. J. Geogr. Reg. Plann. 2017, 10, 8–27. [Google Scholar]
  38. Alconada-Magliano, M.M.; Damiano, F.; Fagundo-Castillo, J.R. Estudio del suelo en el paisaje regional como base para definir su manejo agropecuario–Forestal. In Proceedings of the Actas XXV Congreso Argentino de la Ciencia del Suelo, Rio Cuarto, Argentina, 27 June–1 July 2016. [Google Scholar]
  39. Alconada-Magliano, M.M.; Lanfranco, J.W.; Pellegrini, A.E. Suelo en el Paisaje, Parte I. Condiciones de Dotación; Edulp: Buenos Aires, Argentina, 2018. [Google Scholar]
  40. Alconada-Magliano, M.M.; Lanfranco, J.W. Suelo en el Paisaje, Parte II. Condiciones de Abastecimiento; Edulp: Buenos Aires, Argentina, 2020. [Google Scholar]
  41. IUSS Working Group WRB. World Reference Base for Soil Resources 2006. First Update 2007; World Soil Resources Reports No. 103; FAO: Rome, Italy, 2007. [Google Scholar]
  42. Jiang, X.-W.; Wan, L.; Wang, J.-Z.; Yin, B.-X.; Fu, W.-X.; Lin, C.-H. Field identification of groundwater flow systems and hydraulic traps in drainage basins using a geophysical method. Geophys. Res. Lett. 2014, 41, 2812–2819. [Google Scholar] [CrossRef]
  43. Meinzer, O.E. 1927. Plants as Indicators of Groundwater. Water Supply Paper 577. USA. Geologycal Survey. Available online: https://pubs.usgs.gov/wsp/0577/report.pdf (accessed on 30 March 2020).
  44. Eamus, D.; Fu, B.; Springer, A.E.; Stevens, L.E. Groundwater Dependent Ecosystems: Classification, Identification Techniques and Threats. In Integrated Groundwater Management; Jakeman, A.J., Barreteau, O., Hunt, R.J., Rinaudo, J.D., Ross, A., Eds.; Springer: Cham, Switzerland, 2016. [Google Scholar]
  45. National Institute for Statistics and Geography (INEGI). Conjunto de Datos Vectoriales de Uso de Suelo y Vegetación, Escala 1:250,000; Continuo Nacional, Serie I; National Institute for Statistics and Geography: Mexico City, Mexico, 1980. [Google Scholar]
  46. National Institute for Statistics and Geography (INEGI). Conjunto de Datos Vectoriales Edafológico, Escala 1:250,000; Continuo Nacional, Serie II; National Institute for Statistics and Geography: Mexico City, Mexico, 1991. [Google Scholar]
  47. National Institute for Statistics and Geography (INEGI). Continuo Nacional de Topografía, Escala 1:250,000; Serie II; National Institute for Statistics and Geography: Mexico City, Mexico, 1992. [Google Scholar]
  48. National Institute for Statistics and Geography (INEGI). Conjunto de Datos Vectoriales de Vegetación Primaria Escala 1:1,000,000; Nivel I y II (1993-09); National Institute for Statistics and Geography: Mexico City, Mexico, 1993. [Google Scholar]
  49. National Institute for Statistics and Geography (INEGI). Conjunto de Datos Vectoriales Topográficos. Escala 1:250,000; Serie II; National Institute for Statistics and Geography: Mexico City, Mexico, 1995. [Google Scholar]
  50. National Institute for Statistics and Geography (INEGI). Conjunto de Datos Vectoriales Topográficos. Escala 1:1,000,000; Corrientes y Cuerpos de agua; National Institute for Statistics and Geography: Mexico City, Mexico, 2000. [Google Scholar]
  51. National Institute for Statistics and Geography (INEGI). Conjunto de Datos Vectoriales Fisiográficos. Continuo Nacional; Serie I; Sistema topoformas; National Institute for Statistics and Geography: Mexico City, Mexico, 2001. [Google Scholar]
  52. National Institute for Statistics and Geography (INEGI). Conjunto de Datos Vectoriales Climatológicos Escala 1:1,000,000; Humedad de Suelo; National Institute for Statistics and Geography: Mexico City, Mexico, 2005. [Google Scholar]
  53. National Institute for Statistics and Geography (INEGI). Red Hidrográfica Digital de México. Serie I. Escala 1:250,000; shape; National Institute for Statistics and Geography: Mexico City, Mexico, 2006. [Google Scholar]
  54. National Institute for Statistics and Geography (INEGI). Conjunto de Datos Vectoriales Escala 1:1,000,000; Unidades climáticas; National Institute for Statistics and Geography: Mexico City, Mexico, 2008. [Google Scholar]
  55. National Institute for Statistics and Geography (INEGI). Cuerpos de Agua Escala 1:50,000; National Institute for Statistics and Geography: Mexico City, Mexico, 2009. [Google Scholar]
  56. National Institute for Statistics and Geography (INEGI). Continuo Nacional de Aguas Subterráneas Escala 1:250,000; Serie II; National Institute for Statistics and Geography: Mexico City, Mexico, 2010. [Google Scholar]
  57. National Institute for Statistics and Geography (INEGI). Continuo Nacional Humedales Potenciales. Escala 1:250,000; Serie I, shape; National Institute for Statistics and Geography: Mexico City, Mexico, 2012. [Google Scholar]
  58. National Commission for the Knowledge and Use of Biodiversity (CONABIO). Distribution of Mangroves in Mexico in 1970–1981; National Commission for the Knowledge and Use of Biodiversity (CONABIO): Mexico City, Mexico, 2013. [Google Scholar]
  59. National Water Commission (CONAGUA). Wetlands of the Mexican Republic—National Inventory of Wetlands; National Water Commission (CONAGUA): Mexico City, Mexico, 2016. [Google Scholar]
  60. National Water Commission (CONAGUA). Registro Público de Derechos de Agua; National Water Commission (CONAGUA): Mexico City, Mexico, 2019. [Google Scholar]
  61. National Institute for Statistics and Geography (INEGI). Diccionario de Datos Climáticos (Vectorial) Escala 1:1,000,000; Unidades climáticas; National Institute for Statistics and Geography: Mexico City, Mexico, 2000. [Google Scholar]
  62. National Institute for Statistics and Geography (INEGI). Diccionario de Datos Fisiográficos (Vectorial) Escala 1:1,000,000; Sistema Nacional de Información Geográfica; National Institute for Statistics and Geography: Mexico City, Mexico, 2001. [Google Scholar]
  63. National Institute for Statistics and Geography (INEGI). Guía Para la Interpretación de Cartografía Uso del Suelo y Vegetación. Escala 1:250,000; Serie III; National Institute for Statistics and Geography: Mexico City, Mexico, 2009. [Google Scholar]
  64. National Institute for Statistics and Geography (INEGI). Documento Técnico Descriptivo de la Red Hidrográfica Escala 1:50,000, 2nd ed.; National Institute for Statistics and Geography: Mexico City, Mexico, 2010. [Google Scholar]
  65. National Institute for Statistics and Geography (INEGI). Diccionario de Datos Edafológicos Escala 1:250,000; Versión III; National Institute for Statistics and Geography: Mexico City, Mexico, 2014. [Google Scholar]
  66. National Institute for Statistics and Geography (INEGI). Diccionario de Datos de Uso del Suelo y Vegetación. Escala 1:250,000; Versión III; National Institute for Statistics and Geography: Mexico City, Mexico, 2014. [Google Scholar]
  67. National Institute for Statistics and Geography (INEGI). Anexo A Catálogo de Tipos de Vegetación Natural e Inducida de México; National Institute for Statistics and Geography: Mexico City, Mexico, 2016. [Google Scholar]
  68. Federal Commission of Electricity (CFE). Mapa de Manantiales Termales; Federal Commission of Electricity: Mexico City, Mexico, 1988. [Google Scholar]
  69. National Institute for Statistics and Geography (INEGI). Continuo Nacional de Aguas Subterráneas Escala 1:250,000; Serie II; National Institute for Statistics and Geography: Mexico City, Mexico, 2008. [Google Scholar]
  70. Post, V.G.; Kooi, J.; Person, H.; Shemin, M.G.; Edmunds, W. Offshore fresh groundwater as a global phenomenon. Nature 2013, 504, 71–78. [Google Scholar] [CrossRef]
  71. Grubb, H.F.; Carrillo-Rivera, J.J. Region 23, the Gulf of Mexico coastal plain. In The Geology of North America, Hydrogeology; Geological Society of North America: Boulder, CO, USA, 1988; Volume 1–2, pp. 219–228. [Google Scholar]
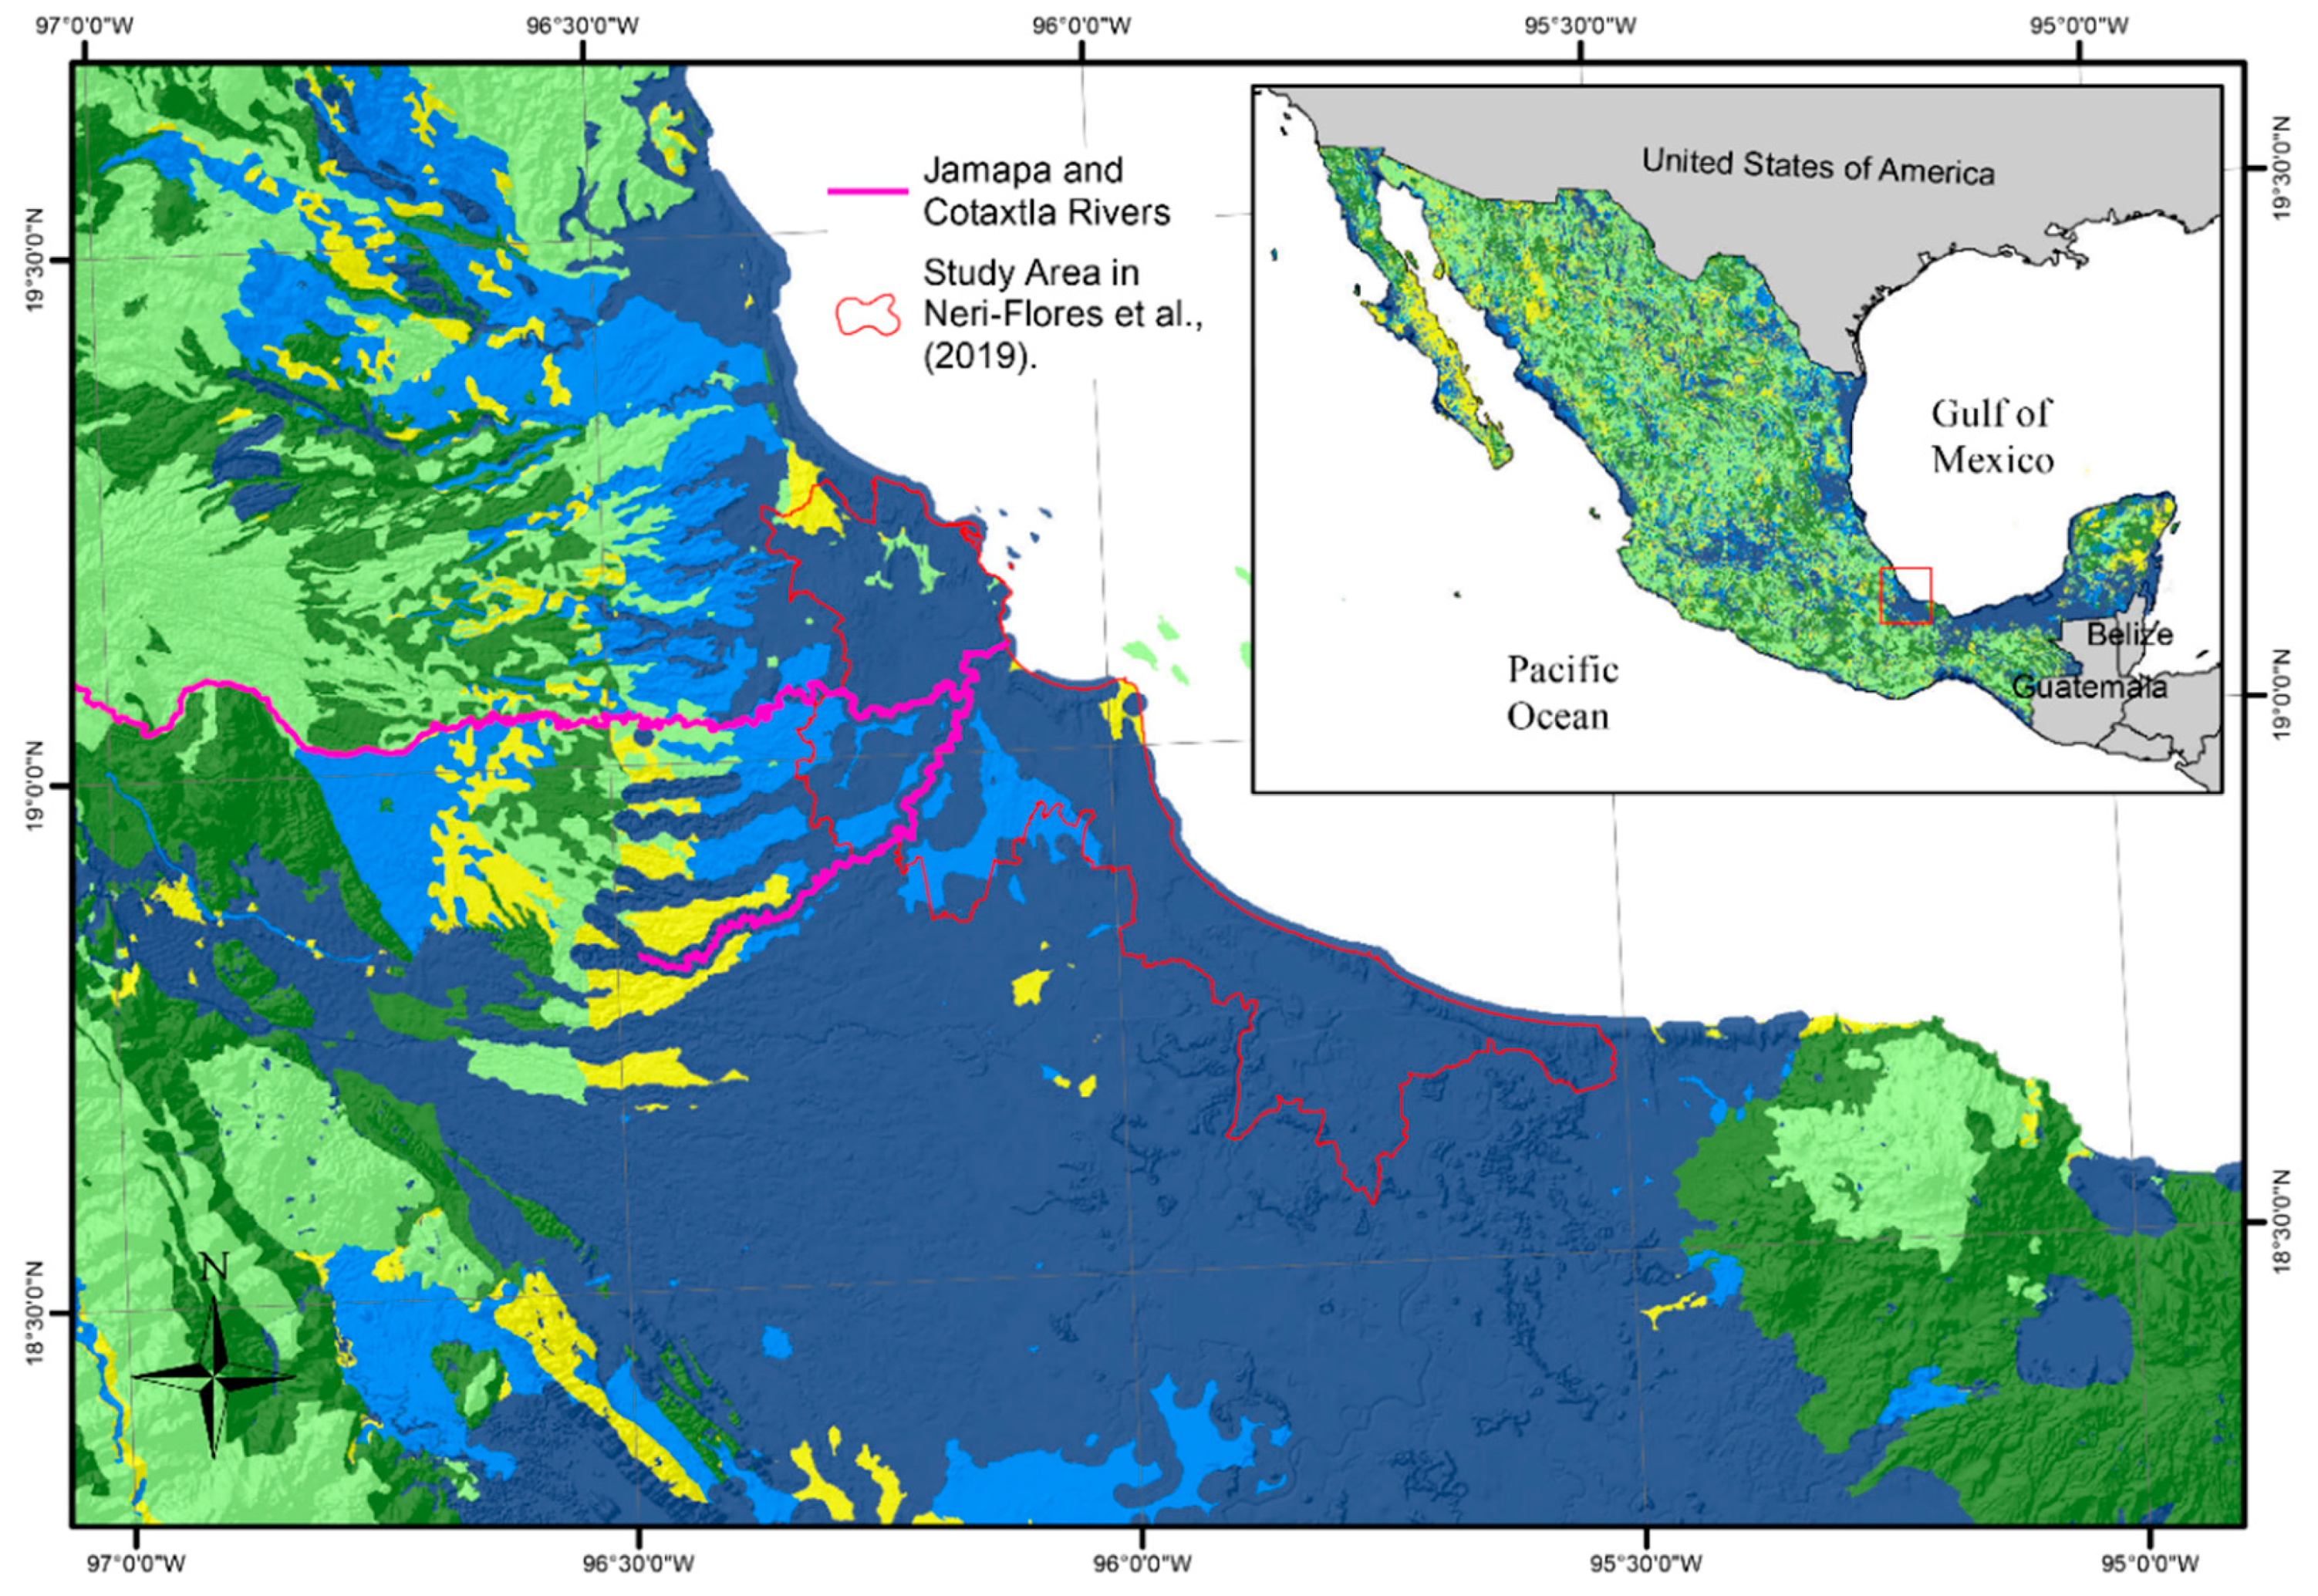
  72. Neri-Flores, I.; Moreno-Casasola, P.; Peralta-Peláez, L.A.; Monroy, R. Groundwater and river flooding: The importance of wetlands in coastal zones. J. Coast. Res. 2019, 92, 44–54. [Google Scholar] [CrossRef]
  73. International Finance Corporation. Good Practice Handbook on Cumulative Impact Assessment and Management: Guidance for the Private Sector in Emerging Markets; World Bank Group: Washington, DC, USA, 2015. [Google Scholar]
Figure 1. Schematic diagram of groundwater flow systems showing some of the processes and manifestations. The order of flow (local, intermediate, regional) is indicated by the flow lines in green, red, and black, respectively. The two areas in red indicate internal water traps and the yellow area represents a basin floor. The scale depends upon the geological framework.
Water 12 02459 g001
Figure 2. Hydrogeological association of regional topoforms.
Water 12 02459 g002
Figure 3. Permanent water on the surface as an indicator of discharge zones of regional groundwater flow systems.
Water 12 02459 g003
Figure 4. Groundwater depth.
Water 12 02459 g004
Figure 5. Hydrogeological association of soils.
Water 12 02459 g005
Figure 6. Association of hydrogeological features with vegetation and land use.
Water 12 02459 g006
Figure 7. Superficial evidence of the presence of groundwater flow systems.
Water 12 02459 g007
Figure 8. Detail of superficial evidence of the presence of groundwater flow systems highlighting the area studied in [72].
Water 12 02459 g008
Table 1. Classifications of soil polygons.
Dominant Soil (≥60% of the Edaphic Polygon)Secondary Soil (20–40% of the Edaphic Polygon)Main Qualifier of the Dominant SoilGroundwater Manifestation Zones
DischargeDischargeDischarge/IndistinctDischarge
IndistinctDischarge
IndistinctDischarge
DischargeIndistinctIndistinctDischarge–throughflow
IndistinctDischarge/RechargeIndistinct/Discharge
DischargeRechargeDischarge
IndistinctIndistinctDischargeThroughflow
Indistinct/RechargeRecharge/IndistinctRecharge/IndistinctThroughflow–recharge
RechargeRecharge/IndistinctDischargeRecharge–throughflow
RechargeRechargeIndistinctRecharge
Discharge
(Major feature)
Recharge
(Minor feature)
IndistinctMajor discharge with minor recharge surface
Recharge
(Major feature)
Discharge
(Minor feature)
Discharge/IndistinctMajor recharge with minor discharge surface
IndistinctIndistinct

