Article

Validation of Sample Preparation Methods for Microplastic Analysis in Wastewater Matrices—Reproducibility and Standardization

1
Chair of Urban Water Systems Engineering, Technical University of Munich, 85748 Garching, Germany
2
Chair of Brewing and Beverage Technology, Technical University Munich, 85354 Freising, Germany
3
Chair of Food Chemistry and Molecular Sensory Science, Technical University of Munich, 85354 Freising, Germany
*
Author to whom correspondence should be addressed.
Water 2020, 12(9), 2445; https://doi.org/10.3390/w12092445
Submission received: 24 July 2020 / Revised: 25 August 2020 / Accepted: 27 August 2020 / Published: 31 August 2020
(This article belongs to the Special Issue Microplastics in Aquatic Environments and Wastewater Treatment )

Abstract

:
There is a growing interest in monitoring microplastics in the environment, corresponding to increased public concerns regarding their potential adverse effects on ecosystems. Monitoring microplastics in the environment is difficult due to the complex matrices that can prevent reliable analysis if samples are not properly prepared first. Unfortunately, sample preparation methods are not yet standardized, and the various efforts to validate them overlook key aspects. The goal of this study was to develop a sample preparation method for wastewater samples, which removes natural organic matter without altering the properties of microplastics. Three protocols, based on KOH, H2O2, and Fenton reactions, were chosen out of ten protocols after a literature review and pre-experiments. In order to investigate the effects of these reagents on seven polymers (PS, PE, PET, PP, PA, PVC, and PLA), this study employed µFTIR, laser diffraction-based particle size analysis, as well as TD-Pyr-GC/MS. Furthermore, the study discussed issues and inconsistencies with the Fenton reactions reported in the literature in previous validation efforts. The findings of this study suggest that both H2O2 and Fenton reactions are most effective in terms of organic matter removal from microplastic samples while not affecting the tested polymers, whereas KOH dissolved most PLA and PET particles.

1. Introduction

The first studies regarding microplastic contamination in oceans appeared in the 1970s and since then, interest in the topic has been rapidly growing, especially in recent years [1,2]. Microplastics are defined differently in the literature, either as plastic particles smaller than 5 mm, or smaller than 1 mm [1,3,4,5]. Due to the difficulty of monitoring microplastics in the environment, even decades later there are still not enough data to obtain a full picture of microplastic contamination [2]. The difficulty in assessing microplastics in the environment lies in distinguishing microplastics from the complex mixture of natural organic and inorganic particles in any given environmental matrix. These can be, for example, inorganic particles like sand and silt, but also organic particles originating from biofilms, plant, and animal debris [6]. Even with the advent of modern analytical methods such as Fourier-transform infrared spectroscopy (FTIR) and Raman spectroscopy, a natural matrix can still hinder the detection of microplastics or at least increase the error factor considerably. Therefore, appropriate sample preparation steps are necessary.
Inorganic matter is usually separated from microplastics by using density differences. Common microplastics have a density close to that of water (0.83–1.1 g/cm3), whereas most inorganic constituents have higher densities. Using a concentrated salt solution, such as sodium chloride (NaCl) or sodium iodine (NaI) solutions (with density of 1.2 and 1.8 g/cm3, respectively), microplastics and inorganics can be separated based on the difference of their respective densities [7,8].
On the other hand, organic matter has a similar density to microplastics and cannot be separated based on density differences [8,9]. Thus, a matrix rich in organic matter, such as biosolids, wastewater effluents, or streambed sediments, needs to be treated via chemical digestion protocols such as oxidative, acidic, alkaline, as well enzymatic digestions [8]. However, the use of strong chemical reagents can inadvertently affect the characteristics of the microplastics being analyzed [7,10]. Although enzymatic digestion protocols are usually safe for microplastics, they require long digestion times, which limits their applicability [7]. To date, there are no standardized sample preparation methods. This is one of the main factors limiting the comparability between various efforts to monitor microplastics in the environment [7].

1.1. Sample Preparation Methods for Removing Organic Matter

Oxidative digestion methods are common in the literature, most of which are protocols utilizing hydrogen peroxide (H2O2). It was utilized under various conditions with different concentrations (15–35%), temperatures (room temperature up to 70 °C), and reaction times (a few hours to a week) [7,11,12,13,14]. Table A1 summarizes the hydrogen peroxide protocols used in microplastic studies and the effects on both organics as well as polymers [7,11,12,13,14]. In general, it can be observed that hydrogen peroxide provided effective digestion and little degradation in polymers when using lower temperatures (up to 60 °C) and/or shorter reaction times (up to 24 h). Therefore, hydrogen peroxide was identified as a viable candidate to be investigated in this study.
Fenton reaction is a viable alternative to hydrogen peroxide, as it usually requires lower reaction times [15,16,17]. Similar to the situation with hydrogen peroxide, Fenton reactions were applied differently in the literature. The utilized reaction times varied from 20 min to 24 h, depending on the applied protocols [17,18,19]. Table A2 summarizes some of the Fenton protocols used in microplastic studies [7,15,16,17]. There, it can be observed that Fenton can provide effective digestion, while causing minimal effects on the investigated microplastics. Therefore, Fenton was considered as a candidate to be investigated in this study.
Acid-based digestion methods, such as hydrochloric acid (HCl) and nitric acid (HNO3), have been traditionally used to digest biological samples such as fish tissues [11,20,21]. Studies reported that some polymers are sensitive to acids and might be affected or dissolved during treatment [12,13,21,22,23,24,25]. Table A3 summarizes some of the acid-based protocols used in the literature [11,12,13,20,21,22,25]. Some acid digestions were tested in pre-experiments in this study (SI Section S1.1), where they were found to result in microplastics deterioration. Based on this and reports from the literature about the degradation of several polymers, acid-based digestions were excluded from this study.
Alkaline treatments, such as potassium hydroxide (KOH) and sodium hydroxide (NaOH), were also often used for biological samples [11,13,22,25,26,27,28]. Some studies reported that alkaline digestion might cause discoloration or damage to the investigated microplastics, especially NaOH [27,29]. On the other hand, Hurley et al. [7] tested a digestion method with 10% of KOH at 60 °C, and achieved around 57% removal of organic matter from sludge, while observing minimal changes of the microplastics tested. Table A4 summarizes some of the alkaline-based protocols used in the literature [7,11,13,22,25,26,27,28,29]. Alkaline digestions were tested in the pre-experiments performed in this study (SI Section S1.1), and a protocol based on KOH (10%) was selected as a possible candidate to be investigated further.
Finally, enzymatic digestions can be an alternative to chemical digestions, especially for biological tissues such as those from fish or plankton [25,27]. They have also been used in conjunction with other treatment methods to treat wastewater samples [30]. The problem with such protocols is usually the long period of time (days) required for complete digestions. In addition, applying this digestion can be expensive or might be incomplete, especially for wastewater samples, which can require a follow-up application of other chemical reagents for a complete digestion [7]. For this reason, enzymatic digestions were excluded from this study, as a rapid reaction and efficiency were key attributes desired in the protocol selection.

1.2. Parameters Used in Microplastic Monitoring

An important goal when analyzing microplastic particles found in environmental samples is the determination of size and abundance [31,32,33]. Chemical digestion methods might dissolve microplastic particles and cause a general decrease in their size or a loss of particles under a certain size range. This would cause an underestimation of the microplastics and represent serious consequences for the conclusions of some studies. Furthermore, identifying polymer types is also desirable during microplastic monitoring and often involves specific pyrograms from gas chromatography coupled with mass spectrometry (GC-MS), or spectra from Fourier-transform infrared spectroscopy (FTIR). An improper digestion method might interfere with these specific pyrograms/spectra and hinder unambiguous microplastic identification. Therefore, it is important that the selected chemical digestion method neither alters the size of the investigated particles, nor interfere with their identification.

1.3. Research Objectives and State-of-the-Art

The objective of this study was to investigate the most common sample preparation methods for isolating microplastic particles from organic matrices, as well as to discuss the inconsistencies that have been identified in different studies. Then, this knowledge was used to develop and validate sample preparation methods to extract microplastics from wastewater samples, without effecting the important identifying parameters for microplastics that were discussed in the previous section.
Several recent studies have already attempted to validate sample preparation methods for microplastics [7,8,11,15,17,22,26]. However, these studies contained one or more of the following shortcomings: (A) working with larger microplastic particles (>500 µm) due to easier handling and analysis [7,15,22,26]; smaller particles have a larger surface area to volume ratio and might be far more susceptible to unintended effects from the chemical reagents used in sample preparation. (B) Using a small number of microplastic particles, which can limit the statistical significance of the findings [7,11,17,22,26]. (C) When using FTIR to compare the IR spectra of microplastic particles before and after exposure to the chemical treatment. It is common to compare the spectra of treated particles against their reference spectra to observe any changes. However, due to easy handling, reference spectra are often obtained in attenuated total reflection (ATR) mode, while for environmental samples, usually FTIR microscopy (µFTIR) spectra are used [7,8,15,17]. These modes of analysis do not always yield the exact same results, thus, they cannot be used interchangeably. Some FTIR researchers mentioned that ATR and µFTIR spectra differ from one another due to different beam penetration depths [34]. However, this has never been addressed in studies concerning microplastics, where the practice of obtaining reference spectra using ATR and comparing it to µFTIR spectra of the treated environmental sample is very common. This can lead to confusion in spectra interpretation if not addressed. (D) For studies implementing a digestion protocol based on the Fenton reaction, handling of the large amounts of precipitated iron (III) particles usually is not mentioned. This phenomenon can negatively affect microplastic detection by covering the entire sample with a layer of iron (III) particles. (E) Finally, studies reported completely different behaviors and contact times for the Fenton reaction [7,15,16,17,18,19]. Some studies even reported reaction times up to 24 h [19], which seems unlikely in terms of reaction kinetics, as the Fenton reaction forms hydroxyl radicals, which result in diffusion limited reaction rates. Thus, the process should be rapid. Lastly, studies like Masura et al. [16] heated the reactants to 75 °C, which is surprising as the Fenton reaction is exothermic and sometimes, cooling is recommended to protect polymers from excessive temperatures [7].
To allow a comprehensive validation and to consider the shortcomings of the mentioned previous validation efforts, the experimental design in this study was adapted accordingly: (A) Microplastic particles with sizes between 80–330 µm were selected. (B) For size distribution analysis, depending on the microplastic type, approximately 4 × 10³–2 × 10⁵ particles were investigated. (C) µFTIR analysis was applied to both the reference and treated microplastic particles in order to minimize bias in interpretation. (D) The Fenton reaction as a possible digestion method for microplastics was further investigated by adapting the protocol from Tagg et al. [17] and refining it to address the issues associated with the precipitation of iron (III). (E) Finally, an experimental setup was dedicated to investigating Fenton reaction kinetics. This was intended to elucidate the reasons behind the discrepancies and long reaction times required for the Fenton reaction, as reported in some studies [15,19].

2. Materials and Methods

2.1. Selection of Sample Preparation Protocols

Ten feasible sample preparation protocols were selected based on a comprehensive review of the peer-reviewed literature [7,14,17,21,27,35,36,37]. They were then investigated in pre-experiments using 250 µm PS-particles (BS-Partikel, Mainz, Germany) and an optical microscope (Axioplan 2, Carl Zeiss AG, Oberkochen, Germany) to assess visual changes to the particles’ surface. For further details, refer to Supplementary Materials Section S1.1.
Furthermore, questionnaires were sent to the project partners within the research consortium ‘Plastic in the Environment’ sponsored by the German Federal Ministry of Education and Research, to gather more information about the most common methods utilized to digest environmental samples. The findings from these reviews along with observations from the pre-experiments resulted in a final selection of three methods for further testing. An overview of the selected protocols is provided in Table 1. Furthermore, a workflow for applying the protocols to real sludge/wastewater samples is provided in Figure 1.
In case other sample volumes are used than what is specified in Figure 1, the ratios of reactants should be kept the same. For KOH and hydrogen peroxide protocols, the ratio of reagent to sample is 10:1. As for Fenton, the ratios can be back calculated from the procedure described in Figure 1. Alternatively, a scaling factor (K) is utilized to achieve this goal; a complete explanation is given in the Supplementary Materials Section S1.2.

2.2. Materials

Seven different polymers were used in this study: Polystyrene (PS), low density polyethylene (LDPE), polyvinyl chloride (PVC) (Ineos, London, UK), polypropylene (PP) (Borealis, Vienna, Austria), polyethylene terephthalate (PET) (TPL, Zurich, Switzerland), polyamide (PA) (Lanxess, Cologne, Germany), and polylactic acid (PLA) (Nature Works, Minnetonka, MN, USA). The particle sizes for all polymers were between 80 and 330 µm (detailed information in Supplementary Materials Table S2).
Ultra-pure water (UPW) was produced using an arium® pro VF (Sartorius, Göttingen, Germany) with an ultra-filter and used for all steps. Hydrogen peroxide (H2O2) (30%) was purchased from Merck, Germany and Carl Roth, Karlsruhe, Germany. Different batches were tested (ISO/Ph.Eur. stabilized; for synthesis, stabilized, Carl Roth, Germany and VWR, Germany) to observe the impact of the different manufacturing standards of hydrogen peroxide quality on Fenton reaction kinetics. The ferric sulfate (FeSO4) catalyst was prepared using FeSO4 7H2O (Merck, Germany), which was weighed and dissolved in UPW and the pH was subsequently adjusted to 3 using sulfuric acid (H2SO4, 0.5 M; VWR, Germany). Potassium hydroxide (KOH, 10 wt%) was prepared from dissolving pure KOH pellets (Merck, Germany) in UPW. To minimize contamination by foreign particles, all reagents were filtered prior to application, using 0.2 µm syringe filters.
Sample filtration was performed using a vacuum filtration unit made of glass (DURAN, Mainz, Germany). The filters used were track etched polycarbonate filters, 25 mm in diameter with a pore size of 0.2 µm (PCTE, unsterile, Carl Roth, Germany). For rinsing glass apparatuses and producing stable microplastic suspensions, 0.1% (v/v) of the surfactant Tween 20 (Merck, Germany) in UPW was utilized (Supplementary Materials Section S1.5).

2.3. Contamination Mitigation and Quality Assurance

To ensure minimal airborne microparticle cross-contamination, all experiments were conducted in a laminar flow box (Laminar Flow Module FMS series SuSi, Spetec, Erding, Germany). The samples were handled outside of this setup only when weighing the microplastics. During this process, the samples were always covered with aluminum foil to prevent cross-contamination. Lab coats made only out of cotton were worn at all times to avoid plastic fibers contaminating the samples.

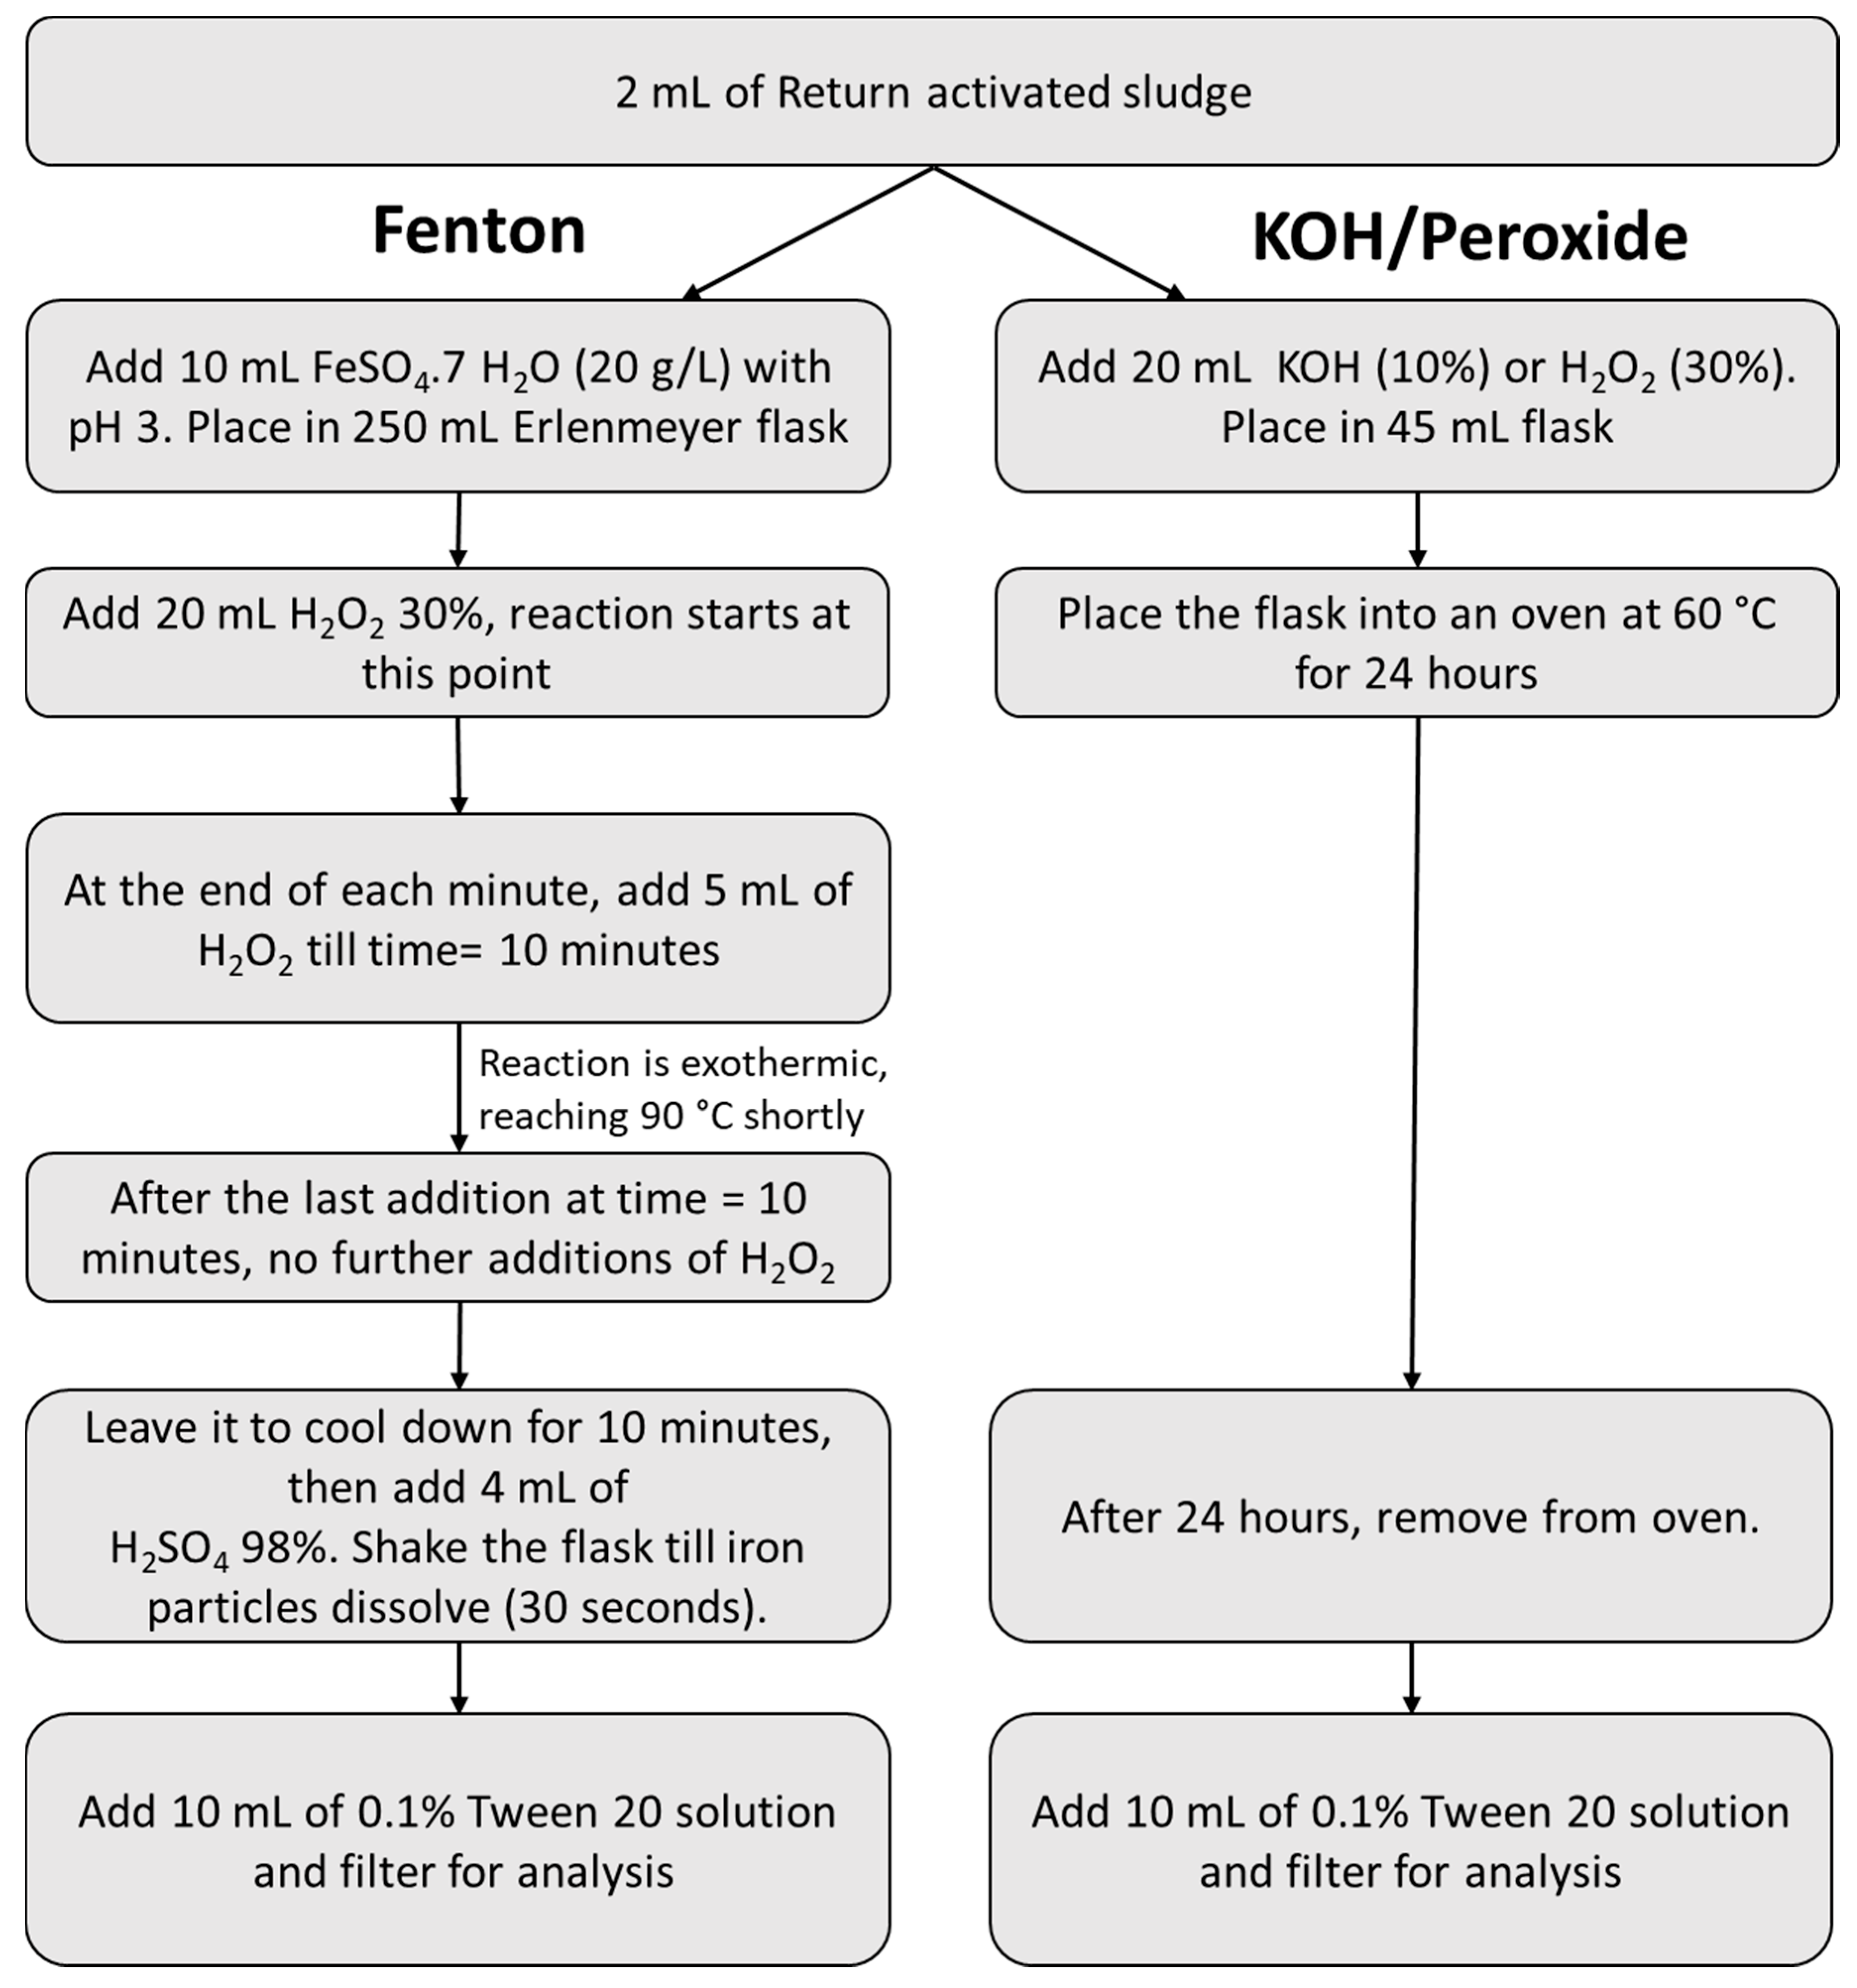
2.4. Investigating the Discrepancies in Fenton Reactions

The authors of the current study were perplexed by the widely different Fenton reaction kinetics and behaviors reported in the literature, and the lack of discussion thereof [7,15,16,17,18,19]. The Fenton reaction is exothermic and should not require any external heating to exceed temperatures of 40 °C [38]. This was in accordance with the pre-experiments performed in this study, as well as reactions described by Hurley et al. [7] and Tagg et al. [17], where the digestion reactions with organic matrices were quick, needing merely 20 min to complete, and required cooling to prevent them from exceeding 40 °C. On the other hand, some studies mentioned reaction times up to 24 h, or described heating the reactants externally to 75 °C [16,19].
To investigate if the source of those discrepancies is somehow related to the various manufacturing processes used to produce hydrogen peroxide, identical H2O2 concentrations (30%) were used, albeit from five different commercially available batches: (i) Hydrogen peroxide 30%, stabilized, (Perhydrol®) EMSURE® ISO analytical reagent, Supelco® (Merck, Germany), (ii) Hydrogen peroxide 30% ROTIPURAN® p.a., ISO, stabilized (Carl Roth, Germany), (iii) Hydrogen peroxide 30%, Ph. Eur, stabilized (Carl Roth, Germany), (iv) Hydrogen peroxide 30% for synthesis, stabilized (Carl Roth, Germany), as well as (v) Hydrogen peroxide 30% stabilized, EMPROVE® ESSENTIAL Ph. Eur., BP, USP, SAFC® (Merck, Germany).
The Fenton protocol was performed identically with each one of these batches of hydrogen peroxide. No microplastics were used in these experiments, as the investigation was concerned merely with the kinetics and general behavior of the Fenton reaction itself. Thus, samples comprised only the filtered reagents (hydrogen peroxide and iron sulfate); no additional particles or organic matter were added to prevent any unforeseen implications. The reaction was performed as explained in Figure 1 and the Supplementary Materials Section S1.2, with a scaling factor (K) of 2 mL (Supplementary Materials Section S1.2), or simply 2 mL of FeSO4 7H2O2 and 4 mL of H2O2 as starting volumes (Figure 1), resulting in a final total reagents volume of 16 mL. The experiments were performed in duplicates in 100 mL Erlenmeyer flasks. The temperature and pH of the reactions were recorded over time. To understand the effects of thermal dissipation/insulation on reaction kinetics, additional experiments for the selected hydrogen peroxide batches were performed by placing the 100 mL Erlenmeyer flasks on an aluminum bench to simulate a larger heat dissipation condition, whereas plastic centrifugal tubes (50 mL) were used to simulate heat insulation.
Subsequently, the experiments with the 100 mL Erlenmeyer flasks were repeated but a 1.5 × 1.5 cm piece of tissue paper was placed inside each flask and allowed to react as before in order to observe the effects of different reaction kinetics on the removal of organic matter.

2.5. Investigating the Effects of Sample Preparation on Microplastics

To ensure that sample preparation protocols do not interfere with the characterization of microplastic parameters as mentioned in Section 1.2, they were investigated for changes in their size distributions as well as their characterization by µFTIR and Thermal Desorption–Gas Chromatography coupled with mass spectrometry (TD-Pyr-GC/MS), before and after applying the digestion protocols. Table 2 shows the samples that were prepared for these investigations. The samples were prepared in 50 mL glass flasks for Fenton samples, and 10 mL glass tubes for the rest. Polymers were each made as individual samples for all the tests listed below in order to assess the changes to each of them individually.
The temperature controls simulated the maximum temperatures and durations encountered in each of the protocols (60 and 90 °C for H2O2/KOH and Fenton protocols, respectively), and were made for the same exposure times (24 h and 20 min, respectively).

2.5.1. Size Distribution Analysis by Laser Diffraction

Laser diffraction measurements for particle size distribution analysis were conducted using a Malvern “Mastersizer S long bed”, a small volume sample dispersion unit (SVSDU), and a sample disperser, all manufactured by Malvern Panalitycal (UK). In the optical unit, a 2 mW He-Ne laser with 633 nm wavelength, 18 mm beam width, and 2.4 mm beam length, was sent through a 300 RF lens, whose measurement range is 0.05–900 µm. The wet standard scattering model was applied. The refractive index of water was used as the refractive index of the medium. The refractive indices applied were 1.5295 (real) and 0.1 (imaginary) in 1.33 (medium). All measurements were carried out according to ISO 13320:2009-10 [39].
Duplicate samples and controls, each consisting of 200 ± 50 mg for PS, PE, PET, PA, PLA, and PVC as well as 60 ± 15 mg for PP, were used as per Table 2. Each sample was further subdivided into two repetitions to improve the reliability of the analysis. All samples were suspended in 10 mL UPW containing a concentration of 0.1% (V/V) of the surfactant Tween 20, vortexed for 40 s at 2500 RPM prior to analysis and then, poured into the wet dispersion unit. Measurements were only made after waiting for 2 min to ensure full dispersion. The laser was aligned at the beginning of each measuring session. The background scattering was determined before adding the sample aliquots into the SVSDU, which was pre-filled with deionized water and then, stirred for 2 min to ensure proper dispersion in the system. After each measurement, the SVSDU was cleaned with a 0.1% (V/V) Tween 20 solution. The weighted average of each size distribution was calculated to compare the treated samples against their corresponding control samples. Further, the smallest 10th percentile of the size distribution was also compared in order to observe if the smallest particles in the size distribution exhibited more size changes than the average size particles. Finally, to test the statistical significance, the frequency tables from the Mastersizer measurements were transformed to raw data by using the Real Statistics Resource Pack add-in for Microsoft ExcelTM, after which the data were exported to IBM’s SPSS® Statistics package, where a Kruskal–Wallis 1-way analysis of variance (ANOVA) was performed for each polymer type across all treatment methods. These results were subsequently compared against their respective controls with a post hoc analysis. The differences were only considered significant if the probability (p) of the null hypothesis being true was smaller than 0.05.

2.5.2. FTIR Analysis

Samples and controls were prepared according to the protocols listed in Table 2, by weighing 2.5 mg of each of the microplastic types (PS, PE, PET, PP, PVC, PA, and PLA). Samples were then filtered through a gold-coated polycarbonate membrane (diameter 25 mm, pore size 0.8 µm, Analytische Produktions-, Steuerungs- und Kontrollgeräte GmbH, Germany) and measured by µFTIR spectroscopy on an Agilent Cary 620 spectrometer coupled to an Agilent Cary 670 FTIR microscope, equipped with a 128 × 128 pixel Focal Plane Array detector. IR images were measured in reflectance mode at a spectral resolution of 8 cm−1 within a spectral range from 3750 to 800 cm−1 and a number of 30 scans. Before IR imaging, a mosaic photograph of the samples was taken in order to visualize any changes of the particle’s surface morphology (Supplementary Materials Figures S2–S8). For each polymer type and treatment, spectra from ten particles were extracted from the IR image and their average spectra were calculated and normalized to values from 0 to 1. Additionally, further control particles were measured in ATR mode (Germanium crystal) in order to illustrate the differences between the ATR and reflectance µFTIR analysis modes.

2.5.3. Thermal Analysis by TD-Pyr-GC/MS

The TD-Pyr-GC/MS analysis was conducted with a thermal desorption unit (TDU) equipped with a TDU Pyrolysis module, a Multipurpose sampler (MPS) roboticpro, a Cooled Injections System CIS 4 with C506 (all by Gerstel, Mülheim an der Ruhr, Germany), and a 7890B gas chromatograph equipped with a DB-5MS Ultra Inert column in combination with a 5977B MSD mass spectrometer (all by Agilent, Santa Clara, CA, USA). In the first step, the samples were thermodesorbed to analyze volatile compounds at a final thermodesorption (TD) temperature of 200 °C. The sample was then cryofocused in the cooled injection system (CIS) at −50 °C. The desorption mode was split-less. The GC/MS method for the TD step was adopted from Ochiai et al., 2005. [40]. However, the cryofocusing was conducted at −50 °C instead of −150 °C. In the second step, the sample was pyrolyzed with a final temperature of 800 °C, followed by a GC/MS analysis. The mass spectrometer was operated in full-scan mode (m/z range 40 to 550) with electron impact ionization (70 eV). For further details, refer to Reichel et al. (submitted).
Duplicate samples were prepared as per Table 2, by weighing 2.5 mg of each of the microplastic types. The reference particles of the polymers PS, PE, PLA, PET, PA, and PP were analyzed using TD-Pyr-GC/MS: once without treatment (control) and once after applying the sample preparation method. The chromatograms of the TD and pyrograms were compared in order to detect possible changes for the untreated and treated polymers regarding the characteristic pyrolysis products. PVC analysis could not be conducted due to the limitation of the TD-Pyr-GC/MS.

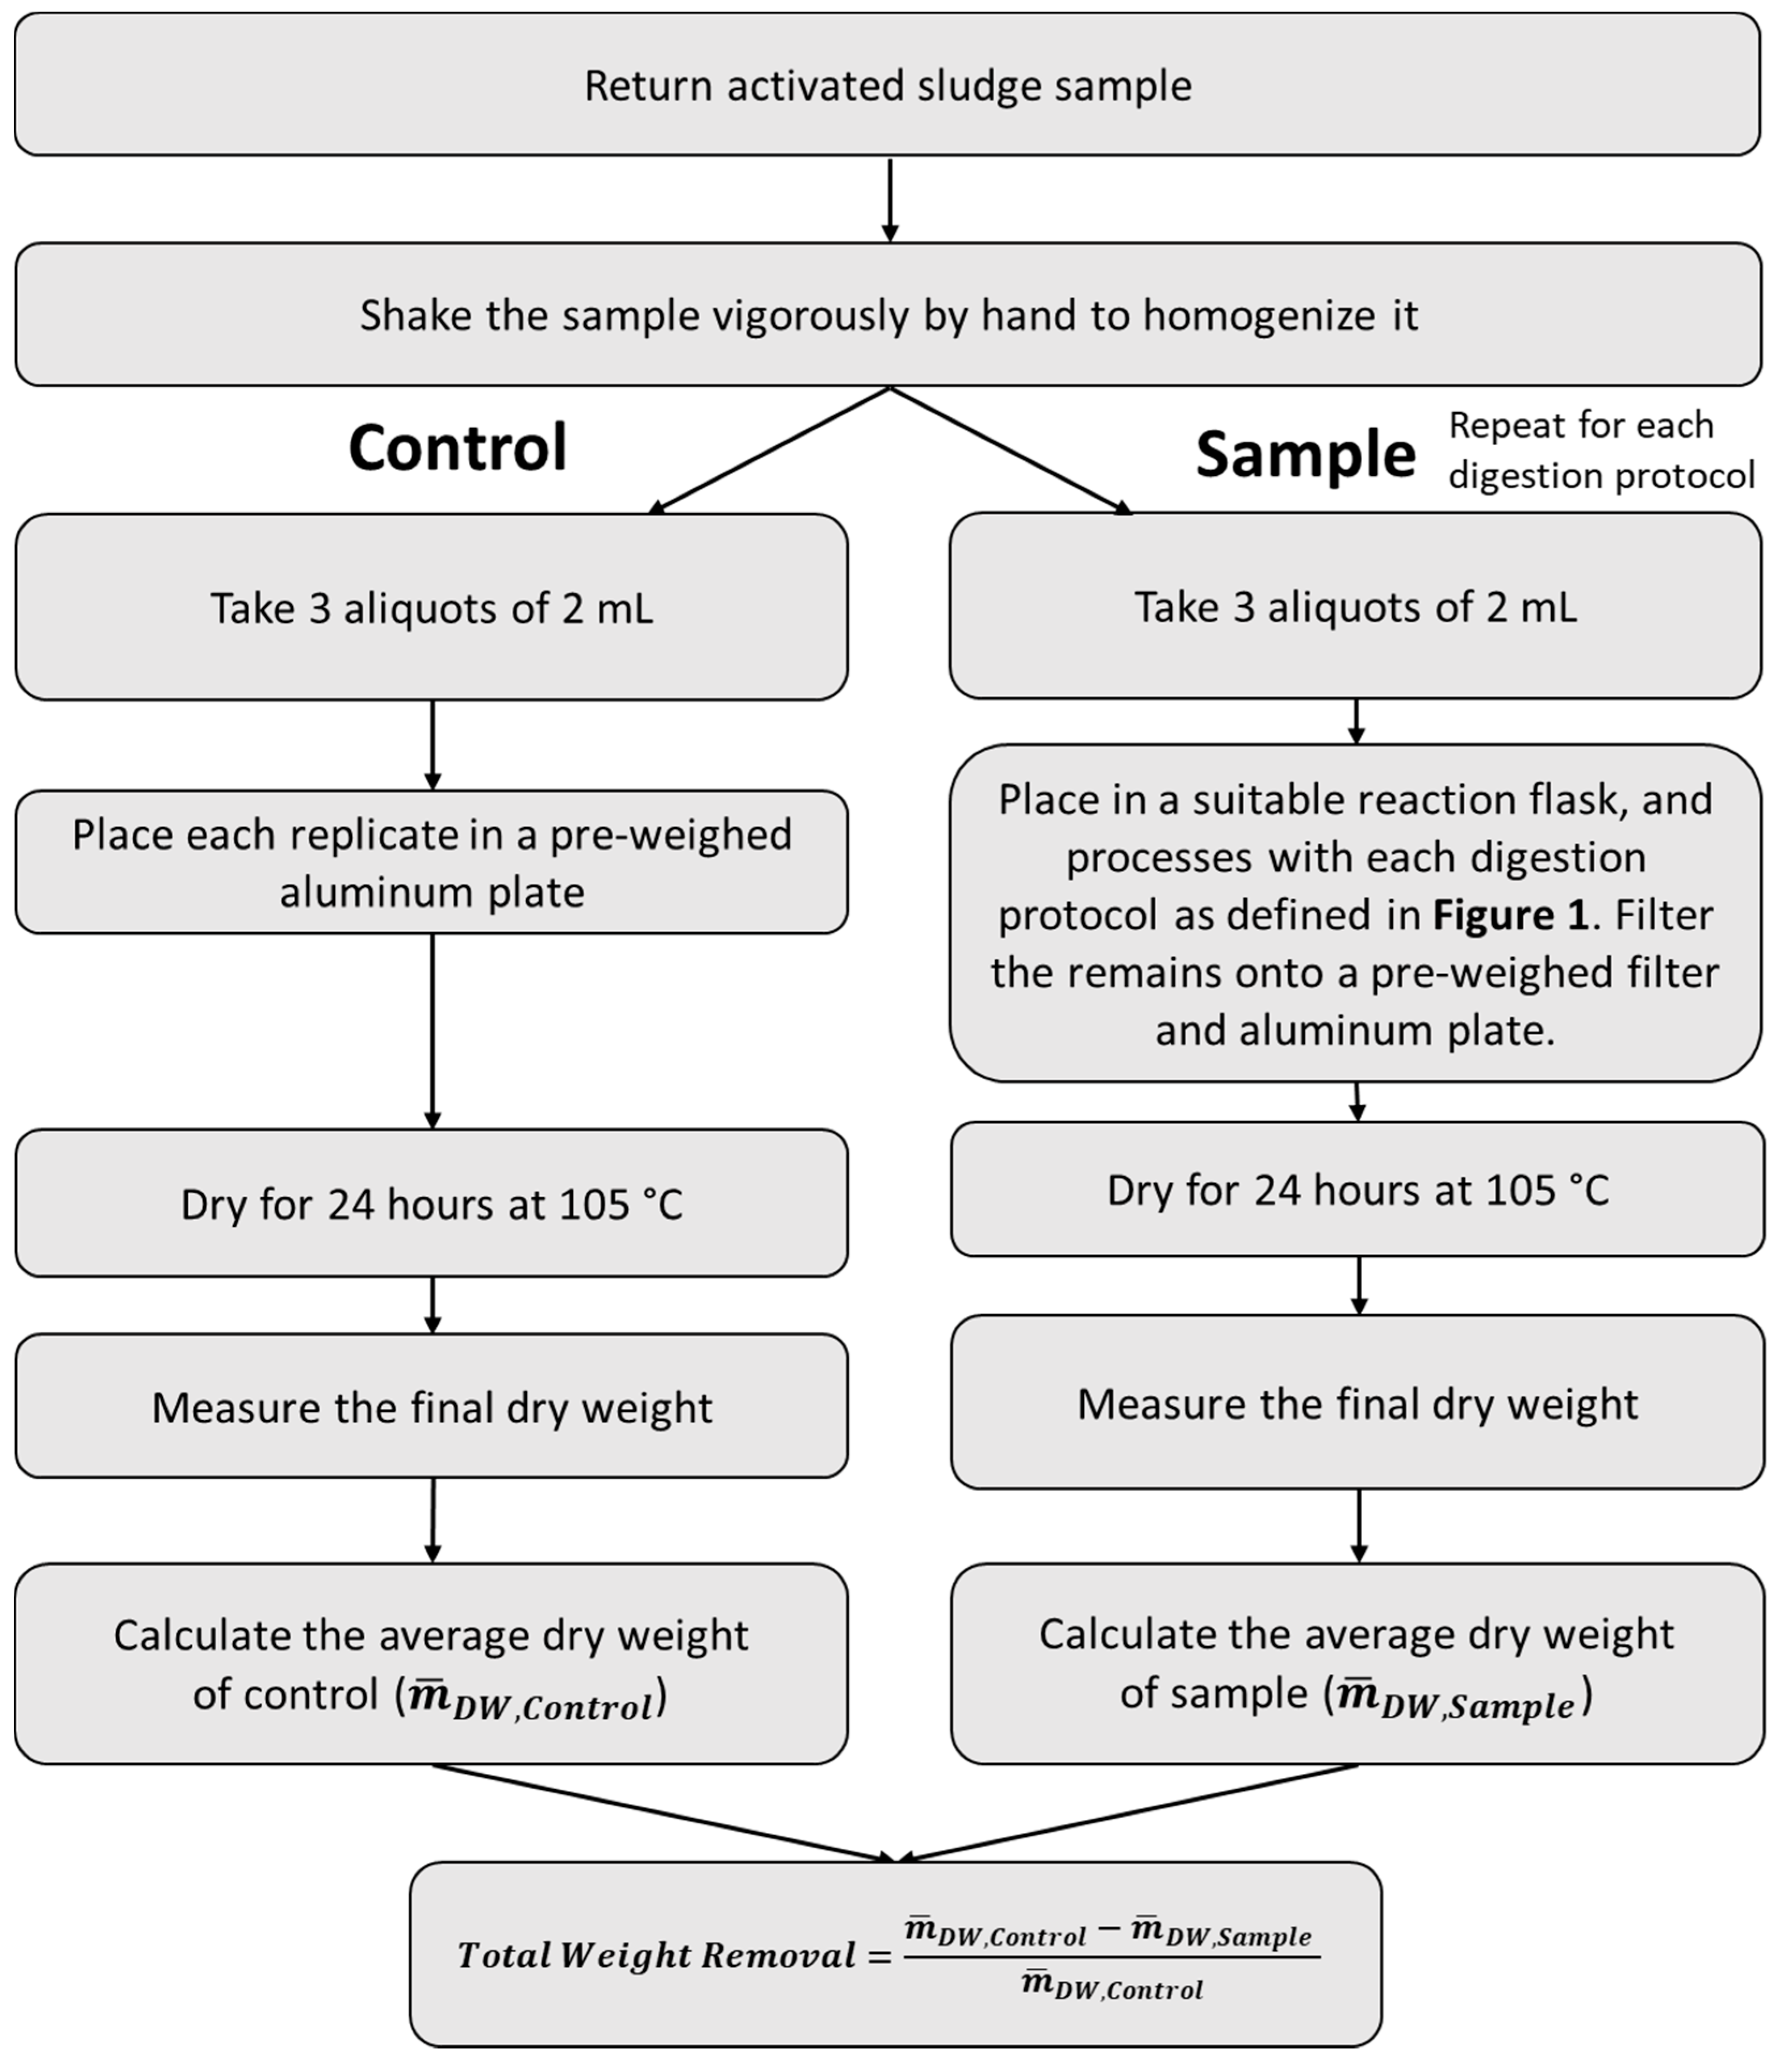
2.6. Determination of the Organic Matter Removal Efficiency from Sludge Samples

Thickened sludge samples were collected from the return-activated sludge (RAS) at a local wastewater treatment plant in the city of Freising, Germany. The organic content of the sludge was first determined via loss on ignition (LOI) by placing it in a furnace at 550 ଌ according to DIN 38409-1:1987-01 [41].
To gravimetrically determine the effectiveness of the three selected protocols, papers such as by Hurley et al. [7] used a procedure where sludge was first dried at 105 °C for 24 h to establish the starting dry weight of the sludge before treatment. Digestion protocols were applied to the dried sludge, and what remained was then filtered, dried, and weighed. The difference in weight between the starting dry weight and the final weight was assumed to correspond directly to the removal of organic matter.
This seemingly logical approach proved to be insufficient and error prone. The pre-experiments in this study revealed that following the aforementioned approach resulted in dried and hardened clay-like material that clumped and did not readily digest via the applied protocols (Supplementary Materials Section S7). Therefore, a new approach was created where the sludge was not dried before treatment; instead, its starting dry weight would be based on a control sample (surrogate). The process was performed in parallel, as shown below in Figure 2.
Finally, the studies assumed that all weight loss from digestion protocols corresponded directly to organic matter removal [7], even though there is a certain number of inorganic and organic constituents that will dissolve during digestion, thus, presenting additional weight loss that could be misconstrued as organic matter removal. This might explain the findings of some studies, like Hurley et al. [7], who reported organic matter removal efficiencies over 100%. To showcase that the total weight loss after digestion may not entirely be due to organic matter removal, ultrapure water was added to 2 mL sludge aliquots. They were then left for 2 h to dissolve readily solvable inorganic and organic fractions, filtered, and subsequently, dried for weight determination. This was done in duplicates, following the workflow described in Figure 2.

3. Results and Discussion

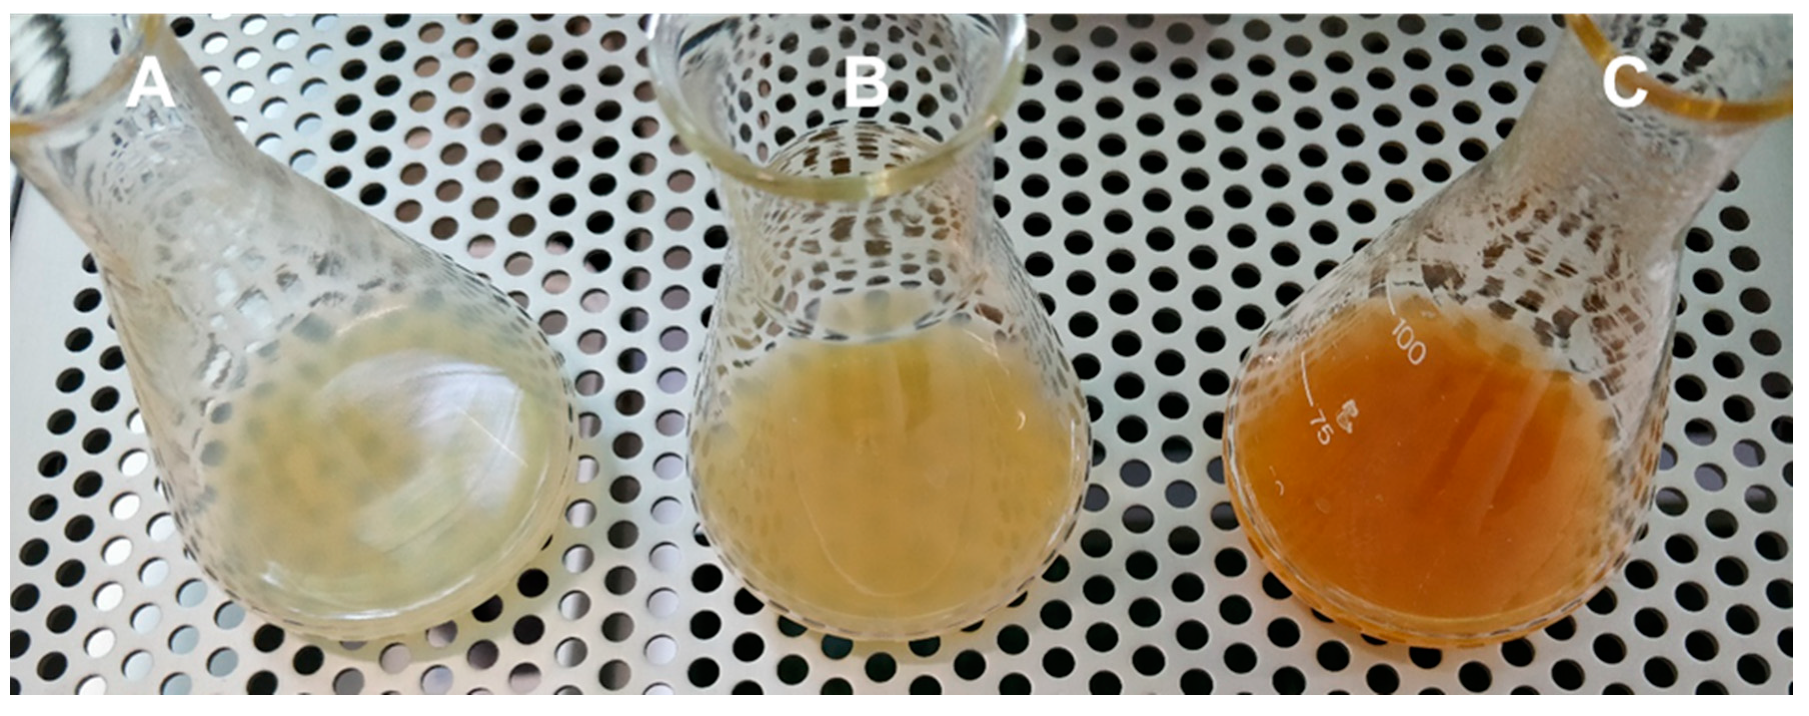
3.1. Discrepancies in Fenton Reactions

The reasons behind the aforementioned surprising descriptions of Fenton reactions in the literature can finally be understood based on the experiments of this study, as two general behaviors for the Fenton reaction were observed, when testing the five aforementioned batches of hydrogen peroxide. These differences occurred despite employing identical protocols and concentrations. To the best of the authors’ knowledge, these different reaction behaviors have not been discussed in the literature before. Thus, it is important to understand the mechanism behind these behaviors. This is important to assure reproducible Fenton-based sample preparation methods. These two general behaviors of the Fenton reaction are subsequently referred to as type I and type II Fenton reactions:
Type I Fenton reaction: This reaction type has been used and validated in this study and can be reproduced when using batches i, ii, iv, and v. Its typical behavior was to start fizzing immediately after mixing the reactants, accompanied by a rapid temperature increase, which peaked at the range of 82–90 °C within 2–4 min, depending on the flask’s thermal insulation, as the reaction reached its maximum intensity. This can be described as a boiling-like behavior and a change in color from an initial dark color to orange due to the formation of iron precipitates. The reaction kinetic showed some variation but it was largely consistent between runs as well as between different hydrogen peroxide batches, as can be seen by the similar maximum temperatures and low standard deviation for the four batches presented in Table 3.
Type II Fenton reaction: This type was observed only when using batch iii of hydrogen peroxide. It typically exhibited a slower reaction kinetic than type I reactions. The initial fizzing was either very weak or missing. Temperatures increased at a lower rate than type I reactions and a critical temperature of 55 °C was needed in order to initialize boiling, which when occurring, would reach 82–90 °C within 7–10 min. However, the reaction was erratic, as can be seen in the elevated standard deviation values of batch iii compared to the remaining batches in Table 3. Identical parallel tests were performing differently, some reaching the boiling phase and others staying below 55 °C and failing to initialize boiling. This was especially true when the Erlenmeyer flasks were placed on the aluminum bench to simulate larger heat dissipation (Table 4). The experiments were repeated with two different bottles of batch iii to ensure that this was not a coincidence.
Surprisingly, type II reactions exhibited much more consistent results when using the more thermally insulating 50 mL centrifugal tubes, consistently reaching 90 ± 0.5 °C within 3–4 min, very similar to the kinetics of type I when performing the same test. This indicates that heat insulation plays a much larger role for type II reactions than it does for type I, which had a very consistent behavior, regardless of the heat insulation of the used reaction flask. The color change still occurred, as was the case with type I, albeit the end color was a light yellow instead of orange, indicating that different iron species could be involved. The reactions that failed to initialize boiling had even less precipitation of iron (III), as shown in Figure 3.
Finally, when using 100 mL Erlenmeyer flasks with tissue papers, type I consistently visually digested the paper at the end of the reaction; a similar result was observed in the tests where type II would initialize boiling. However, when type II failed to reach the critical temperature needed for the boiling phase, the tissue paper was still visibly floating at the end of the reaction (Figure 4). Since the reaction of type II is very unpredictable, it was excluded from this study and was not further validated.
Based on the observations revealed in this study, it is assumed that type II reactions were used in works like Masura et al. [16], where they needed to heat the reactants to 75 °C to exceed the critical temperature discussed above, thereby initializing the boiling phase of the reaction. This can also be seen in the study of Prata et al. [15], who heated the reaction at 50 °C for 1 h. The slower kinetics of type II could also explain the long reaction times in studies like Prata et al. and Flotron et al. [15,19], whereas type I might be the one used in investigations such as Hurley et al. and Tagg et al. [7,17] where no additional heat was needed to start the reaction and reaction times were short.
The formation of iron precipitates during Fenton reactions was not mentioned in microplastic-related studies. This might cause problems during filtration when not addressed (especially for type I), as iron precipitates tended to remain on the filters and covered the microplastics, which would have prevented particle identification. This was solved in this study by adding 5% (v/v) of 98% sulfuric acid at the end of the reaction, which quickly reacted with the precipitating iron species and dissolved them within 30s (Figure 1).
It became obvious that the reaction behavior of Fenton is influenced by the employed batch of hydrogen peroxide. It can be assumed that the stabilization agents added to the hydrogen peroxide are the critical factor for differentiation of the type I and type II reaction behaviors. However, the stabilization agents are not stated by the manufacturers directly and were not further investigated within this study.
The validations performed in this study followed the type I Fenton reaction by using batch (ii) of the hydrogen peroxide for all subsequent validation experiments.

3.2. Investigating the Effects of Sample Preparation on Microplastics

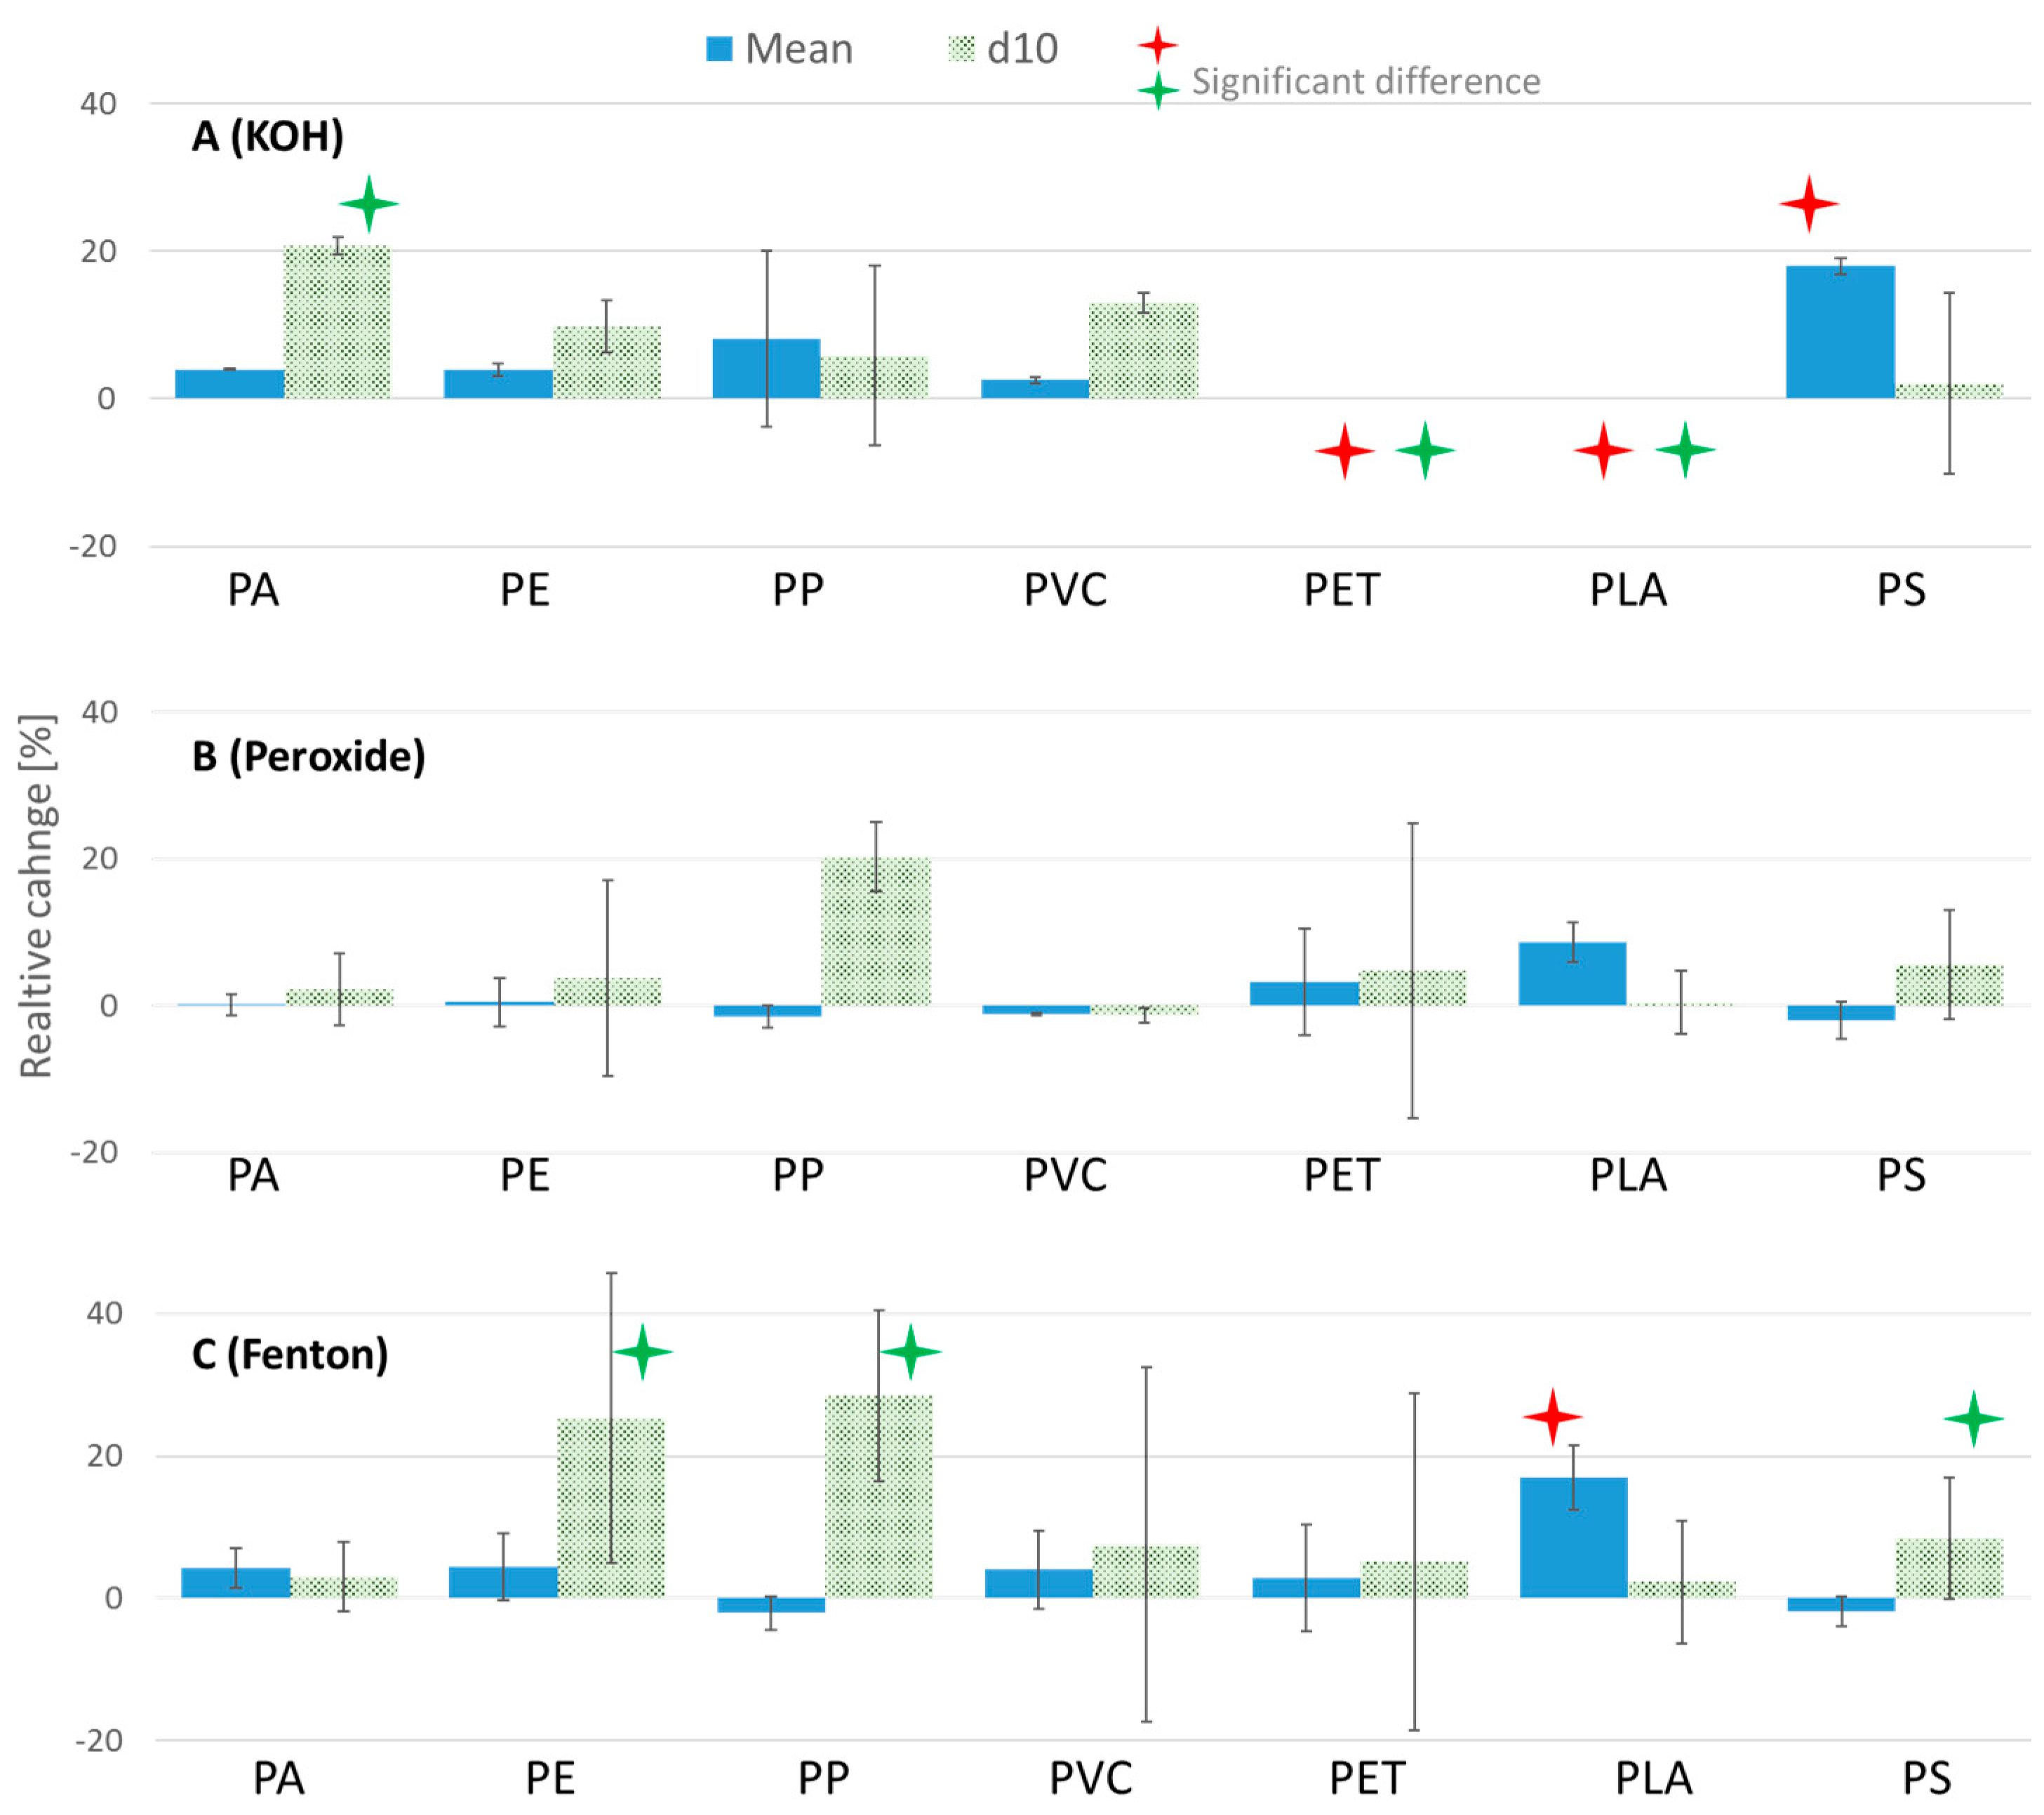
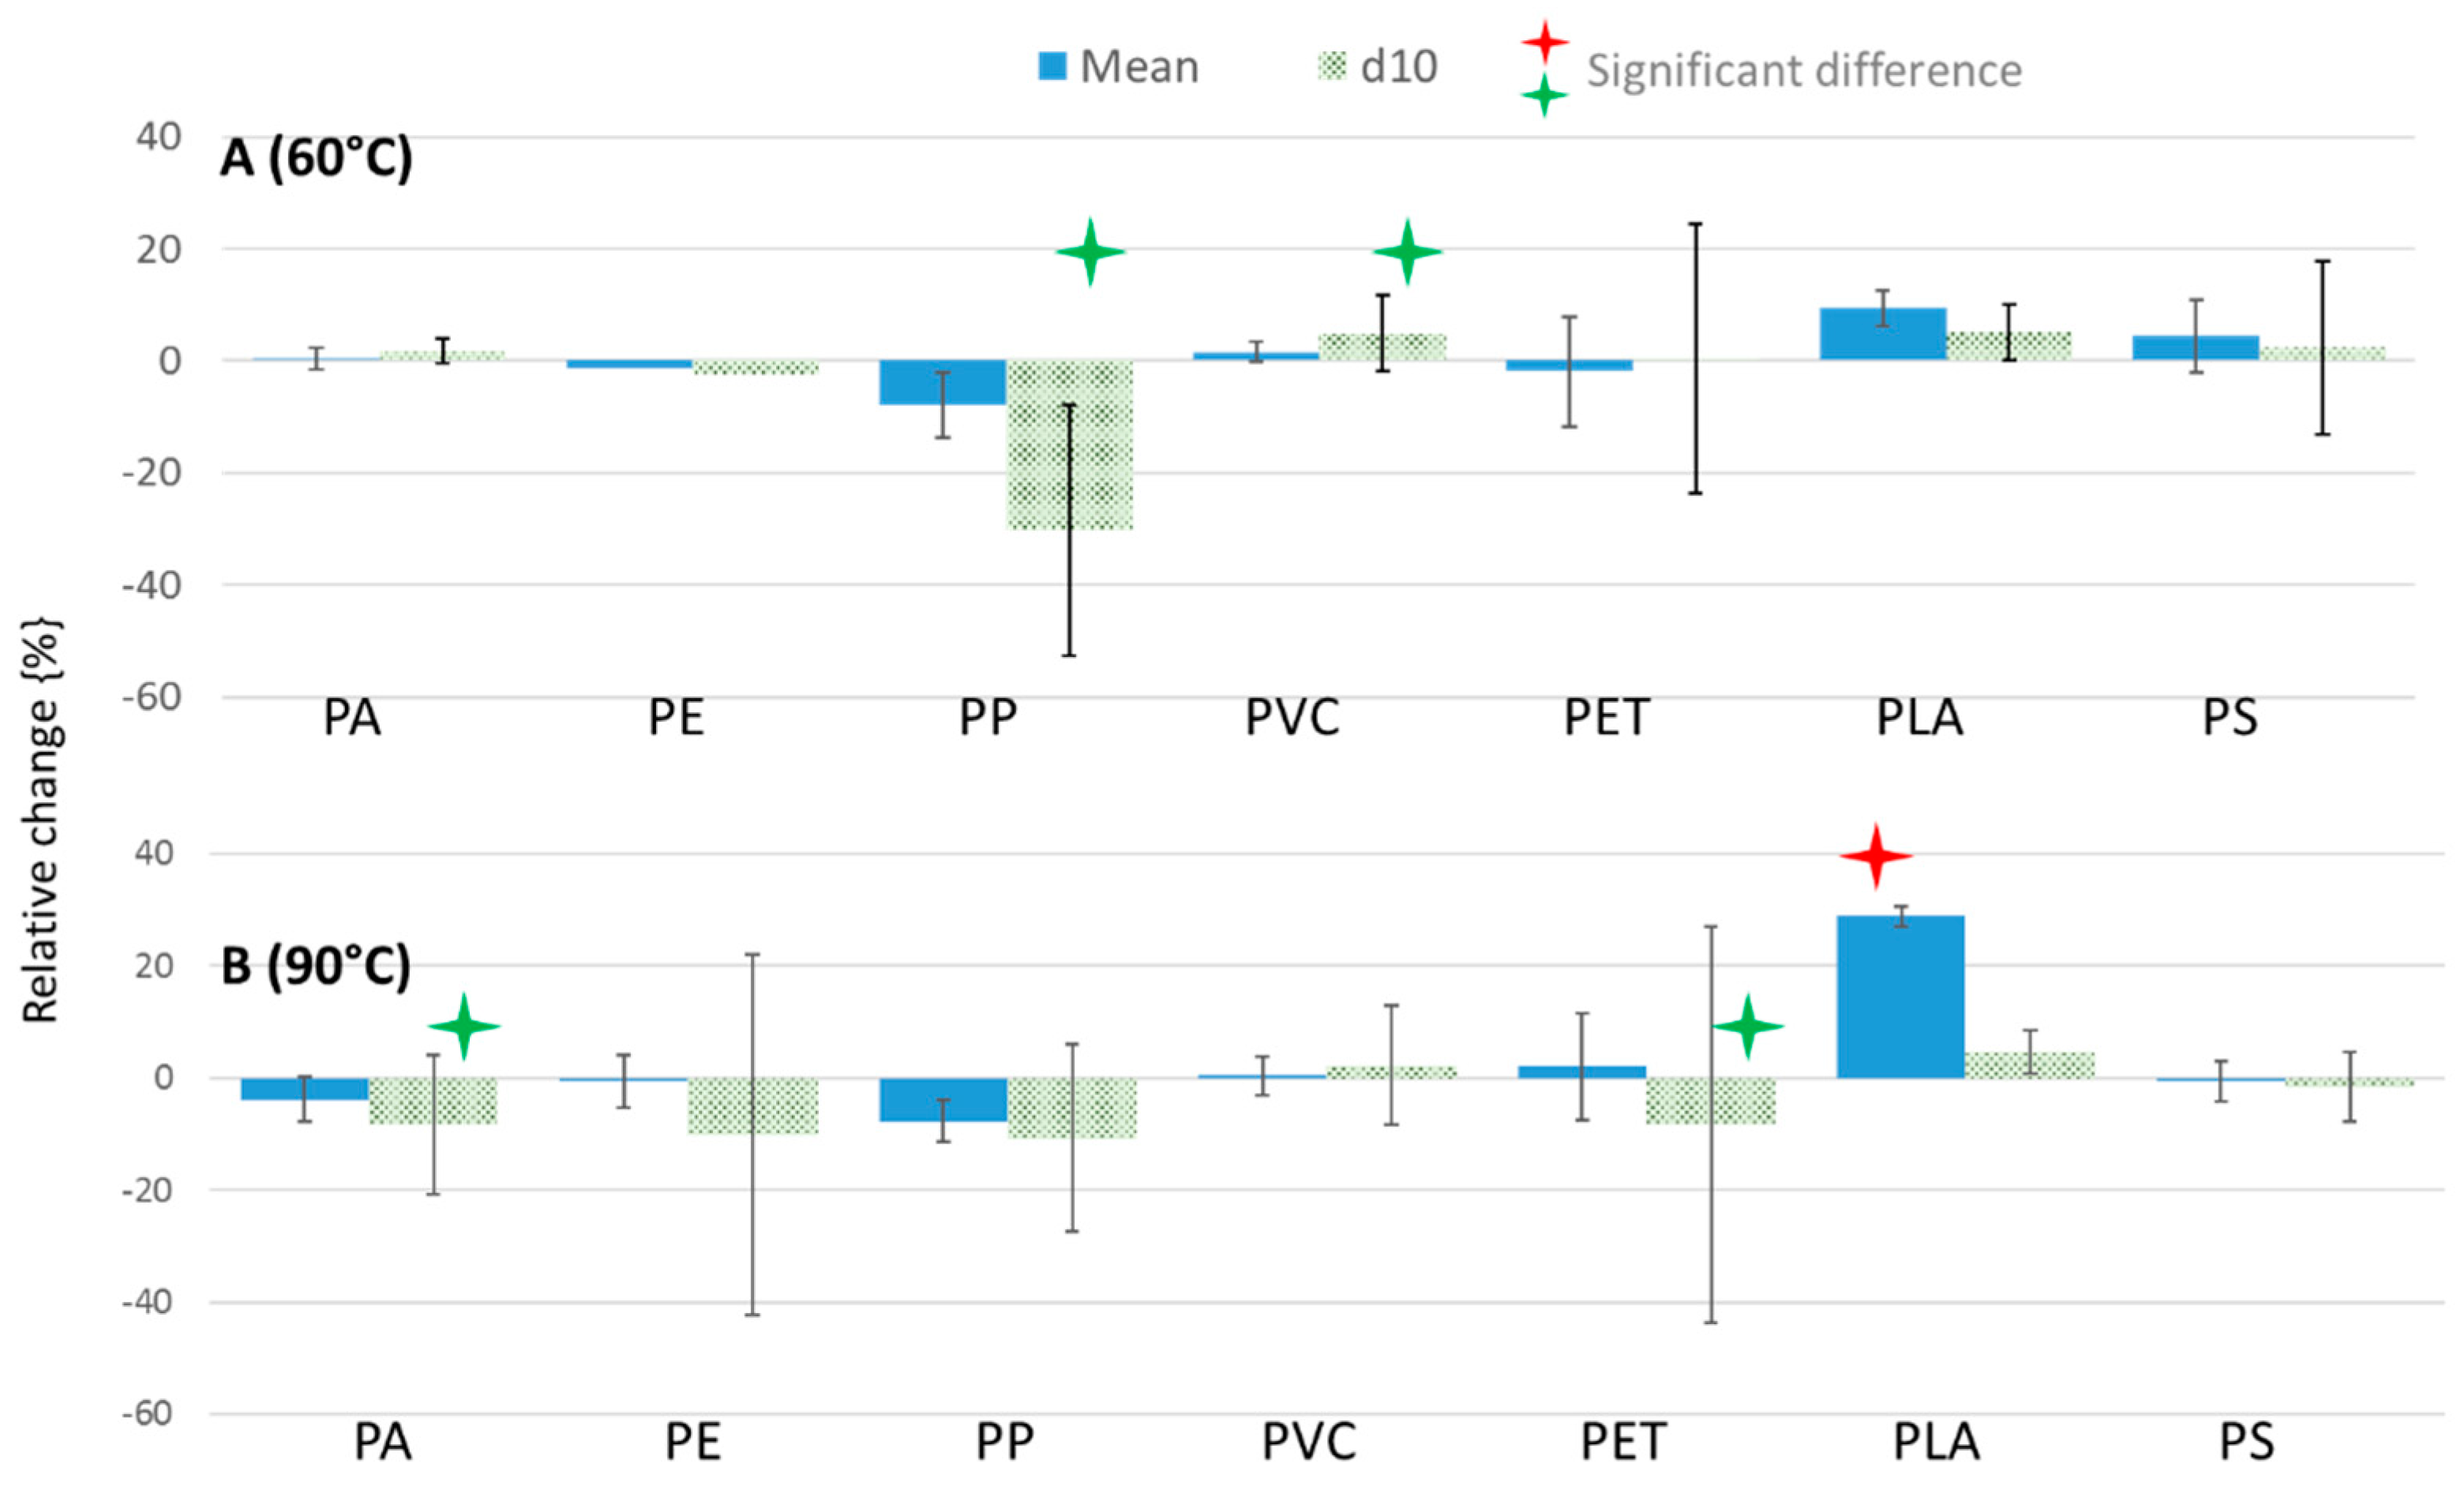
3.2.1. Variation in Size Distribution (Laser Diffraction)

Some polymers, such as PLA and PET, did not tolerate the KOH protocol. Hence, the majority of PET and PLA particles were dissolved after KOH digestion. The remaining few particles in the suspension after digestion did not produce enough signal to be reliably detected. Nevertheless, the resulting signal for PLA still showed a significant reduction in the size of the surviving particles, as can be seen in Figure 5 for PLA. On the other hand, PS exhibited a slight size increase which indicated the formation of a few small agglomerates or swelling. The rest of the polymers showed little to no change after being exposed to KOH. The effect of KOH on PLA, PET, and PS can clearly be seen in Figure 6. The changes were statistically significant after using Kruskal–Wallis post hoc pair tests, with (p = 0.00) for both PLA and PET and (p = 0.006) for PS, both of which are well below the significance value (p > 0.05).
Using a 1 and 10 M NaOH and 60 °C for 24 h, Hurley et al. [7] observed a degradation of PET. They attributed it to the saponification of ester bonds on the polymer’s surface. However, they observed no such effect when using KOH (10%) with the same conditions. Other studies also observed no adverse effect on PET particles when using different KOH protocols [22,29,42]. This might be because the aforementioned studies utilized larger microplastics (>500 µm) which possessed lower surface area to volume ratios, making them potentially less susceptible to the digestion reagents than the microplastics used in this current study. This issue, when coupled with the very small number of particles used in the aforementioned studies, can severely reduce the reliability of their results. As for PLA, no study was found that tested it specifically with the protocols chosen in the current study. However, Kühn et al. [42] tested six biodegradable microplastic particles with 1 M KOH at room temperature for 2 days. The authors observed that PLA particles, derived from biodegradable bags, were completely dissolved after applying the treatment. This agrees with the results found in the current study.
Fenton and hydrogen peroxide protocols both showed no significant changes regarding the size distribution of the tested polymers (Figure 6), with the exception of PLA, which exhibited slight agglomeration tendencies with increased temperatures, especially during Fenton reactions, which can briefly reach 90 °C. This manifested itself as an average size increase for PLA of 8.6% and 16.9% for hydrogen peroxide and Fenton, respectively (Figure 5 and Figure 6). These changes were statistically significant only for Fenton though (p = 0.04). The temperature controls showed a more extreme case with 9.4% and 28.9% size increases for 60 and 90 °C, respectively (Figure 7). The temperature controls for 90 °C even showed a larger statistical significance when compared to the Fenton samples (p = 0). This indicated that indeed, the forming of agglomerates was caused by increased temperatures, possibly by making the particle’s surface sticky, which caused some of the particles to randomly adhere to each other. This is supported by the fact that PLA has a glass transition temperature of around 60 °C, which would cause it to become sticky past this temperature [43]. Still, the changes were not disastrous, and the information about the particles was not lost as a result of melting. Although, when accurate size assessments for PLA are needed, when using these Fenton or hydrogen peroxide protocols, it is recommended to apply a correction to the average sizes to account for these results. This was also the main reason for suspending the particles after treatment in 0.1% Tween 20 solution and vortexing for 40 s before an analysis was made, as it helped to break some of the agglomerates.
In order to understand the effect on smaller particles, the changes to the smallest 10th percentile of the size distribution (D(v,0.1)), abbreviated here as (d10), were investigated. Figure 5 provides a visual representation of d10 (green highlight). The smaller particles can be more susceptible to degradation during treatment because of their larger surface area to volume ratios. Based on the d10 fractions, the tendency for severer size changes on smaller particles could be observed, although the accuracy of the measurement degraded when measuring the smallest 10th percentile. This can be seen in Figure 6 and Figure 7 by the larger standard deviations for d10, compared to the mean size measurements. This might be attributed to the reduction in accuracy in light scattering techniques when larger and smaller particles are present in the same sample, as larger particles scatter the light at larger angles than smaller particles and might cover them.
It can be further inferred from the results presented in Figure 6 and Figure 7 that there are more statistically significant size changes for d10 than when testing the larger particles. However, due to the reduced measuring accuracy of the Mastersizer under these conditions, concrete conclusions cannot be drawn, other than there is probably an increased tendency for smaller particles to be affected by the applied treatments.

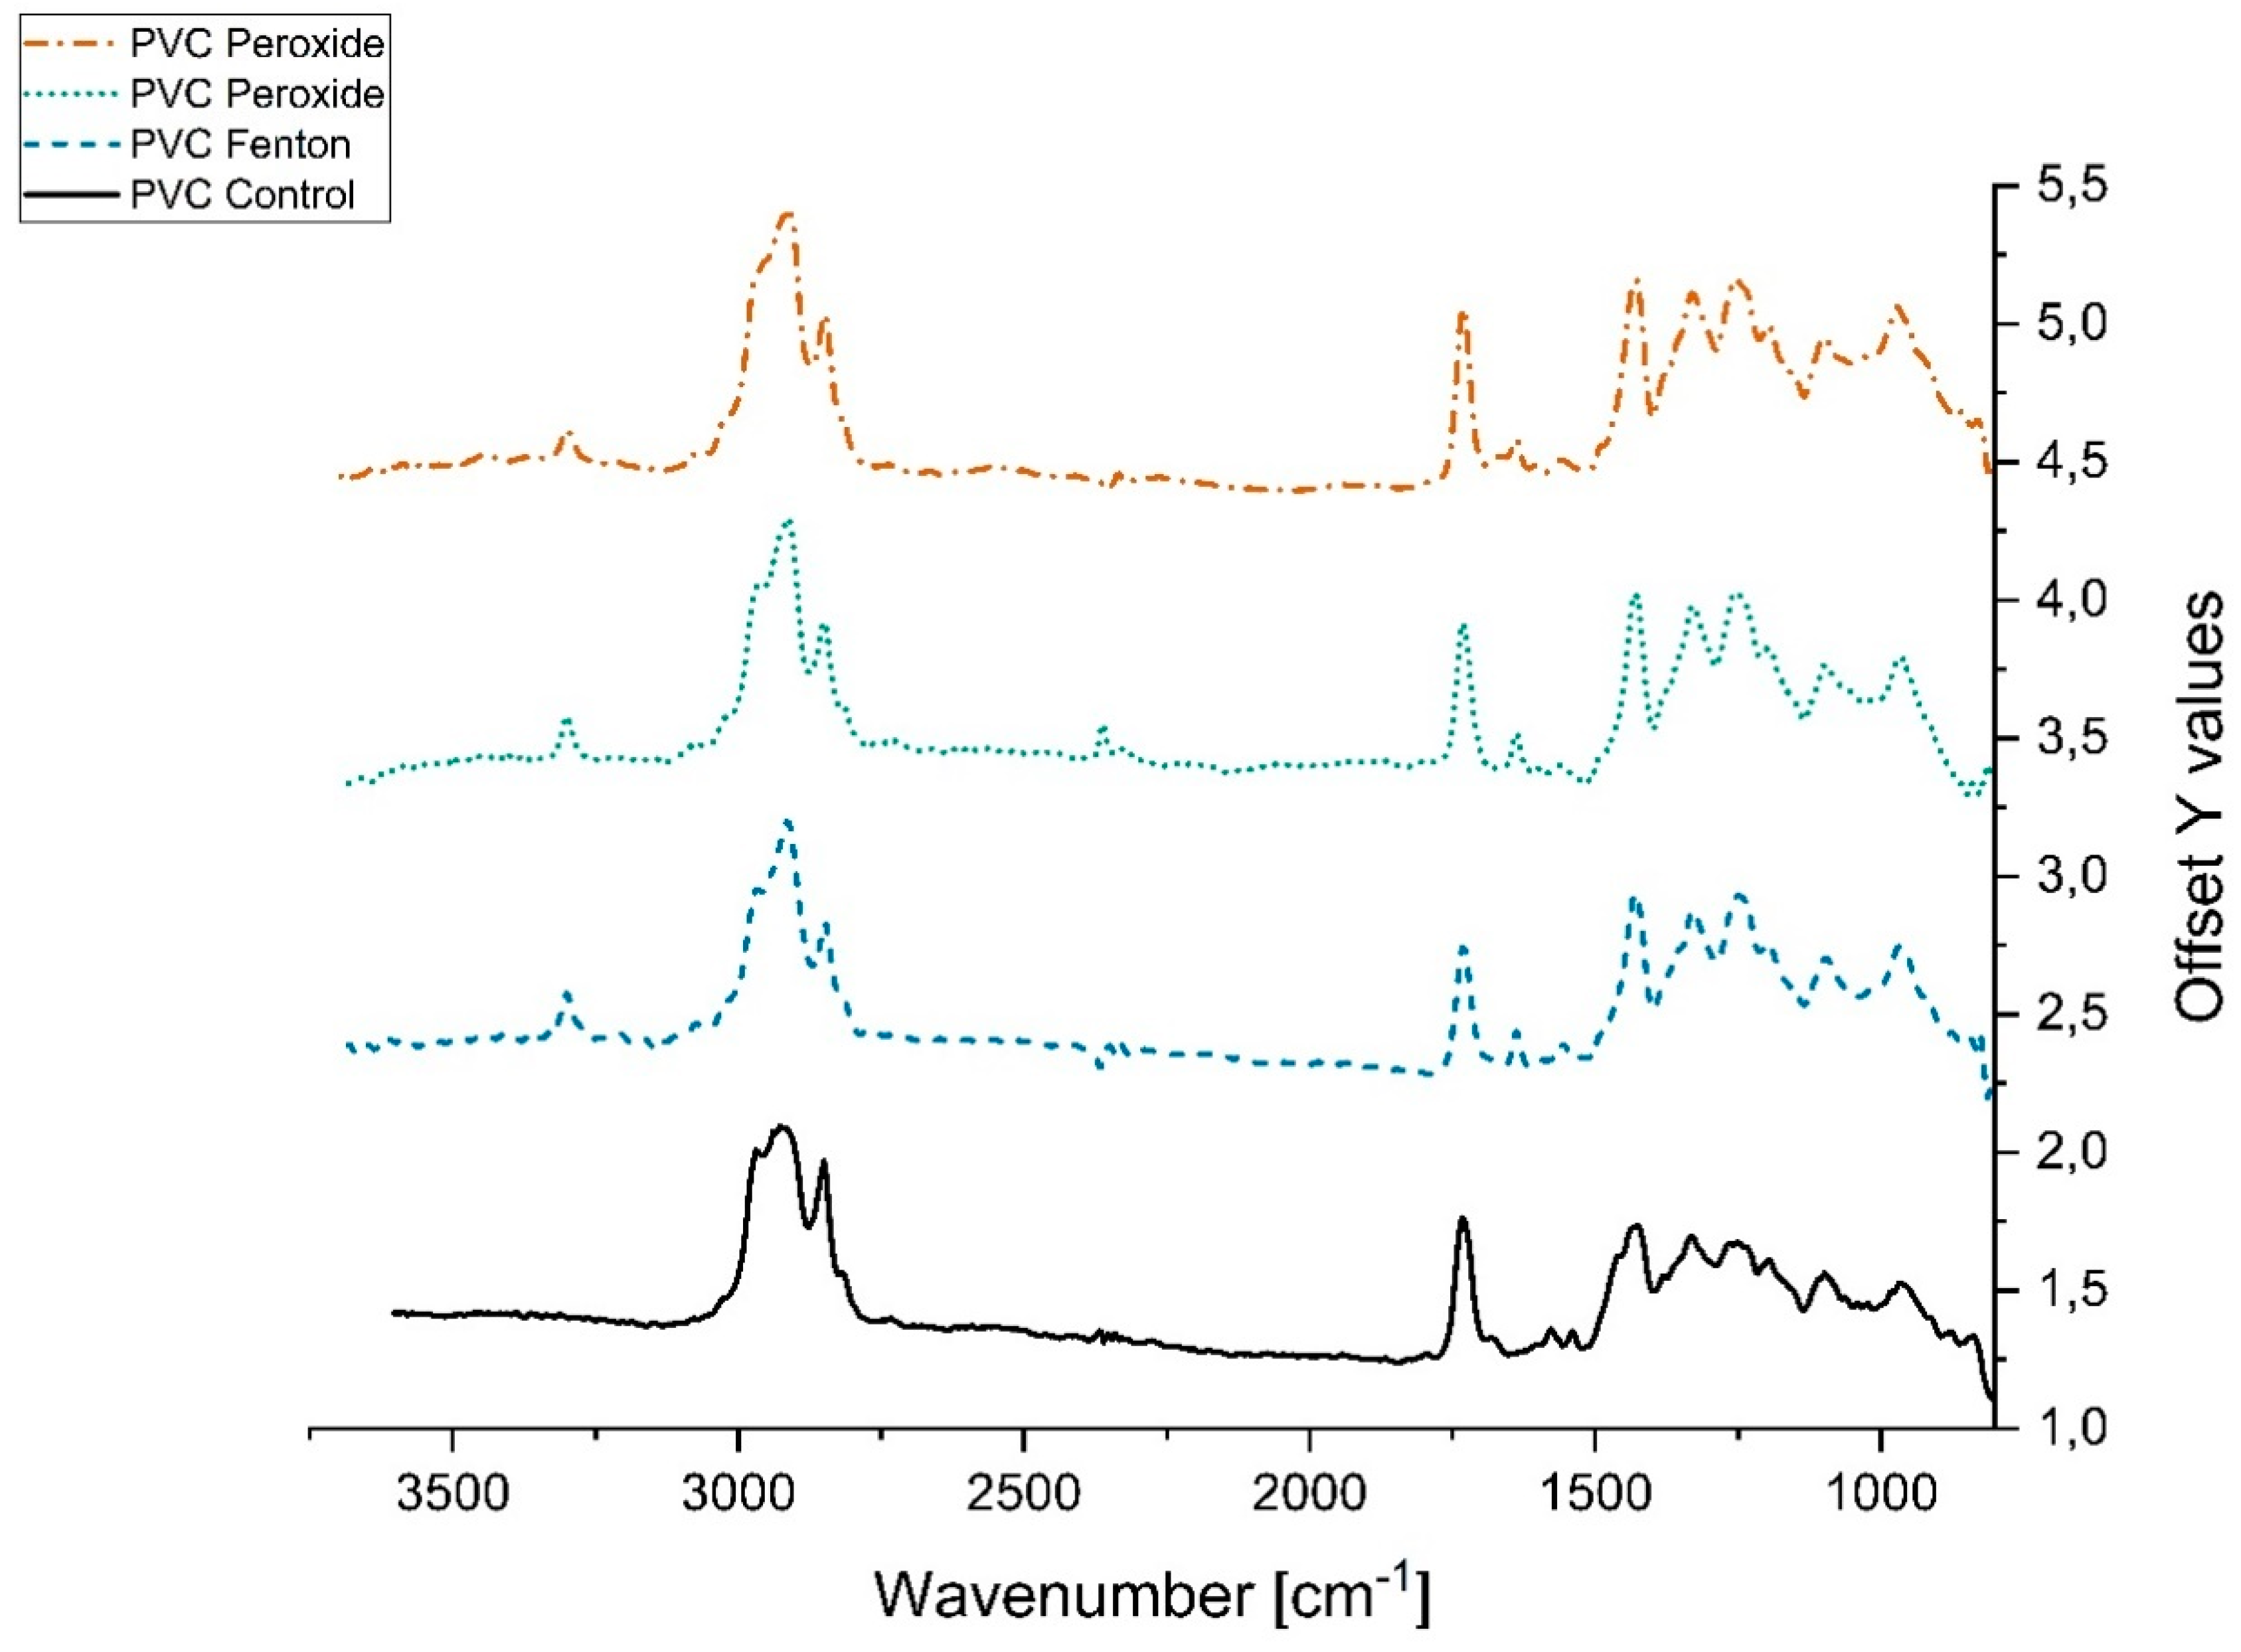
3.2.2. Variation in Infrared Spectra (FTIR)

µFTIR spectra of the treated microplastic particles in general revealed only few alterations compared to untreated (reference) particle spectra (Supplementary Materials Figures S9–S15). Most of the modifications were small and are not suspected to hamper polymer identification.
As discussed for the size distribution experiments, the majority of PLA and PET microparticles were dissolved after the KOH treatment and consequently, their spectra were expected to be altered severely. However, only small changes were observed in the spectra of the few remaining particles after KOH treatment (Appendix A Figure A1 and Figure A2). All treated PLA particles exhibited a relatively narrow band of intermediate strength at 3500 cm−1 (Figure A2). This band was a lot broader in untreated PLA particles. Spectra of KOH treatment induced a weak band at 3650 cm−1 to the PLA spectrum. Both bands indicate that OH groups were formed during sample treatment. Such OH groups were described by Zhang et al. [44] when investigating the infrared spectra of PET.
The spectra of the KOH-treated PET particles (Figure A1) lacked the shoulder present in untreated particles at the C=O band at 1720 cm−1. Additionally, the band at 1945 cm−1, an aromatic C-H bending overtone, was weaker compared to the other samples. This is in accordance with the fact that alkaline hydrolysis can be used in the recycling process of PET [45]. Nevertheless, these changes were quite small and are not suspected to hamper polymer identification.
In PVC, all digestion protocols induced a band at 3300 cm−1, representing the formation of OH groups by the oxidative reagents, indicating a hydroxylation at the surface (Figure A3). In general, the spectral changes observed were small, however, they may lead to confusion for unexperienced users during spectra interpretation. If a spectral range above 3000 cm−1 is considered for polymer identification in a database search, it is recommended to include an altered PVC spectrum into the database. The rest of the microplastics exhibited no changes after the digestion protocols.
It can be concluded that if PLA and PET are among the target polymers for microplastic analysis, samples should not be treated with KOH. It is very likely that the few PLA and PET particles detected in the KOH samples investigated in this study were outliers that used to be much larger prior to the KOH digestion, whereas the vast majority of the particles were too small and dissolved during KOH digestion.
As was mentioned earlier, due to the easy handling, usually attenuated total reflection (ATR) mode is used for validation by researchers. However, ATR is suitable only for clean isolated particles that are big enough to be placed on the ATR crystal individually and therefore, this mode is not applicable for small microplastic particles (<500 µm) from environmental samples. This is where FTIR microscopy (µFTIR) is used instead. The usage of focal plane array (FPA) detectors enables the generation of FTIR images across a big sample area and therefore, reduces measurement time for real samples. Often, studies would use ATR spectra of reference particles to identify the spectra of a sample, regardless whether the latter were obtained using ATR or µFTIR. However, the spectra obtained with the two methods are not perfectly comparable without mathematical correction to account for the wavelength-dependent differences in penetration depth. Because penetration depth decreases with increasing wavenumbers for ATR measurements, the C-H stretch region around 2900 cm−1 exhibits very weak absorption bands. These bands are significantly larger for µFTIR spectra. That is why in this study, particle alterations due to chemical treatment were examined by comparing treated and untreated µFTIR spectra with each other to reduce bias caused by different spectral acquisition modes.
In Figure 8, a µFTIR reflectance mode spectrum of an untreated PET particle is shown in comparison to an ATR spectrum of the same material. Both spectra were normalized. The ATR spectrum is not ATR-corrected, thus, the differences between the spectra are fairly substantial, especially at higher wavenumbers. As was already discussed by von der Esch et al. [46], ATR spectra represent mostly the particle surface because of the low penetration depth compared to µFTIR spectra which, in the lower wavenumbers, penetrate more deeply into the material and therefore, represent the bulk properties of the particle. In manual data evaluation as well as in automated approaches, this can lead to confusion and misinterpretation. It is, therefore, recommended to establish a reference database comprising of µFTIR spectra in transmission and/or reflection mode, depending on the sample measurement method.

3.2.3. Variations in Pyr-GC/MS Chromatograms

As KOH resulted in significant degradation of PLA and PET particles, it was excluded from this analysis. The characteristic substances of the polymers PE, PLA, PET, and PP were completely decomposed during pyrolysis. However, in the case of the polymers PA and PS, treatment with Fenton and H2O2 had an influence on their thermal stability. The ratio of the volatile pyrolysis products observed during the thermal desorption step at 200 °C to the stable pyrolysis products at 800 °C was decreased after treatment, especially PA (Table 5). This means that the amount of pyrolysis products that were volatile at 200 °C was reduced after applying the treatments, and more of the pyrolysis products remained stable until the second pyrolysis step at 800 °C. Nevertheless, all of the polymers were still clearly identifiable in all cases. The pyrolysis products of the individual polymers are shown in the Supplementary Materials Table S3.

3.3. Organic Matter Removal Efficiency

Since the KOH protocol degraded PLA and PET, only H2O2 and Fenton protocols were considered for further investigations. First, the dry weights of the sludge control aliquots (surrogates) were established, as was described in Figure 2. The triplicates exhibited highly consistent results with a standard deviation of <5% (average dry weight was 75.17 ± 3.55 mg). Therefore, implementing the dry weight of the controls as reference for the removal efficiency, as was described in Figure 2, can be seen as a better alternative to the reported method of drying the sludge of each sample before digestion to establish its dry-weight. As explained in the methods section, this would have had a far greater impact on the results, due to the hardening and clumping of dried sludge, thus, reducing the efficacy of the digestion. This could in fact explain the higher removal efficiency compared to Hurley et al. [7], as they used similar protocols but dried each sludge sample before applying digestion.
As indicated before, usually the lost weight is taken to correspond directly to the loss of organic matter. However, the organic content of the dry sludge was determined to be 70.5% via loss on ignition (LOI). Based on this, organic removal efficiencies >100% were obtained (Table 6). This clearly cannot be the case. This can be explained by the dissolution of some inorganic salts and inorganic carbon, which would pass through during the filtration process and be observed as extra lost weight. Hence, extra samples were investigated, where sludge aliquots were mixed with UPW, as described in the previous section. The results revealed that dissolution of the readily solvable organic and inorganic compartments in ultrapure water had a weight reduction of around 5.9% ± 2.3%. This is far from negligible and indicates that some organic and inorganic content was dissolved and registered as extra weight loss. This phenomenon is expected to intensify for lower pH values and higher temperatures, such as the ones encountered during the Fenton and hydrogen peroxide protocols. However, this was not necessary for the scope of this paper, as the comparison between protocols did not require exact knowledge of the removed inorganic components. This side experiment was only intended as a proof of concept to clarify the reported removal percentages, which are sometimes larger than 100% in the literature. In fact, a study by Karami et al. [11] did not dry the biological samples beforehand, which compromised the absolute removal values they reported; but, as a comparative tool between the investigated protocols, it was still a valid result, as all samples were treated equally. Thus, no further investigations regarding this were perused.
Finally, Figure 9 shows a visual comparison of the filtered results from the hydrogen peroxide and Fenton protocol for the gravimetric analysis. Even though the weight difference between the sludge treated with Fenton and hydrogen peroxide protocols was not large, the characteristic of the remaining material differed between the two. Whereas the hydrogen peroxide-treated sample showed visible particulate matter after digestion, Fenton showed only coloration of the filter with no visible organic particles.

4. Conclusions

If one sentence could summarize the findings of this paper, it would be: “the devil is in the details”. The initial intention of the authors was to screen through sample preparation methods in the literature and adapt and validate the most suitable methods for microplastic monitoring in wastewater samples. It was soon clear however, that large variations existed between the reported results in the peer-reviewed literature. Further, it was not always possible to simply replicate the results due to seemingly insignificant missing details, which turned out to be basic but essential to take into account when replicating someone’s work. Therefore, this study tried to consider even the smaller details in order to clarify the reasons behind the different results in the literature. Along the journey, surprising but important discoveries were made regarding the different types of Fenton reactions that exist, even when one is seemingly using identical chemical reagents and protocols. This study recommends using the Fenton reaction as described in Figure 1 as well as the Supplementary Materials Section S1.2. It provided excellent organic matter removal efficiency from wastewater samples in a very short amount of time and had very little adverse effects on the seven investigated microplastic types. However, it is of utmost importance that the used sort of hydrogen peroxide is tested beforehand to ensure that it provides a type I Fenton reaction as was defined in this study. Type II Fenton reactions were explored and defined in this study, but they were not validated and are not recommended for this application, due to their much slower reaction kinetics. The use of hydrogen peroxide also provided similar results to Fenton, but the much longer reaction times (24 h as opposed to 20 min) limit the rapid throughput potential of the latter when compared to Fenton. Additionally, the remaining organic particles after hydrogen peroxide digestion (Figure 9) could constrain particle counting and identification.

Supplementary Materials

The following are available online at https://www.mdpi.com/2073-4441/12/9/2445/s1.

Author Contributions

Conceptualization, M.S.M.A.-A., C.S., J.E.D., O.K.; methodology and data analysis: Size Analysis: M.S.M.A.-A., S.K.; FTIR: M.S.M.A.-A., J.W.; Pyr-GC/MS: M.S.M.A.-A., J.R.; writing—review and editing, M.S.M.A.-A., O.K., J.W., S.K., J.R., C.S. and J.E.D.; supervision, J.E.D., O.K., and K.G. All authors have read and agreed to the published version of the manuscript.

Funding

This research was funded by the Bayerische Forschungsstiftung, grant number 1258-16 and by the German Federal Ministry of Education and Research (BMBF), grant number 02WPL1443A.

Conflicts of Interest

The authors declare no conflict of interest. The funders had no role in the design of the study; in the collection, analyses, or interpretation of data; in the writing of the manuscript, or in the decision to publish the results.

Appendix A

Abbreviations for microplastics used in the tables below:
Acrylonitrile-butadiene-styreneABS
Cellulose acetateCA
Crosslinked polystyrenePSXL
Expanded PSEPS
High-density PEHPDE
Low-density PELDPE
Linear LDPELLDPE
Nylon-6 or polyamide-6NY6
Nylon12 or polyamide-12NY12
Nylon-66 or polyamide-66NY66
Poly 1,4-butylene terephthalatePBT
PolyamidePA
PolycarbonatePC
PolyethylenePE
Polyethylene terephthalatePET
Poly(hexamethylene nonanediamide)Nylon 6/9
Poly(methyl methacrylate)PMMA
PolypropylenePP
PolytetrafluoroethylenePTFE
PolyurethanePUR
Polyvinyl chloridePVC
Styrene acrylateSA
Un-plasticized polyvinyl chlorideuPVC
Table A1. Summary of various hydrogen peroxide protocols used in microplastic studies. RT—Room Temperature.
ProtocolsConditionsMatrixMPsEffects on OrganicsEffects on MP
H2O2 (30%) [7]60 °C for * 24/12 h
or
70 °C for * 24 h
Sludge and soilPP, LDPE, HDPE, PS, PET, NY66, PC, PMMADigestion > 80% for sludge
and
>96% for soil
Degradation of NY66 (at 70 °C), PP (at 70 °C). As for PS; less degradation at 60 °C and more at 70 °C
H2O2 (35%) [11]50 °C for 96 hFishLDPE, HDPE, PP, PS, PET, PVC, NY6, NY66Digestion of
98%
Discoloration of PET, loss of NY6 and NY6
H2O2 (30%) [12]55 °C for 7 daysFishPE, PS** Extraction efficiency of 70%No report
Density separation then H2O2 (15%) [12]50 °C overnightFishPE, PS** Extraction efficiency of 95%No effects
H2O2 (30%) [13]RT. For 7 daysMarine sedimentPVC, PET, PA, ABS, PC, PUR, PP, LDPE, LLDPE, HPDE50% digestion and the rest were discoloredDiscoloration or degradation in PA, PC, PP, PET, LLDPE, PVC, PUR, LDPE
H2O2 (35%) [13]RT. For 7 daysMarine sedimentPVC, PP, LDPE, PE, HDPE, PET, PUR, PS, PC, PA, ABS, EPS92% digestion and discolorationSize reduction PP and PE
H2O2 (30%) then density separation [14]70 °C overnightSludgePE** Extraction efficiency of 78%No adverse effects reported
* Contact times in the study of Hurley et al. [7] were not clearly reported. The experiments for the effects on microplastics was 24 h for all six protocols. However, the experiments for organic matter digestion were done separately and the contact time was not specified. Their protocol for H2O2 was based on a protocol by Sujathan et al. [14], where the contact time was defined as 12 h (overnight). ** Extraction efficiency represents only the recovery of microplastics from an environmental matrix; it does not report on the reduction of the matrix.
Table A2. Summary of various Fenton protocols used in microplastic studies. RT—Room Temperature.
ProtocolsConditionsMatrixMPsEffects on OrganicsEffects on MP
H2O2 (30%)
+
20 g/L FeSO4 7H2O2 1:1 (v/v) [7]
<40 °C
(Ice bath)
*24 h/20 minSludge and soilPP, LDPE, HDPE, PS, PET, NY66, PC, PMMADigestion 87% for sludge and 106% for soilNo adverse effects
H2O2 (30%)
+
15 g/L FeSO4 7H2O2 1:1 (v/v) [15]
50 °C for 1 h.Plant and animal tissuesPE, PP, PS, PET, PVC, CA, PADigestion of 72.6% of fish tissue, 100% of algae, 26.3% driftwood, 17.5% paraffinDegradation of CA
H2O2 (30%)
+
15 g/L FeSO4 7H2O2 1:1 (v/v) [16]
75 °C for >35 minWater, beach and sedimentNone testedNo reportsNo reports
H2O2 (30%)
+
20 g/L FeSO4 7H2O2 (2:1 v/v) [17]
RT.
(no ice bath)
10 min reaction + 10 min coolingSludgePE, PP, PVC, PAEffective removal
(No exact details provided)
No observed effects
* Contact times in the study of Hurley et al. [7] were not clearly reported. The experiments for the effects on microplastics used 24 h for all protocols. However, the experiments for organic matter digestion were done separately and the contact time was not specified. Their protocol for Fenton was based on a protocol by Tagg et al. [17], where the contact time was defined as 20 min in total.
Table A3. Summary of various acid-based digestions used in microplastic studies. RT—Room Temperature.
ProtocolsConditionsMatrixMPsEffects on OrganicsEffects on MP
HNO3 (69%) [11]25 °C for 96 hFishLDPE, HDPE, PP, PS, PET, PVC, NY6, NY66Removal >95%Loss of NY6, NY66. Melting of LDPE, HDPE, PP. Recovery of PVC 69%. Discoloration of others
HNO3 (55%) [20]Based on fish size:
RT. For 3–10 h
or
80 °C for 10–20 min
FishHDPE, PA, Nylon 6/9, PBT, PVCComplete digestion of the fishTested at room temperature for 1 month. Loss of Nylon within 24 h, the rest showed no significant changes after 1 month.
HNO3 (22.5 M) [21]RT. Overnight
then
boiling for 2 h
MusselsPS, PAGood digestion of the tissuesPA fibers (30 × 200 µm) were lost. PA particles 100 × 400 µm were 98% recovered. PS particles 30 µm and 10 µm were recovered.
HNO3 (22.5 M) [21]60 °C for 1 h.
then
100 °C for 1 h
MusselsPS, PASatisfactory digestion of the tissuesPS particles melting together when exposed to the reagent directly. This did not occur when PS was embedded in the tissues. PA was completely lost
HNO3 (22.5 M) [12]RT. overnight
then boiling for 30 min
FishPS, PE** Extraction efficiency of only 4%Almost complete loss of PS and PE
HNO3 (65%) [22]RT. overnight
then 60 °C for 2 h
NoneLDPE, HDPE, PP, NY12, PSNot tested due to damaged polymersMelting of NY12, yellowing of the rest
HNO3 (35%) [25]60 °C overnightMusselsPET, HDPE, PVC, PAComplete digestionMelting together of PET, HDPE, loss of PA
HCL (37%) [11]25 °C for 96 hFishLDPE, HDPE, PP, PS, PET, PVC, NY6, NY66Digestion efficiency >95%Loss of NY6, NY66. Melting and clumping of PET
HCL (20%) [13]RT. for 7 daysMarine sedimentPVC, PET, PA, ABS, PC, PUR, PP, LDPE, LLDPE,
HPDE
No complete dissolution of any biogenic organic matterNot reported
** Extraction efficiency represents only the recovery of microplastics from an environmental matrix; it does not report on the reduction of the matrix.
Table A4. Summary of various alkaline-based digestions used in microplastic studies. RT—Room Temperature.
ProtocolsConditionsMatrixMPsEffects on OrganicsEffects on MP
KOH (10%) [7]60 °C for 24 hSludge and soilPP, LDPE, HDPE, PS, PET, NY66, PC, PMMADigestion of sludge: 57%
And for soil: 35%
A slight weight decrease for PC
KOH (10%) [11]25 °C for 96 h
or
40 °C for 48 h
or
50 °C for 36 h
or
60 °C for 24 h
FishLDPE, HDPE, PP, PS, PET, PVC, NY6, NY66Removal >95%
(all temperatures)
Yellowing of NY66. Reduction in PVC and PET recovery that worsens with increased temperature
KOH (10%) [22]0 °C for 24 hMussels, crabs, fishCA, HDPE, LDPE, NY6, NY12, PC, PET, PMMA, PP, PS, PSXL, PTFE, PUR, uPVC, EPSDigestion efficiency > 99.5%Degradation of CA
KOH (56, 224 g/L) [26]RT. For 14 daysNoneCera Microcrystalline, PE** Extraction efficiency > 95%Discoloration of cera microcrystalline and PE (for 224 g/L)
KOH (10%) [28]RT. For 2–3 weeksFishNo spiking: PE, PP, PET, SADigestion satisfactoryNone tested
KOH (10%) [29]60 °C for 24 hVegetalPP, PE, PVC, PUR, PET, PSNo digestion observedNo effects observed
NaOH (1, 10 M) [7]60 °C for 24 hSludge and soilPP, LDPE, HDPE, PS, PET, NY66, PC, PMMADigestion of sludge:
61% (1M)
67% (10M)
and soil:
68% (1 M)
65% (10 M)
Degradation of PET, PC (even more with 10 M)
NaOH (20, 30, 40, 50%) [13]RT. For 7 daysMarine sedimentPVC, PET, PA, ABS, PC, PUR, PP, LDPE, LLDPE,
HPDE
No complete dissolution of any biogenic organic matter. Strongest reaction with NaOH (20%)Not reported
NaOH (10 M) [22]60 °C for 24 hNoneCA, HDPE, LDPE, NY6, NY12, PC, PET, PMMA, PP, PS, PSXL, PTFE, PUR, uPVC, EPSNot tested due to damage to polymersDegradation of CA, PC, PET
NaOH (1 M) [25]60 °C overnightMusselsPET, HDPE, PVC, PAComplete digestion and extraction efficiency of 93%No significant effects
NaOH (10 M) [27]60 °C for 24 hZooplanktonPS, PA, PET, PE, uPVCDigestion efficiency of 91%Partial degradation of PA, clumping of PE, yellowing of uPVC, partial loss of PS
NaOH (10 M) [29]60 °C for 24 hVegetalPP, PE, PVC, PUR, PET, PSAlmost no digestionDegradation of PET
** Extraction efficiency represents only the recovery of microplastics from an environmental matrix; it does not report on the reduction of the matrix.
Figure A1. µFTIR Spectra of PET.
Water 12 02445 g0a1
Figure A2. FTIR Spectra of PLA.
Water 12 02445 g0a2
Figure A3. µFTIR Spectra of PVC.
Water 12 02445 g0a3

References

  1. Underwood, A.J.; Chapman, M.G.; Browne, M.A. Some problems and practicalities in design and interpretation of samples of microplastic waste. Anal. Methods 2017, 9, 1332–1345. [Google Scholar] [CrossRef]
  2. Jambeck, J.R.; Geyer, R.; Wilcox, C.; Siegler, T.R.; Perryman, M.; Andrady, A.; Narayan, R.; Law, K.L. Marine pollution. Plastic waste inputs from land into the ocean. Science 2015, 347, 768–771. [Google Scholar] [CrossRef] [PubMed]
  3. Hartmann, N.B.; Hüffer, T.; Thompson, R.C.; Hassellöv, M.; Verschoor, A.; Daugaard, A.E.; Rist, S.; Karlsson, T.; Brennholt, N.; Cole, M.; et al. Are we speaking the same language? Recommendations for a definition and categorization framework for plastic debris. Environ. Sci. Technol. 2019, 53, 1039–1047. [Google Scholar] [CrossRef] [PubMed] [Green Version]
  4. GESAMP. Sources, Fate and Effects of Microplastics in the Marine Environment: A Global Assessment; Kershaw, P., Ed.; IMO/FAO/UNESCO-IOC/UNIDO/WMO/IAEA/UN/UNEP/UNDP Joint Group of Experts on the Scientific Aspects of Marine Environmental Protection: Londen, UK, 2015. [Google Scholar]
  5. Braun, U.; Jekel, M.; Gerdts, G.; Ivleva, N.P.; Jens, R. Microplastics Analytics Sampling, Preparation and Detection Methods; German Federal Ministry of Education And Research: Berlin, Germany, 2018.
  6. Ivleva, N.P.; Wiesheu, A.C.; Niessner, R. Microplastic in aquatic ecosystems. Angew. Chem. Int. Ed. 2017, 56, 1720–1739. [Google Scholar] [CrossRef] [PubMed]
  7. Hurley, R.R.; Lusher, A.L.; Olsen, M.; Nizzetto, L. Validation of a method for extracting microplastics from complex, organic-rich, environmental matrices. Environ. Sci. Technol. 2018, 52, 7409–7417. [Google Scholar] [CrossRef] [Green Version]
  8. Tagg, A.S.; Sapp, M.; Harrison, J.P.; Ojeda, J.J. Identification and quantification of microplastics in wastewater using focal plane array-based reflectance Micro-FT-IR imaging. Anal. Chem. 2015, 87, 6032–6040. [Google Scholar] [CrossRef] [Green Version]
  9. Dyachenko, A.; Mitchell, J.; Arsem, N. Extraction and identification of microplastic particles from secondary wastewater treatment plant (WWTP) effluent. Anal. Methods 2017, 9, 1412–1418. [Google Scholar] [CrossRef]
  10. Schwaferts, C.; Niessner, R.; Elsner, M.; Ivleva, N.P. Methods for the analysis of submicrometer- and nanoplastic particles in the environment. TrAC Trends Anal. Chem. 2019, 112, 52–65. [Google Scholar] [CrossRef]
  11. Karami, A.; Golieskardi, A.; Choo, C.K.; Romano, N.; Ho, Y.B.; Salamatinia, B. A high-performance protocol for extraction of microplastics in fish. Sci. Total Environ. 2017, 578, 485–494. [Google Scholar] [CrossRef]
  12. Avio, C.G.; Gorbi, S.; Regoli, F. Experimental development of a new protocol for extraction and characterization of microplastics in fish tissues: First observations in commercial species from adriatic sea. Mar. Environ. Res. 2015, 111, 18–26. [Google Scholar] [CrossRef]
  13. Nuelle, M.T.; Dekiff, J.H.; Remy, D.; Fries, E. A new analytical approach for monitoring microplastics in marine sediments. Environ. Pollut. 2014, 184, 161–169. [Google Scholar] [CrossRef] [PubMed]
  14. Sujathan, S.; Kniggendorf, A.-K.; Kumar, A.; Roth, B.; Rosenwinkel, K.-H.; Nogueira, R. Heat and bleach: A cost-efficient method for extracting microplastics from return activated sludge. Arch. Environ. Contam. Toxicol. 2017, 73, 641–648. [Google Scholar] [CrossRef] [PubMed]
  15. Prata, J.C.; da Costa, J.P.; Girão, A.V.; Lopes, I.; Duarte, A.C.; Rocha-Santos, T. Identifying a quick and efficient method of removing organic matter without damaging microplastic samples. Sci. Total Environ. 2019, 686, 131–139. [Google Scholar] [CrossRef] [PubMed]
  16. Masura, J.; Baker, J.E.; Foster, G.D.; Arthur, C.; Herring, C. Laboratory Methods for the Analysis of Microplastics in the Marine Environment: Recommendations for Quantifying Synthetic Particles in Waters and Sediments; National Oceanic and Atmospheric Administration: Silver Spring, MD, USA, 2015.
  17. Tagg, A.S.; Harrison, J.P.; Ju-Nam, Y.; Sapp, M.; Bradley, E.L.; Sinclair, C.J.; Ojeda, J.J. Fenton’s reagent for the rapid and efficient isolation of microplastics from wastewater. Chem. Commun. 2017, 53, 372–375. [Google Scholar] [CrossRef] [Green Version]
  18. Zhang, H.; Heung, J.C.; Huang, C.P. Optimization of fenton process for the treatment of landfill leachate. J. Hazard. Mater. 2005, 125, 166–174. [Google Scholar] [CrossRef]
  19. Flotron, V.; Delteil, C.; Padellec, Y.; Camel, V. Removal of sorbed polycyclic aromatic hydrocarbons from soil, sludge and sediment samples using the Fenton’s reagent process. Chemosphere 2005, 59, 1427–1437. [Google Scholar] [CrossRef]
  20. Naidoo, T.; Goordiyal, K.; Glassom, D. Are nitric acid (HNO3) digestions efficient in isolating microplastics from juvenile fish? Water. Air. Soil Pollut. 2017, 228, 1–11. [Google Scholar] [CrossRef]
  21. Claessens, M.; Van Cauwenberghe, L.; Vandegehuchte, M.B.; Janssen, C.R. New techniques for the detection of microplastics in sediments and field collected organisms. Mar. Pollut. Bull. 2013, 70, 227–233. [Google Scholar] [CrossRef]
  22. Dehaut, A.; Cassone, A.-L.; Frère, L.; Hermabessiere, L.; Himber, C.; Rinnert, E.; Rivière, G.; Lambert, C.; Soudant, P.; Huvet, A.; et al. Microplastics in seafood: Benchmark protocol for their extraction and characterization. Environ. Pollut. 2016, 215, 223–233. [Google Scholar] [CrossRef] [Green Version]
  23. Rocha-Santos, T.; Duarte, A.C. A critical overview of the analytical approaches to the occurrence, the fate and the behavior of microplastics in the environment. TrAC Trends Anal. Chem. 2015, 65, 47–53. [Google Scholar] [CrossRef]
  24. Qiu, Q.; Tan, Z.; Wang, J.; Peng, J.; Li, M.; Zhan, Z. Extraction, enumeration and identification methods for monitoring microplastics in the environment. Estuar. Coast. Shelf Sci. 2016, 176, 102–109. [Google Scholar] [CrossRef]
  25. Catarino, A.I.; Thompson, R.; Sanderson, W.; Henry, T.B. Development and optimization of a standard method for extraction of microplastics in mussels by enzyme digestion of soft tissues. Environ. Toxicol. Chem. 2017, 36, 947–951. [Google Scholar] [CrossRef] [PubMed]
  26. Munno, K.; Helm, P.A.; Jackson, D.A.; Rochman, C.; Sims, A. Impacts of temperature and selected chemical digestion methods on microplastic particles. Environ. Toxicol. Chem. 2018, 37, 91–98. [Google Scholar] [CrossRef] [PubMed]
  27. Cole, M.; Webb, H.; Lindeque, P.K.; Fileman, E.S.; Halsband, C.; Galloway, T.S. Isolation of microplastics in biota-rich seawater samples and marine organisms. Sci. Rep. 2014, 4, 1–8. [Google Scholar] [CrossRef] [PubMed] [Green Version]
  28. Foekema, E.M.; De Gruijter, C.; Mergia, M.T.; Van Franeker, J.A.; Murk, A.J.; Koelmans, A.A. Plastic in north sea fish. Environ. Sci. Technol. 2013, 47, 8818–8824. [Google Scholar] [CrossRef]
  29. Herrera, A.; Garrido-Amador, P.; Martínez, I.; Samper, M.D.; López-Martínez, J.; Gómez, M.; Packard, T.T. Novel methodology to isolate microplastics from vegetal-rich samples. Mar. Pollut. Bull. 2018, 129, 61–69. [Google Scholar] [CrossRef]
  30. Mintenig, S.M.; Int-Veen, I.; Löder, M.G.J.; Primpke, S.; Gerdts, G. Identification of microplastic in effluents of waste water treatment plants using focal plane array-based micro-fourier-transform infrared imaging. Water Res. 2017, 108, 365–372. [Google Scholar] [CrossRef]
  31. Zhao, S.; Zhu, L.; Li, D. Microplastic in three urban estuaries, China. Environ. Pollut. 2015, 206 (Suppl. C), 597–604. [Google Scholar] [CrossRef]
  32. Gewert, B.; Ogonowski, M.; Barth, A.; MacLeod, M. Abundance and composition of near surface microplastics and plastic debris in the stockholm archipelago, Baltic Sea. Mar. Pollut. Bull. 2017, 120, 292–302. [Google Scholar] [CrossRef]
  33. Van Cauwenberghe, L.; Vanreusel, A.; Mees, J.; Janssen, C.R. Microplastic pollution in deep-sea sediments. Environ. Pollut. 2013, 182 (Suppl. C), 495–499. [Google Scholar] [CrossRef]
  34. Renner, G.; Schmidt, T.C.; Schram, J. Characterization and quantification of microplastics by infrared spectroscopy. Compr. Anal. Chem. 2017, 75, 67–118. [Google Scholar] [CrossRef]
  35. Imhof, H.K.; Ivleva, N.P.; Schmid, J.; Niessner, R.; Laforsch, C. Contamination of beach sediments of a subalpine lake with microplastic particles. Curr. Biol. 2013, 23, R867–R868. [Google Scholar] [CrossRef] [PubMed] [Green Version]
  36. Carr, S.A.; Liu, J.; Tesoro, A.G. Transport and fate of microplastic particles in wastewater treatment plants. Water Res. 2016, 91, 174–182. [Google Scholar] [CrossRef] [PubMed]
  37. Cabernard, L.; Durisch-Kaiser, E.; Vogel, J.C.; Rensch, D.; Niederhauser, P.; Gewässerschutz, A.W.E.L. Mikroplastik in Abwasser Und Gewässern; Aqua & Gas N°7/8: Zurich, Switzerland, 2016. [Google Scholar]
  38. Aramyan, S.M. Advances in fenton and fenton based oxidation processes for industrial effluent contaminants Control-A review. Int. J. Environ. Sci. Nat. Resour. 2017, 2, 1–18. [Google Scholar] [CrossRef] [Green Version]
  39. ISO—ISO 13320:2009—Particle Size Analysis—Laser Diffraction Methods; International Organization for Standardization: Geneva, Switzerland, 2009.
  40. Ochiai, N.; Sasamoto, K.; Kanda, H.; Yamagami, T.; David, F.; Tienpont, B.; Sandra, P. Optimization of a multi-residue screening method for the determination of 85 pesticides in selected food matrices by stir bar sorptive extraction and thermal desorption GC-MS. J. Sep. Sci. 2005, 28, 1083–1092. [Google Scholar] [CrossRef]
  41. DIN 38409-1—1987-01, German Standard Methods for the Examination of Water, Waste Water and Sludge; Parameters Characterizing Effects and Substances (Group H); Determination of Total Dry Residue, Filtrate Dry Residue and Residue on Ignition (H 1); German Institute for Standardisation: Berlin, Germany, 1987.
  42. Kühn, S.; van Werven, B.; van Oyen, A.; Meijboom, A.; Bravo Rebolledo, E.L.; van Franeker, J.A. The use of potassium hydroxide (KOH) solution as a suitable approach to isolate plastics ingested by marine organisms. Mar. Pollut. Bull. 2017, 115, 86–90. [Google Scholar] [CrossRef]
  43. Lunt, J. Large-Scale production, properties and commercial applications of poly lactic acid polymers. Polym. Degrad. Stab. 1998, 59, 145–152. [Google Scholar] [CrossRef]
  44. Zhang, H.; Rankin, A.; Ward, I.M. Determination of the end-group concentration and molecular weight of poly (Ethylene Naphthalene-2,6-Dicarboxylate) using infra-red spectroscopy. Polymer (Guildf) 1996, 37, 1079–1085. [Google Scholar] [CrossRef]
  45. Myungwan, H. Chemical Depolymerization Of Pet Bottles Via Methanolysis And Hydrolysis Myungwan Han. In Recycling of Polyethylene Terephthalate Bottles; Sabu, T., Ajay, V.R., Krishnan, K., Abitha, V., Martin, G.T., Eds.; William Andrew Publishing: New York, NY, USA, 2018. [Google Scholar]
  46. von der Esch, E.; Lanzinger, M.; Kohles, A.J.; Schwaferts, C.; Weisser, J.; Hofmann, T.; Glas, K.; Elsner, M.; Ivleva, N.P. Simple generation of suspensible secondary microplastic reference particles via ultrasound treatment. Front. Chem. 2020, 8, 169. [Google Scholar] [CrossRef] [Green Version]
Figure 1. Workflows of the three selected protocols for processing microplastics from wastewater sludge samples.
Water 12 02445 g001
Figure 2. The workflow used in this study for investigating the organic matter removal efficiency.
Water 12 02445 g002
Figure 3. Visual difference between type I and II Fenton reactions (end of reaction). (A): Type II that failed to initialize boiling. (B): Type II which initialized boiling. (C): Type I.
Water 12 02445 g003
Figure 4. Differences between a type I Fenton reaction and a type II Fenton reaction that failed to initialize boiling when digesting a piece of tissue paper. (A,C): type II before and after reaction. (B,D): type I before and after reaction.
Water 12 02445 g004
Figure 5. Size distribution analysis for PLA, the green area represents the smallest 10th percent (d10).
Water 12 02445 g005
Figure 6. Relative particle size changes after treatment (A) KOH, (B) Peroxide, and (C) Fenton, compared to the controls (for weighted average sizes and 10th percentiles (d10)). The error bars represent the standard deviations. PLA and PET in (A) were completely destroyed, thus no results are given. The red and green stars indicate statistical significance for the entire distribution, as well as d10, respectively.
Water 12 02445 g006
Figure 7. Relative particle size changes after temperature treatments compared to controls (for weighted average sizes and 10th percentiles (d10)). The error bars represent the standard deviations. (A): 60 °C for 24 h, (B): 90 °C for 20 min. The red and green stars indicate statistical significance for the entire distribution, as well as d10, respectively.
Water 12 02445 g007
Figure 8. Normalized FTIR spectra of reference PET particles. Top (red line): measured in reflectance mode on FTIR microscope; Bottom (black line): measured in ATR mode.
Water 12 02445 g008
Figure 9. The end result of the gravimetric analysis done on 2 mL of sludge. (A): dried sludge (surrogate) (B): dried retentate and filter after hydrogen peroxide treatment, (C): dried retentate and filter after Fenton treatment.
Water 12 02445 g009
Table 1. Protocols investigated in this study.
ProtocolsTemperatureTime
Fenton (30% H2O2 + 20 g/L FeSO4) [17]Unregulated10 min + 10 min cooling
KOH (10%) [22]60 °C24 h
H2O2 (30%) [7]60 °C24 h
Table 2. Protocols that were investigated for their effects on the polymers.
ProtocolsDescription
Control5 mL UPW @ Room Temperature
FentonAs described in Figure 1 (2 mL FeSO4 as a starting volume)
H2O2As described in Figure 1 (5 mL H2O2)
KOHAs described in Figure 1 (5 mL KOH)
** Temperature control 60 °C 5 mL UPW @ 60 °C and 24 h
** Temperature control 90 °C5 mL UPW @ 90 °C and 20 Minutes
** Only performed for size distribution analysis in order to isolate the melting or agglomerating effects of the elevated temperature from the effect of the chemical reagents.
Table 3. The reaction differences for the five batches of hydrogen peroxide when using 100 mL Erlenmeyer flasks on the rubberized bench. Tmax—Maximum temperature.
H2O2 BatchesTmax [°C]pH @ Tmax [-]Time Till Tmax [sec]
(i)86.9 ± 0.91.62 ± 0.03157 ± 4
(ii)87.2 ± 0.21.67 ± 0.06167 ± 19
(iii)70.4 ± 231.72 ± 0.23510 ± 127
(iv)85 ± 0.41.67 ± 0.05173 ± 11
(v)84.9 ± 1.71.69 ± 0.04192 ± 5
Table 4. The reaction difference for type I and II Fenton reaction when using 100 mL Erlenmeyer flasks on the aluminum bench for heat dissipation.
Reaction TypeTmax [°C]pH @ Tmax [-]Time to Tmax [sec]
Type (I) (batch (ii))84.1 ± 3.41.65 ± 0.09228 ± 3
Type (II) (batch (iii))60.8 ± 29.31.7 ± 0.25554 ± 190
Table 5. Influence on the partial pyrolysis of thermal desorption (TD) products at 200 °C for both PA and PS.
Polymer TypeParticle TreatmentPyrolysis Products in TD [%]/Standard Deviation [%]
PAuntreated74.5/19.0
Fenton17.1/12.65
H2O23.0/3.67
PSuntreated79.3/12.5
Fenton78.8/16.9
H2O271.9/10.9
Table 6. Average total and corresponding organic removal efficiencies for the investigated protocols. Results represent the average ± standard deviation for the three sample repetitions.
ProtocolTotal Weight RemovalCorresponding Organic Matter Removal *
Fenton83.5% ± 1.8%118.4% ± 2.6%
H2O271.3% ± 1.2%101.1% ± 1.6%
* The results were not adjusted to account for the loss of inorganic matter, hence removal efficiencies over 100% are present.

