Article

Biodiversity and Habitat Assessment of Coastal Benthic Communities in a Sub-Arctic Industrial Harbor Area

by
Elliot Dreujou
1,2,3,*,
Christopher W McKindsey
2,4,
Cindy Grant
2,3,5,
Lisa Tréau de Coeli
2,3,5,
Richard St-Louis
2,6 and
Philippe Archambault
2,3,5
1
Institut des Sciences de la Mer, Université du Québec à Rimouski, 300 Allée des Ursulines, Rimouski, QC G5L 3A1, Canada
2
Québec-Océan, Université Laval, 1045 Avenue de la Médecine, Québec City, QC G1V 0A6, Canada
3
Takuvik Joint UL/CNRS Laboratory, Université Laval, 1045 Avenue de la Médecine, Québec City, QC G1V 0A6, Canada
4
Maurice Lamontagne Institute, Fisheries and Oceans Canada, 850 Rue de la Mer, Mont-Joli, QC G5H 3Z4, Canada
5
Département de biologie, Université Laval, 1045 Avenue de la Médecine, Québec City, QC G1V 0A6, Canada
6
Département de biologie, chimie et géographie, Université du Québec à Rimouski, 300 Allée des Ursulines, Rimouski, QC G5L 3A1, Canada
*
Author to whom correspondence should be addressed.
Water 2020, 12(9), 2424; https://doi.org/10.3390/w12092424
Submission received: 10 July 2020 / Revised: 9 August 2020 / Accepted: 24 August 2020 / Published: 28 August 2020

Abstract

:
Coastal ecosystems face increasing anthropogenic pressures worldwide and their management requires a solid assessment and understanding of the cumulative impacts from human activities. This study evaluates the spatial variation of benthic macrofaunal communities, sediments, and heavy metals in the sub-Arctic coastal ecosystems around Sept-Îles (Québec, Canada)—a major port area in the Gulf of St. Lawrence. Physical sediment properties varied in the studied area, with a general sandy-silty profile except for specific locations in Baie des Sept Îles where higher organic matter and heavy metal concentrations were detected. Macrofaunal assemblages were evaluated for two taxa size classes (organisms > 0.5 mm and > 1 mm) and linked to habitat parameters using regression models. Communities of smaller organisms showed signs of perturbation for one assemblage close to industrial activities at Baie des Sept Îles, with an increased number of tolerant and opportunistic species, contrasting to neighboring regions whose compositions were similar to other ecosystems in the Gulf of St. Lawrence. This study enhances the understanding of sub-Arctic benthic communities and will contribute to monitoring programs for industrial harbor ecosystems.

1. Introduction

It is now widely recognized that marine ecosystems worldwide are susceptible to human-induced disturbances [1], and benthic coastal habitats rank among the most vulnerable [1,2]. When human activities influence ecosystems, communities may be modified by the loss of sensitive species and the selection of tolerant or opportunistic species, for example [3,4]. Such changes in species composition concomitantly impact ecosystem structure, affecting community characteristics (e.g., species richness, evenness) or ecosystem functional diversity [5,6,7,8]. Understanding the links between disturbances and community responses is therefore relevant to understanding ecosystem evolution and stability.
In the context of increasing anthropogenic influences on marine ecosystems, a better understanding of ecosystem effects is needed for efficient conservation and management measures, along with sustainable development. Many organizations have highlighted the importance of biologically diverse ecosystems for mankind and have set targets to preserve them and guide decision makers (e.g., [9,10,11]). To achieve these goals, tools are needed to detect and manage human influences on the environment.
Many factors influence ecosystems, from large-scale (e.g., climate, oceanic circulation) to small-scale phenomena (e.g., sediment perturbation, species interactions), which are often location- and temporal-specific [12]. This complexity is a major concern for environmental assessment studies, where the goal is to detect possible human influence in a context of natural variability. Ecosystem status is considered in relation to a reference condition that corresponds to pristine or low human-influenced conditions, which rely upon the best knowledge available [13]. Ecological groundwork, such as biodiversity surveys, time series monitoring, or experimental studies, is then required to understand the ecosystem structure and stability and how to define accurate reference conditions for environmental assessments.
Macrofauna plays an important role in the structure and functioning of benthic marine ecosystems [14,15]. Examples of this include engineering species (e.g., structural features for other species, bioturbation) or interactions with nutrient cycles (e.g., nutrient burial in the sediment, remineralization, benthos-pelagos coupling) [16,17,18,19]. As many macrobenthic species have a sedentary lifestyle and a relatively long lifespan, they can serve as indicators of the ecological status to assess and predict human influences (e.g., [20,21]). Finally, the macrofaunal compartment includes a variety of individual body sizes, from larvae to fully grown adults, and distinctions from meiofauna can be difficult to establish [22]. The definition of the body size range is an important consideration for ecosystem biodiversity studies, as it will be a trade-off between increased biodiversity data by including smaller organisms and increased fieldwork and identification time [23,24,25].
In Eastern Canada, the Gulf of St. Lawrence is subjected to a variety of human activities, including industrial centers, commercial shipping, harbors, fisheries, and aquaculture [26,27,28]. Many ecological surveys on benthic invertebrates are available, in particular thanks to periodic stock assessment surveys, but few have specifically targeted coastal and shallow waters. One of the coastal areas likely most influenced by human activities is around Sept-Îles (Québec). In 2011, Sept-Îles harbor housed the sixth-largest Canadian port in terms of total exchanged goods, was second in terms of loaded tonnage shipped internationally [29], and port infrastructure and activity have been expanding since. Industrial activities at Sept-Îles are largely focused on international shipping of iron ore mined in northern Québec and Labrador and the production of aluminum, and there are many fisheries operating in Baie des Sept Îles (mainly snow crab, northern shrimp, halibut, and whelk) [30]. Sept-Îles ecosystems are considered sub-Arctic, with sea ice formation in November/December and an important freshwater run-off due to snowmelt in April [31]. To our knowledge, no studies have focused on benthic communities in this area. Thus, study of the marine ecosystems at Sept-Îles and neighboring regions will increase the understanding of sub-Arctic benthic ecosystems under anthropogenic influence and enhance local environmental assessments.
The objectives of this study are to: (i) describe coastal habitats and macrobenthic communities at Sept-Îles, in order to provide the first benthic ecological survey of the area; (ii) evaluate the links between communities and abiotic variables (including heavy metals); (iii) detect the presence of similar benthic assemblages, along with their relationships with habitats; (iv) evaluate how macrofaunal size range will influence community descriptions and relationships with habitat parameters. We expect that human activities in the region will influence the benthic community structure.

2. Materials and Methods
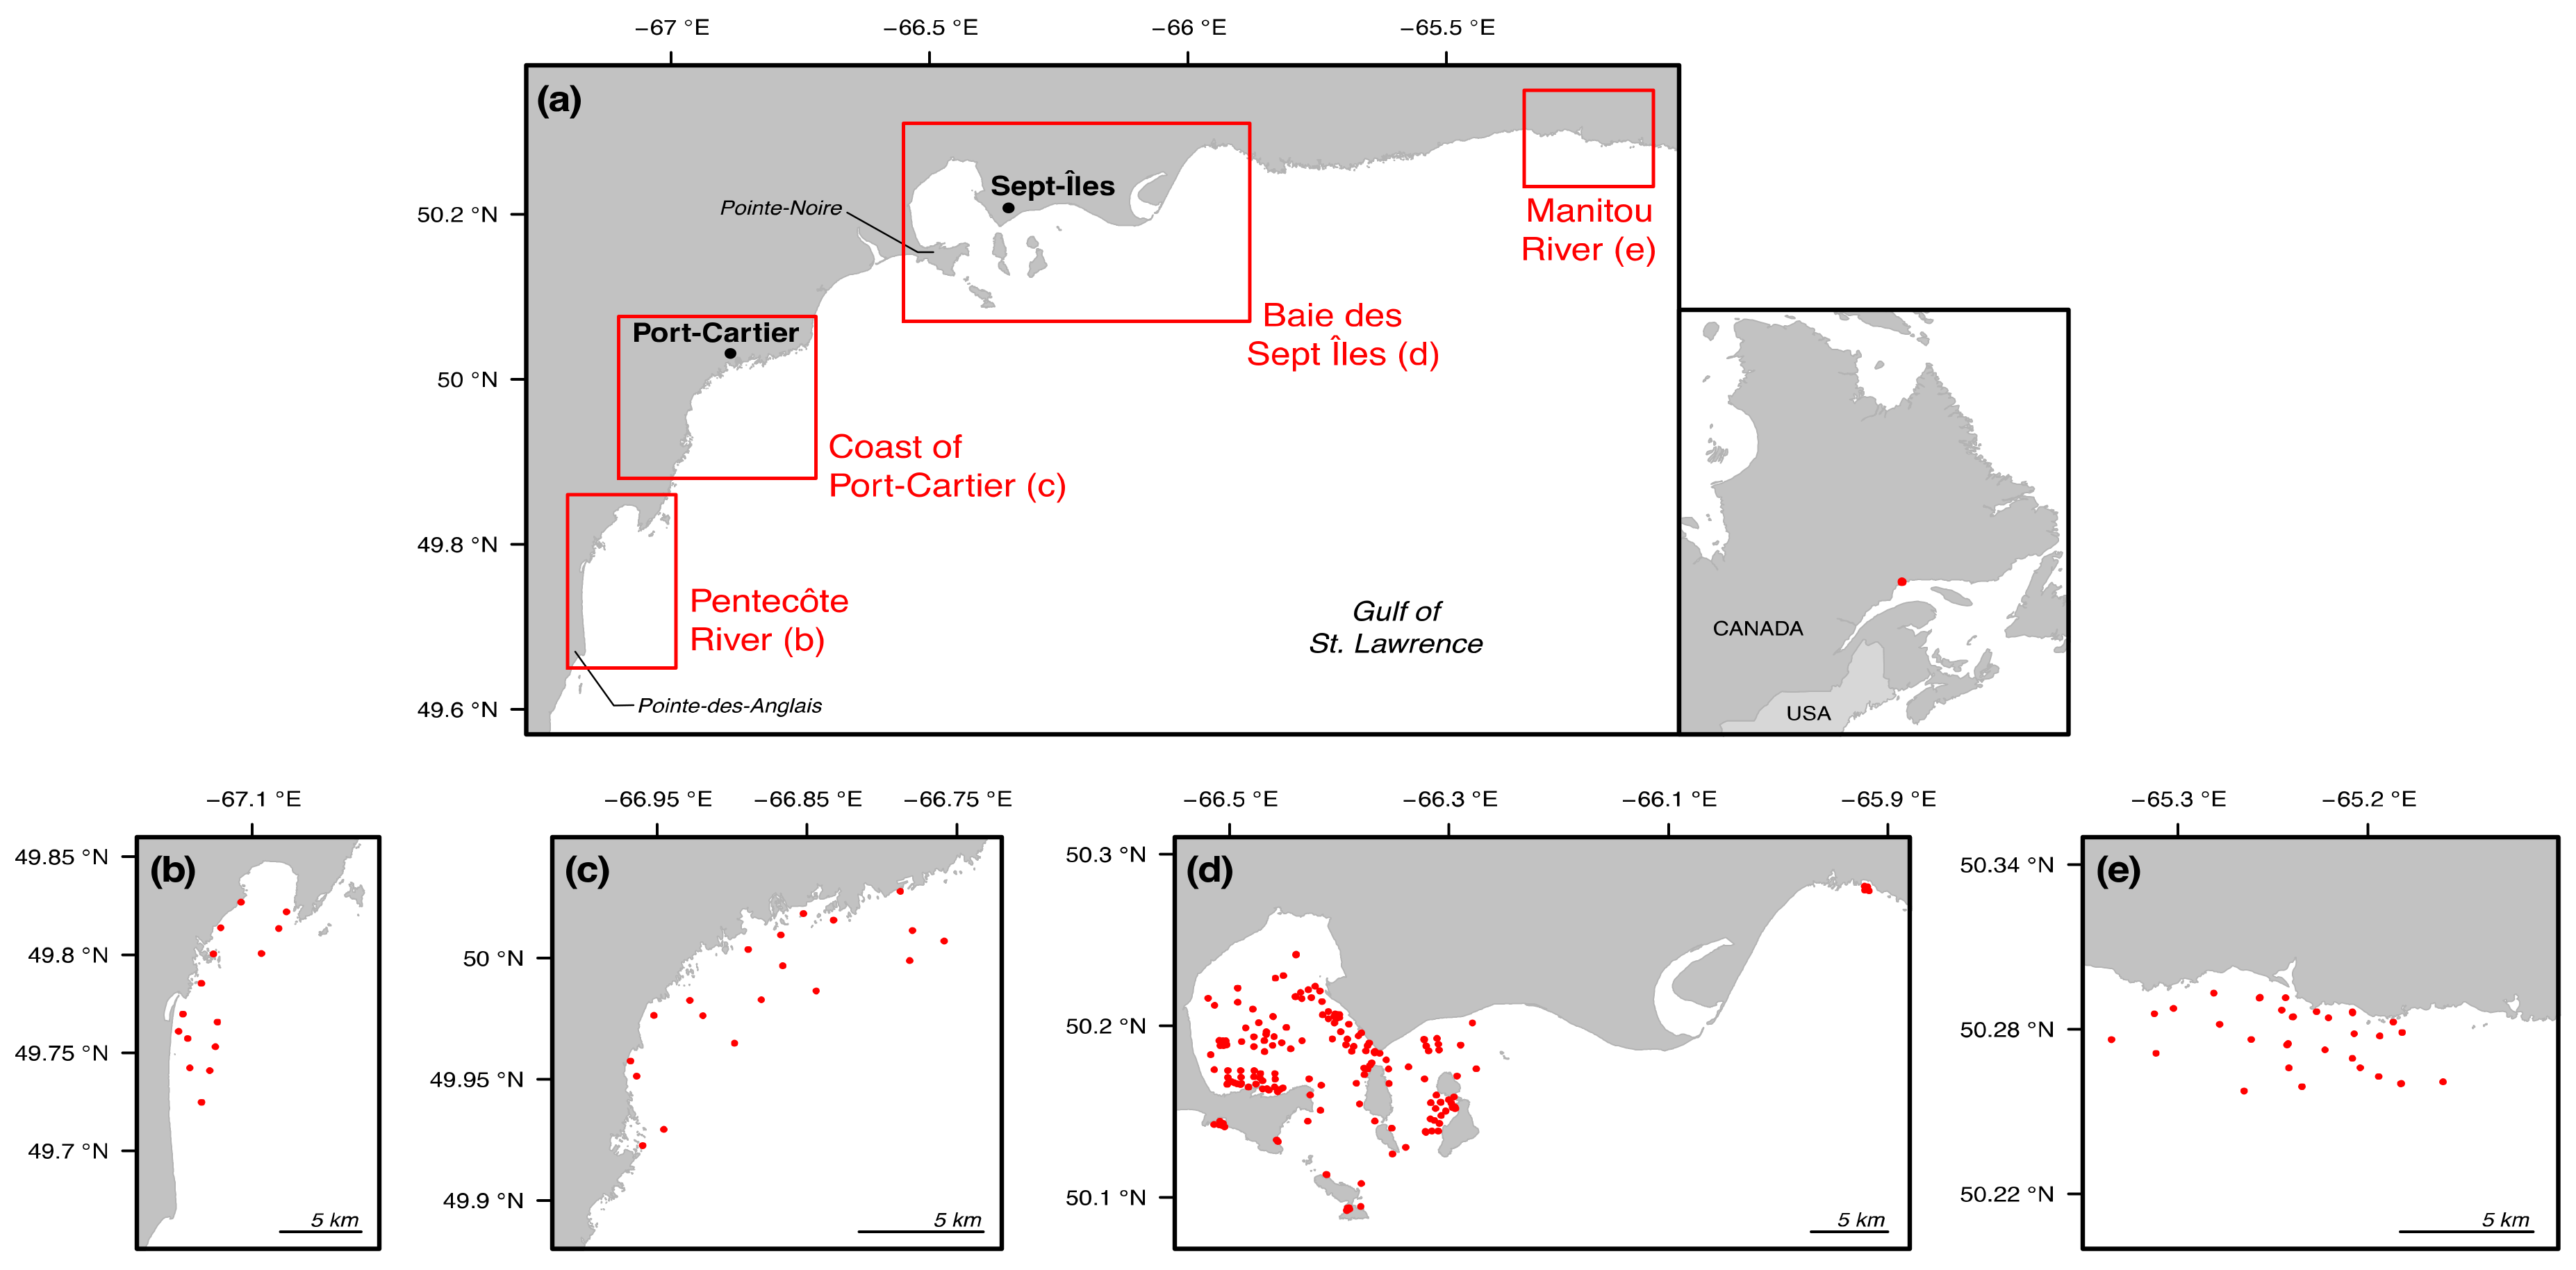
2.1. Study Area

We targeted ecosystems in the Côte-Nord region of Québec, within four adjacent sectors distributed along a 200 km coastline: Baie des Sept Îles, the coast of Port-Cartier, and the entrances of the Pentecôte and Manitou rivers (Figure 1a). This area hosts several human activities, in particular an industrial harbor and related industrial operations at Sept-Îles, at the Pointe-Noire terminal (on the southern section of Baie des Sept Îles) and the eastern side of Port-Cartier. Coastal ecosystems at the entrances of the Pentecôte and Manitou rivers are subjected to limited human influences. A village is located at Pointe-des-Anglais (south of the Pentecôte River), with a summer peak of use, particularly by tourists, and a decommissioned harbor. The Manitou River is relatively pristine, without hydroelectric plants or major human settlements.
Baie des Sept Îles is characterized by sandy beaches and tidal marshes, with a mean depth of 35 m before the entrance of the archipelago [32]. It is influenced by freshwater inputs from multiple streams and strong tidal currents resulting in a mixed water column and an estuarine circulation [33]. The other sectors present a mix of rocky and sandy coasts, with a steep bathymetry to as deep as 200 m.

2.2. Sample Collection

We sampled coastal benthic ecosystems during three field campaigns: September 2014, June–July 2016, and July 2017. Sampling stations were positioned in each sector using a randomization algorithm, constrained between 0 m and 80 m deep. A total of 242 stations were sampled during these campaigns, with 175 in Baie des Sept Îles (Figure 1b), 19 in coast of Port-Cartier (Figure 1c), 15 at Pentecôte River (Figure 1d), and 33 at Manitou River (Figure 1e).
Benthic samples were collected using a Ponar grab (0.05 m2) deployed from a boat with two independent casts. Station depth was obtained from the navigation sonar, then corrected with respect to tide height at time of sampling. The first cast collected three samples for the analyses of organic matter content, sediment grain-size, and heavy metal concentrations (habitat parameters). These samples were stored at −20 °C until processing in the laboratory. All the sediment obtained with the second cast was conserved for benthic macrofauna identification.
Two sieve mesh sizes were considered for macrofaunal samples to provide information on how the size range of the sampled individuals influences community descriptions and relationships with habitat parameters. Sediments were then sieved with either a 0.5 mm (2014 and 2017) or a 1 mm mesh size (2016 and 2017). This resulted in the inclusion of 166 stations for the 0.5 mm size class, located in Baie des Sept Îles and the Manitou River sectors, and 202 stations for the 1 mm size class, in all four sectors. Retained individuals were preserved in a solution of BORAX-buffered formalin (4%).

2.3. Laboratory Work

2.3.1. Habitat Parameters

All samples collected during the three field campaigns were processed for organic matter and grain-size analyses. The percentage of total organic matter (i.e., sum of organic carbon and organic nitrogen) in the sediment was obtained by using the Loss-on-Ignition method [34]. Grain-size analysis was done on a sieving column for the fraction with particles larger than 2 mm and with a Laser Diffraction Particle Size Analyzer for the smaller fractions. Results from both techniques were combined to yield a unified distribution range from 0.04 µm to 26.5 mm. From this, percentages of gravel, sand, silt, and clay were calculated as defined by Wentworth [35] and Folk [36].
Heavy metals were analyzed only for stations sampled in 2014 and 2016 in Baie des Sept Îles, due to practical and logistical constraints. Samples were processed at the analytical chemistry laboratory of Institut des Sciences de la Mer (Université du Québec à Rimouski, Rimouski), using Inductively Coupled Plasma Mass Spectrometry following a microwave mediated acid digestion of the sediment [37]. We focused on metals for which toxicity criteria have been defined in the Biological Effects Database for Sediments by Environment Canada [38]: arsenic, cadmium, chromium, copper, mercury, lead, and zinc. We used this study to detect the toxicity of the sediment on benthic species: five levels from Rare to Frequent Effects (corresponding to mild to high toxicity levels) have been defined by aggregating experimental and field studies on the tolerance of species to concentrations of heavy metals [37]. Iron and manganese were also added to this analysis to account for possible contamination from local ore industries. To have a significant number of stations for the statistical analyses and increase our spatial coverage, heavy metal concentrations for sediments from stations sampled in 2017 in Baie des Sept Îles were calculated based on 2014 and 2016 values with Inverse Distance Weighting interpolation [39].

2.3.2. Biological Samples

Samples for macrofauna identification were sorted using a stereomicroscope. Individuals were identified to the lowest taxonomic level possible with reference manuals and identification guides, and names were validated according to the World Register of Marine Species [40]. Taxon density was recorded for each station by counting individuals collected per grab.

2.4. Statistical Analysis

Statistical analyses were done using R v4.0 and PRIMER-e v6 with the PERMANOVA+ package [41,42]. Habitat parameters were standardized by their mean and standard deviation prior to analysis and species densities were log(x + 1) transformed to avoid the highest values from dominating analyses. To address the fourth objective of this study, all following statistical analyses were done independently for communities of individuals retained by the 0.5 mm sieve (hereafter referred to as the 0.5 mm size class) and by the 1 mm sieve (the 1 mm size class) in order to compare their outcomes.
The Chao2 estimator was calculated to estimate the maximum expected number of taxa in the study area, and a rarefaction curve was computed to present how sampling effort was related to the observed biodiversity [43,44]. Taxa richness and total density of individuals were calculated for each station, along with Shannon diversity (base e logarithm), Pielou evenness, and taxonomic distinctness indices in order to provide integrative information on community structure, the relative prevalence of constituent taxa, and their taxonomic breadth [45,46,47,48].
To detect assemblages of similar taxa, we performed hierarchical agglomerative clustering based on Ward’s method [49]. The optimal number of clusters was determined using a K-means algorithm [49]. Community variability within each cluster (i.e., a measure of β diversity) was assessed by calculating Bray–Curtis dissimilarity. Characteristic taxa, i.e., taxa that explained a significant proportion of within-cluster similarity, were identified using the similarity percentage routine (SIMPER; 9999 permutations) and the indicator value score (IndVal; 1000 randomization iterations) [50,51]. We calculated average values of abiotic variables for stations grouped within each cluster to detect possible ecological patterns and spatial relationships.
We examined relationships between the benthic community (independent variables) and habitat parameters (predictors) using regression models. Because heavy metal concentrations were only analyzed in Baie des Sept Îles, we considered two models with different predictors and spatial ranges: Model 1 with organic matter and grain-size classes (gravel, sand, silt, clay) at all sampled stations; and Model 2 with heavy metal concentrations (arsenic, cadmium, chromium, copper, iron, manganese, mercury, lead, zinc) at stations in Baie des Sept Îles. We studied potential links between community characteristics (taxa richness, total density of individuals, Shannon diversity, Pielou evenness) and both sets of predictors using multiple linear regressions. Variables were transformed (logarithm or square root) if the assumptions of normality and homoscedasticity were not respected, and multicollinearity was assessed by the Variance Inflation Factor [52]. Outlier stations were determined using Cook’s Distance and removed from analyses [49,53], while correlations between predictors was assessed by the Spearman rank coefficient: when two variables were strongly correlated (ρ > 0.8), one was removed from subsequent analyses although both were considered in interpretations [52]. Significant predictors were identified with a best fit model procedure with package MASS (stepwise, with forward and backward selection of predictors), using the Akaike Information Criterion as the decision metric [52,54]. Finally, we explored relationships between taxa assemblages and both sets of predictors through non-parametric multivariate regression with distance-based linear modelling (DistLM; 9999 permutations) [55]. Outputs of the clustering were combined with the DistLM results in a distance-based redundancy analysis (dbRDA), a constrained ordination method, to further identify relationships between clusters and habitat parameters [55].

3. Results and Discussion

3.1. Description of the Ecosystems

3.1.1. Sediment Parameters

Maps with the parameters values for each sampled station are presented in Figures S1 and S2. Organic matter concentration in the sediment ranged between 0.17% and 3.87%, except for two stations reaching 4.41% and 8.26%, and most sampled stations presented values inferior to 2%. The highest organic matter values were observed in Baie des Sept Îles, directly in front of the city of Sept-Îles and the industrial facilities of Pointe-Noire, and in the western section of the bay close to Zostera marina meadows.
Overall, sediment was mainly composed of a high sand content (average and standard error of 52.7% and 2.3%, respectively) mixed with silt (27.3% and 1.8%). Gravel content was very low at all stations (3.5% and 0.7%), as was clay content (16.5% and 2.2%) except for 35 shallow stations in the Baie des Sept Îles where a dominance by clay was evident (more than 80%).
Most of the heavy metal concentrations for stations in Baie des Sept Îles were below the lowest toxicity criterion (Rare Effect Level) established by Environment Canada [38] and none reached levels corresponding to the highest toxicity criteria (Probable or Frequent Effect Levels). Arsenic, chromium, copper, mercury, and zinc concentrations reached low-to-moderate toxicity levels at 40, 167, 84, eight, and 49 stations out of 175, respectively. Interestingly, nearly all sampled stations present a moderate toxicity to chromium, but St-Louis et al. [56] suggested that higher concentrations could be related to the presence of post-glacial clays as a source of heavy metals, thus contributing to the natural background sediment concentration of these metals. Heavy metal concentrations reported in our study area are lower than surrounding basal concentrations in the Gulf of St. Lawrence [57], except for certain sites within Baie des Sept Îles. A possible explanation may be a dilution effect due to tidal and hydrographic currents, but a circulation model is needed to confirm this hypothesis [33]. The highest values for arsenic, chromium, copper, iron, manganese, lead, and zinc (corresponding to moderate toxicity levels according to the classification), are located in shallow areas close to Sept-Îles industrial harbors and the Pointe-Noire sector, which may be a possible source of metal enrichment in the sediment as ore transformation industries operate in the area.

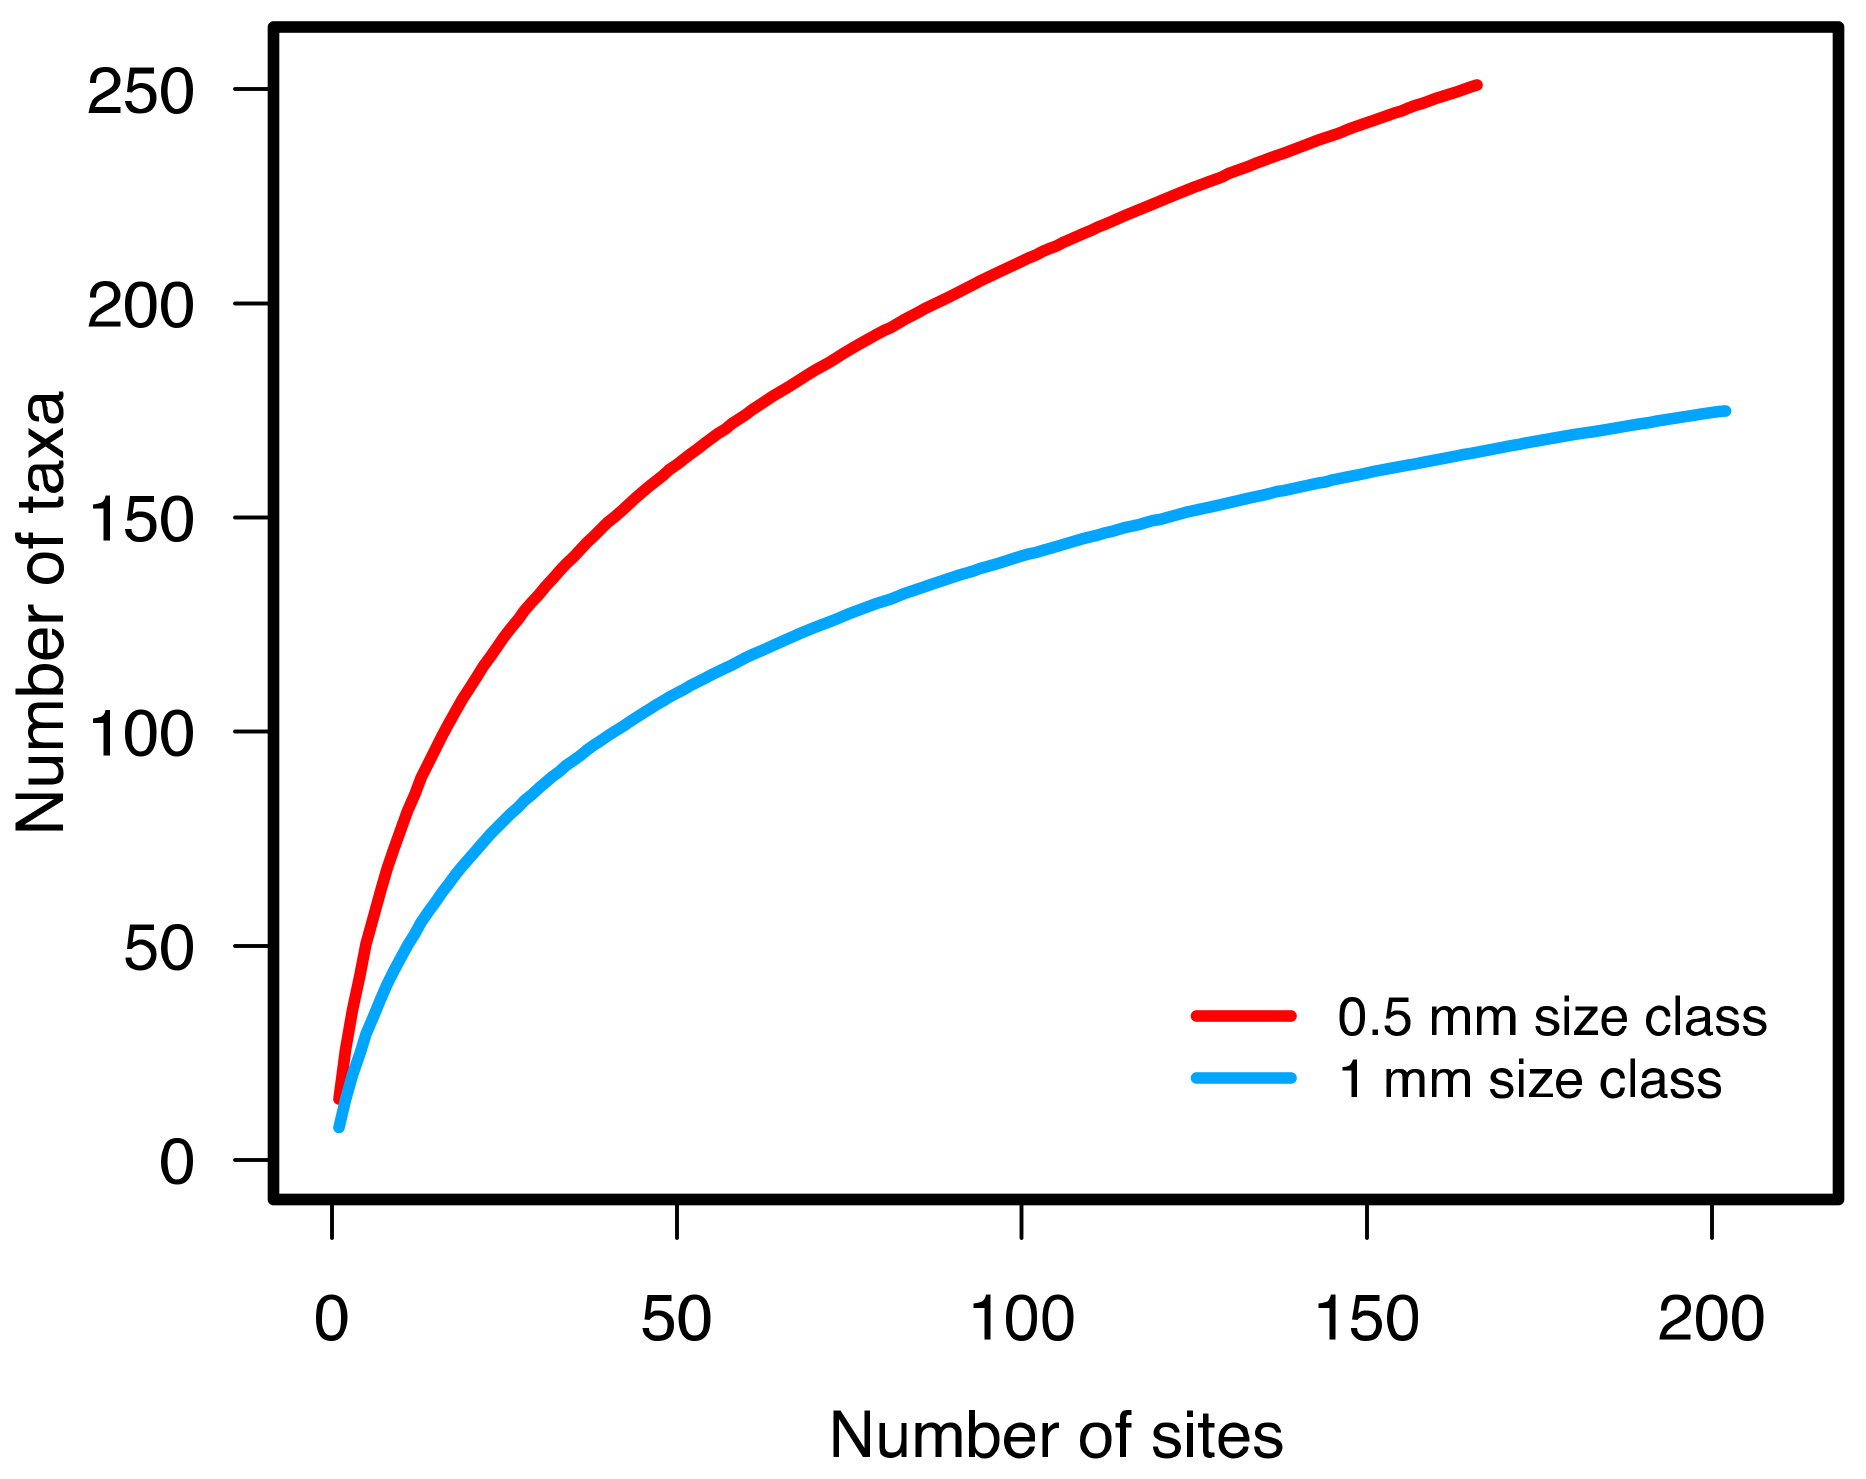
3.1.2. Benthic Community

The complete list of sampled taxa can be found in Table S1. A total of 289 taxa were identified, with individuals from 14 phyla where annelids, arthropods, and mollusks were dominant (Table S1). We compared this dataset with available inventories of benthic invertebrates, and we obtained a 70% match with the Ocean Biodiversity Information System (OBIS) online database [58] and a 96% match with the dedicated catalogue of the Gulf of St. Lawrence from Brunel et al. [59]. Most observed taxa were new mentions for the Sept-Îles region. Ten taxa were not documented in the reference datasets of OBIS and Brunel et al. [58,59]: Bathyporeia quoddyensis, Cyclaspis varians, Glycera alba, Microphthalmus sczelkowii, Kirkegaardia sp., Mya pseudoarenaria, Pholoe minuta tecta, Phylo ornatus, Thyasira gouldi, Tricellaria arctica; though C. varians, M. sczelkowii, M. pseudoarenaria, P. ornatus, and T. gouldi are registered as being present in the region by the World Register of Marine Species [40]. Specific diversity studies for coastal and shallow waters in the Gulf of St. Lawrence are scarce, in particular for the Sept-Îles region. Because historical surveys have mainly focused on commercially important species, birds or cetaceans, further taxonomical groundwork is needed before robust interpretations of these distributions can be made. Our study does not report the presence of known exotic species in the area [60], however sampling campaigns considering other macrofaunal components, such as rocky substrate communities or fouling invertebrates, would be a valuable addition to complement this portrait.
Comparisons of biodiversity inventories obtained for each size class found 137 taxa in common, while 114 were found only in the 0.5 mm size class (for a total of 251 taxa) and 38 only in the 1 mm size class (total of 175 taxa). This difference highlights the advantage of using smaller mesh sizes to survey macrofaunal diversity, as small individuals, larvae, and some juvenile stages cannot be properly sampled with larger sieves and will result in a smaller biodiversity inventory [24]. When we estimated the total taxa richness with the Chao2 index, we sampled 63% of the estimated taxa pool (Chao2 = 397) for the 0.5 mm size class and 75% (Chao2 = 232) for the 1 mm size class. Thus, the sampling campaigns were not able to survey the entire biodiversity of the region, where between 58 and 119 taxa may theoretically still be discovered or reported. The rarefaction curve for each size class did not reach an asymptote, further reinforcing the need to increase sampling effort to accurately describe the regional benthic biodiversity (Figure 2).
The highest values of taxa richness and total density were found in the Baie des Sept Îles sector, in particular in front of the city of Sept-Îles and in the southern section of the bay close to Pointe-Noire (Figure S3). Densities as high as 2000 individuals per grab were found at these stations for the 0.5 mm size class, consisting of mostly the polychaete Micronephthys neotena. There was a decrease in Shannon diversity, Pielou evenness, and taxonomic distinctness relative to other stations for both size classes. These patterns may indicate that these communities experience local structuring factors, such as ecosystem perturbation [3], which is further reinforced by the differences in habitat parameters reported in the previous section.
A comparison between mean values of community characteristics obtained for each size class is presented in Table 1. The major differences were observed for taxa richness (nearly twice as high for the 0.5 mm size class) and for total density (nearly six times higher). As expected, more individuals were retained by the 0.5 mm sieving mesh. The average Shannon index was slightly higher for the 0.5 mm size class, while average Pielou evenness was around 0.7 for both classes. Concerning taxonomic distinctness, the majority of stations of both size classes were within the confidence interval around the expected average (calculated by the standard deviation of the index in relation to taxa richness), except for some 0.5 mm size class stations which were characterized by a low taxonomic distinctness relative to the rest of the sampled stations (Figure 3).
Relationships between community characteristics and habitat parameters are described in Table 2. For both size classes, predictive power of the regressions varied between 0.02 and 0.5 and models considering organic matter and grain-size classes as predictors presented higher R a d j 2 than did those considering heavy metal concentrations. Depth had a positive influence on nearly all community characteristics except total density, which is coherent with general patterns of coastal marine biodiversity [61,62,63]. Three groups of variables were strongly correlated: organic matter/silt, chromium/iron/manganese, and copper/lead/zinc (thus considered together in interpretations).
For the 0.5 mm size class, most of the predictors selected by the best fit model procedure for Models 1 and 2 had a positive influence on community characteristics, except for arsenic, cadmium, and mercury in Model 2 where coefficients were negative (Table 2). Regressions for the 1 mm size class resulted in fewer predictors selected, with a positive influence of copper/lead/zinc in Model 2 and a negative influence of sand and clay in Model 1 and cadmium in Model 2 (Table 2). When comparing the outcomes of Model 1 for each size class, gravel, sand, and clay contents had opposite effects. For Model 2, few heavy metals influenced the 1 mm size class compared to the 0.5 mm size class, where only taxa richness and Shannon diversity were significantly related to predictors (with a very low predictive power). These results may indicate an increased influence of metals on smaller organisms, with an increased vulnerability except for copper/lead/zinc where the influence was positive. Concentration of the latter metals in surface sediments may be closely correlated to sediment texture [64], suggesting that this positive influence may also arise from a sediment composition favorable to both copper/lead/zinc concentrations and benthic communities. Ellis et al. [65] reported significant relationships between heavy metal loading and traits such as body size, but further research is needed to understand responses of different macrofaunal components. Concerning the whole benthic community, the DistLM procedures selected all available predictors in Models 1 and 2 for the 0.5 mm size class, with R 2 = 0.27 and 0.18, respectively, while for the 1 mm size class depth, organic matter/silt, sand, clay were selected in Model 1 ( R 2 = 0.14) and cadmium, chromium/iron/manganese, copper/lead/zinc in Model 2 ( R 2 = 0.07).
Regressions for the 1 mm size class had less predictive power than did those for the 0.5 mm size class. Organism size may affect these regressions, as sieve size employed has been shown to influence the calculation of community characteristics (see previous sections and e.g., [23,24]). Another possible influence could be the sampling strategy, as the 0.5 mm size class considered stations in two sectors while stations sampled for the 1 mm size class were located in four sectors. These results offer valuable insights for the understanding of benthic ecosystems, especially in order to predict their evolution when considering forcing factors, such as climate change or anthropogenic development, on habitat parameters. Furthermore, comparison of models for the 0.5 mm and 1 mm size classes allow to show how sampling strategies (e.g., sieving mesh size, spatial range considered) influence community descriptions, which provides methodological recommendations for future environmental assessments in this region.

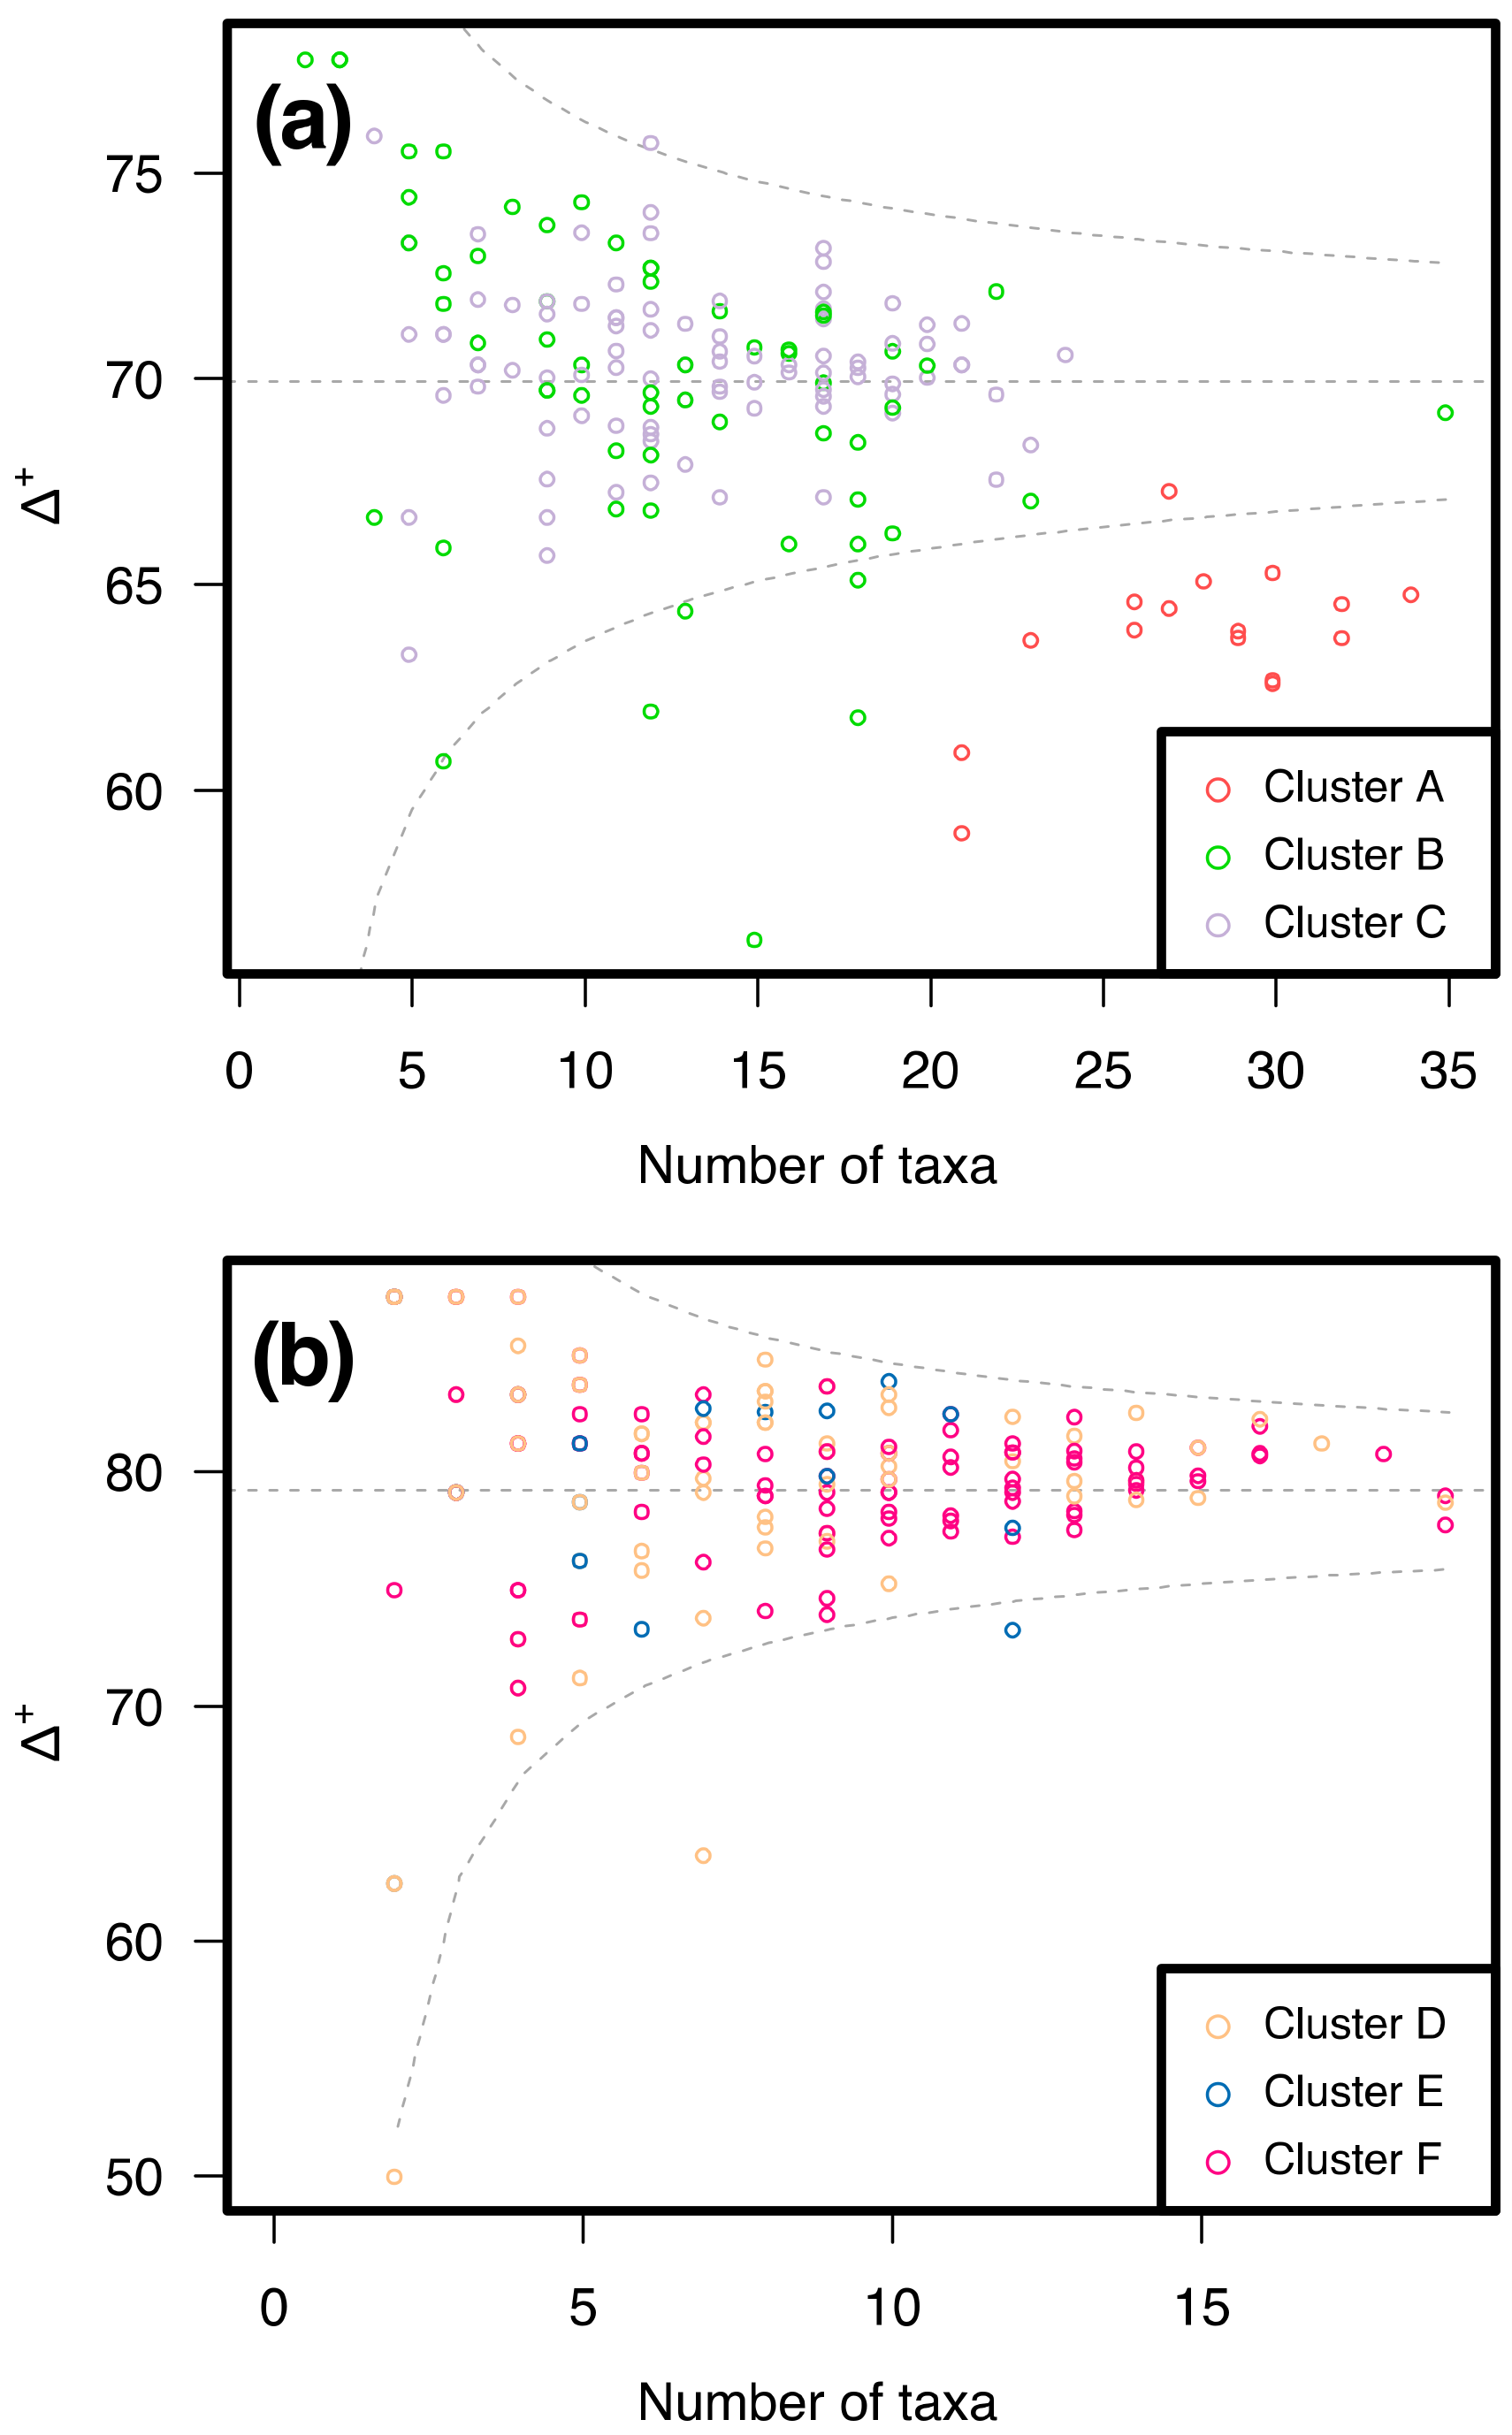
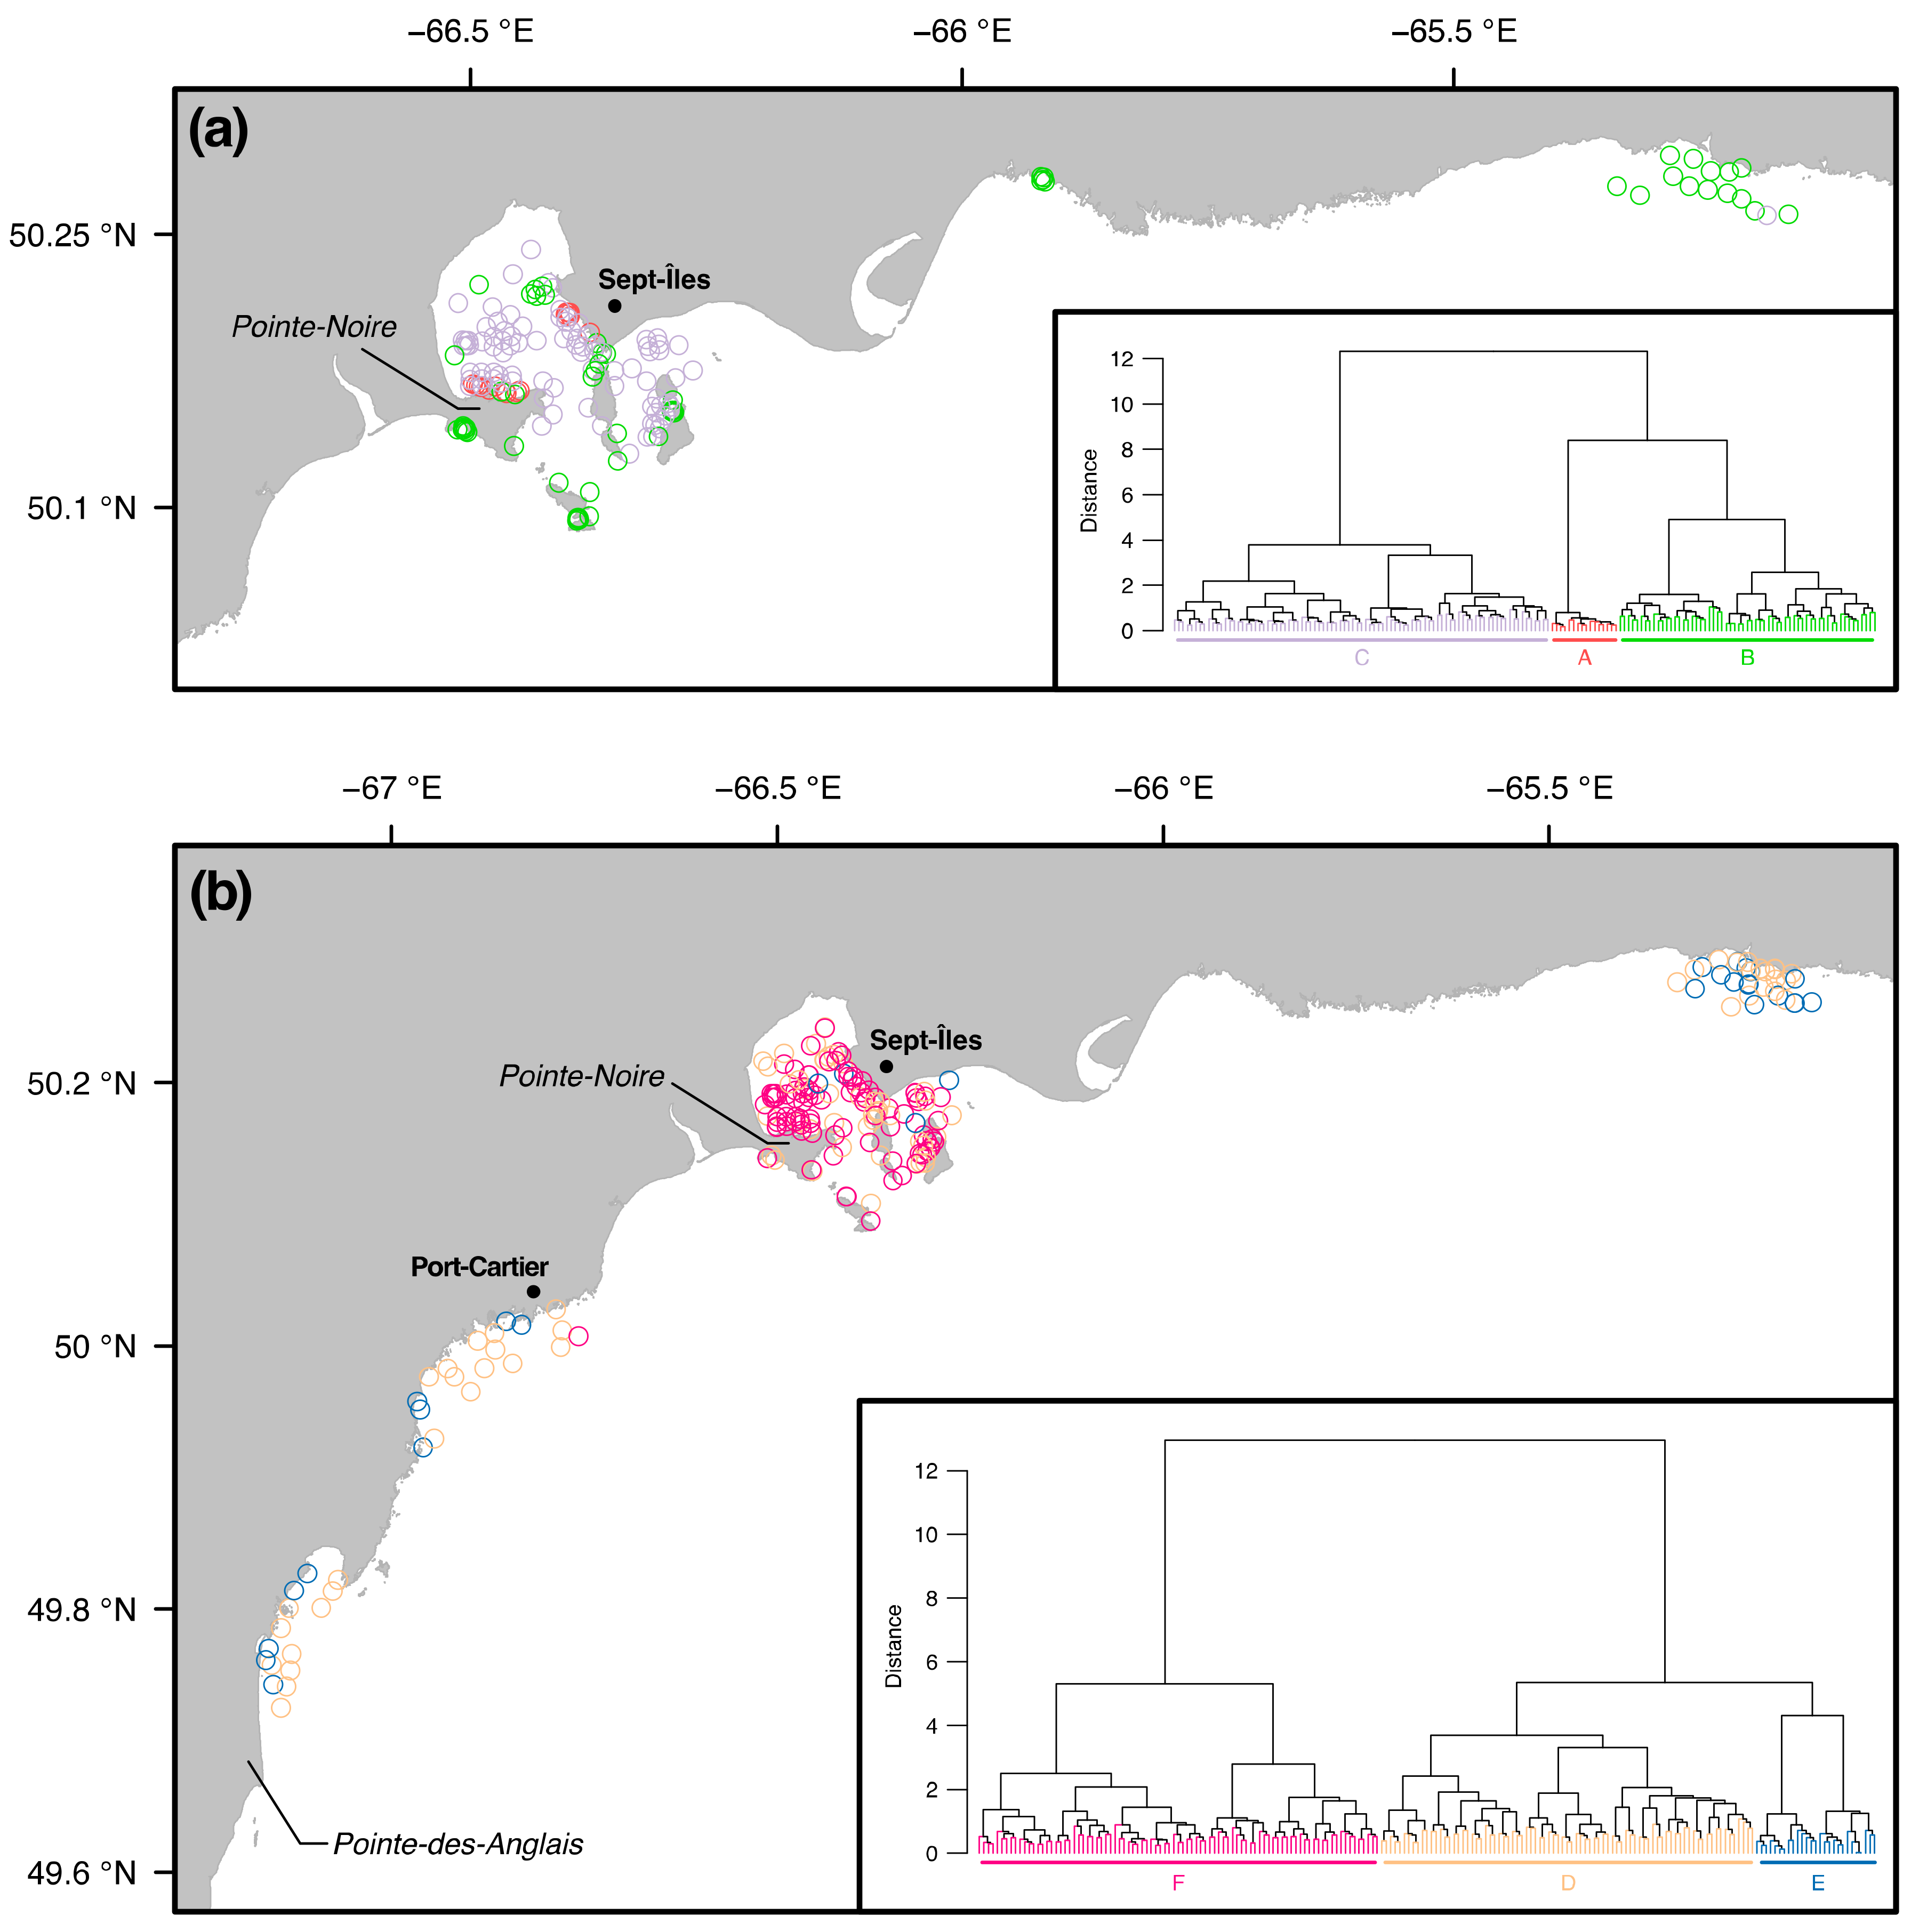
3.2. Similarity between Taxa Assemblages

3.2.1. 0.5 mm Size Class

Hierarchical agglomerative clustering for the 0.5 mm size class identified three clusters of similar stations (Figure 4a). Mean Bray–Curtis dissimilarity was 0.38, 0.85, and 0.69 for clusters A, B, and C, respectively, indicating a higher variability for communities of stations within clusters B and C compared to cluster A (Table 3). Mean within-cluster taxonomic distinctness varies between cluster A (63.8%) and clusters B and C (69.9% and 70.4%, respectively). As shown in Figure 3a, stations from cluster A were well discriminated from those of clusters B and C, because of a lower taxonomic distinctness outside the confidence interval.
Stations of cluster A were located exclusively in Baie des Sept Îles, in front of the city of Sept-Îles and the industrial operations of Pointe-Noire (Figure 4a). The benthic community of stations in cluster A was dominated by annelids, representing 89.5% of the sampled individuals, with some phoronids (5%). Micronephthys neotena, Nephtys sp., Prionospio steenstrupi, Scoloplos armiger, and Phoronida accounted for 51% of the total contribution to cluster similarity, while 50 taxa were selected by the IndVal index as characteristic of the community based on their contribution to the cluster similarity. These stations were shallow, at 4 m deep on average, with a high organic matter content and a sediment mostly composed of clay, and average heavy metal concentrations were the highest observed in our sampling (Table 4). Several characteristic taxa can be linked to human perturbation: M. neotena has been found in high density at decommissioned dump sites within Baie-des-Chaleurs (eastern Canada), suggesting an opportunistic behavior toward perturbation [66,67], while S. armiger and P. steenstrupi are ranked ‘tolerant to disturbance’ and ‘second-order opportunistic’, respectively, in the organic matter enrichment classification of Borja et al. [21].
Cluster B regrouped some stations in Baie des Sept Îles (close to the coast and in the archipelago) and nearly all of those at Manitou River (Figure 4a). Taxa assemblage was characterized by a combination of arthropods (32.7% of the sampled individuals), annelids (22.3%), and mollusks (20.9%), with a presence of nematodes (14.6%) and echinoderms (8%). Of the total contribution to community similarity, 67% was explained by Echinarachnius parma, Nematoda, Phoxocephalus holbolli, Harpacticoida, and Spisula solidissima, with 12 significant taxa for this cluster according to IndVal scores. Mean station depth was 14 m, with low organic matter, a high content of sand and clay; stations of this cluster located in Baie des Sept Îles had low concentrations of heavy metal in the sediment (Table 4). This cluster regroups taxa that are sensitive to perturbation, such as P. holbolli and S. solidissima, both of which have been classified as being ‘very sensitive to disturbance’ [21]. Furthermore, Nelson et al. [68] described physiological impacts of heavy metal loading for S. solidissima, especially for increased copper concentrations.
For cluster C, stations were widely distributed in Baie des Sept Îles (except for one station at Manitou River; Figure 4a). Arthropods (42.3%) and annelids (37.8%) were the main phyla of this cluster, with a further large proportion (14.2%) represented by mollusks. Fifteen taxa were selected by the IndVal scores, with characteristic taxa being M. neotena, Macoma calcarea, Eudorellopsis integra, Protomedeia grandimana, and Leucon (Leucon) nasicoides (64% of the total similarity). Station depth was high, 33 m deep on average, and the sediment had a sandy-silty profile with moderate concentrations of organic matter and heavy metal compared to the other clusters (Table 4). Here, taxa do not present a particular relationship to perturbation, with many representative taxa being ‘indifferent to disturbance’, including M. calcarea, P. grandimana, and L. (Leucon) nasicoides, with the exception of M. neotena as described above [21].
The comparison of characteristic taxa in clusters shows cluster A to be quite different from the other clusters. This difference is visible on the two dbRDAs, where there is an evident discrimination of cluster A’s assemblages relative to those of clusters B and C, mainly explained by depth and clay for Model 1 and chromium/iron/manganese concentrations for Model 2 (Figure 5a,b). Bray–Curtis dissimilarities indicate a higher similarity within this cluster, which may be explained by uniformization due to some perturbation [69,70]. Furthermore, cluster A’s stations are close to human activities, a possible source for higher contents of organic matter, heavy metal, and clay contents relative to other stations in Baie des Sept Îles. As suggested by Pearson and Rosenberg [3], those specific sites may present an ecosystem disturbance due to an increased organic matter. Local hydrodynamics are likely one of the main factors influencing sediment composition [33]. We may also postulate that dredging activities, where a dumping site is operated close to cluster A’s stations, may impact on the composition of benthic sediments by favoring the accumulation of fine particles [71]. Contaminants in sediments, such as heavy metals, are known to impact marine species at the individual level, for example by affecting their metabolism and their reproductive success, which extends their impacts to the distribution of community traits [72,73,74]. The link between higher contaminant concentrations and human perturbation is well established (e.g., [75,76]). However, the presence of post-glacial clay can temper perceived effects of heavy metal inputs from anthropogenic sources on benthic communities [56], even though specific sites close to harbor installations seem to present overall higher concentrations than those in the rest of Baie des Sept Îles.
These results strongly suggest that cluster A regroups stations with a higher perturbation status than those of cluster B, while cluster C possesses an intermediate profile, with a possible relationship with organic matter content and heavy metal concentrations. Consequently, this size class allowed to detect a certain perturbation signal on benthic communities, located in specific areas.

3.2.2. 1 mm Size Class

Three groups of stations were also identified by hierarchical agglomerative clustering for the 1 mm size class (Figure 4b). Mean Bray–Curtis dissimilarity was highest for cluster D (0.93), intermediate for cluster F (0.81), and lowest for cluster E (0.78; Table 3). No particular relationship could be identified based on mean taxonomic distinctness, even though the average for cluster E’s (71.1%) was slightly less than those for clusters D and F (77.6% and 79.7%, respectively; Figure 3b).
Cluster D regrouped stations from all four sampled sectors, in particular most of the stations on the coast of Port-Cartier and the Pentecôte and Manitou rivers were included here (71%, 67%, and 58% of the stations, respectively; Figure 4b). Arthropods (39.4% of the sampled individuals), mollusks (20.2%), annelids (18.2%), and echinoderms (17%) were the phyla dominating the community. Characteristic taxa were Cistenides granulata, E. parma, P. holbolli, Nephtys caeca, and Strongylocentrotus sp. (62% of the total similarity), and 13 taxa had significant IndVal scores. Stations were quite shallow (21.5 m deep) on average, with a low organic matter content and a sediment composed of sand with some silt (Table 4). Interestingly, while many taxa are classified as ‘indifferent to disturbance’, this is not the case for P. holbolli and Strongylocentrotus sp. which are ‘very sensitive’, indicating mixed responses of taxa in this cluster’s taxa [21].
Concerning cluster E, nearly all stations were located outside of Baie des Sept Îles (Figure 4b). Its assemblage was dominated by echinoderms (48%) and mollusks (40.6%), with E. parma and Mesodesma arctatum accounting for 93% of the total similarity and were two of the three taxa selected by the IndVal calculation. Compared to the other clusters, stations were shallower (mean depth of 16.1 m), had less organic matter, and the sediment was mostly sandy (Table 4). Three stations in Baie des Sept Îles had low heavy metal concentrations, but these values are not informative compared to the other clusters because of the very low number of stations available to calculate averages. E. parma and M. arctatum are not referenced in the classification of Borja et al., but many echinoids and some species of the genus Mesodesma are known to be ‘very sensitive to disturbance’ [21], which is an evidence this cluster may be an evidence of a low perturbation profile.
Finally, cluster F regrouped only stations in Baie des Sept Îles (Figure 4b). Of the sampled individuals, 41.2% were arthropods, 35.5% annelids, 21.4% mollusks, and 26 taxa were selected by their IndVal scores. Characteristic taxa were M. calcarea, E. integra, Ennucula tenuis, M. neotena, and Protomedeia grandimana (66% of the total similarity). Stations were at 32.5 m deep on average, with an equal proportion of sand and silt, a high organic matter content, and high overall heavy metal concentrations (Table 4). This cluster is very similar to cluster C for the 0.5 mm size class, both in terms of habitat parameters values and characteristic taxa.
Stations of clusters D and F presented a wider dispersion on the dbRDAs than those of cluster E, where the latter were grouped and influenced by a high sand content and low organic matter/silt for Model 1, and heavy metal concentrations for Model 2 (Figure 5c,d). Depth, organic matter/silt, sand, clay (Model 1), and all heavy metals except arsenic and mercury (Model 2) were selected to explain the structure of the 1 mm size class assemblages, even though values were quite low (0.14 and 0.07; Figure 5c,d). Clusters D and E do not seem to be particularly perturbed, having a profile quite characteristic of other coastal ecosystems in the Gulf of St. Lawrence and presenting taxa that are sensitive to disturbance. On the other hand, cluster F seems to exhibit a somewhat different profile, where there is a higher sediment organic matter content. Apart from a possible human perturbation, another possible driver to explain the structure of the benthic communities is the sedimentary profile. Sediments in clusters D and E’s stations are mainly sandy whereas those for cluster F are mostly sandy silty. The dominance of sand-dwelling species such as M. arctatum and E. parma in clusters D and E supports this hypothesis [77].
These results show that clusters obtained for the 1 mm size class seem to be more variable than those observed for the 0.5 mm size class, as shown by higher Bray–Curtis dissimilarity values for the former. By sampling only individuals larger than 1 mm only, the assessment of benthic ecosystems seems to be insufficient to differentiate ecosystem perturbation from natural variability [24,25,78]. This is of even greater importance when considering that the 0.5 mm size class can detect some ecosystem perturbation, as shown above. Further field campaigns, including factorial sampling with possibly impacted and reference areas, along with local experimental and manipulative work, would provide more robust conclusions on the 1 mm size class and link taxa responses to environmental perturbation.

4. Conclusions

Our work provides the first description of benthic habitats and communities in the sub-Arctic ecosystems of Sept-Îles, which is an important contribution to local and regional biodiversity surveys and a necessary step towards establishing baseline conditions for environmental assessments. Regression models between community characteristics (e.g., taxa richness or diversity), taxon densities, and habitat parameters (e.g., organic matter, heavy metals) highlight how abiotic parameters may impact benthic communities and provide predictive methods to assess the evolution of these communities in future environmental conditions. Finally, we detected taxa assemblages with similar distributions in the environment, which we related to the values of habitat parameters to highlight perturbation patterns.
By studying multiple size classes of macrofauna, we were able to compare how they will influence the description of benthic communities. When including smaller organisms (0.5 mm size class), conclusions were more robust and we were able to document local perturbation responses. The evaluation of only larger organisms (1 mm size class) was able to decrease the time needed to sample and identify taxa, but at the cost of reducing the strength of similarity analyses and of detecting relationships to habitat parameters variation and perturbation.
Our results provide valuable guidelines for the environmental monitoring of benthic ecosystems in industrial harbor areas, along with ecological data to better understand how sub-Arctic ecosystems react to environmental perturbation.

Supplementary Materials

The following are available online at https://www.mdpi.com/2073-4441/12/9/2424/s1. Figure S1: Values of habitat parameters at each station. (a) Map for station depth; (b) Map for organic matter content; (c) Map for gravel content; (d) Map for sand content; (e) Map for silt content; (f) Map for clay content, Figure S2: Values of heavy metal concentrations at each station. (a) Map for arsenic concentration; (b) Map for cadmium concentration; (c) Map for chromium concentration; (d) Map for copper concentration; (e) Map for iron concentration; (f) Map for manganese concentration; (g) Map for mercury concentration; (h) Map for lead concentration; (j) Map for zinc concentration, Figure S3: Values of community characteristics at each station. (a) Map for taxa richness for the 0.5 mm size class; (b) Map for taxa richness for the 1 mm size class; (c) Map for total density for the 0.5 mm size class; (d) Map for total density for the 1 mm size class; (e) Map for Shannon diversity for the 0.5 mm size class; (f) Map for Shannon diversity for the 1 mm size class; (g) Map for Pielou evenness for the 0.5 mm size class; (h) Map for Pielou evenness for the 1 mm size class; (i) Map for taxonomical distinctness for the 0.5 mm size class; (j) Map for taxonomical distinctness for the 1 mm size class, Table S1: List of the taxa along with the number of stations where this taxon was present and the number of collected individuals, for the 0.5 mm and the 1 mm size classes.

Author Contributions

Conceptualization, E.D., C.W.M., C.G. and P.A.; Data curation, E.D., C.G., L.T.d.C. and R.S.-L.; Formal analysis, E.D.; Funding acquisition, C.W.M. and P.A.; Investigation, E.D.; Methodology, E.D., C.W.M., C.G., and P.A.; Project administration, E.D., C.W.M. and P.A.; Resources, E.D.; Software, E.D.; Supervision, E.D., C.W.M., and P.A.; Validation, E.D., C.W.M., C.G., L.T.d.C., R.S.-L. and P.A.; Visualization, E.D.; Writing—Original draft, E.D.; Writing—Review and editing, E.D., C.W.M., C.G., L.T.d.C., R.S.-L. and P.A. All authors have read and agreed to the published version of the manuscript.

Funding

This research was sponsored by Natural Sciences and Engineering Research Council of Canada (NSERC) Canadian Healthy Oceans Network (CHONe II) and its partners: Fisheries and Oceans Canada and Institut Nordique de Recherche en Environnement et en Santé au Travail (INREST, representing the Port of Sept-Îles and City of Sept-Îles), and by Fonds de Recherche Québécois Nature et Technologies (FRQNT) Strategic Network Québec-Océan. Grants were allocated to PA and CM.

Acknowledgments

The authors would like to acknowledge and thank all the people that helped during the field campaigns, lab work and data analysis: Julie Carrière, Claudy Dechêsne, Serge Gallienne, Dany Lévesque, Laure de Montety, Philippe-Olivier Dumais, Raphaël Bouchard, Jean-Luc Shaw, David Beauchesne, David Poissant and Sara Marullo. This study is a contribution to the research program of Québec-Océan, which also provided scientific and financial support.

Conflicts of Interest

The authors declare that the research was conducted in the absence of any commercial or financial relationships that could be construed as a potential conflict of interest.

Data and Code Availability

Data and code used for this study are available online at https://doi.org/10.5683/SP2/5LJYXO.

References

  1. Halpern, B.S.; Frazier, M.; Afflerbach, J.; Lowndes, J.S.; Micheli, F.; O’Hara, C.; Scarborough, C.; Selkoe, K.A. Recent pace of change in human impact on the world’s ocean. Sci. Rep. 2019, 9, 1–8. [Google Scholar] [CrossRef] [PubMed] [Green Version]
  2. Halpern, B.S.; Selkoe, K.A.; Micheli, F.; Kappel, C.V. Evaluating and ranking the vulnerability of global marine ecosystems to anthropogenic threats. Conserv. Biol. 2007, 21, 1301–1315. [Google Scholar] [CrossRef] [PubMed]
  3. Pearson, T.H.; Rosenberg, R. Macrobenthic succession in relation to organic enrichment and pollution of the marine environment. Oceanogr. Mar. Biol. Annu. Rev. 1978, 16, 229–311. [Google Scholar]
  4. Sala, E.; Knowlton, N. Global marine biodiversity trends. Annu. Rev. Environ. Resour. 2006, 31, 93–122. [Google Scholar] [CrossRef] [Green Version]
  5. Brander, K.; Botsford, L.W.; Ciannelli, L.; Fogarty, M.J.; Heath, M.; Planque, B.; Shannon, L.J.; Wieland, K. Human impacts on marine ecosystems. In Marine Ecosystems and Global Change; Barange, M., Field, J.G., Harris, R.P., Hofmann, E.E., Perry, R.I., Werner, F.E., Ashby, D.M., Eds.; Oxford University Press: Oxford, UK, 2010; pp. 41–71. [Google Scholar]
  6. Piot, A.; Nozais, C.; Archambault, P. Meiofauna affect the macrobenthic biodiversity-ecosystem functioning relationship. Oikos 2014, 123, 203–213. [Google Scholar] [CrossRef]
  7. Edie, S.M.; Jablonski, D.; Valentine, J.W. Contrasting responses of functional diversity to major losses in taxonomic diversity. Proc. Natl. Acad. Sci. USA 2018, 115, 732–737. [Google Scholar] [CrossRef] [Green Version]
  8. Lacoste, É.; Piot, A.; Archambault, P.; McKindsey, C.W.; Nozais, C. Bioturbation activity of three macrofaunal species and the presence of meiofauna affect the abundance and composition of benthic bacterial communities. Mar. Environ. Res. 2018, 136, 62–70. [Google Scholar] [CrossRef]
  9. Convention on Biological Diversity. Available online: https://www.cbd.int/doc/legal/cbd-en.pdf (accessed on 4 May 2020).
  10. Aichi Biodiversity Targets. Available online: https://www.cbd.int/sp/targets (accessed on 4 May 2020).
  11. Sustainable Development Goals. Available online: http://www.un.org/sustainabledevelopment/news/communications-material (accessed on 4 May 2020).
  12. Brown, C.J.; Saunders, M.I.; Possingham, H.P.; Richardson, A.J. Interactions between global and local stressors of ecosystems determine management effectiveness in cumulative impact mapping. Divers. Distrib. 2014, 20, 538–546. [Google Scholar] [CrossRef] [Green Version]
  13. Borja, Á.; Dauer, D.M.; Grémare, A. The importance of setting targets and reference conditions in assessing marine ecosystem quality. Ecol. Indic. 2012, 12, 1–7. [Google Scholar] [CrossRef]
  14. Dauvin, J.C.; Ruellet, T.; Desroy, N.; Janson, A.-L. The ecological quality status of the Bay of Seine and the Seine estuary: Use of biotic indices. Mar. Pollut. Bull. 2007, 55, 241–257. [Google Scholar] [CrossRef] [Green Version]
  15. Pratt, D.R.; Lohrer, A.M.; Pilditch, C.A.; Thrush, S.F. Changes in ecosystem function across sedimentary gradients in Estuaries. Ecosystems 2014, 17, 182–194. [Google Scholar] [CrossRef]
  16. Largaespada, C.; Guichard, F.; Archambault, P. Meta-ecosystem engineering: Nutrient fluxes reveal intraspecific and interspecific feedbacks in fragmented mussel beds. Ecology 2012, 93, 324–333. [Google Scholar] [CrossRef] [PubMed]
  17. Link, H.; Piepenburg, D.; Archambault, P. Are hotspots always hotspots? The relationship between diversity, resource and ecosystem functions in the Arctic. PLoS ONE 2013, 8, e74077. [Google Scholar] [CrossRef] [PubMed]
  18. Belley, R.; Snelgrove, P.V.R.; Archambault, P.; Juniper, S.K. Environmental drivers of benthic flux variation and ecosystem functioning in Salish Sea and Northeast Pacific sediments. PLoS ONE 2016, 11, e0151110. [Google Scholar] [CrossRef] [Green Version]
  19. Bourque, J.R.; Demopoulos, A.W.J. The influence of different deep-sea coral habitats on sediment macrofaunal community structure and function. PeerJ 2018, 6. [Google Scholar] [CrossRef] [Green Version]
  20. Dauer, D.M. Biological criteria, environmental health and estuarine macrobenthic community structure. Mar. Pollut. Bull. 1993, 26, 249–257. [Google Scholar] [CrossRef]
  21. Borja, A.; Franco, J.; Pérez, V. A marine Biotic Index to establish the ecological quality of soft-bottom benthos within European estuarine and coastal environments. Mar. Pollut. Bull. 2000, 40, 1100–1114. [Google Scholar] [CrossRef]
  22. Eleftheriou, A.; McIntyre, A. Methods for the Study of Marine Benthos, 3rd ed.; Eleftheriou, A., McIntyre, A., Eds.; Blackwell Science: Oxford, UK, 2005; p. 418. ISBN 0632054883. [Google Scholar]
  23. McKindsey, C.W.; Bourget, E. Body size and spatial variation of community structure in subarctic intertidal boulder fields. Mar. Ecol. Prog. Ser. 2001, 216, 17–30. [Google Scholar] [CrossRef]
  24. Gage, J.D.; Hughes, D.J.; Gonzalez-Vecino, J.L. Sieve size influence in estimating biomass, abundance and diversity in samples of deep-sea macrobenthos. Mar. Ecol. Prog. Ser. 2002, 225, 97–107. [Google Scholar] [CrossRef]
  25. Couto, T.; Patrício, J.; Neto, J.M.; Ceia, F.R.; Franco, J.; Marques, J.C. The influence of mesh size in environmental quality assessment of estuarine macrobenthic communities. Ecol. Indic. 2010, 10, 1162–1173. [Google Scholar] [CrossRef]
  26. Belley, R.; Archambault, P.; Sundby, B.; Gilbert, F.; Gagnon, J.M. Effects of hypoxia on benthic macrofauna and bioturbation in the Estuary and Gulf of St. Lawrence, Canada. Cont. Shelf Res. 2010, 30, 1302–1313. [Google Scholar] [CrossRef] [Green Version]
  27. Daigle, R.M.; Archambault, P.; Halpern, B.S.; Lowndes, J.S.; Côté, I.M. Incorporating public priorities in the ocean health index: Canada as a case study. PLoS ONE 2017, 12, e0178044. [Google Scholar] [CrossRef] [PubMed]
  28. Schloss, I.; Archambault, P.; Beauchesne, D.; Bourgault, D.; Cusson, M.; Dumont, D.; Ferreyra, G.; Levasseur, M.; Pelletier, É.; St-Louis, R.; et al. Impacts potentiels cumulés des facteurs de stress liés aux activités humaines sur l’écosystème marin du Saint-Laurent. In Les Hydrocarbures Dans le Golfe du Saint-Laurent—Enjeux Sociaux, Economiques et Environnementaux; Archambault, P., Schloss, I., Grant, C., Plante, S., Eds.; Notre Golfe: Rimouski, QC, Canada, 2017; pp. 132–165. [Google Scholar]
  29. Statistics Canada. Shipping in Canada: 2011; Statistics Canada: Ottawa, ON, Canada, 2011. [Google Scholar]
  30. Department of Fisheries and Oceans. Update of Stock Status Indicators for Northern Shrimp in the Estuary and Gulf of St. Lawrence; Canadian Science Advisory Secretariat: Ottawa, ON, Canada, 2019. [Google Scholar]
  31. Demers, K.A.; le Hénaff, A.; Carrière, J. État des glaces. In Observatoire Environnemental de la Baie de Sept-Îles; Carrière, J., Ed.; INREST: Sept-Îles, QC, Canada, 2018; pp. 593–612. [Google Scholar]
  32. Dutil, J.-D.; Proulx, S.; Galbraith, P.S.; Chasse, J.; Lambert, N.; Laurian, C. Coastal and epipelagic habitats of the estuary and Gulf of St. Lawrence. Can. Tech. Rep. Fish. Aquat. Sci. 2012, 3009, 1–87. [Google Scholar]
  33. Shaw, J.-L.; Bourgault, D.; Dumont, D. Hydrodynamique de la Baie de Sept-Îles. Master’s Thesis, Université du Québec à Rimouski, Rimouski, QC, Canada, 2019. [Google Scholar]
  34. Davies, B.E. Loss-on-Ignition as an estimate of soil organic matter. Soil Sci. Soc. Am. J. 1974, 38, 150. [Google Scholar] [CrossRef]
  35. Wentworth, C.K. A Scale of grade and class terms for clastic sediments. J. Geol. 1922, 30, 377–392. [Google Scholar] [CrossRef]
  36. Folk, R.L. Petrology of Sedimentary Rocks, 2nd ed.; Hemphill Publishing Company: Austin, TX, USA, 1980. [Google Scholar]
  37. Centre d’Expertise en Analyse Environnementale du Québec. Détermination des Métaux: Méthode par Spectrométrie de Masse à Source Ionisante au Plasma D’argon; MA. 200—Mét 1.2, Rév 5; Ministère du Développement Durable de L’environnement et de la Lutte contre les Changements Climatiques du Québec: Quebec, QC, Canada, 2014. [Google Scholar]
  38. Environment Canada and Ministère du Développement Durable de l’environnement et des Parcs du Québec. Criteria for the Assessment of Sediment Quality in Quebec and Application Frameworks: Prevention, Dredging and Remediation; Environment Canada and Ministère du Développement Durable de l’environnement et des Parcs du Québec: Quebec, QC, Canada, 2007. [Google Scholar]
  39. Dale, M.R.T.; Fortin, M.-J. Spatial Analysis: A Guide for Ecologists, 2nd ed.; Cambridge University Press: Cambridge, UK, 2014. [Google Scholar]
  40. World Register of Marine Species. Available online: http://marinespecies.org (accessed on 4 May 2020).
  41. Clarke, K.R.; Gorley, R.N. PRIMER v6: User Manual/Tutorial; Primer-E Ltd.: Albany, AK, New Zealand, 2006. [Google Scholar]
  42. R Core Team. R: A Language and Environment for Statistical Computing; R Foundation for Statistical Computing: Vienna, Austria, 2020. [Google Scholar]
  43. Chao, A. Estimating the population size for capture-recapture data with unequal catchability. Biometrics 1987, 43, 783. [Google Scholar] [CrossRef]
  44. Gotelli, N.J.; Colwell, R.K. Quantifying biodiversity: Procedures and pitfalls in the measurement and comparison of species richness. Ecol. Lett. 2001, 4, 379–391. [Google Scholar] [CrossRef] [Green Version]
  45. Warwick, R.M.; Clarke, K.R. New ‘biodiversity’ measures reveal a decrease in taxonomic distinctness with increasing stress. Mar. Ecol. Prog. Ser. 1995, 129, 301–305. [Google Scholar] [CrossRef] [Green Version]
  46. Clarke, K.R.; Warwick, R.M. A taxonomic distinctness index and its statistical properties. J. Appl. Ecol. 1998, 35, 523–531. [Google Scholar] [CrossRef]
  47. Legendre, P.; Borcard, D.; Peres-Neto, P.R. Analyzing beta diversity: Partitioning the spatial variation of community composition data. Ecol. Monogr. 2005, 75, 435–450. [Google Scholar] [CrossRef]
  48. Magurran, A.E.; McGill, B.J. Biological Diversity: Frontiers in Measurement and Assessment, 1st ed.; Oxford University Press: Oxford, UK, 2011. [Google Scholar]
  49. Legendre, P.; Legendre, L.F.J. Numerical Ecology, 2nd ed.; Elsevier: Amsterdam, The Netherlands, 1998. [Google Scholar]
  50. Clarke, K.R. Non-parametric multivariate analyses of changes in community structure. Aust. J. Ecol. 1993, 18, 117–143. [Google Scholar] [CrossRef]
  51. Dufrêne, M.; Legendre, P. Species assemblages and indicator species: The need for a flexible asymmetrical approach. Ecol. Monogr. 1997, 67, 345–366. [Google Scholar] [CrossRef]
  52. Quinn, G.P.; Keough, M.J. Experimental Design and Data Analysis for Biologists; Cambridge University Press: Cambridge, UK, 2002. [Google Scholar]
  53. Cook, R.D. Detection of Influential Observation in Linear Regression. Technometrics 1977, 19, 15–18. [Google Scholar] [CrossRef]
  54. Venables, W.; Ripley, B. Modern Applied Statistics with S, 4th ed.; Springer: New York, NY, USA, 2002. [Google Scholar]
  55. McArdle, B.H.; Anderson, M.J. Fitting multivariate models to community data: A comment on distance-based redundancy analysis. Ecology 2001, 82, 290–297. [Google Scholar] [CrossRef]
  56. St-Louis, R.; Montero-Serrano, J.-C.; Archambault, P.; Dreujou, E.; Carrière, J. Qualité des sédiments. In Observatoire Environnemental de la Baie de Sept-Îles; Carrière, J., Ed.; INREST: Sept-Îles, QC, Canada, 2018; Volume 1, pp. 213–376. ISBN 9782981763600. [Google Scholar]
  57. Lee, K.; Nagler, J.J.; Fournier, M.; Lebeuf, M.; Cyr, D.G. Toxicological characterization of sediments from Baie des Anglais on the St. Lawrence Estuary. Chemosphere 1999, 39, 1019–1035. [Google Scholar] [CrossRef]
  58. Ocean Biodiversity Integration System. Available online: https://obis.org (accessed on 4 May 2020).
  59. Brunel, P.; Bossé, L.; Lamarche, G. Catalogue of the Marine Invertebrates of the Estuary and Gulf of Saint Lawrence; Canadian Special Publication of Fisheries, Aquatic Sciences; NRC Research Press: Ottawa, ON, Canada, 1998. [Google Scholar]
  60. Simard, N.; Pereira, S.; Estrada, R.; Nadeau, M. État de la situation des espèces envahissantes marines du Québec. In Rapport Manuscrit Canadien des Sciences Halieutiques et Aquatiques; Fisheries and Oceans Canada: Mont-Joli, QC, Canada, 2013. [Google Scholar]
  61. Gray, J.S.; Elliott, M. Ecology of Marine Sediments: From Science to Management; Oxford University Press: Oxford, UK, 2009. [Google Scholar]
  62. Levinton, J.S. Marine Biology: Function, Biodiversity, Ecology, 4th ed.; Oxford University Press: Oxford, UK, 2013. [Google Scholar]
  63. Piacenza, S.E.; Barner, A.K.; Benkwitt, C.E.; Boersma, K.S.; Cerny-Chipman, E.B.; Ingeman, K.E.; Kindinger, T.L.; Lee, J.D.; Lindsley, A.J.; Reimer, J.N.; et al. Patterns and variation in benthic biodiversity in a large marine ecosystem. PLoS ONE 2015, 10, e0135135. [Google Scholar] [CrossRef] [Green Version]
  64. Burton, E.D.; Phillips, I.R.; Hawker, D.W. Geochemical partitioning of copper, lead, and zinc in benthic, estuarine sediment profiles. J. Environ. Qual. 2005, 34, 263–273. [Google Scholar] [CrossRef]
  65. Ellis, J.I.; Clark, D.; Atalah, J.; Jiang, W.; Taiapa, C.; Patterson, M.; Sinner, J.; Hewitt, J. Multiple stressor effects on marine infauna: Responses of estuarine taxa and functional traits to sedimentation, nutrient and metal loading. Sci. Rep. 2017, 7. [Google Scholar] [CrossRef] [Green Version]
  66. Noyes, G.S. The biology of Aglaophamus neotenus (Polychaeta: Nephtyidae), a new species from Maine and Canada. Biol. Bull. 1980, 158, 103–117. [Google Scholar] [CrossRef]
  67. Pocklington, P. Polychaetes of Eastern Canada: An Illustrated Key to Polychaetes of Eastern Canada Including the Eastern Arctic; Department of Fisheries and Oceans: Mont-Joli, QC, Canada, 1989. [Google Scholar]
  68. Nelson, D.A.; Miller, J.E.; Calabrese, A. Effect of heavy metals on bay scallops, surf clams, and blue mussels in acute and long-term exposures. Arch. Environ. Contam. Toxicol. 1988, 17, 595–600. [Google Scholar] [CrossRef]
  69. Clarke, K.R.; Warwick, R.M. Change in Marine Communities: An Approach to Statistical Analysis and Interpretation, 2nd ed.; PRIMER-E Ltd.: Plymouth, UK, 2001. [Google Scholar]
  70. Séguin, A.; Gravel, D.; Archambault, P. Effect of disturbance regime on alpha and beta diversity of rock pools. Diversity 2014, 6, 1–17. [Google Scholar] [CrossRef]
  71. Cooper, K.M.; Curtis, M.; Hussin, W.; Froján, B.; Defew, E.C.; Nye, V.; Paterson, D.M. Implications of dredging induced changes in sediment particle size composition for the structure and function of marine benthic macrofaunal communities. Mar. Pollut. Bull. 2011, 62, 2087–2094. [Google Scholar] [CrossRef] [PubMed]
  72. Johnston, E.; Roberts, D. Contaminants reduce the richness and evenness of marine communities: A review and meta-analysis. Environ. Pollut. 2009, 157, 1745–1752. [Google Scholar] [CrossRef] [PubMed]
  73. Chiarelli, R.; Roccheri, M.C. Marine invertebrates as bioindicators of heavy metal pollution. Open J. Met. 2014, 4, 93–106. [Google Scholar] [CrossRef] [Green Version]
  74. Desrosiers, M.; Usseglio-Polatera, P.; Archaimbault, V.; Larras, F.; Méthot, G.; Bernadette, P.-A. Assessing anthropogenic pressure in the St. Lawrence River using traits of benthic macroinvertebrates. Sci. Total Environ. 2018, 649, 233–246. [Google Scholar] [CrossRef] [PubMed]
  75. Schafer, C.T.; Smith, J.N.; Côté, R. The Saguenay Fiord: A major tributary to the St. Lawrence Estuary. In Oceanography of a Large-Scale Estuarine System; El-Sabh, M., Silverberg, N., Eds.; Springer: New York, NY, USA, 1990; pp. 378–420. [Google Scholar]
  76. Bolton, J.L.; Stehr, C.M.; Boyd, D.T.; Burrows, D.G.; Tkalin, A.V.; Lishavskaya, T.S. Organic and trace metal contaminants in sediments and English sole tissues from Vancouver Harbour, Canada. Mar. Environ. Res. 2004, 57, 19–36. [Google Scholar] [CrossRef]
  77. Bourget, E. Les Animaux Littoraux du Saint-Laurent; Presses de l’Université Laval: Québec, QC, Canada, 1997. [Google Scholar]
  78. Bachelet, G. The choice of a sieving mesh size in the quantitative assessment of marine macrobenthos: A necessary compromise between aims and constraints. Mar. Environ. Res. 1990, 30, 21–35. [Google Scholar] [CrossRef]
Figure 1. Maps of the study area. (a) Location of the considered sectors; (b) Stations sampled in the Pentecôte River sector; (c) stations sampled in the coast of Port-Cartier sector; (d) stations sampled in Baie des Sept Îles sector; (e) stations sampled in the Manitou River sector.
Water 12 02424 g001
Figure 2. Rarefaction curves for taxa assemblages of the 0.5 mm and the 1 mm size classes.
Water 12 02424 g002
Figure 3. Scatterplot of the taxonomic distinctness ( Δ   + ) as a number of taxa sampled at a station. The dashed grey line corresponds to the expected value of Δ   + and the dashed grey curves are the upper and lower limits of the standard deviation interval calculated with the value of Δ   + at each station. Point colour represent similarity groups defined by Hierarchical Agglomerative Clustering. (a) Scatterplot for the 0.5 mm size class; (b) Scatterplot for the 1 mm size class.
Water 12 02424 g003
Figure 4. Hierarchical agglomerative clustering of taxa assemblages. The dendrogram presents relationships between stations, displayed on the map with one color for each group. (a) Clusters for the 0.5 mm size class; (b) Clusters for the 1 mm size class.
Water 12 02424 g004
Figure 5. Constrained ordination with a distance-based redundancy analysis for taxa assemblages obtained for the 0.5 mm and 1 mm size classes. Only predictors selected by the distance-based linear modelling (DistLM) are displayed. Point color represents similarity groups defined by the hierarchical agglomerative clustering. (a) Ordination for the 0.5 mm size class with organic matter and grain-size classes as predictors (Model 1); (b) Ordination for the 0.5 mm size class with heavy metal concentrations as predictors (Model 2); (c) Ordination for the 1 mm size class with organic matter and grain-size classes as predictors (Model 1); (d) Ordination for the 1 mm size class with heavy metal concentrations as predictors (Model 2). OM = organic matter, As = arsenic, Cd = cadmium, Cr = chromium, Cu = copper, Fe = iron, Mn = manganese, Hg = mercury, Pb = lead, Zn = zinc.
Water 12 02424 g005
Table 1. Mean values (and standard error) of community characteristics calculated with stations included in the 0.5 mm and the 1 mm size classes.
VariableUnit0.5 mm Size Class1 mm Size Class
Taxa richnesstaxa14.27 (0.53)7.58 (0.31)
Density of individualsind.grab−1225.91 (32.94)39.62 (4.3)
Shannon diversityNA1.79 (0.04)1.42 (0.05)
Pielou evennessNA0.71 (0.01)0.75 (0.02)
Taxonomic distinctnessNA69.14 (0.5)76.49 (1.22)
Table 2. Predictor coefficients (and standard error) from the multiple linear regression models of community characteristics obtained for the 0.5 mm and the 1 mm size classes. Model 1 corresponds to organic matter and grain size classes as predictors for stations in every sector, and Model 2 corresponds to heavy metal concentrations as predictors for stations in Baie des Sept Îles only. OM = organic matter, As = arsenic, Cd = cadmium, Cr = chromium, Cu = copper, Fe = iron, Mn = manganese, Hg = mercury, Pb = lead, Zn = zinc, n = number of stations considered, “—” = predictors excluded by the best fit model selection. Significant p-values of marginal tests on predictors are highlighted in bold.
Model 1
InterceptDepthOM/siltGravelSandClayR 2adj
0.5 mm size class (n = 159)
Specific richness0.02 (0.06)0.24 (0.07)0.29 (0.08)0.2 (0.09)0.25 (0.12)0.75 (0.11)0.33
p-value =0.70950.00110.00050.02670.0305<0.0001
Density of individuals0.02 (0.06)−0.09 (0.07)0.54 (0.07)0.12 (0.08)0.52 (0.11)0.89 (0.1)0.5
p-value =0.79920.1524<0.00010.137<0.0001<0.0001
Shannon diversity0.06 (0.06)0.54 (0.07)0.16 (0.09)0.29 (0.07)0.27
p-value =0.3786<0.0001 0.0671 <0.0001
Pielou evenness0.05 (0.07)0.31 (0.08)-0.14 (0.08)−0.2 (0.12)−0.22 (0.11)0.16
p-value =0.4181<0.00010.0713 0.08250.0523
1 mm size class (n = 195)
Specific richness−0.03 (0.06)0.27 (0.07)−0.39 (0.08)−0.46 (0.11)0.25
p-value =0.5874<0.0001 <0.0001<0.0001
Density of individuals−0.02 (0.07)−0.17 (0.08)−0.2 (0.09)−0.31 (0.13)0.03
p-value =0.79310.0234 0.02720.0217
Shannon diversity−0.03 (0.06)0.43 (0.06)-0.12 (0.08)−0.31 (0.07)−0.32 (0.11)0.34
p-value =0.6265<0.0001 0.1292<0.00010.0029
Pielou evenness0.02 (0.07)0.31 (0.07)0.1
p-value =0.8276<0.0001
Model 2
InterceptAsCdCr/Fe/MnHgCu/Pb/ZnR2adj
0.5 mm size class (n = 142)
Specific richness−0.06 (0.08)−0.41 (0.13)−0.69 (0.15)−0.46 (0.16)1.03 (0.19)0.18
p-value =0.42760.003<0.0001 0.0051<0.0001
Density of individuals−0.11 (0.06)−0.51 (0.1)0.74 (0.13)0.27 (0.11)−0.73 (0.13)1.43 (0.16)0.49
p-value =0.0641<0.0001<0.00010.013<0.0001<0.0001
Shannon diversity0.04 (0.08)−0.28 (0.08)0.07
p-value =0.6124 0.0007
Pielou evenness0.06 (0.08)−0.17 (0.08)0.02
p-value =0.4713 0.0345
1 mm size class (n = 126)
Specific richness0.06 (0.08)−0.51 (0.15)0.31 (0.15)0.08
p-value =0.4529 0.0009 0.0375
Density of individuals0.02 (0.09)0
p-value =0.8373
Shannon diversity0.09 (0.08)−0.43 (0.15)0.29 (0.14)0.05
p-value =0.2492 0.0038 0.0437
Pielou evenness0.06 (0.08)0
p-value =0.4249
Table 3. Bray–Curtis dissimilarity of the clusters obtained for the 0.5 mm and the 1 mm size classes. The diagonal of the triangular matrix corresponds to within-cluster dissimilarity, and other cells are across-cluster dissimilarity.
0.5 mm Size Class
ABC
A37.68
B92.5384.85
C90.3791.6769.35
1 mm Size Class
DEF
D92.57
E92.1669.15
F94.8297.8775.43
Table 4. Mean values (and standard error) of habitat parameters calculated with stations belonging in the groups defined by the hierarchical agglomerative clustering for the 0.5 mm and the 1 mm size classes. Only Baie des Sept Îles stations (when available in the cluster) were considered for the calculation of heavy metal concentration averages. n = number of stations considered for the calculation.
0.5 mm Size Class1 mm Size Class
VariableUnitCluster ACluster BCluster CCluster DCluster ECluster F
All four sectors (n = 16)(n = 61)(n = 89)(n = 83)(n = 27)(n = 89)
Depthm6.99 (0.35)13.72 (1.64)32.76 (2.02)21.5 (1.88)16.1 (2.53)32.52 (2.04)
Organic matter%2.58 (0.42)0.52 (0.04)1.76 (0.1)0.72 (0.08)0.35 (0.03)1.77 (0.1)
Gravel%0 (0)5.9 (1.8)1.7 (1)6.8 (1.6)2.2 (0.1)1.7 (1)
Sand%0 (0)53.3 (5.3)46.3 (2.3)63.8 (3.7)92.4 (1.8)47 (2.5)
Silt%0.1 (0)11.3 (2.4)49.1 (2.2)25 (3)4.7 (1.2)48.4 (2.5)
Clay%99.9 (0)29.5 (5.6)3 (1.6)4.4 (1.2)0.6 (0.01)2.9 (1.5)
Baie des Sept Îles only (n = 16)(n = 47)(n = 88)(n = 42)(n = 3)(n = 89)
Arsenicmg·kg−13.74 (0.32)2.51 (0.19)3.89 (0.24)3.56 (0.55)1.83 (0.52)3.96 (0.25)
Cadmiummg·kg-10.15 (0.01)0.11 (0.01)0.14 (0.01)0.13 (0.01)0.1 (0.01)0.14 (0.01)
Chromiummg·kg−180.29 (5.34)54.5 (3.68)58.07 (1.71)51.77 (3.5)32.73 (5.27)58.19 (1.66)
Coppermg·kg−119.89 (1.33)6.86 (0.73)12.33 (0.51)9.3 (1.05)6.37 (1.39)12.26 (0.5)
Irong·kg−164.73 (3.73)57.56 (4.42)55.27 (1.68)49.2 (2.47)33.56 (4.57)54.96 (1.69)
Manganeseg·kg−12.17 (0.32)0.93 (0.06)1.18 (0.06)0.86 (0.06)0.57 (0.09)1.17 (62.25)
Mercurymg·kg−10.04 (0.02)0.01 (0.01)0.02 (0.01)0.02 (0.01)0.01 (0.01)0.03 (0.01)
Leadmg·kg−17.32 (0.58)3.26 (0.27)5.46 (0.2)4.65 (0.4)2.63 (0.37)5.59 (0.2)
Zincmg·kg−177.21 (4.22)43.54 (2.25)61.09 (1.77)54.28 (4.09)39.77 (3.11)61.61 (1.68)

