Article

Numerical Modeling of Beach Well Intake as Pre-Treatment for a Desalination Plant

1
Environmental Engineering Department, College of Engineering, Imam Abdulrahman Bin Faisal University, 1982 Dammam, Saudi Arabia
2
Civil and Construction Engineering Department, College of Engineering, Imam Abdulrahman Bin Faisal University, 1982 Dammam, Saudi Arabia
*
Author to whom correspondence should be addressed.
Water 2020, 12(9), 2420; https://doi.org/10.3390/w12092420
Submission received: 31 July 2020 / Revised: 22 August 2020 / Accepted: 25 August 2020 / Published: 28 August 2020
(This article belongs to the Section Wastewater Treatment and Reuse)

Abstract

:
Pre-treatment of seawater plays a critical role in removing colloidal particles, algae, sediment, and microbes, which could adversely affect the desalination process. This study focused on the utilization of the natural process of infiltration by beach wells to pre-treat the intake water for the desalination process. The scope of the study was achieved by drilling two beach wells at Al-Khobar and Jubail sites at the Arabian Gulf of Saudi Arabia at 50 m depth each. In addition to that, a total of eight monitoring wells were drilled for pump testing. Numerical modeling was conducted using SEEP/W to investigate the properties of well water flux at the beach wells. The comprehensive physio-chemical parameters such as cation, silt density index (SDI), total dissolved solids (TDS), total suspended solids (TSS), chemical oxygen demand (COD), total organic carbon (TOC), salinity, and alkalinity were analyzed for a quality assessment concerning the actual seawater. Preliminary experimental results show a reduction of the targeted parameters and indicate that beach well sand filtration in the Eastern Province would be a valuable pre-filtration step in reverse osmosis (RO)-based drinking water production systems. The water flux values for both sites were 0.0197 and 0.0208 m3/s/m2, respectively, which corresponds to 72 m3/h/m2 and 1356.48 m3/h/m2. In terms of the rate of pumping flow, the model suggests production can be increased by 20 and 53 times the measured production of the Jubail and Al-Khobar sites, respectively. The experimental results of water parameters, such as cation, SDI, TDS, TSS, etc., indicate that beach well sand filtration in the Eastern Province would be a valuable pre-filtration step in reverse osmosis drinking water production systems.

Graphical Abstract

1. Introduction

Desalination has contributed to solving the water scarcity problem in semi-arid regions and raised the quality of life during the past five decades. The gulf countries in general and the Kingdom of Saudi Arabia (KSA), in particular, primarily depend on seawater desalination plants built on the coast of the Arabian Gulf to produce potable water. Therefore, desalination will receive significant future investments by the Kingdom for generations to come. However, the technologies used in water desalination are associated with various environmental impacts pertinent to the fragile arid environment, especially groundwater, marine life, air quality problems, and global warming carbon footprints [1,2,3,4,5].
At present, KSA is considered the largest user of seawater desalination (mostly reverse osmosis (RO) technology) in the world, with a share of 20% of the total desalinated water production worldwide. Saline Water Conversion Corporation (SWCC) has more than 27 plants that produce 4.6 MCM of desalinated water and 1812 MW of electricity [6,7].
A significant concern, however, in the cost-effective application of the reverse osmosis seawater desalination process is the effective control of membrane fouling [8,9,10,11]. Different types of fouling mechanisms could hinder the production of pure water by RO, including biofouling, organic fouling, scaling, and colloidal fouling [10,11,12,13]. Biofouling, as one of the types of fouling mechanisms of the RO membrane, is mainly caused by the presence of dissolved or dispersed organic and inorganic matter in the intake water [7,9]. The microorganisms’ in the feed stream use organic matter as a food source to grow and multiply on the surface of the membrane and result in a rapid buildup of differential pressure and flux reduction [1,7,11]. Ultimately, this may lead to increased energy consumption and costly maintenance operations that may require the shutdown of the desalination facility [7,9,11].
As a result, many researchers and operators have emphasized the fact that pre-treatment of seawater is necessary to minimize biofouling of seawater reverse osmosis (SWRO) membranes. Despite the crucial efforts to solve the problems of biofouling facing desalination, the main hindrance of the SWRO process is, to date, associated with membrane biofouling. In gulf countries, for example, in Kuwait, conventional coagulation treatment to reduce suspended solids is mainly used to improve feed seawater quality [7,12].
A study by Edzwald and Haarhoff on the causes of reduction in the permeate flux during operation found that the phenomenon of biofouling is mainly responsible for limiting the pure water flux during RO seawater desalination to produce purified water followed by cleaning. It was concluded that, during the initial period of cyclic (production and cleaning) RO process operation, the concentration of polarization is one of the main reasons for flux deterioration [10].
A detailed study by Dehwah and Missimer explained that serious biofouling mostly happens in areas with high nutrient load inputs, such as the Arabian Gulf region. They used a pilot to reduce biofouling at the Jubail SWCC plant in Saudi Arabia and the Ad Dur desalination plant in Bahrain using the same real-feed seawater that is used in the existing polyamide membranes. The best technique to prevent the membrane fouling for water desalination plants was found to be related to the removal of any materials that could be responsible for the formation of fouling agents before they are deposited onto the surface of the RO membrane. Hence, this requires suitable pre-treatment of the feed water before the RO treatment to avoid the occurrence of biofouling [7,9].
The existing conventional pre-treatment systems used to reduce biofouling depend mainly on disinfection and chemical cleaning to inactivate microorganisms that cause biofouling. However, the use of these methods leads to extra operation costs, an increased environmental burden, and a shorter RO membrane lifetime. Moreover, most of the processes can be inefficient in extreme cases such as during red tides and algae blooms and cannot meet the requirements of the intake water silt density index (SDI) for reverse osmosis (RO). Recent studies suggest that the disinfection may also have the potential to increase fouling potential [8,11,13].
The biological treatment process has the potential to remove biodegradable organic matter as well as the microorganisms responsible for biofouling. The additional benefit of the biological treatment incorporated with filtering media is the removal of particulate and colloidal matter, which require further treatment schemes in conventional processes [11,13,14].
The use of natural infiltration by drilling beach wells has been explored in the past decades to reduce the SDI and turbidity of feed seawater. Horizontal drilling below the seabed has been tested to enhance the intake seawater quality [7,9,15,16,17,18,19]. The success of this process is attributed to the natural sand of the seabed pre-filtering the suspended solids from the feed seawater. This system can be operated in a sandy seabed (as in the KSA Gulf areas) and could be an alternative for conventional seawater intake systems. This technology could have economic and environmental benefits over media filtration for seawater intake and pre-treatment [6,12,14,15].
With the advancement of experimental measuring devices used in aquifer and seawater intrusion assessment and advances in computer performance, hydraulic model experiments and numerical analyses have been extensively conducted [4,16,17].
Several case studies and research studies have been conducted and include numerical analyses of the effects of the seawater–freshwater interface of coastal aquifers and beach wells using different models and experimental setups [4,17,18].
Researchers have investigated the aquifer system and seawater intrusion with various methodologies. Shin, J. and Hwang, S. studied geophysical seawater intrusion through the monitoring of boreholes. Their method included measuring the spatial and temporal variability of groundwater flow through temperature and electrical conductivity monitoring by a thermal in situ sensor. Their study found a rapid reduction in electrical conductivity inside the saltwater zone [20].
Mohammad M. et al. studied the problem of siltation using a three-dimensional computational fluid dynamics (CFD) model. They studied the sedimentation and the flow in a versatile reservoir. They found that the sediment load levels at numerous points near the intake water were associated with a 3.6% percent bias value, whereas the t-test value was 0.430, which was less than the presented value, demonstrating acceptable model performance [21].
Vann S. et al. performed a study to outline the problematic intrusion of seawater in a coastal aquifer in Kamala city using geo-electrical examinations. The applied two-dimensional models using the collected resistivity data showed high tenacity subsurface resistivity irregularities of seawater intrusion. The study showed that the concentration of the seawater declines in an eastward direction toward the inland zones [22].
Sowe M. et al. developed a finite element solute flow and transport model aimed at simulating three different scenarios to evaluate the best suitable water pumping rates, wells number, and optimal well sites from the seashore. The study investigated three different simulation scenarios. The pumping of seawater 1500 m away from the seashore using 16 pumping wells that give a total rate of 8000 m3 per day was the best operative solution to prevent seawater intrusion in the studied coastal aquifer [23].
Lee W. et al. studied the equilibrium at the seawater and freshwater interface in a coastal area aquifer using impermeable seawall obstructions. They analyzed the hydraulic features of the coastal aquifer using a numerical analysis model including a Navier Stokes solver that depended on the direct analysis of groundwater flow using the porous body model (PBM). The findings confirmed that the increase of groundwater level in the coastal aquifer due to obstacles leads to an enlarged pressure gradient and eventually to seawater intrusion [24].
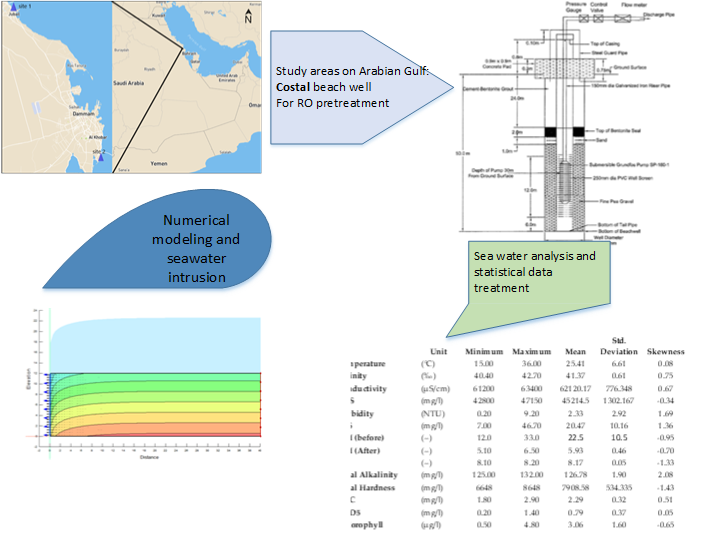
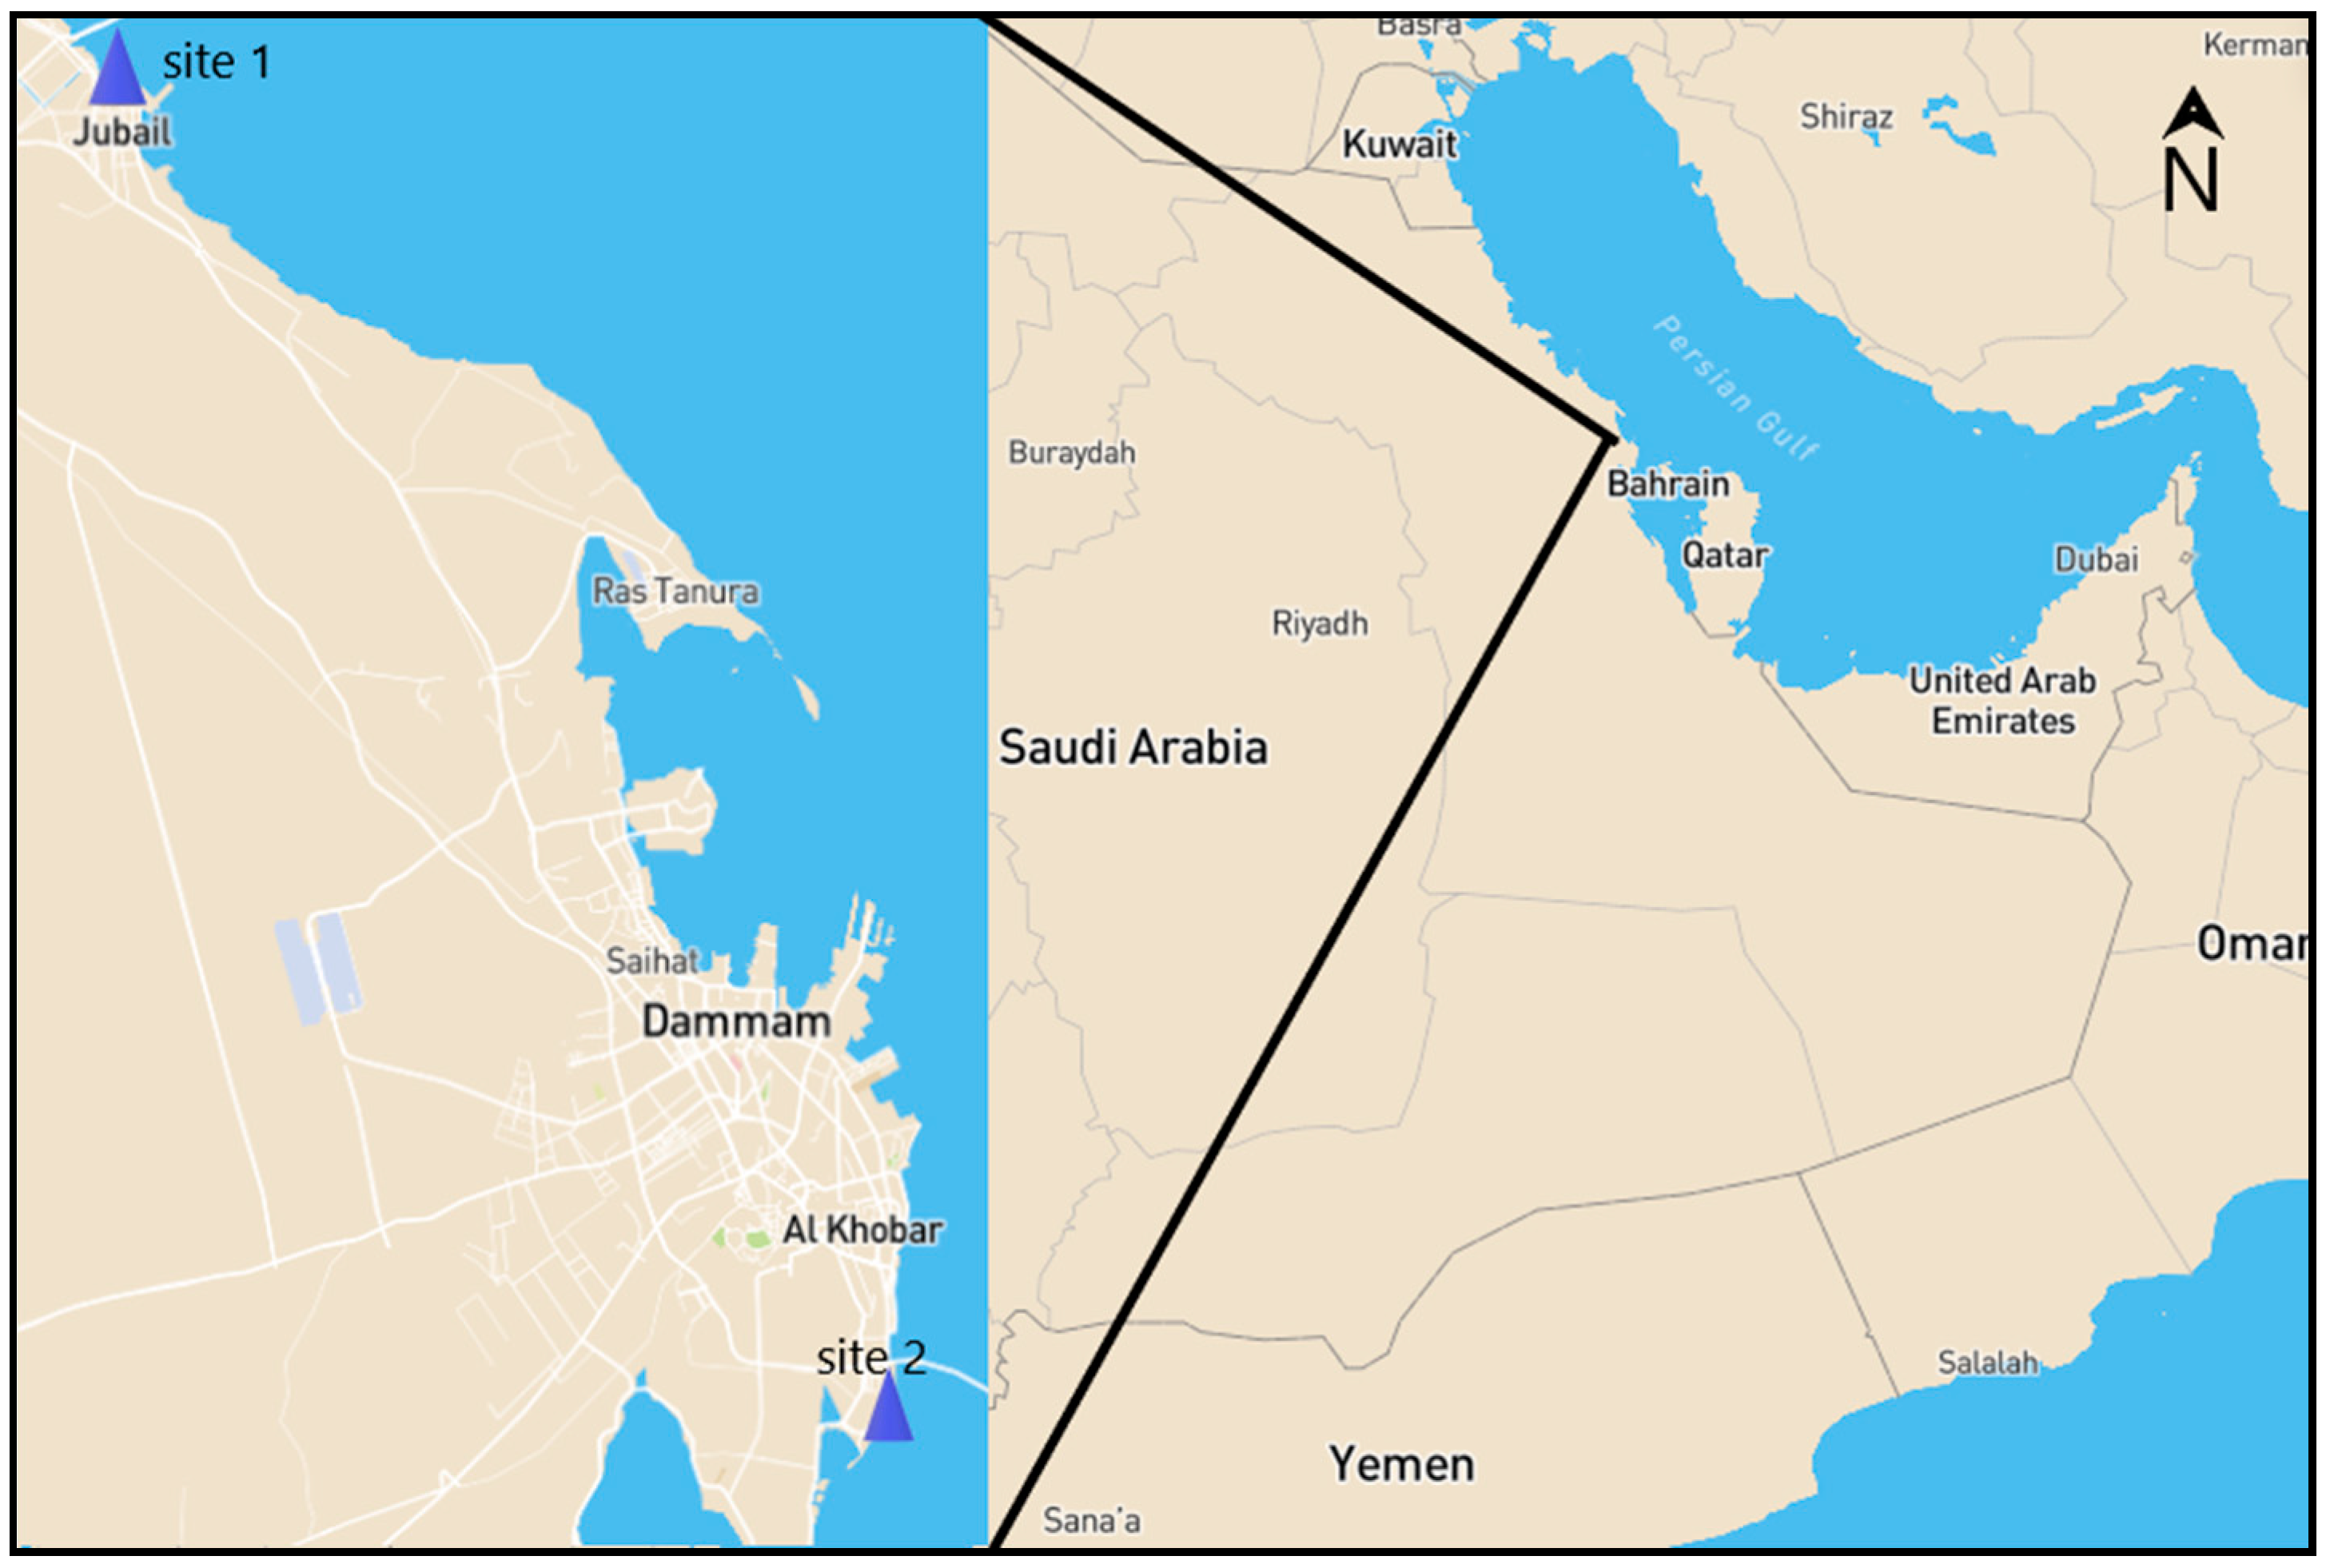
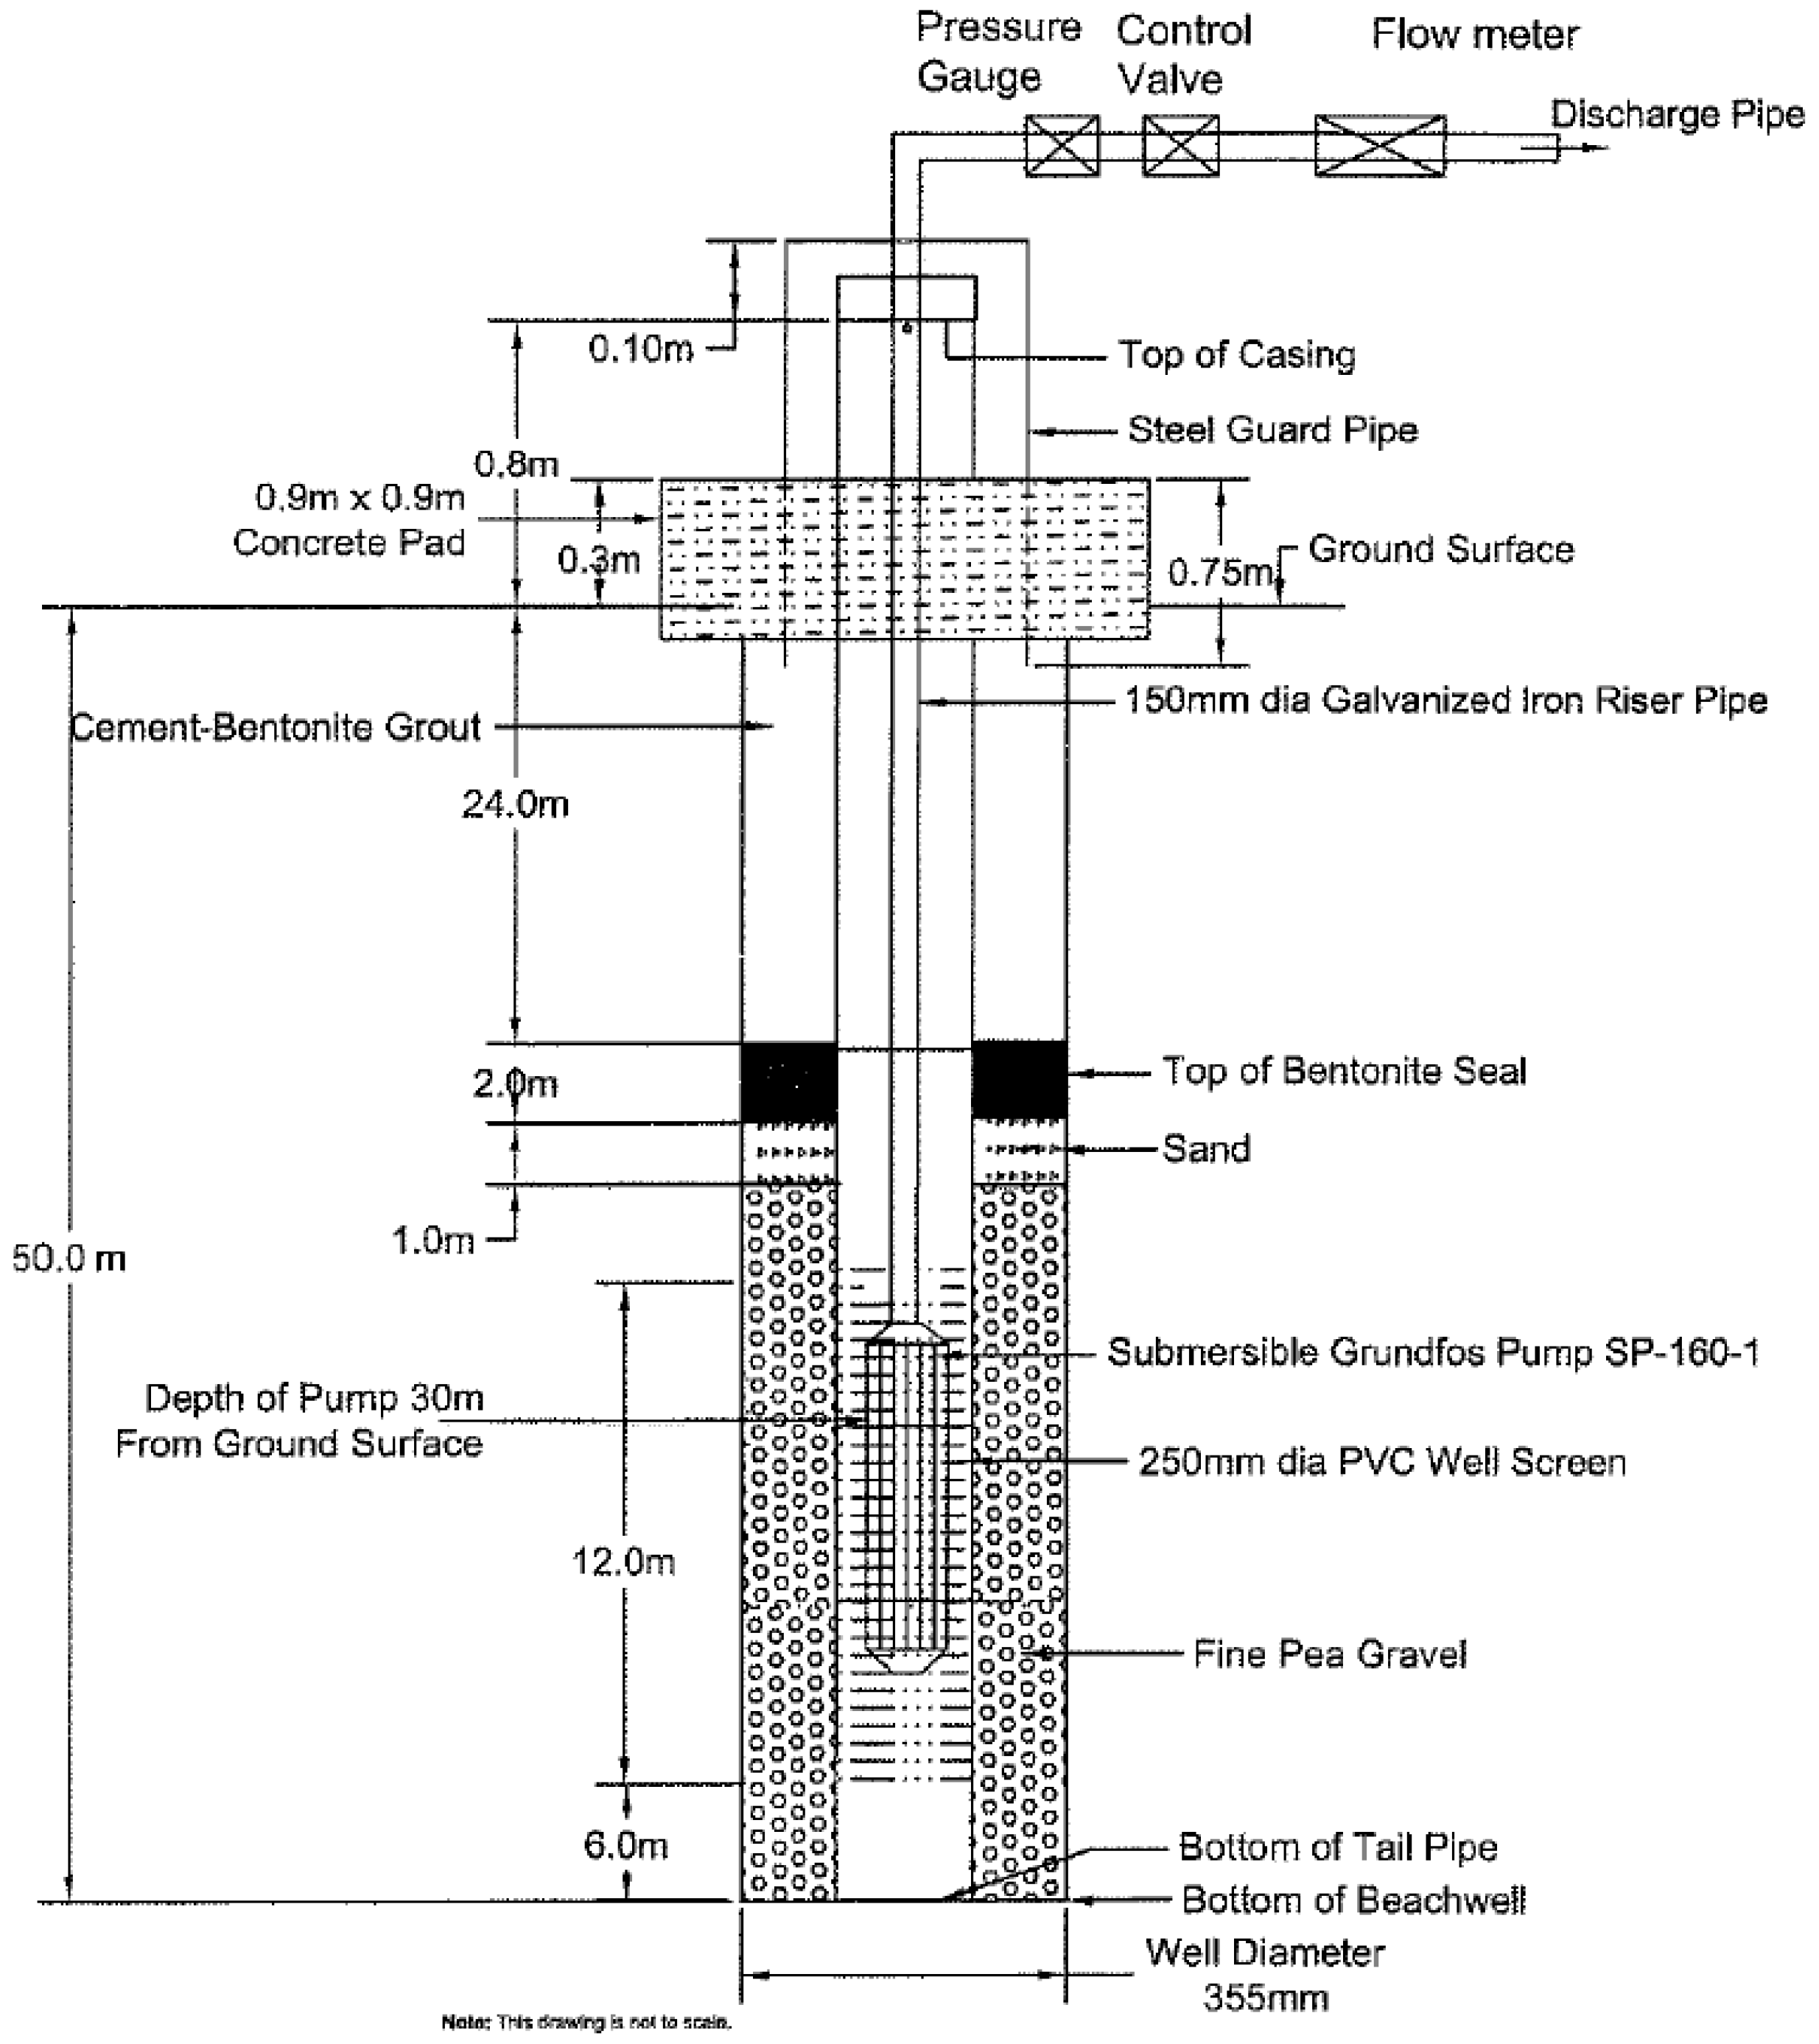
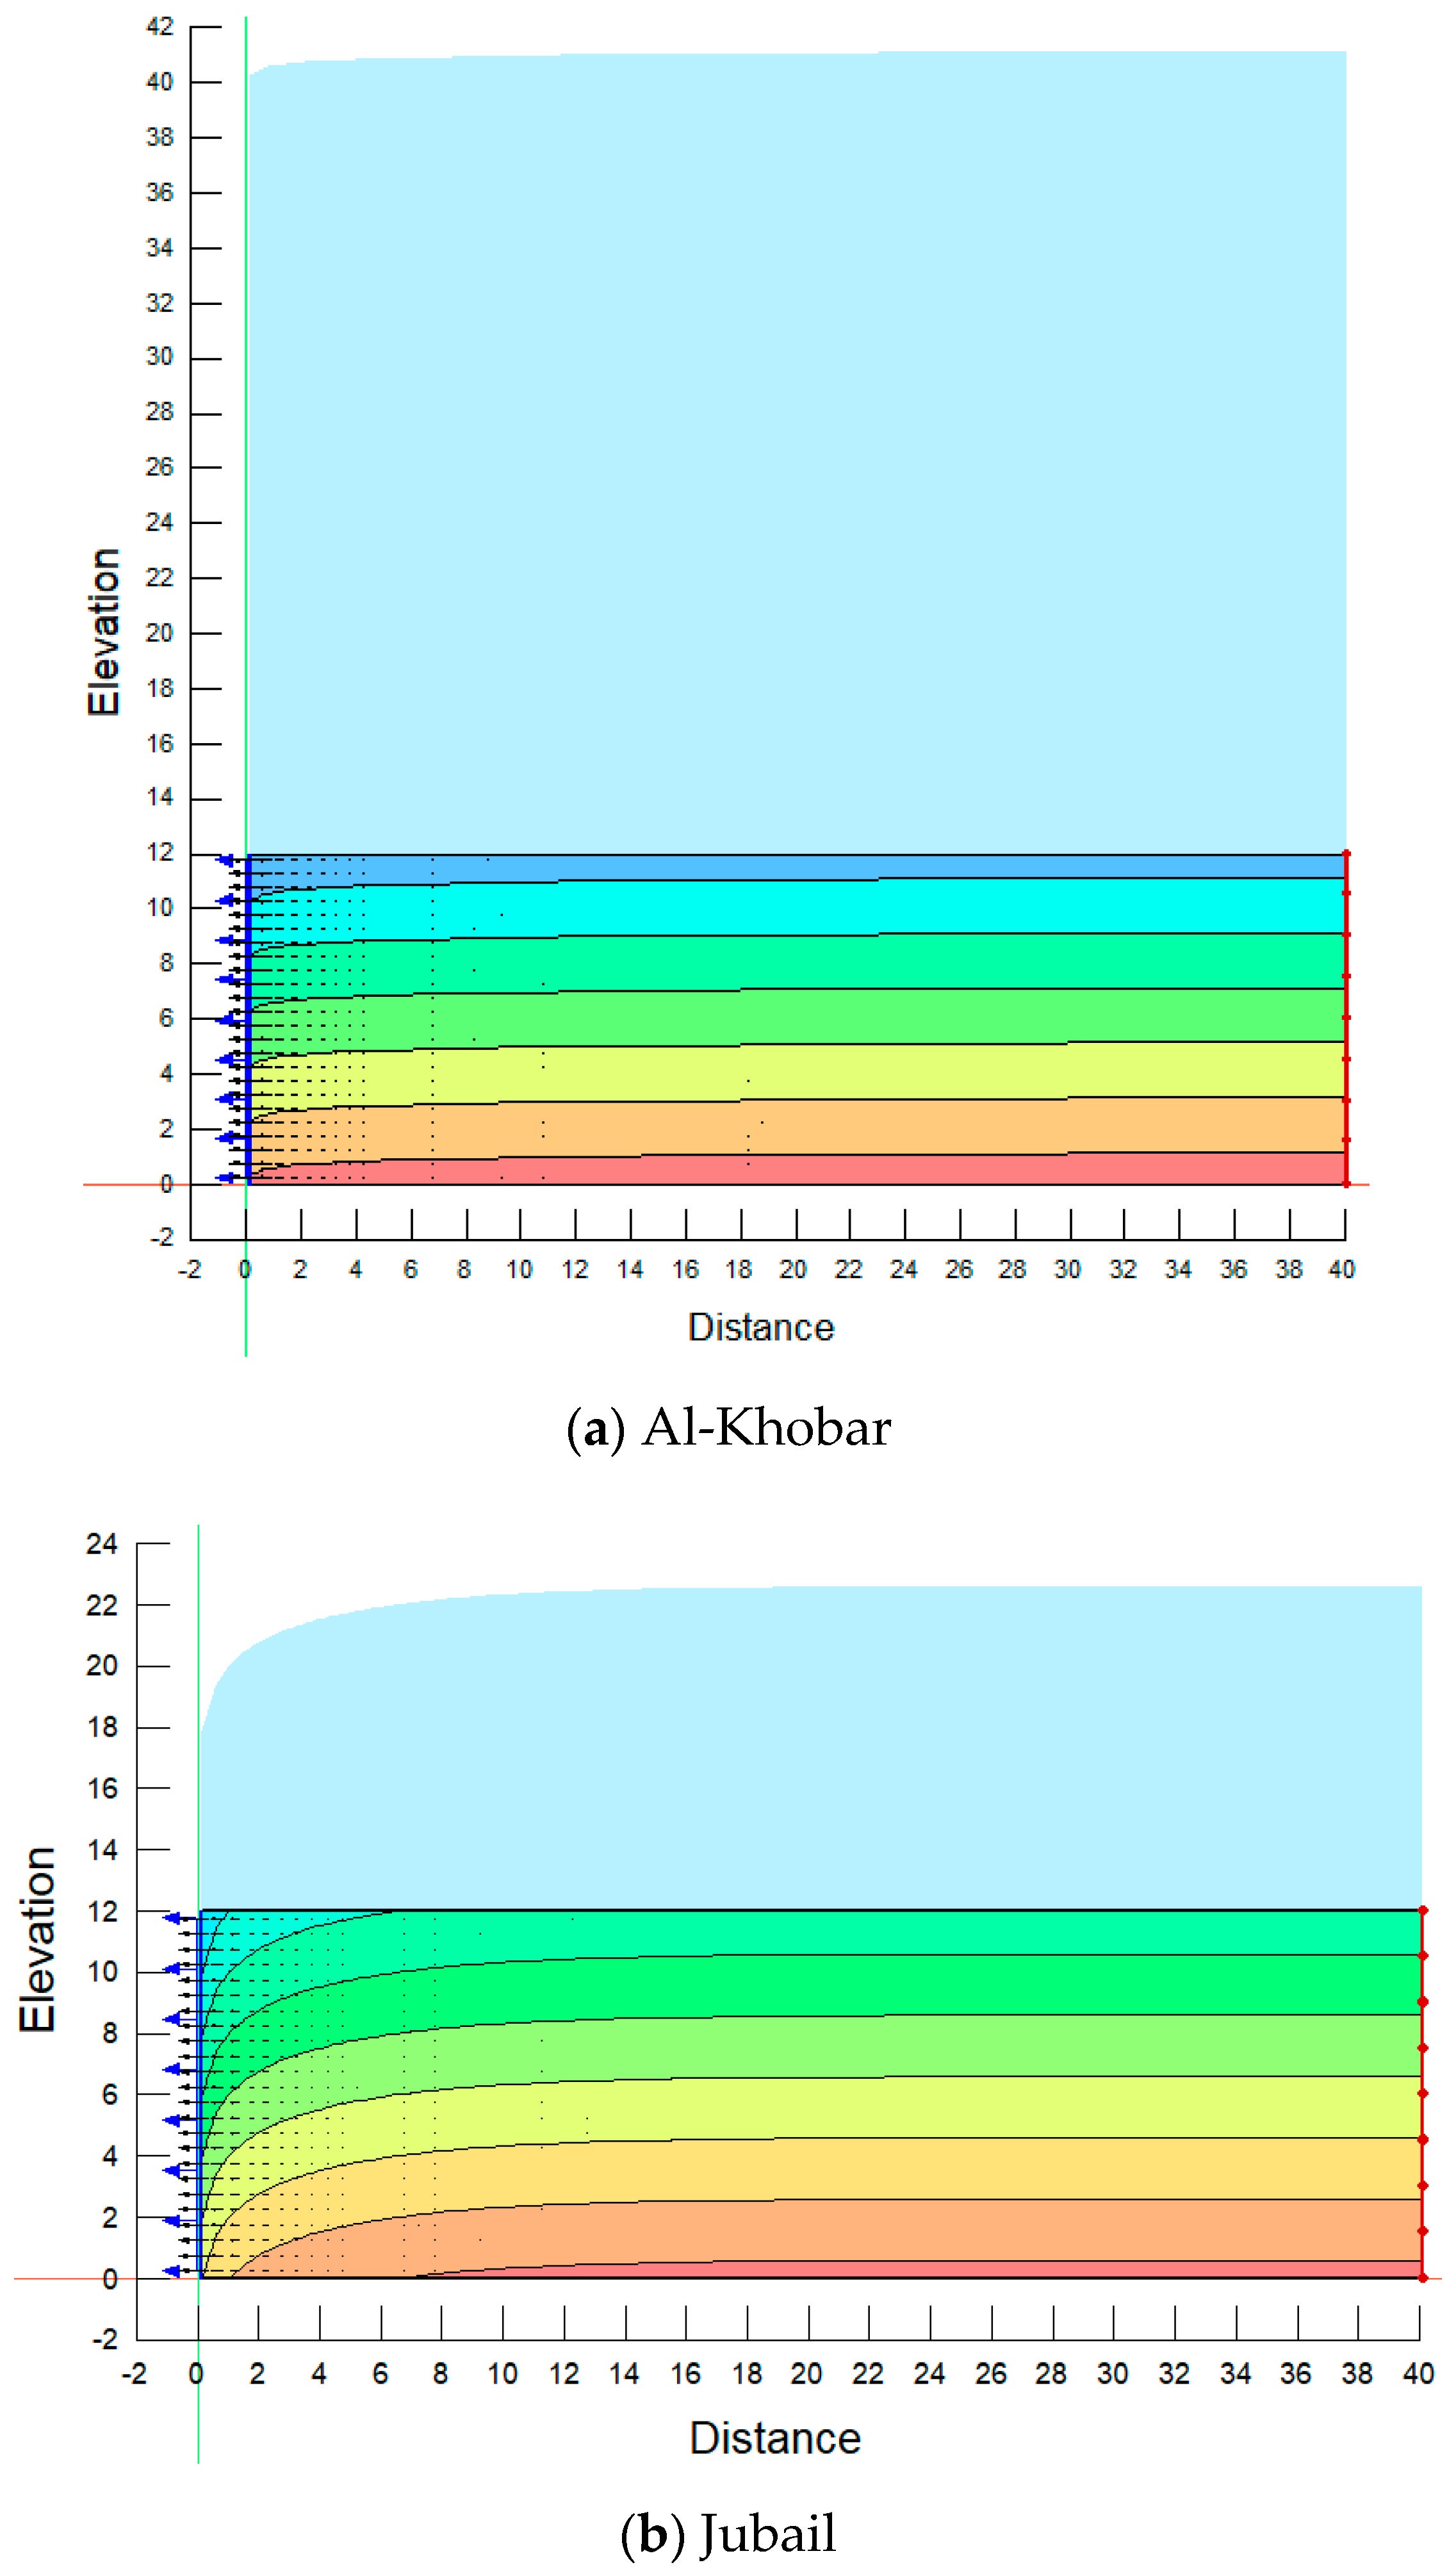
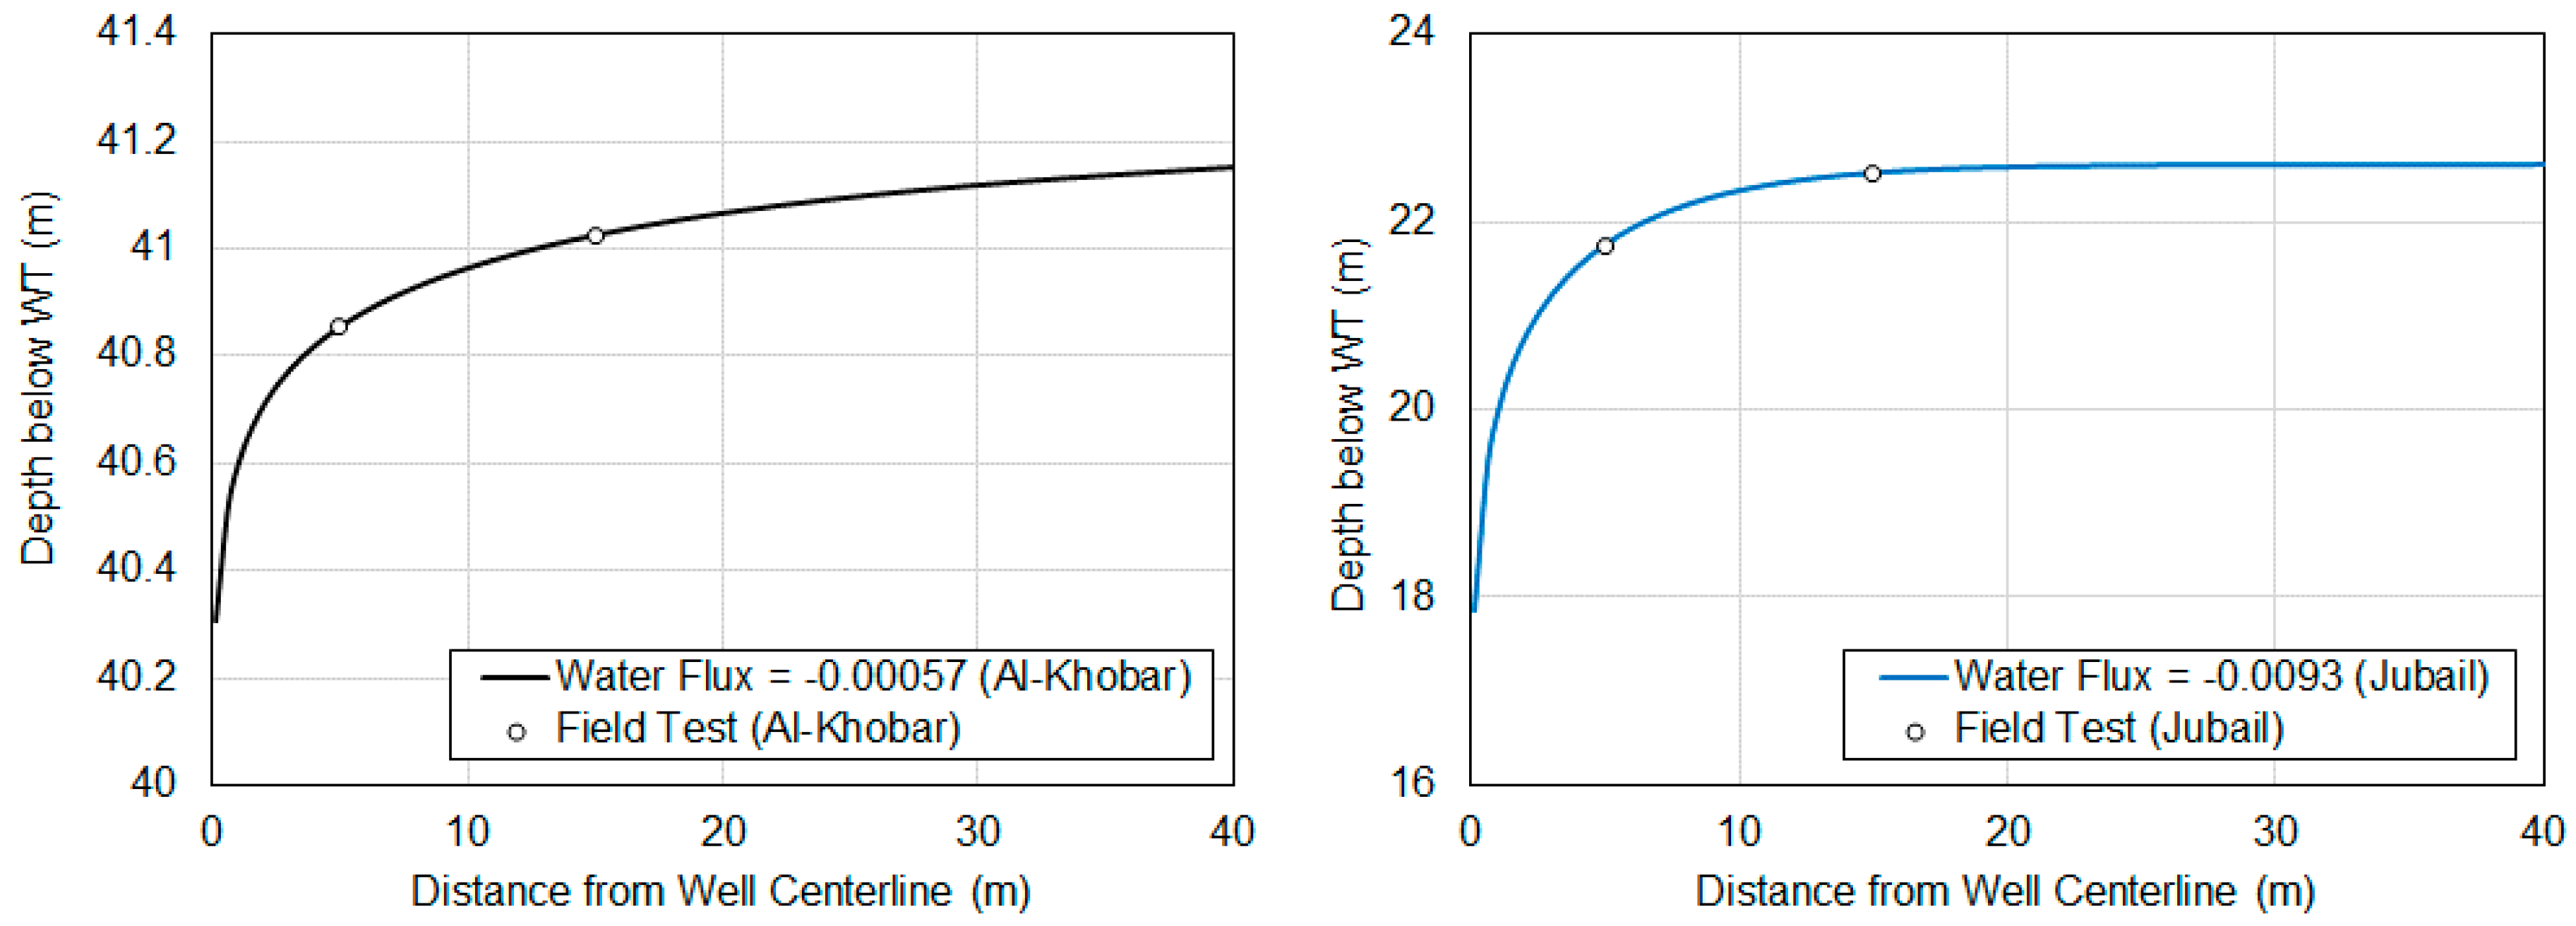
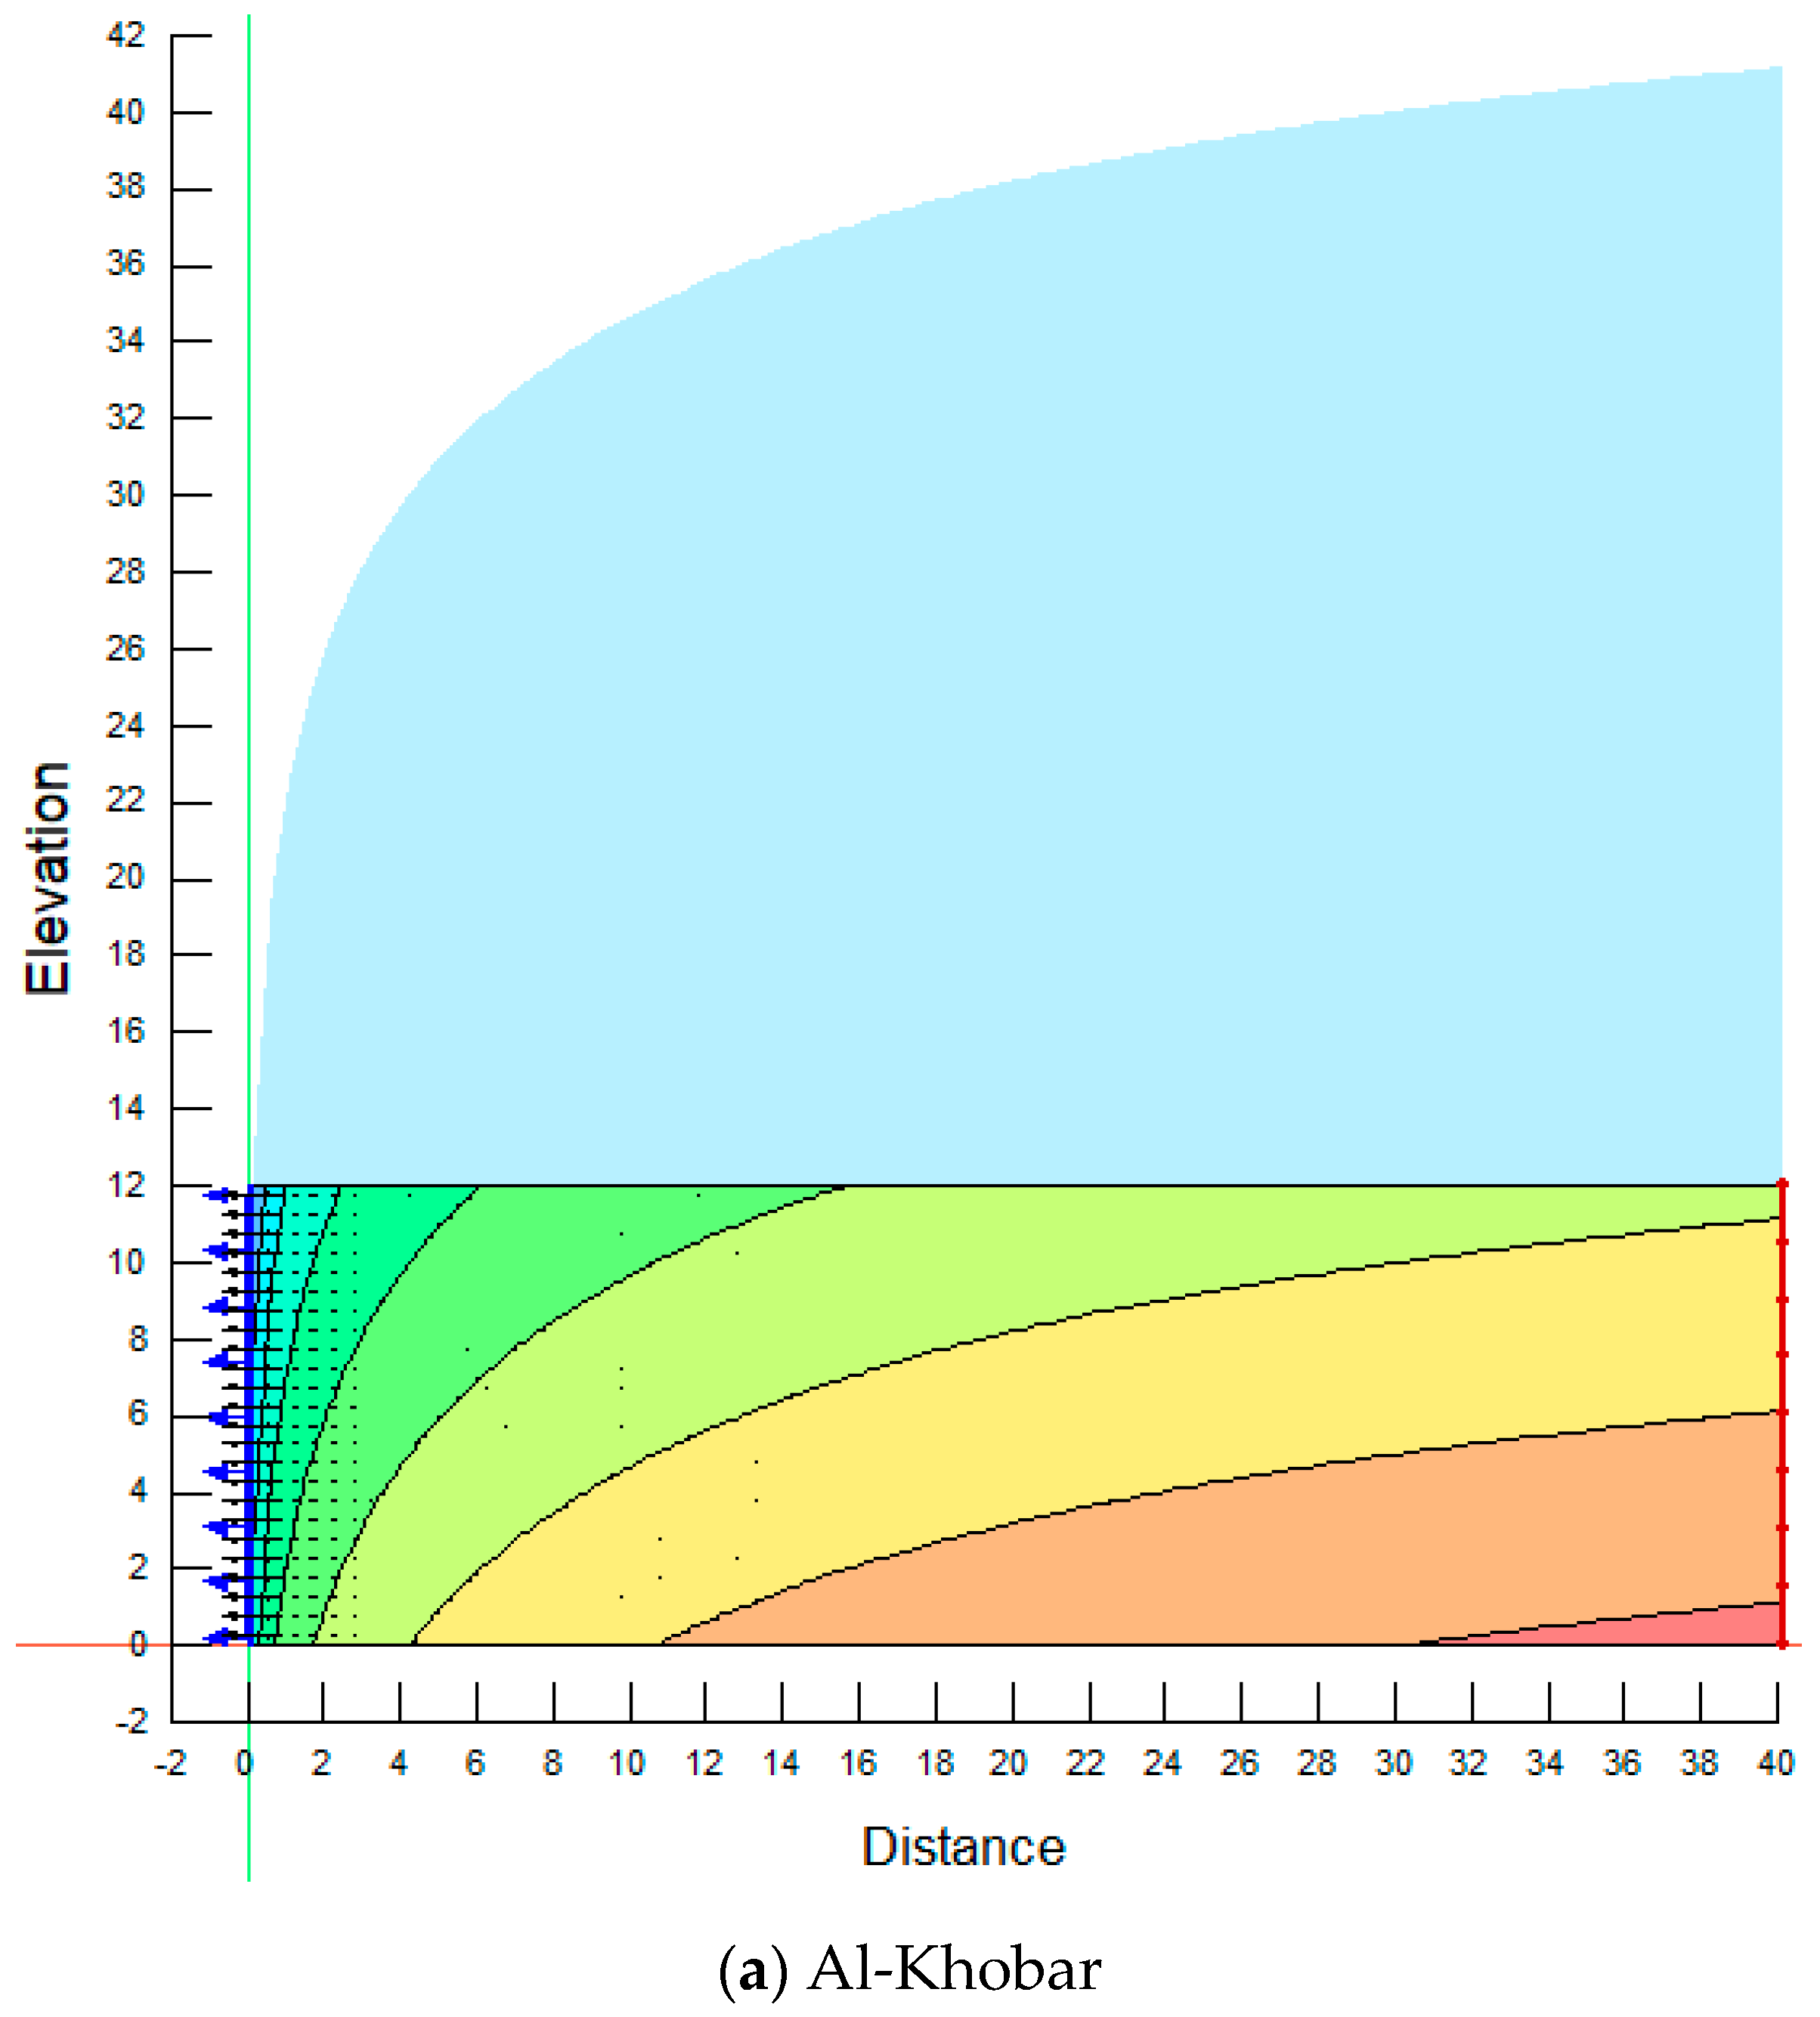
The main aim of this work was to experimentally test the suitability of beach well techniques as a pre-treatment tool for the RO desalination process. Additionally, numerical modeling (SEEP/W) was used to investigate the effects of water flux out of the well at the slotted screen section of the beach well.

2. Materials and Methods

2.1. Site Selection

This study was conducted in two different sites in the eastern province of KSA, namely Jubal (location 26°53′30″ N and 49°48′15″ E) and Al-Khobar (location 26°10′52″ N and 50°12′52″ E), as shown in Figure 1. The locations of the sites were selected after several site visits based on future utilization and ease of access. The goal was to better understand the advantages of the chosen sites and to assess the suitability of beach wells as a natural pre-treatment method for desalination intake.
The selected beach wells, site #1 and site #2, are located within 10 and 50 m of the Saudi Arabian Gulf shore, respectively. Site#1 is located close to the premises of the SWCC plant in the Jubail industrial area, and site #2 is near the SWCC plant in the neighboring town of Al-Khobar. These SWCC plants produce about 1.1 million m3/day and 500,000 m3/day of drinking water by RO and thermal processes with the concurrent generation of 3 MW and 3.8 MW of electricity, respectively.

2.2. Wells Drilling and Sample Analysis

2.2.1. Drilling of Beach Wells

A beach well, with a screen and a casing, 50 m deep and 355 mm (10 inch) in diameter was drilled at each of the selected sites. For each of the wells, soil samples were collected at 1 m intervals. Upon completion of the drilling of the two beach wells, the casings and screens were then inserted into the wells. The housing consisted of a 250 mm (10 inch) diameter schedule 40 PVC pipe and screen. The screen was factory slotted to give approximately 0.5 mm horizontal side slots. The length of the slotted screen was about 12 m. Filter gravel was placed along the sides of the well screen, followed by a bentonite cement seal. The filter gravel consisted of locally available siliceous pea gravel sized 2–3.35 mm. A steel guard pipe was placed over the casing riser pipe. A concrete pad of 90 × 90 × 10 cm dimensions was constructed around the groundwater monitoring well, as shown in Figure 2. After the wells were developed, a submersible pump (Grundfos SP-160) was installed at each beach well. The pump rate was set at about 160 m3/h at a pump setting depth of about 24 m.

2.2.2. Drilling of Observation Wells

After drilling and installation of the beach wells, four observation wells were drilled for each beach well. The purpose of these observation wells was to monitor the drop in the water level during the pump test. The observation wells were drilled to about a 25 m depth below the existing grade. The observation wells were about 100 mm in diameter and were drilled using clean water. After the completion of drilling, the observation wells were slotted with schedule 40 PVC pipe of about 50 mm diameter, as shown in Figure 3. Using the observation wells, a pumping test was carried out at each of the sites, and pumping data were recorded.

2.2.3. Sample Analysis

The raw seawater and water samples from the pre-treated beach wells were collected from the two sites (Jubail SWCC and Al-Khobar SWCC) for testing of physical, chemical, and biological parameters. Using different analytical techniques, several quality parameters such as metal content, anions, TDS, TSS, COD, TOC salinity, and alkalinity were measured according to standard methods of water analysis [25]. Furthermore, water samples were collected on a regular basis and analyzed in the laboratory experiments.

2.3. Borehole Analysis

A full-depth borehole analysis was performed at each of the two beach wells sites to investigate the different soil layers in each site. Soil samples from boreholes at different depth intervals were collected and analyzed for particle size distribution (sieve analysis) and major cation and anion contents. Beach soil cores from the Arabian Gulf were profiled, and relevant soil parameters were measured.

2.4. Numerical Modeling

Numerical modeling was conducted using SEEP/W [26] to investigate the effects of water flux, which represents the amount of water that can be drawn out of the well at the slotted screen section of the beach well (12 m).

3. Results and Discussions

3.1. Water Level Measurements

Observations were made in the beach wells and the observation wells, upon their completion of installation, from which the depth of the groundwater was investigated at both sites. Thus, the static groundwater levels were recorded in the beach wells and the four observation wells. The water levels were recorded using electronic dip meters. The observations indicated that the water levels were about 3.60 m and 2.85 m below the existing site grade at the Jubail and Al-Khobar sites, respectively.

3.2. Beach Well Pump Tests

The pump tests were performed in each beach well, constructed at the two sites, and followed the guidelines presented in BS 5930 [27], Section 2.5 standard. Each experiment comprised a 72 h pumping period and 12 h recovery period. Immediately after recording the static groundwater levels, the pump was turned on at capacity, and the drawdown in the groundwater level was recorded. During the test period, the average flow rate, the withdrawal in the beach wells and the observation wells, and the volume of water discharged from the wells were recorded. After pumping the water from the beach wells for 72 h, the pump was turned off, and the recovery readings were noted for 12 h. The drawdown and recovery readings obtained during the tests were plotted graphically and are given in Table 1 and Figure 4, Figure 5 and Figure 6. The drawdown results presented in Table 1 are in accordance with the drawdown curves shown in Figure 4. Figure 5 shows a comparison between the drawdowns below the existing grades for both sites. It is clear from the pumping stage that the withdrawal from the Al-Khobar site was higher than that of the Jubail site by a difference of 15 m. At the recovery stage, both sites were heading towards the starting point. Figure 6 presents the difference in the average discharge rate with time for both locations. Both sites show a fast increase in the average discharge rate in the first 10 min, and after that, the rate becomes more stable for the Al-Khobar site and with some fluctuations for the Jubail site. The average discharge rate for the Al-Khobar site is in the range of 25 m3/h, while for Jubail site it is 67 m3/h Figure 6 shows a linear increase in the discharge from both sites with a slight difference in the slope. Table 1 presents the data obtained from the observation wells to monitor the drawdown curves at both sites, as shown in Figure 3. It also includes the rate of pumping flow, permeability, and transmissivity of each site [28,29]. The rate of pumping flow from the Jubail site is higher than that of the Al-Khobar site, and these results are consistent with the higher permeability and transmissivity values as well. These results are used in numerical modeling later in the paper.

3.3. Geotechnical Characterization of Soil Profiles at Beach Wells

Boreholes using a mud rotary drilling method were performed at the site locations in Al-Khobar and Jubail to investigate the soil layers, types, and properties. Figure 7 summaries the different soil layers at each site. In the Al-Khobar site, the soil profile consists mainly of light gray, poorly graded sand with silt (SP-SM) interbedded with a 2 m thick layer of light gray silty sand (SM). As for the Jubail site, the soil profile consists of multiple soil layers, with the sand being the main component. The upper 20 m of the soil profile consists of light brown, poorly graded sand with silt (SP-SM) interbedded with a 2 m layer of light brown well-graded sand with silt (SW-SM, which is underlain by 11 m of light gray silty sand (SM) followed by 10 m of light gray poorly graded sand with silt (SP-SM). The soil layer underneath that was 4 m of light gray well-graded sand with silt (SW-SM) followed by 4 m of light gray silty sand (SM).
Laboratory soil tests were performed on selected soil samples collected during the field investigation phase of this study. The objectives of the laboratory soil testing were to verify field classifications and to determine the index and chemical properties of the soils and groundwater encountered. Classification and index tests included full sieve analysis, moisture content tests, specific gravity tests, and unit dry weight tests. The grain size distribution of the soil samples collected was performed in accordance with ASTM D6913 [30]. Figure 8 and Figure 9 present the grain size distribution obtained from different soil samples at different depths in both the Al-Khobar and Jubail sites. Table 2 and Table 3 illustrate the details of the grain size distributions and the main data that were used to classify the soil layers according to the unified soil classification system (USCS) for Al-Khobar and Jubail, respectively. The coefficient of curvature Cc and uniformity coefficient Cu that are based on the particle soil diameters at 10%, 30%, and 60% finer passing percentage are shown in the tables. The tables also include the percentage of gravel, sand, silt, and clay included in each soil sample. It is clear from the percentages that sand is the predominant soil in the soil profiles of Al-Khobar and Jubail, ranging between 80% and over 90%. The percentage of material passing the No. 200 sieve (<0.075 mm), known as the fines content, which represents the clayey soil, was very small in comparison with that of sand. As the sand is the predominant soil in the grain size distribution and the percentage of the other soil types is very limited, this indicates that the soil does not include a wide variety of different soils, instead, it consists of mainly one type of soil and is classified as poorly graded soil. Therefore, the results presented in Table 4 show clearly the percentage of fines as well as the soil classification according to the USCS system, and most of the soils are poorly graded sand with traces of silt.
The moisture content tests were performed by the oven-drying method in general accordance with ASTM D4959 [31]. A specific gravity test was carried out in general accordance with ASTM D854 [32] using a pycnometer. Dry unit weights of the remolded soil samples were determined in accordance with ASTM D7363 [33]. The results of these tests are presented in Table 4 for both sites. The specific gravity of the soil samples was in the range of 2.68–2.70 for both sites. The moisture content of the soil samples was in the range of 18–46% for the Al-Khobar site and 18–35% for the Jubail site, depending on the depth of the soil sample. The dry unit weight of the soil samples was in the range of 14–19 kN/m3 for both sites.

3.4. Beach Well Water Quality Analysis

The chemical tests on groundwater included determinations of chloride content (ASTM D512) [34], sulfate content (ASTM D516) [35], pH (ASTM D1293) [36], and TDS (AASHTO T26) [37]. The summary of water quality parameters in Jubail seawater is given in Table 5. The parameters include temperature (°C), salinity (‰), conductivity (µS/cm), TDS (mg/L), turbidity (NTU), TSS (mg/L), SDI15, pH, total alkalinity (mg/L), total hardness (mg/L), UV254, TOC (mg/L), BOD5 (mg/L), and chlorophyll (µg/L). The parameters were investigated, and the seasonal variation was given. The statistical representations of minimum, maximum, and mean values are given. As can be seen from Table 5, the parameters show small, insignificant variation during the season. However, turbidity (NTU) shows a significant change with minimum in summer (0.53) and maximum in autumn (3.78). Furthermore, chlorophyll (µg/L) also shows minimum in summer (0.53) and maximum in winter and spring (4.3).
The water samples obtained from the sea intake point and beach well were characterized for physical, biological, and chemical parameters. The results of the seawater analysis are given in Table 6. Table 6 shows the levels of major anions and cations in the seawater. The measured parameters are chloride (Cl), mg/L, sodium (Na+), mg/L, calcium (Ca2+), mg/L, magnesium (Mg2+), mg/L, potassium (K+), mg/L, sulfate (SO42+), mg/L, nitrate (NO3), µg/L, phosphate (PO43+), µg/L, and fluoride (F), mg/L. Except for nitrate (NO3), µg/L, phosphate (PO43+), µg/L, and fluoride (F), mg/L, the concentration of other ions exceeded the concentrations in seawater of similar places. The reason is that excessive evaporation and less mixing in the Arabian Gulf water concentrate these ions in the sampling area. The SDI15 values ranged between 5.1 and 6.2, which indicate very suitable raw water characteristics for use without conventional chemical pre-treatment for the RO water purification process.

3.5. Numerical Modeling

The beach wells and soil profiles were modeled as an axisymmetric transit analysis, as shown in Figure 10 a,b for Al-Khobar and Jubail, respectively. The numerical model consists of the beach well, on the left side of the model, and the soil aquifer that includes the 12 m slotted screen where the water goes through to the beach well. Figure 10 shows the numerical model mesh and boundary conditions for both sites. As the soil is well below the water table, it is considered as saturated soil, and the soil parameters used to model the soil aquifer are the saturated horizontal conductivity, saturated volumetric water content, and the soil compressibility. The boundary conditions of the model are the total water head, which represents the location of the water table, and water flux, which represents the amount of water delivered through the slotted screens from the soil to the beach well. The water flux boundary condition was used to define the pumping rate along the line representing the well screen, where the negative sign ensures that the water is being forced to leave the domain. The total head boundary condition was set to the far-right boundary condition. Table 7 presents the soil parameters and boundary conditions used to build the model for the Al-Khobar and Jubail sites. As the saturated material model is used in this analysis, the saturated volumetric water content was set to 0.4. SEEP/W required the coefficient of volume compressibility (mv) to represent the storativity of the material and the hydraulic conductivity, which corresponds to the transmissivity of the material. The results obtained from the observation wells presented in Table 1 were used to obtain the required parameters for the numerical models.

3.5.1. Model Verification

To verify the results obtained from the numerical model, the results were compared to the observation well results. Figure 11a,b illustrates the contour lines of the drawdown curves inside the soil, which show in both sites that the amount of pumping was not substantial to show a significant drop in the drawdown curves. Even though the water table in both sites was close by a difference of about 1 m, the location of the 12 m slotted screen was at different depths from the surface. This has a clear effect on the drawdown curves in both sites. In the Al-Khobar site, the drawdown curve shows very little change when compared to the water table location with the level of water in the beach well and the observation wells, while in the Jubail site, the amount of water in the beach well shows more drawdown. Figure 12 shows an excellent agreement between the measured drawdown from the observation well in comparison to the results obtained from the numerical model.

3.5.2. Effect of Water Flux

Based on the water flux boundary condition values used for the Al-Khobar and Jubail sites, the level of the water in the beach well is still high, which indicates that there is still a possibility to increase the productivity of the beach well. For this analysis, the amount of water flux was changed many times, and the level of water in the observation well was monitored. To avoid lowering the water level below the slotted screen in each beach well, which may lead to a reduction in the water level in the beach well and cause air suction instead of water suction, the maximum allowed water level drop was up to the highest point in the slotted screens. Figure 13a,b shows a contour line for the drawdown curves that end at the top position of the slotted screens in the Al-Khobar and Jubail sites, respectively. The comparison between the drawdown curves from both sites is presented in Figure 14. The water flux values were 0.0197 and 0.0208 for Al-Khobar and Jubail, respectively. Interestingly, the amount of water flux that leads the water level to drop to the slotted screen in both sites was about 0.02 m3/s/m2, which corresponds to 72 m3/h/m2 and 1356.48 m3/h/m2, respectively. As the pump rate used in the beach well was 160 m3/h, this means that the beach well can produce up to eight times the production obtained. Comparing the rate of pumping flow presented in Table 1 for each site with the results above, theoretically, production can be increased by 20 and 53 times the measured production of the Jubail and Al-Khobar sites, respectively. It should be noted that these values are based on the analysis of a single beach well. If more than one beach well is used in each site, there will be an interaction between the wells, which may lead to reducing the expected amount of water production from each well.
This type of analysis is sensitive to the compressibility of the soil, which represents the coefficient of volume compressibility. If the aquifer is very stiff (low compressibility), the water will drain very fast, as the aquifer does not have much storage. Therefore, in the above analysis, the values of mv were kept the same as those obtained from the observation well results only.

4. Conclusions

This work investigated the utilization of the natural process of sand infiltration in beach wells to pre-treat the intake water for the desalination process.
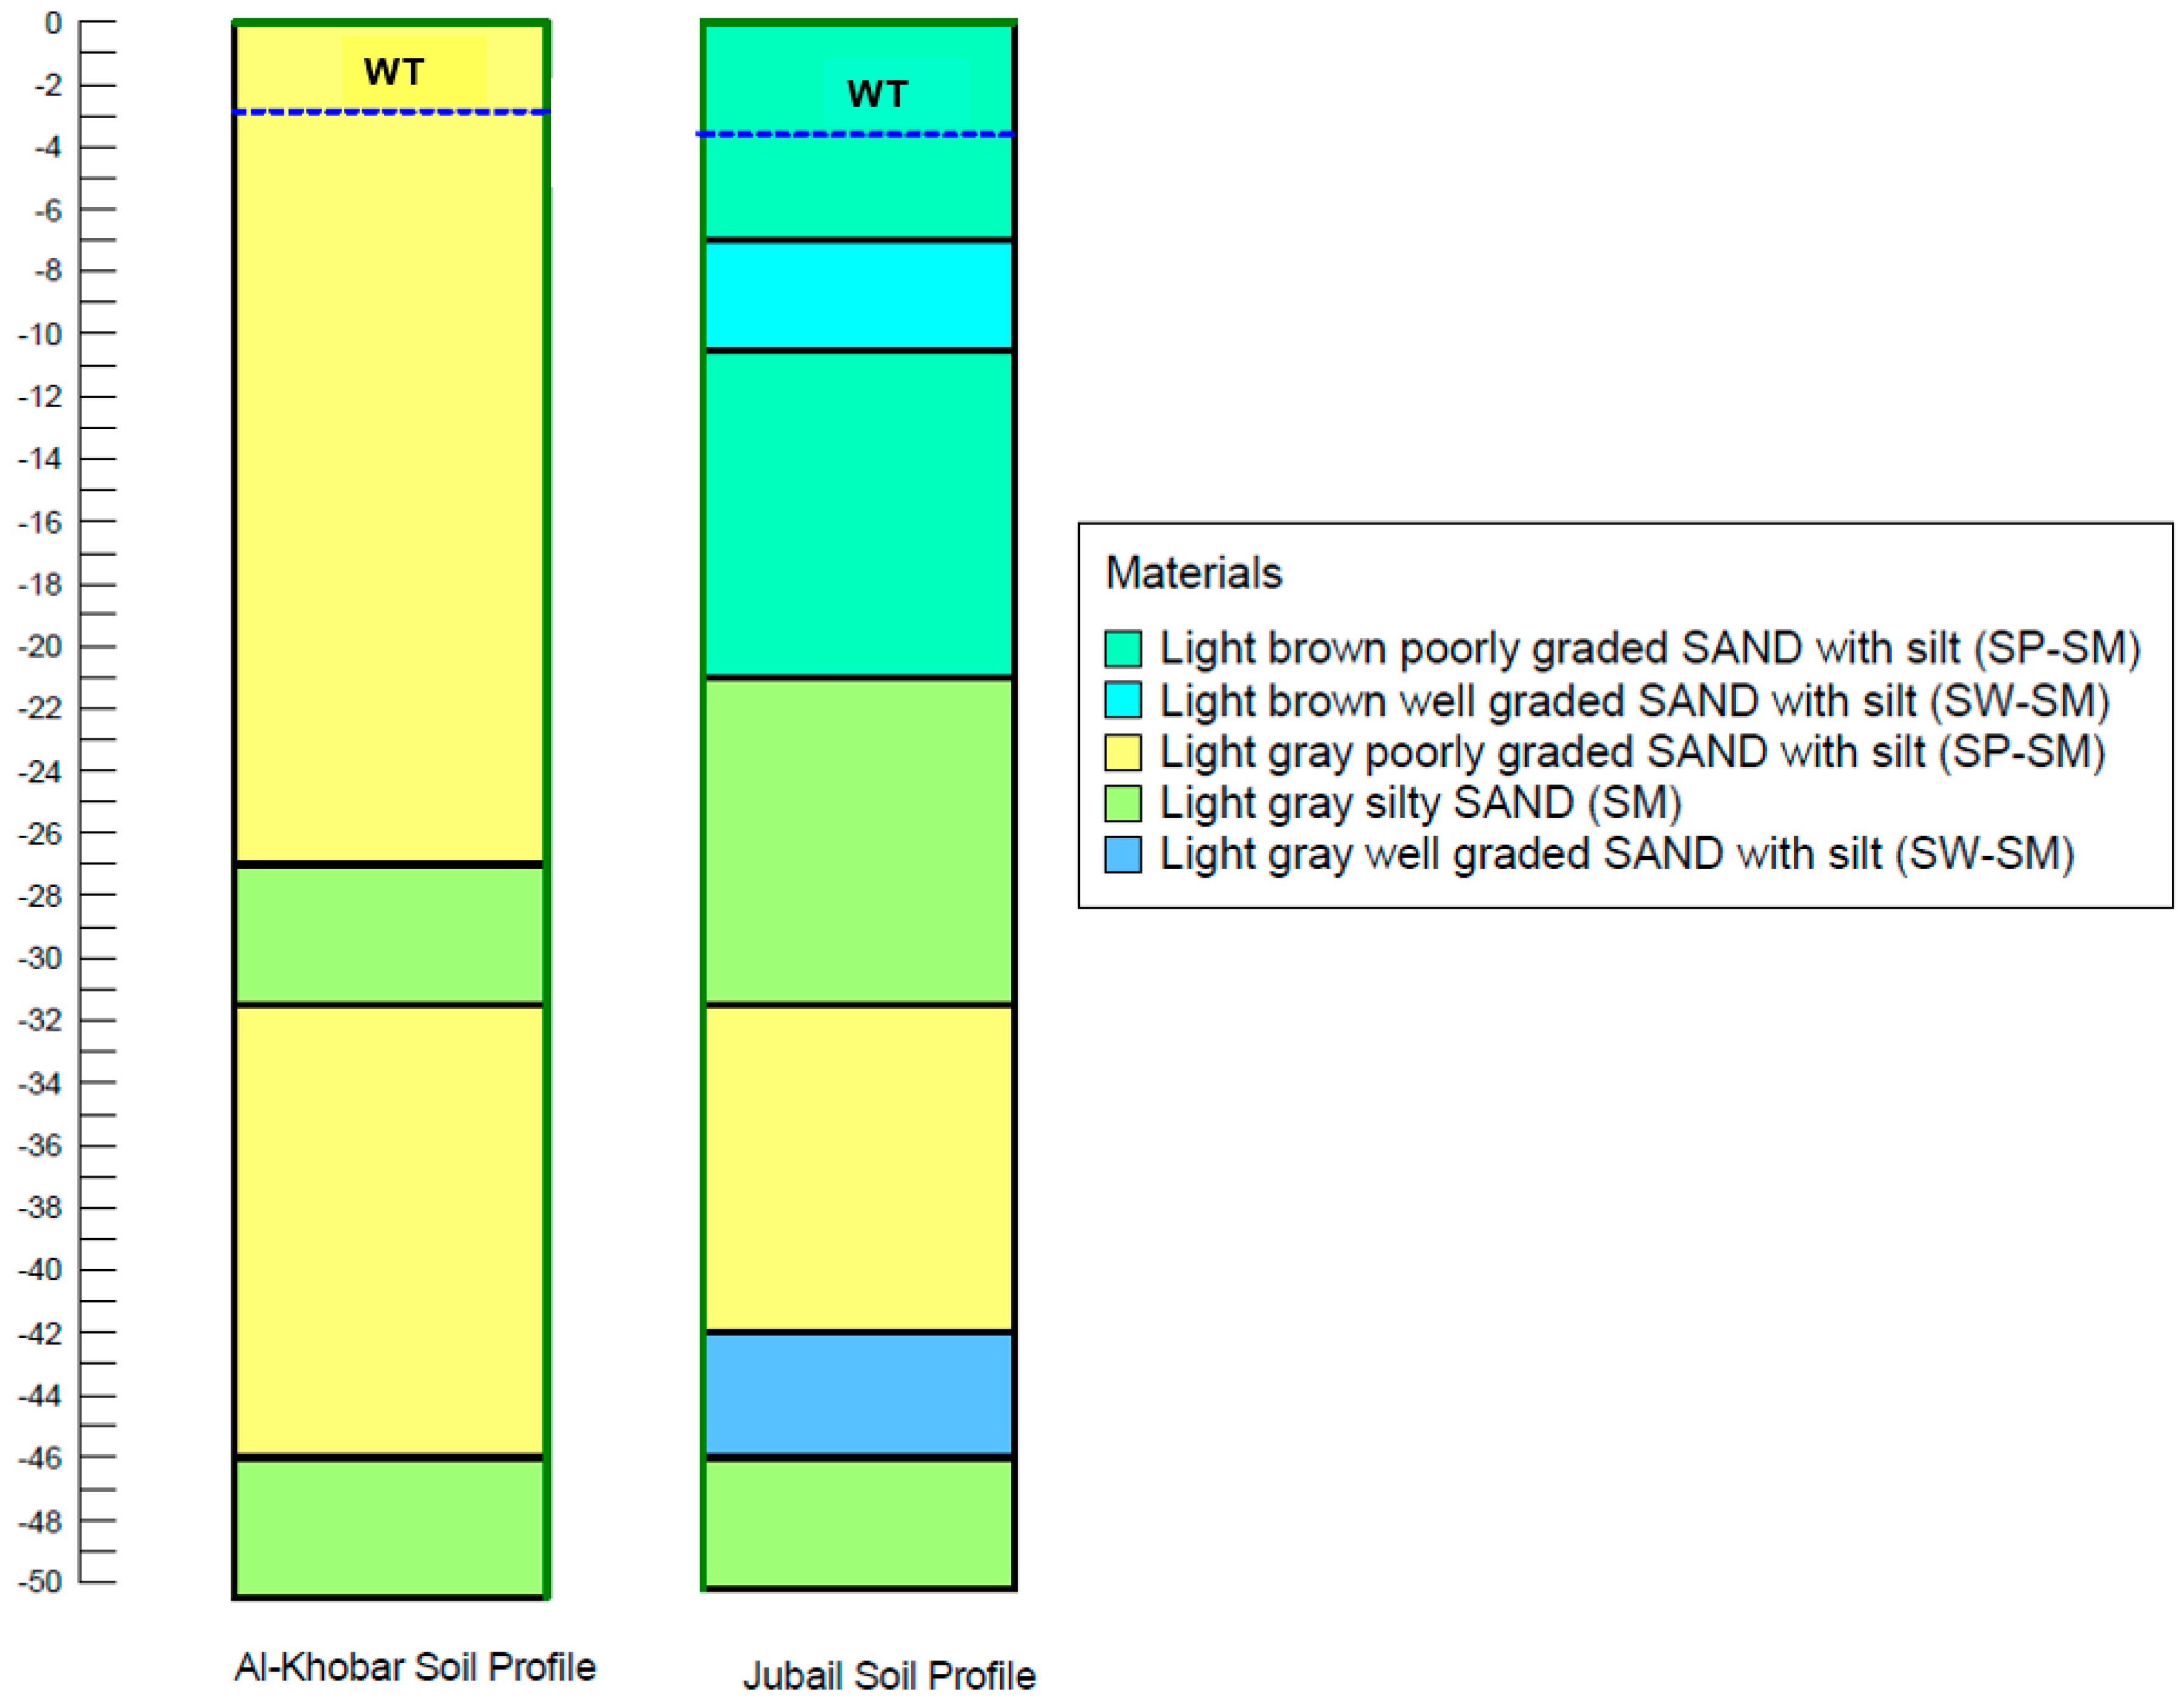
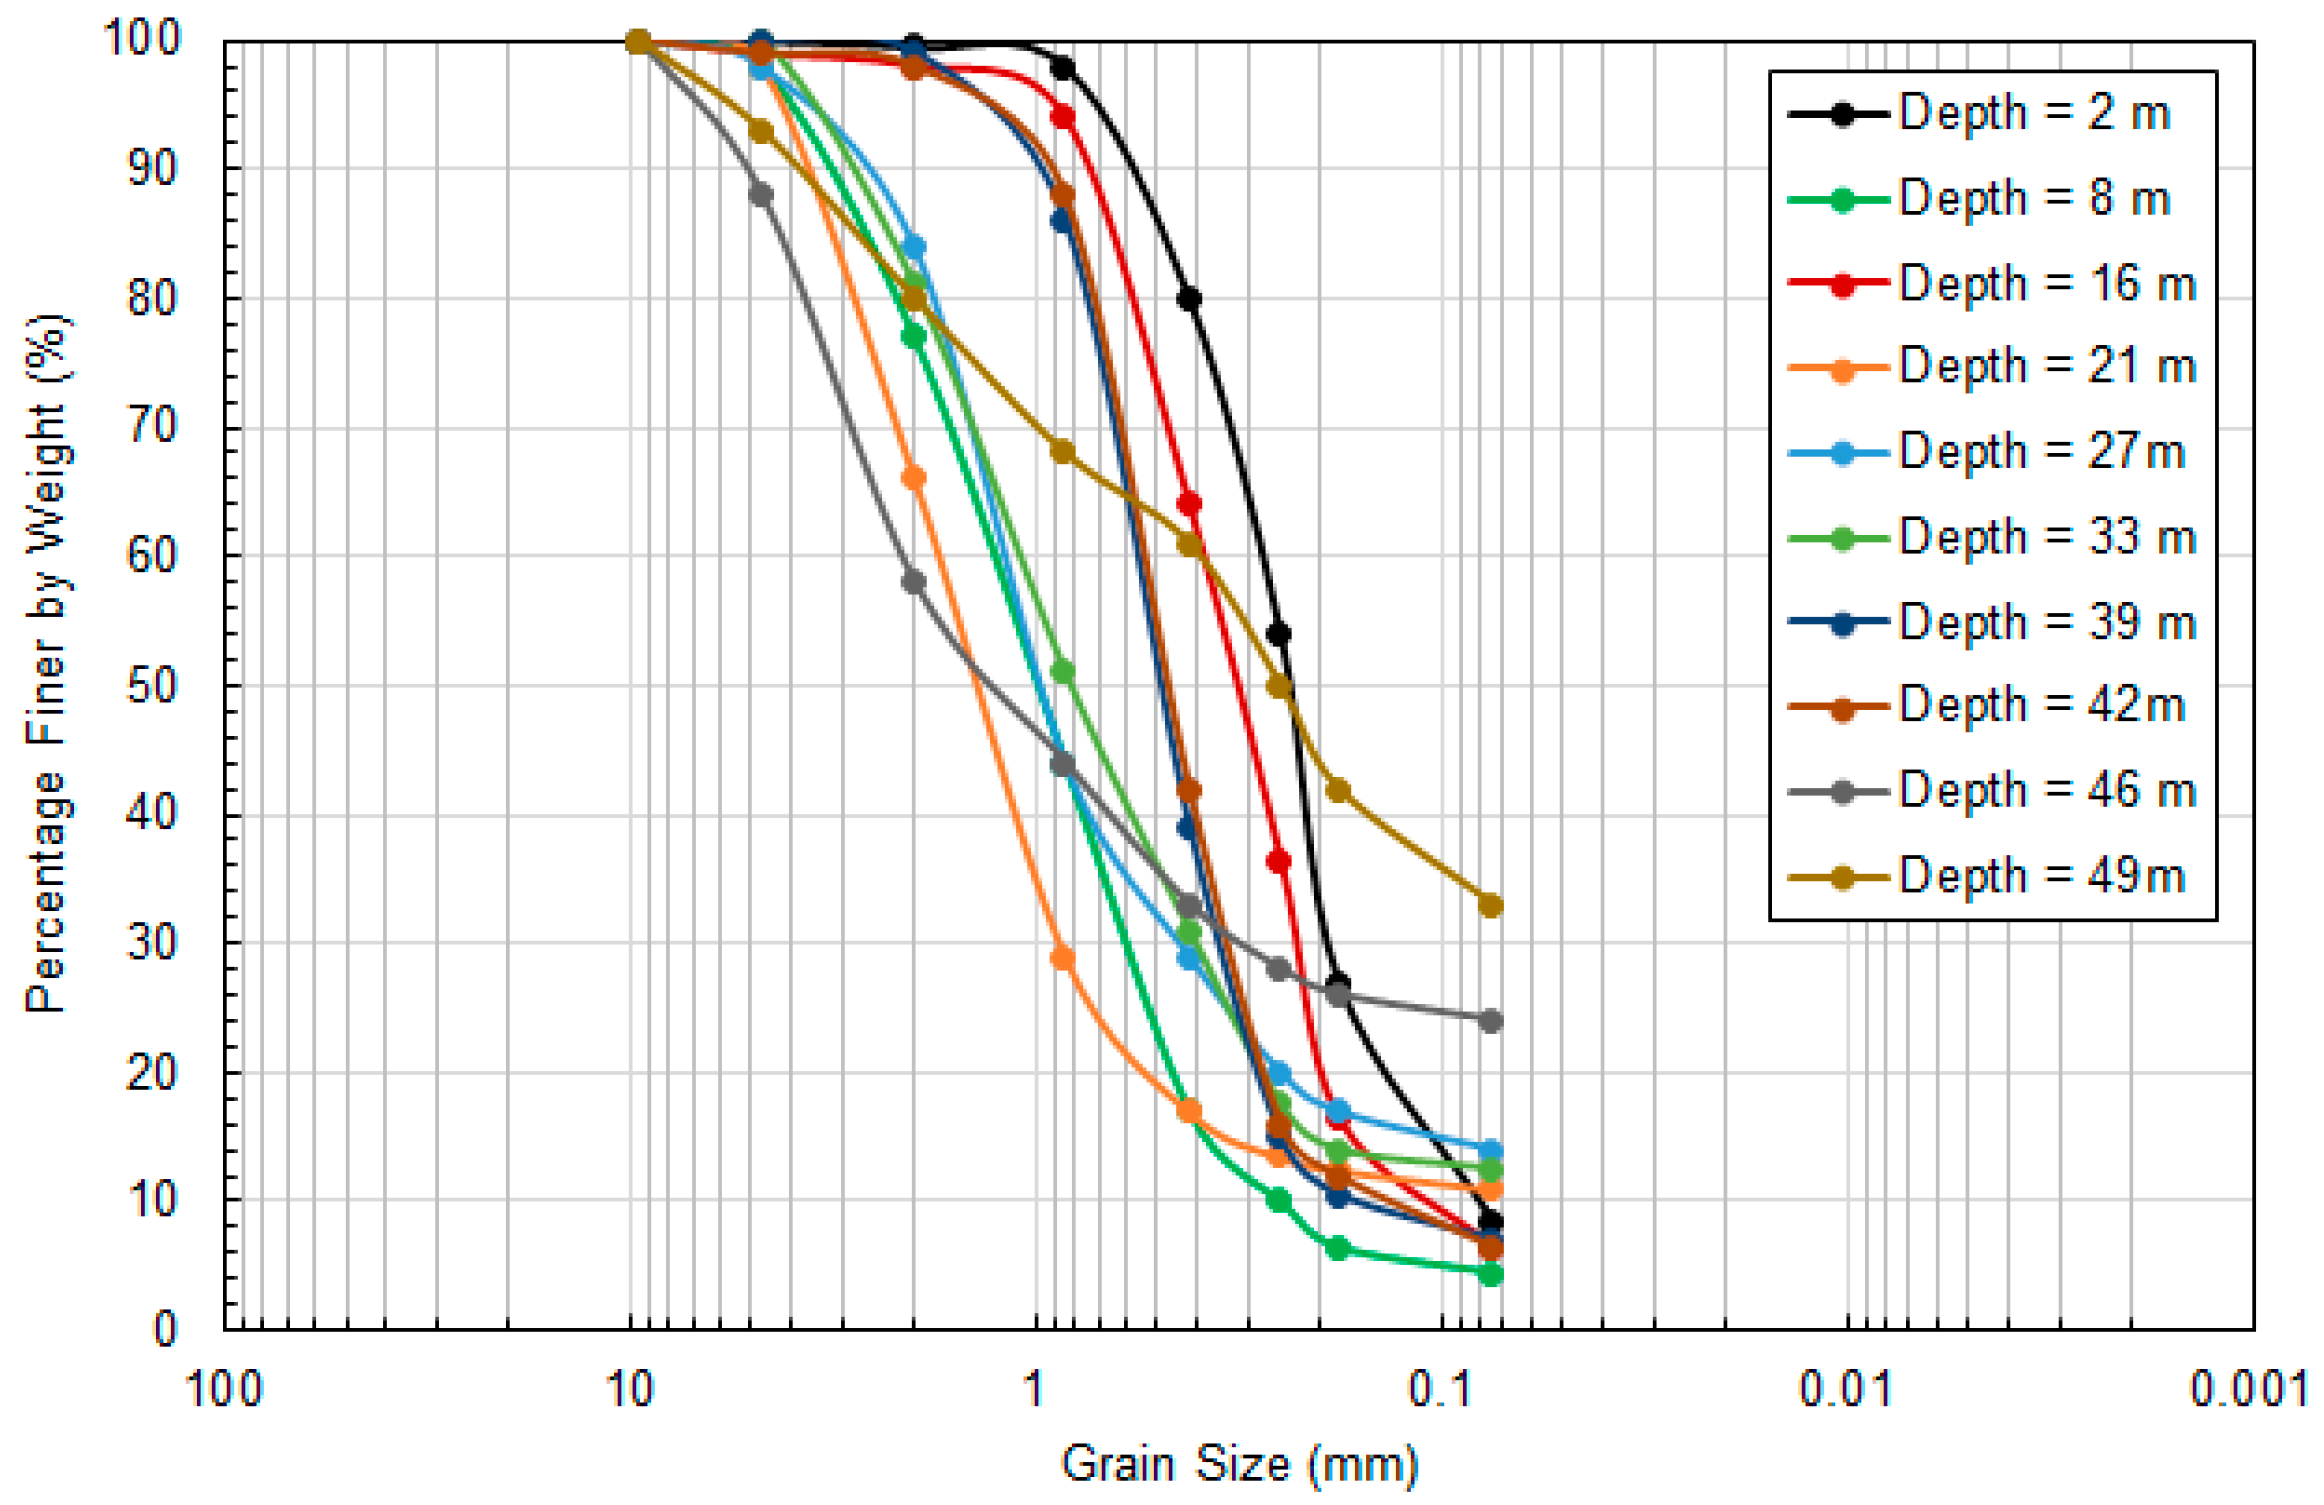
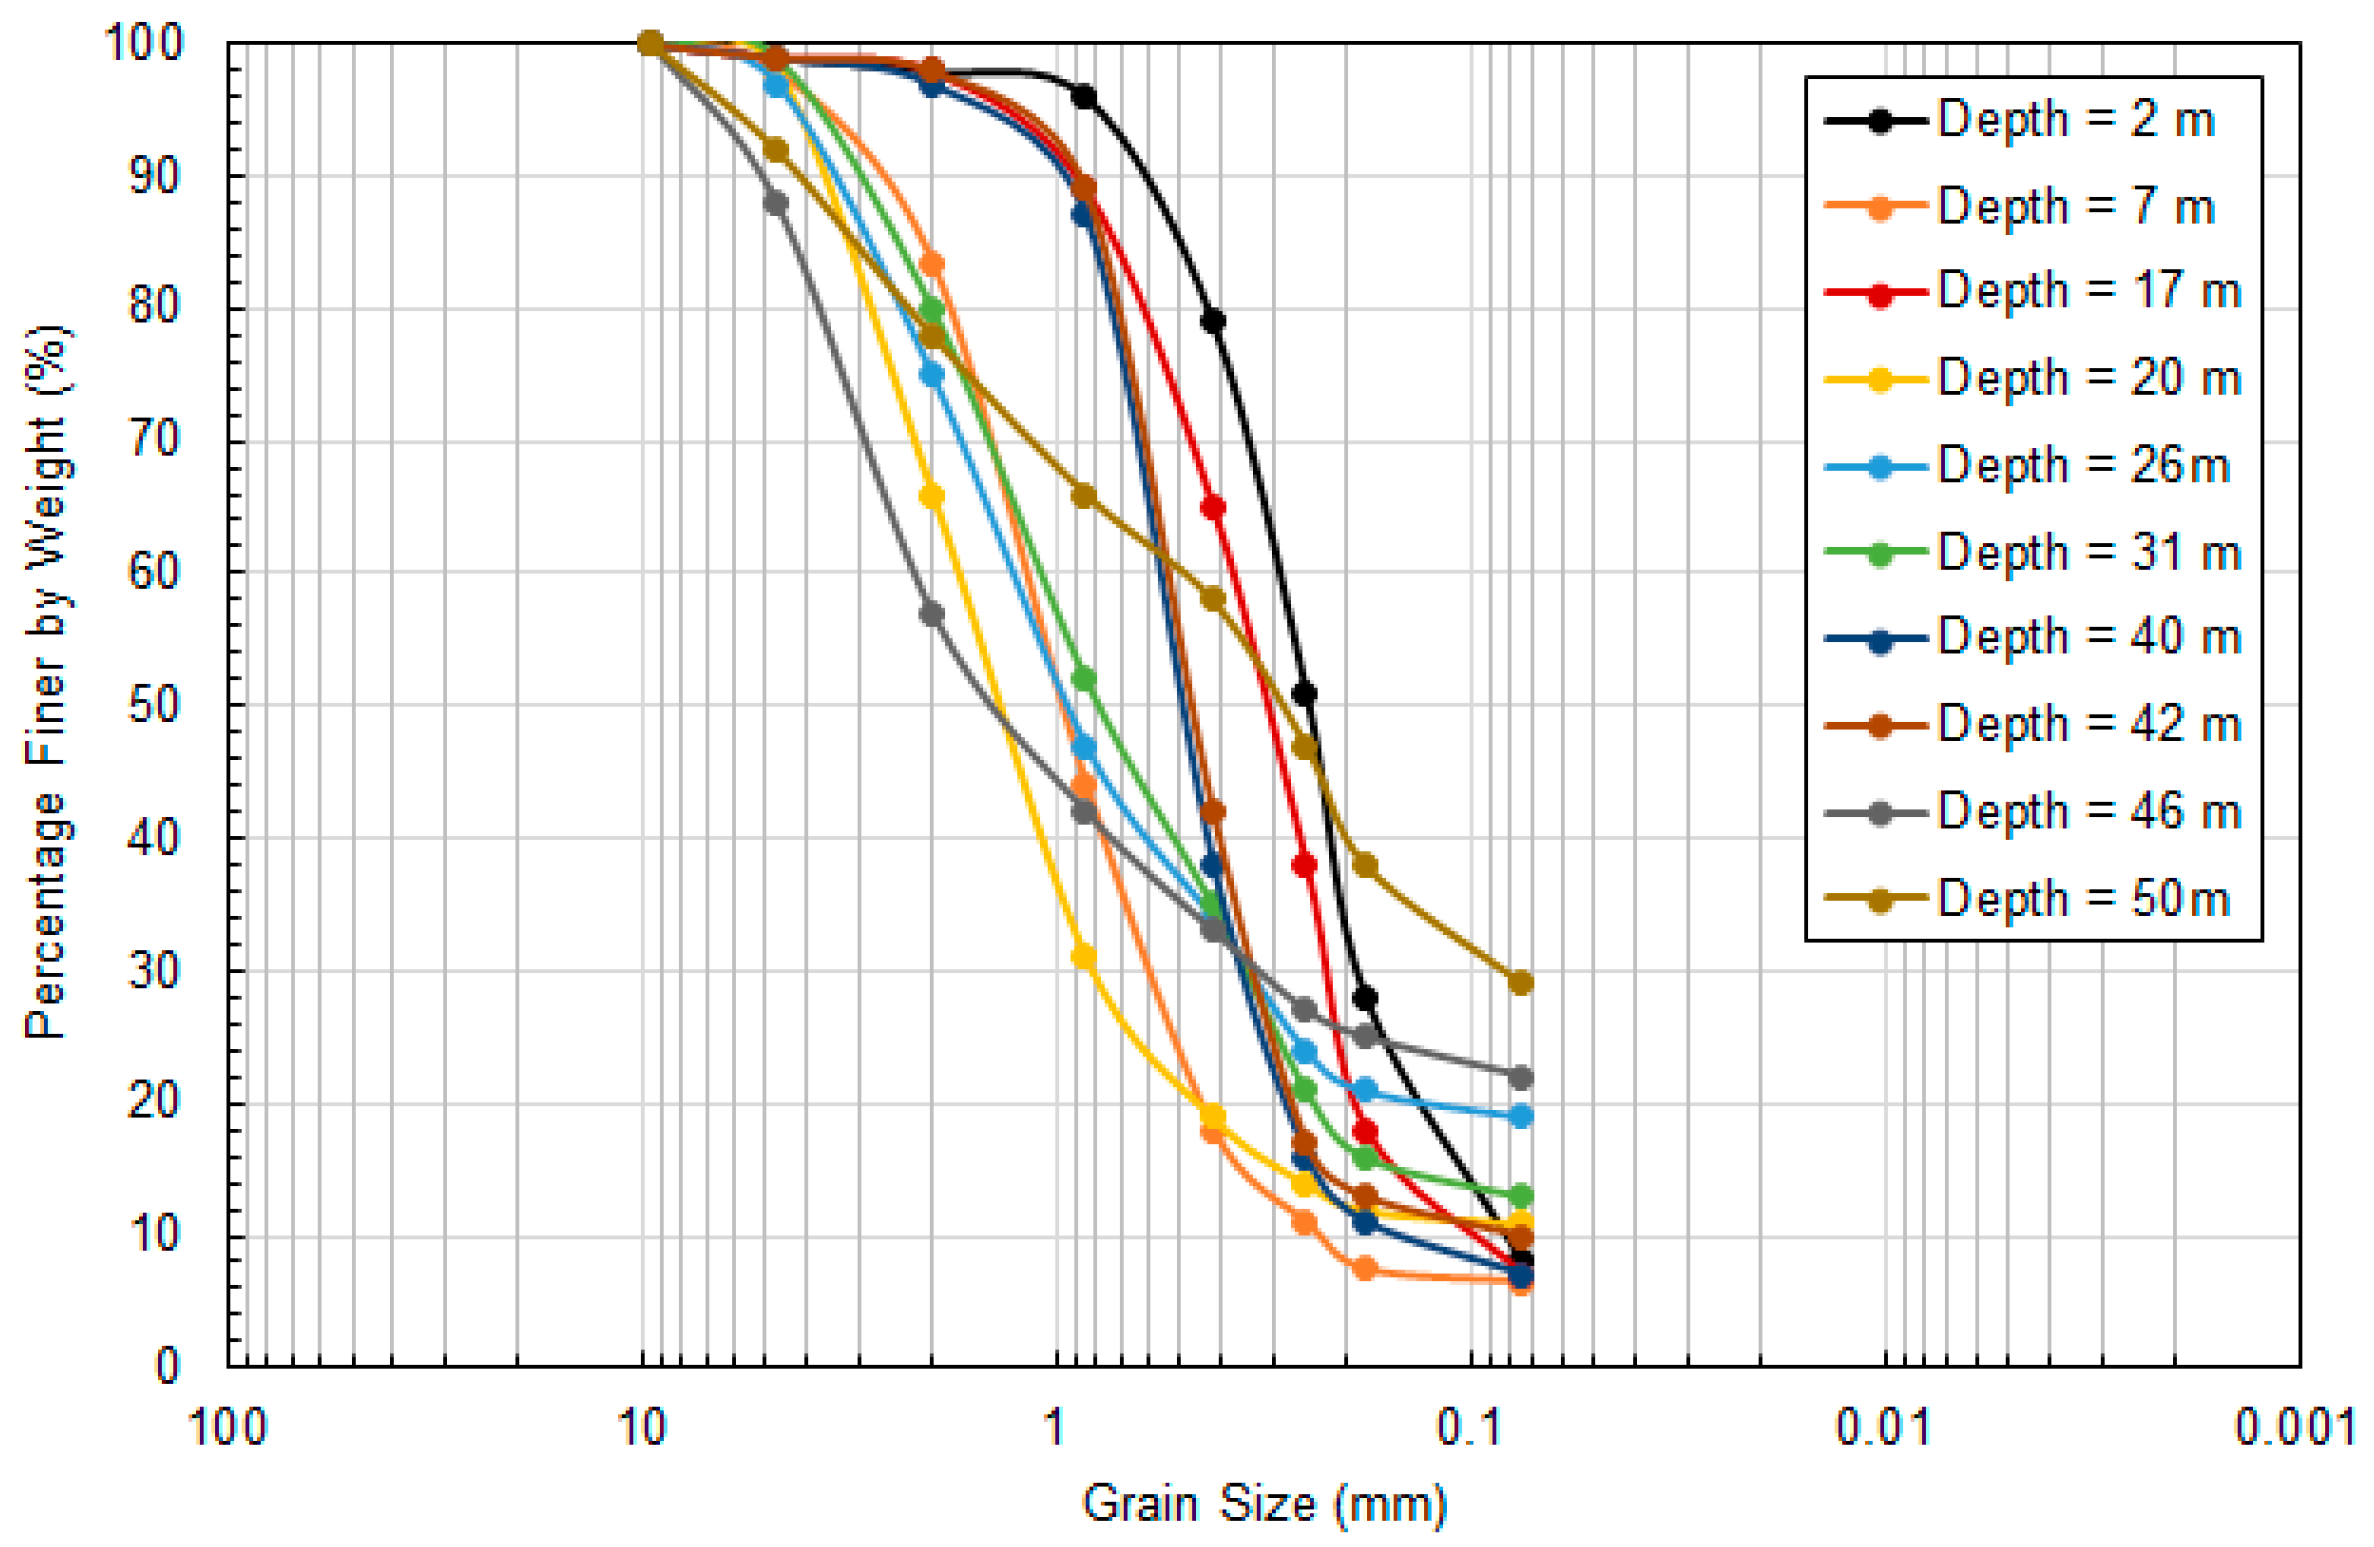
The soil profile testing and classifications indicate that the two studied sites consist mainly of light gray, poorly graded sand with silt interbedded with a 2 m thick layer of light gray silty sand.
Soil classification tests and grain size distribution percentages showed that sand is the predominant soil in the soil profiles of the Al-Khobar and Jubail sites, which ranged between 80% and over 90%. The fines content material that passes through the No. 200 sieve (<0.075 mm) was very small in comparison with sand.
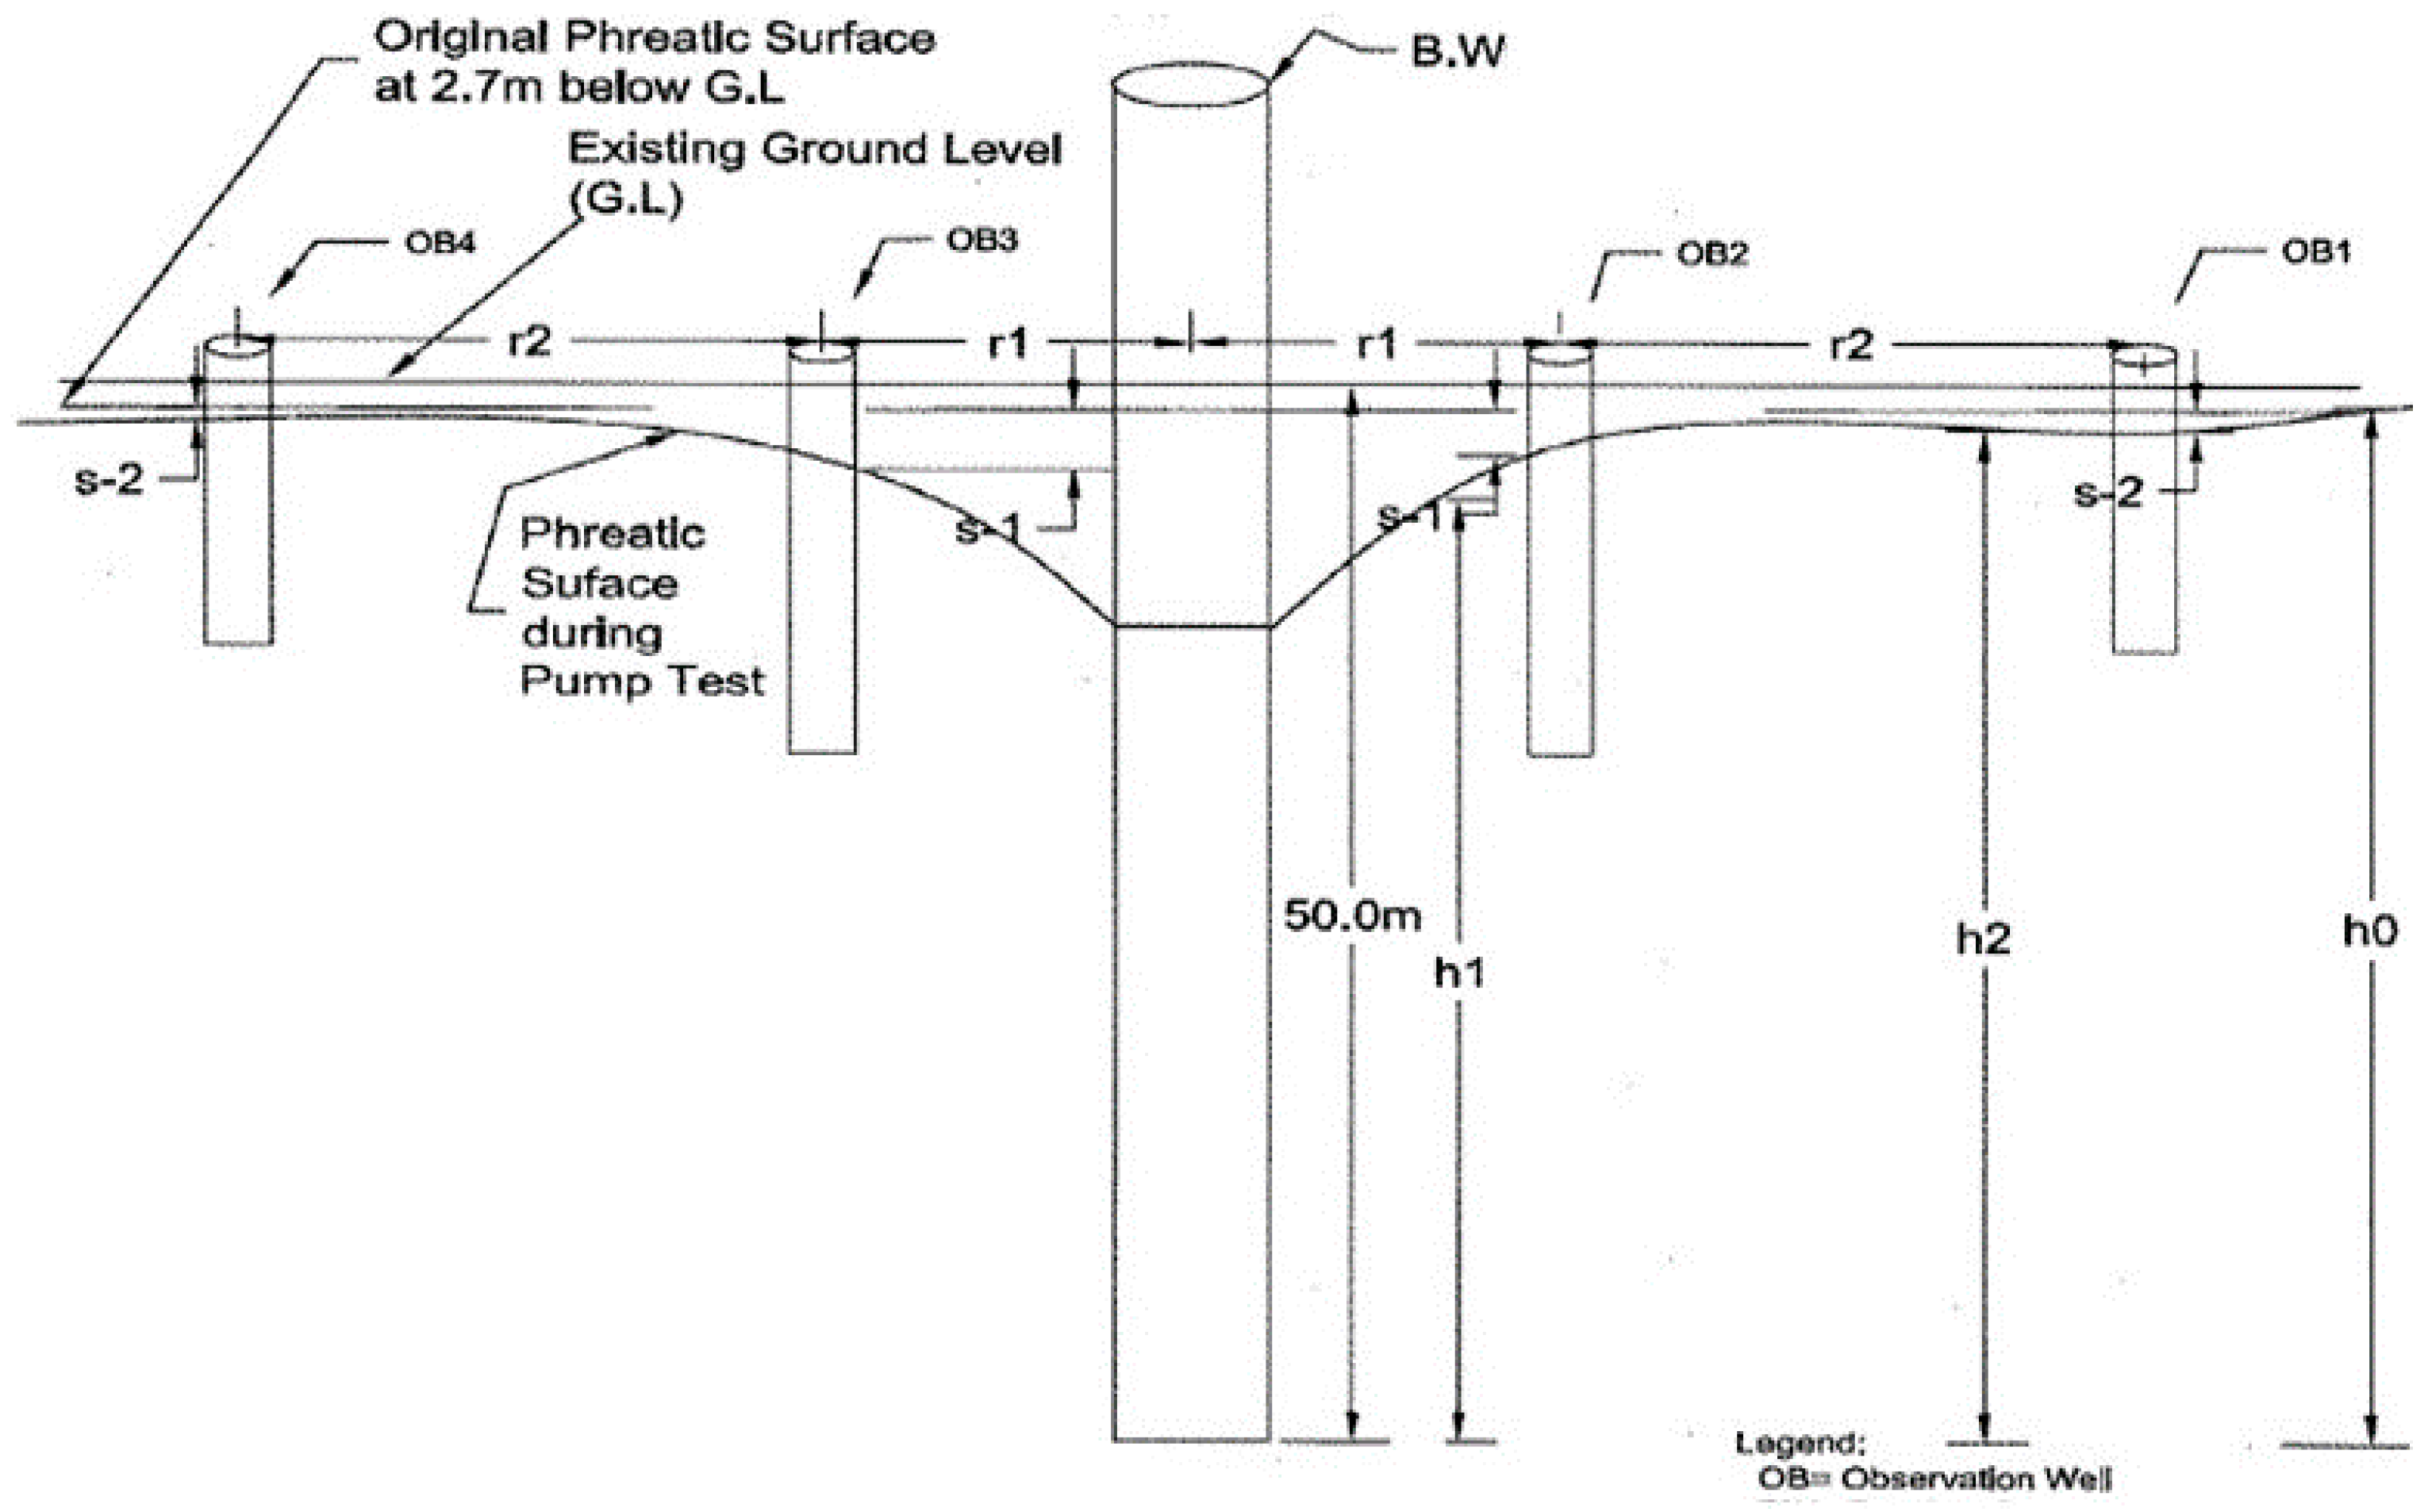
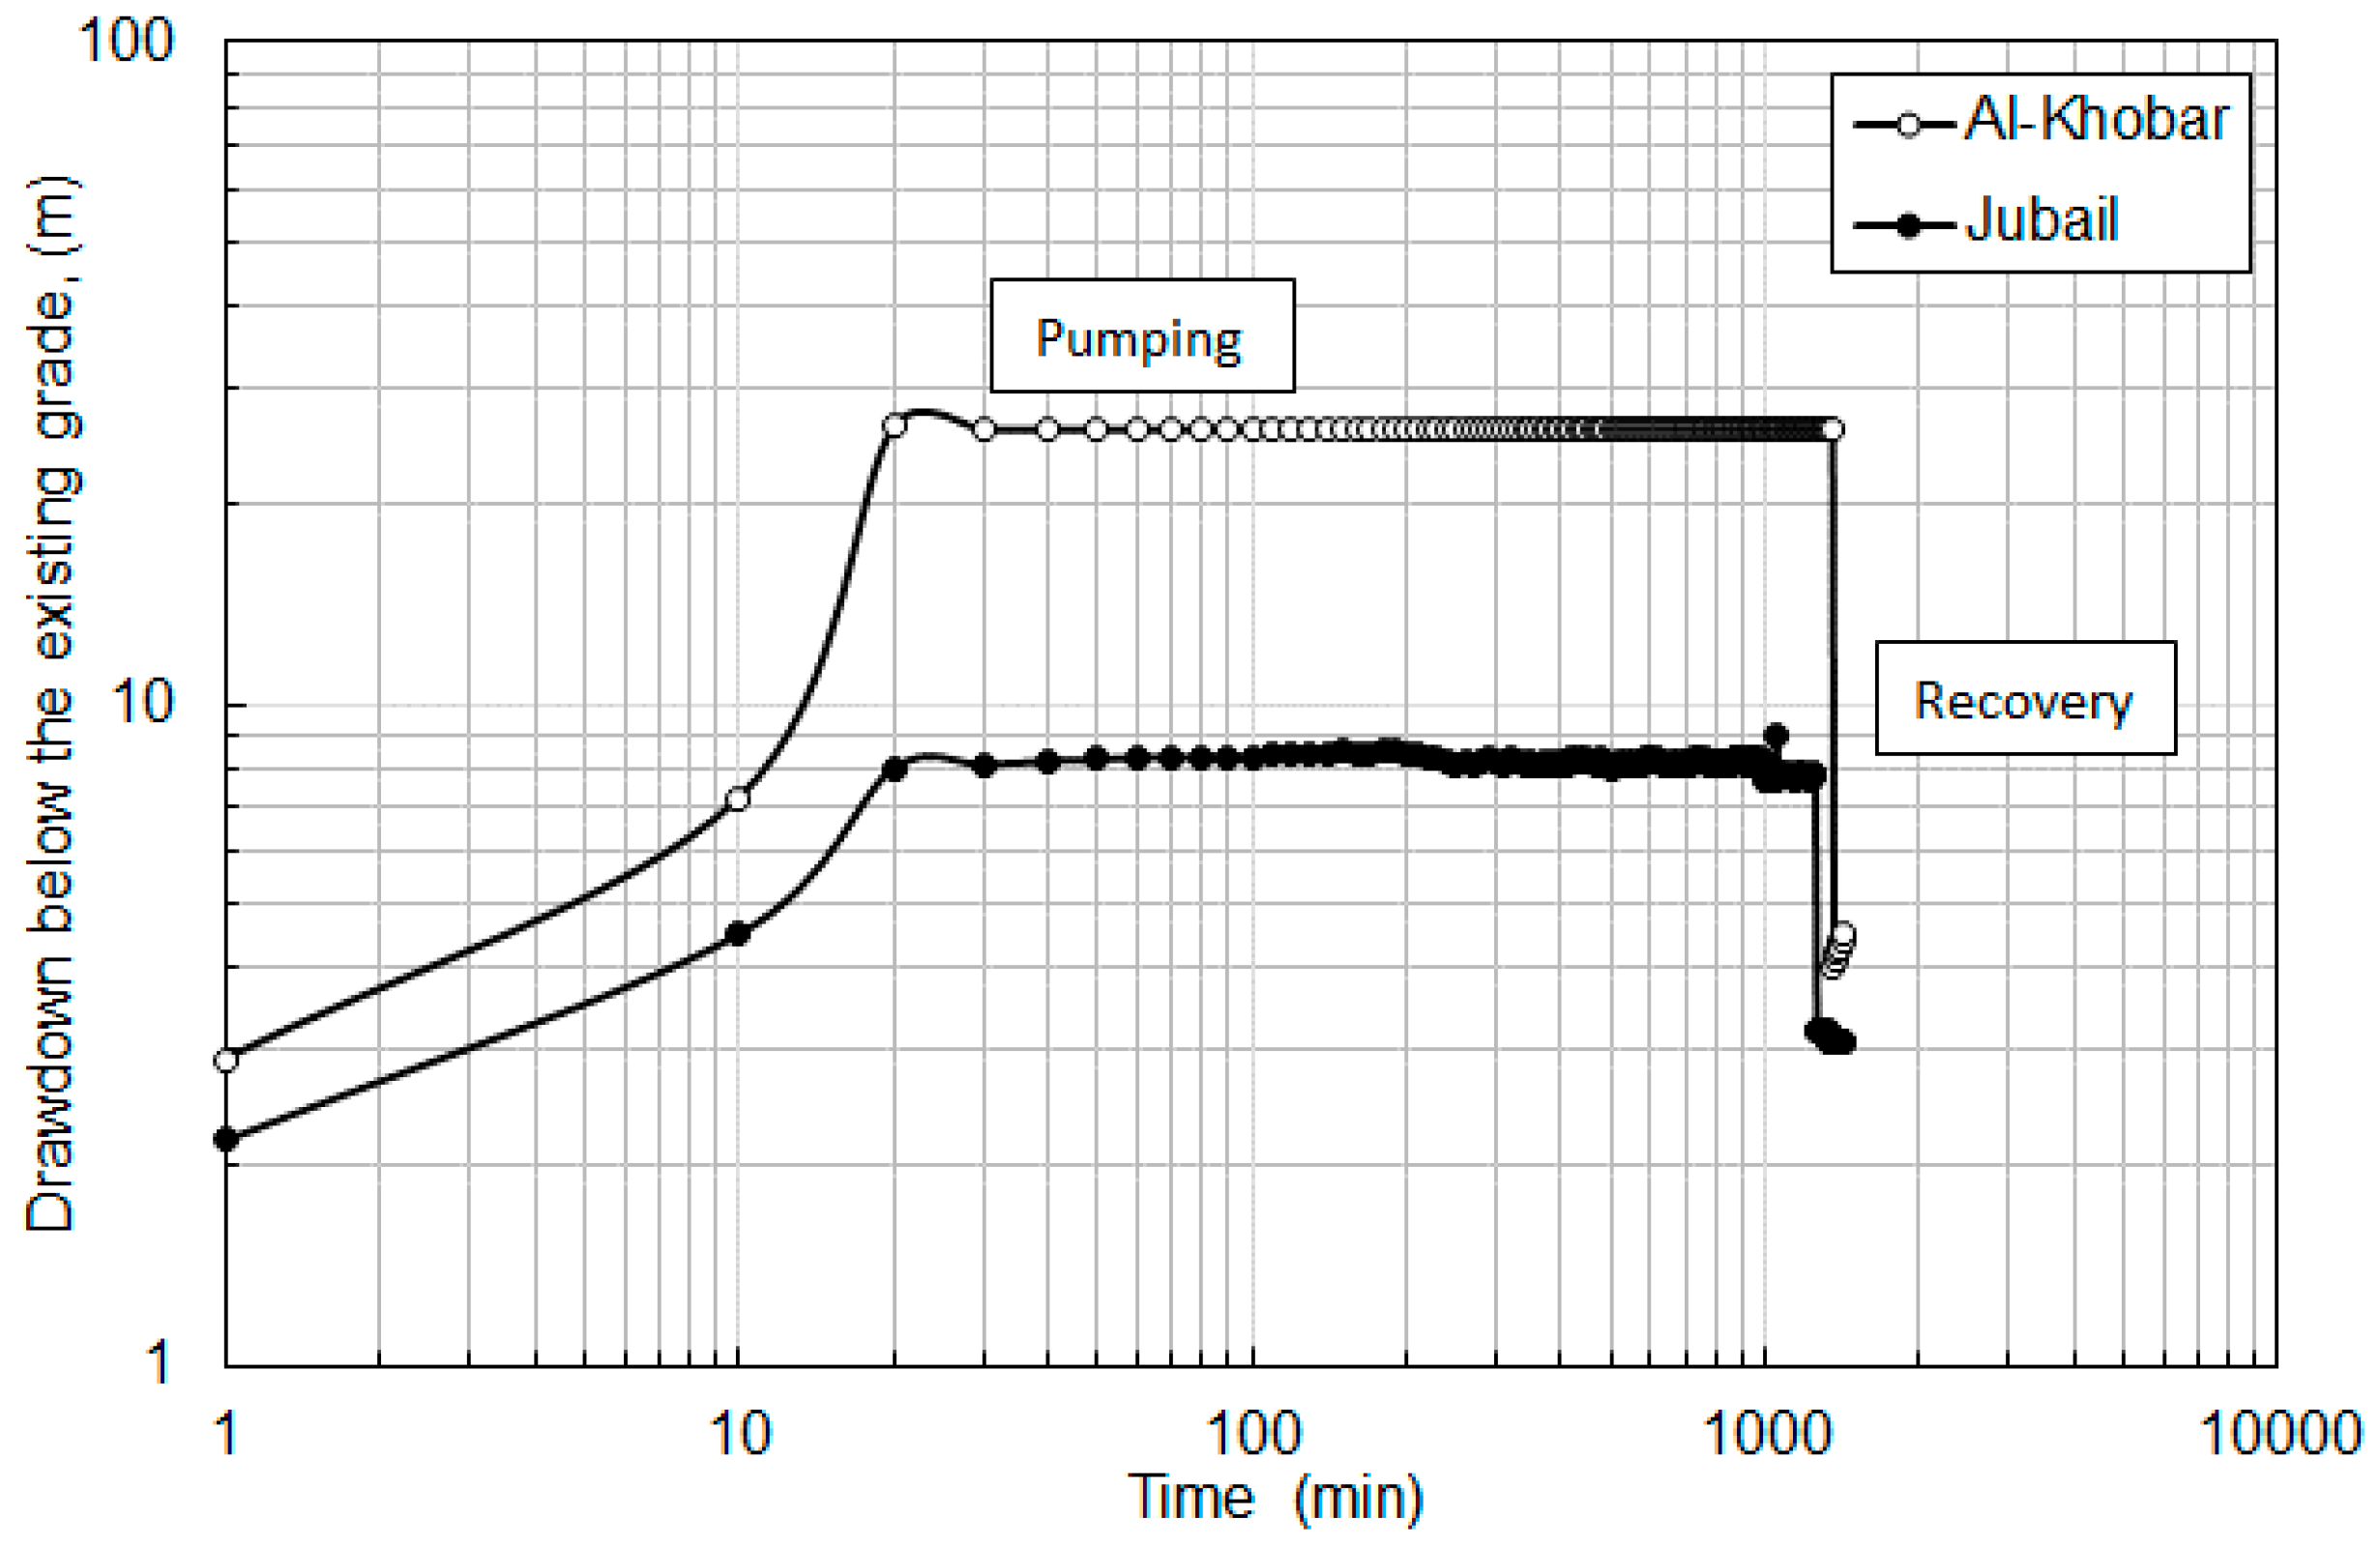
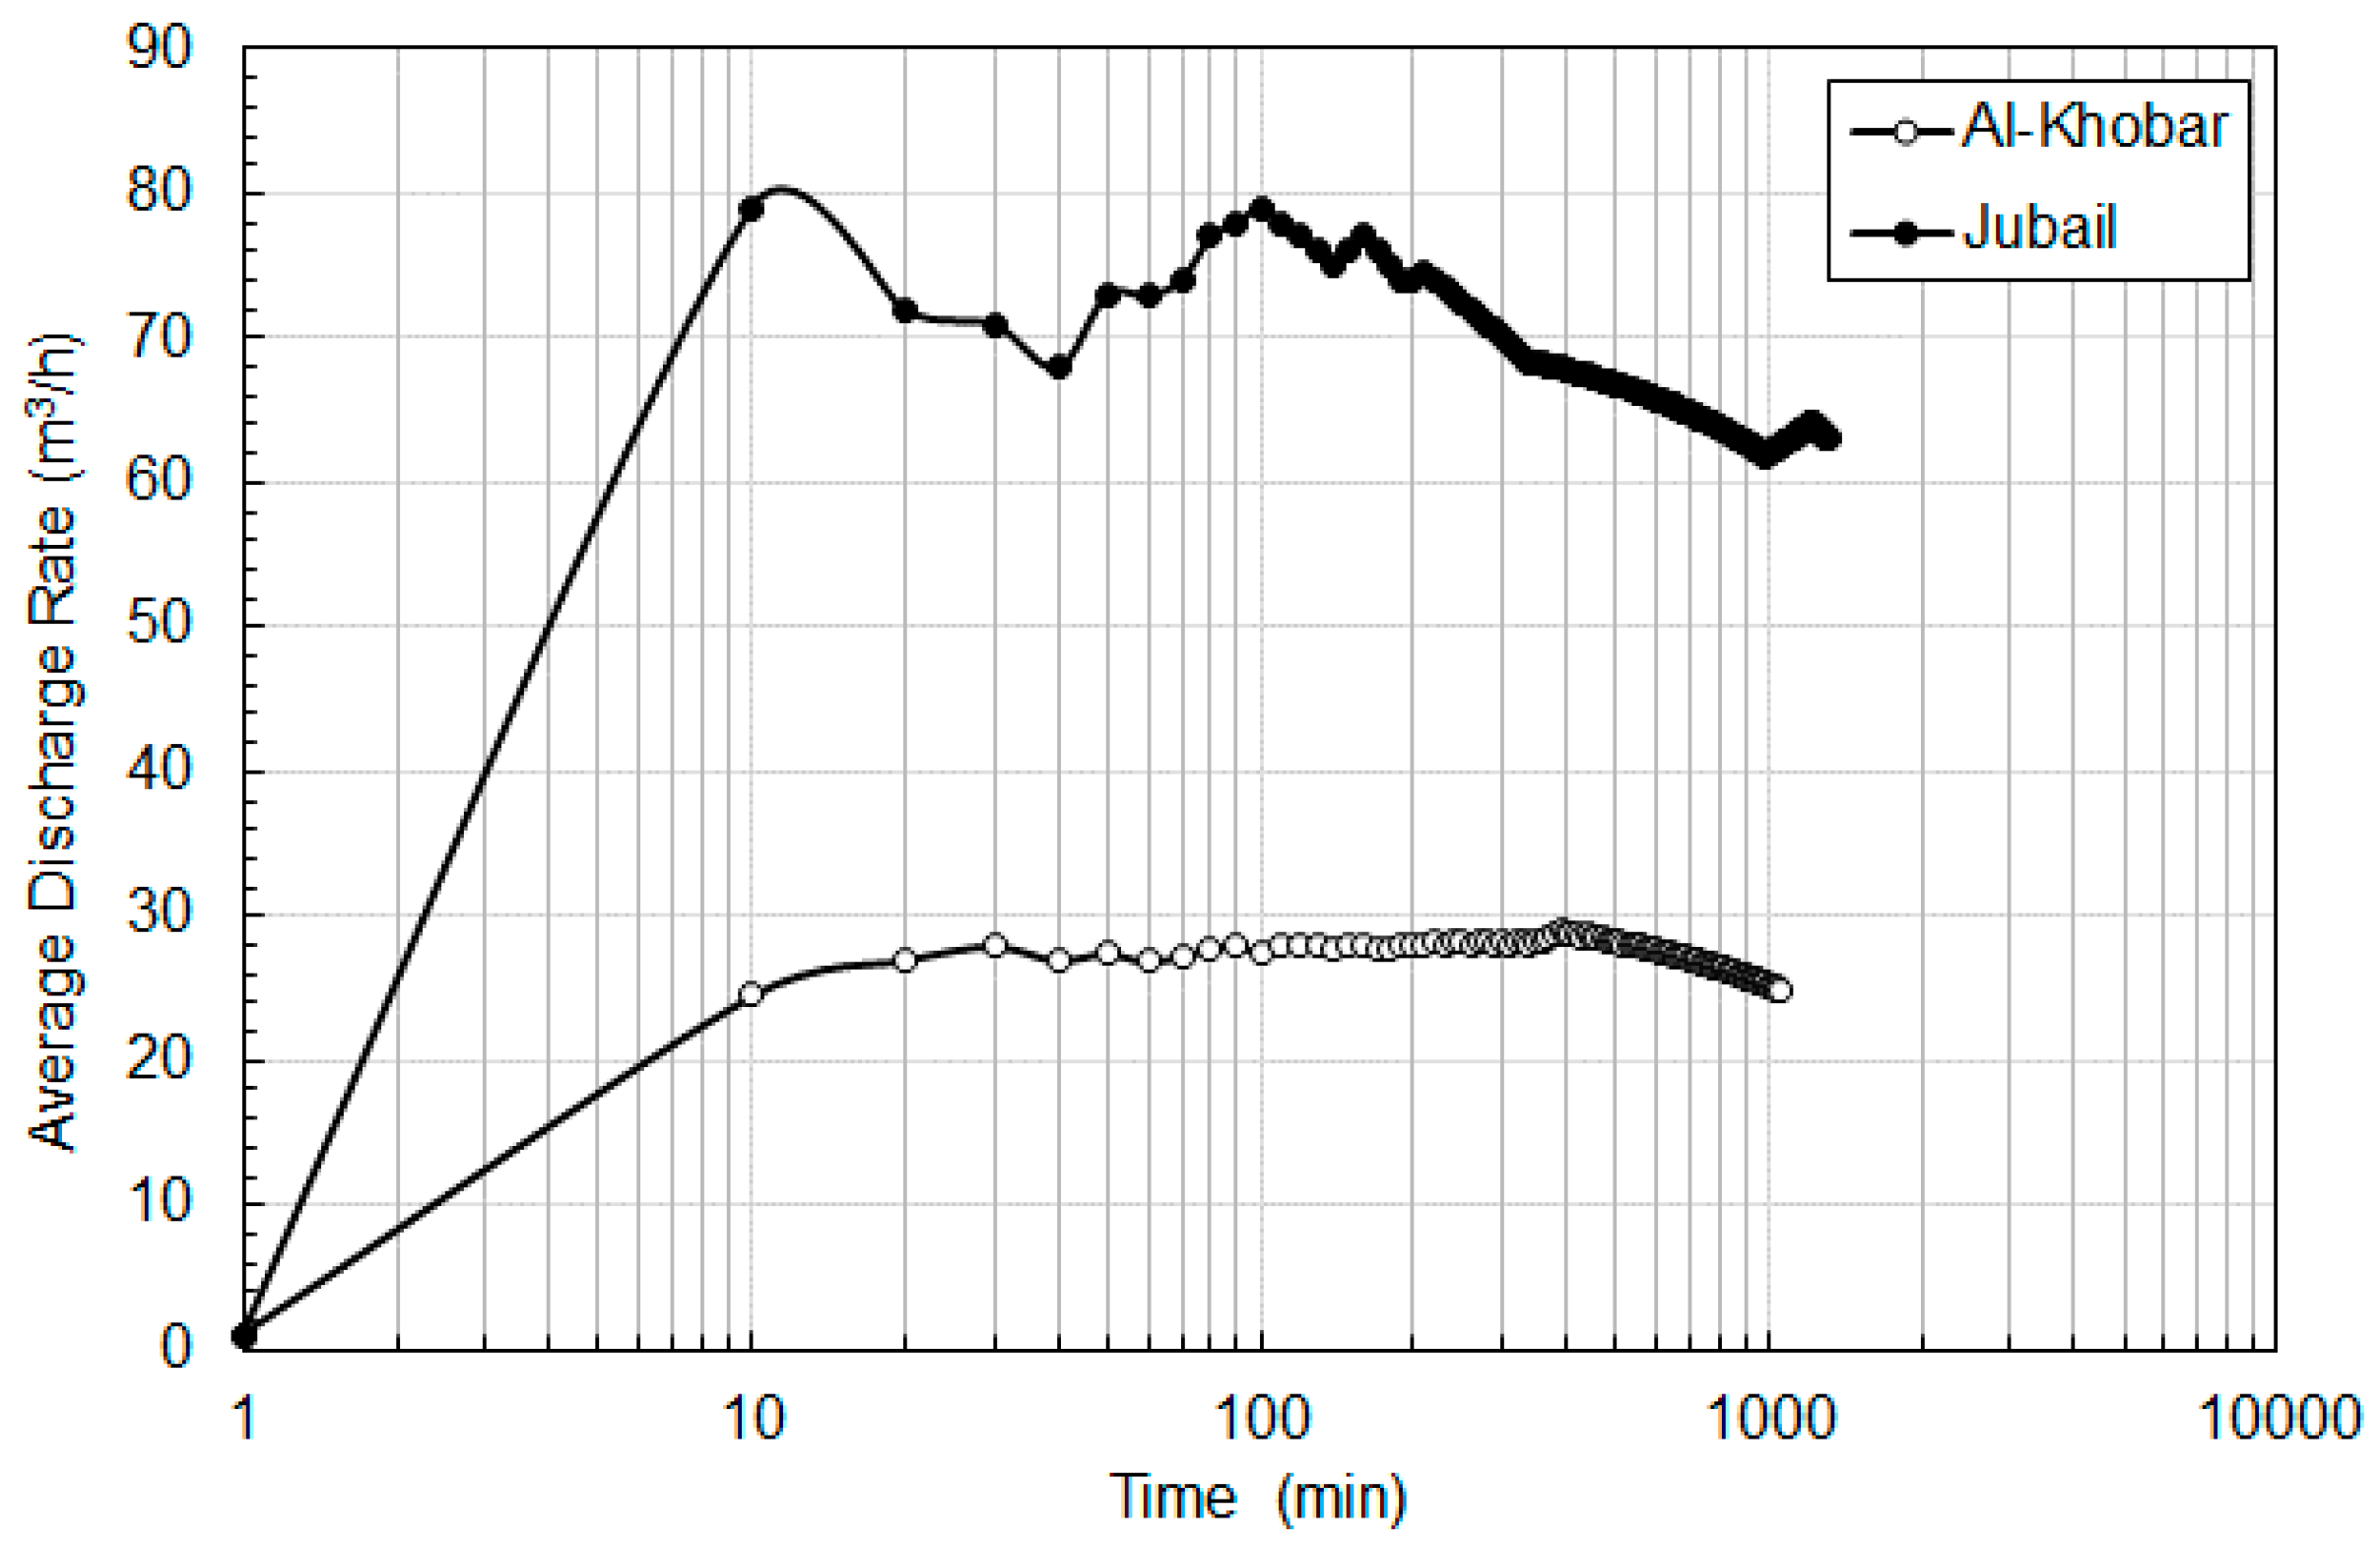
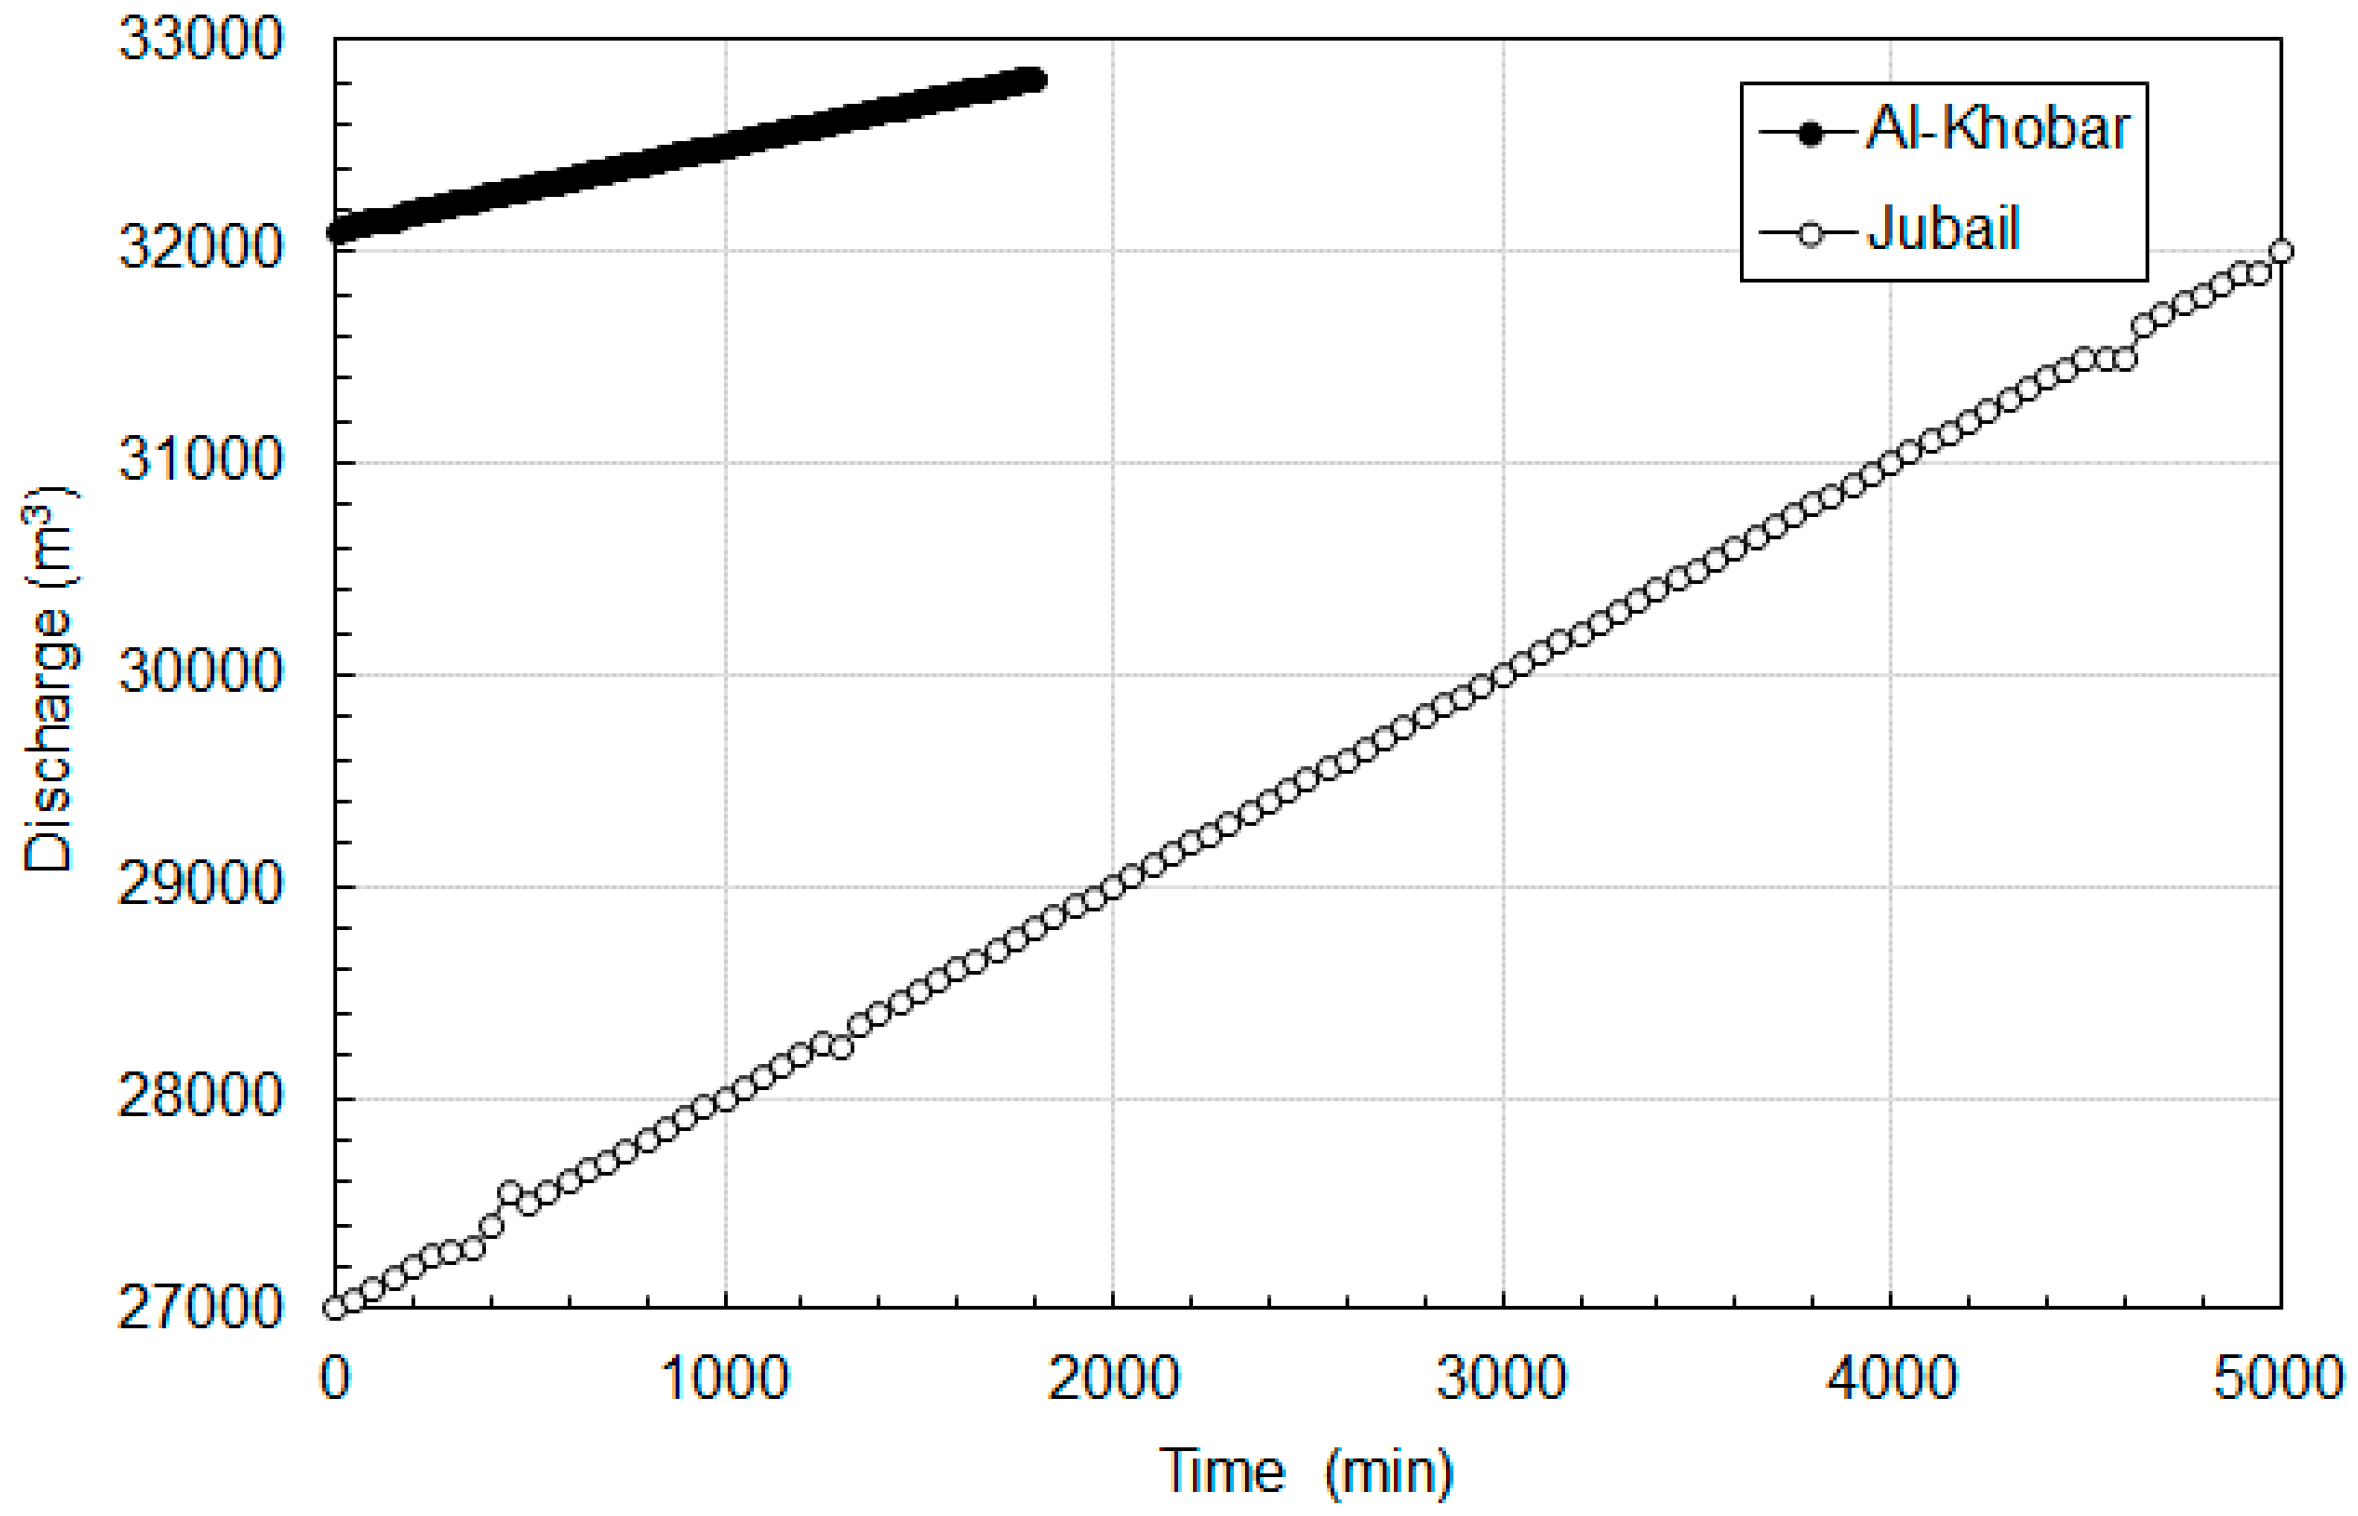
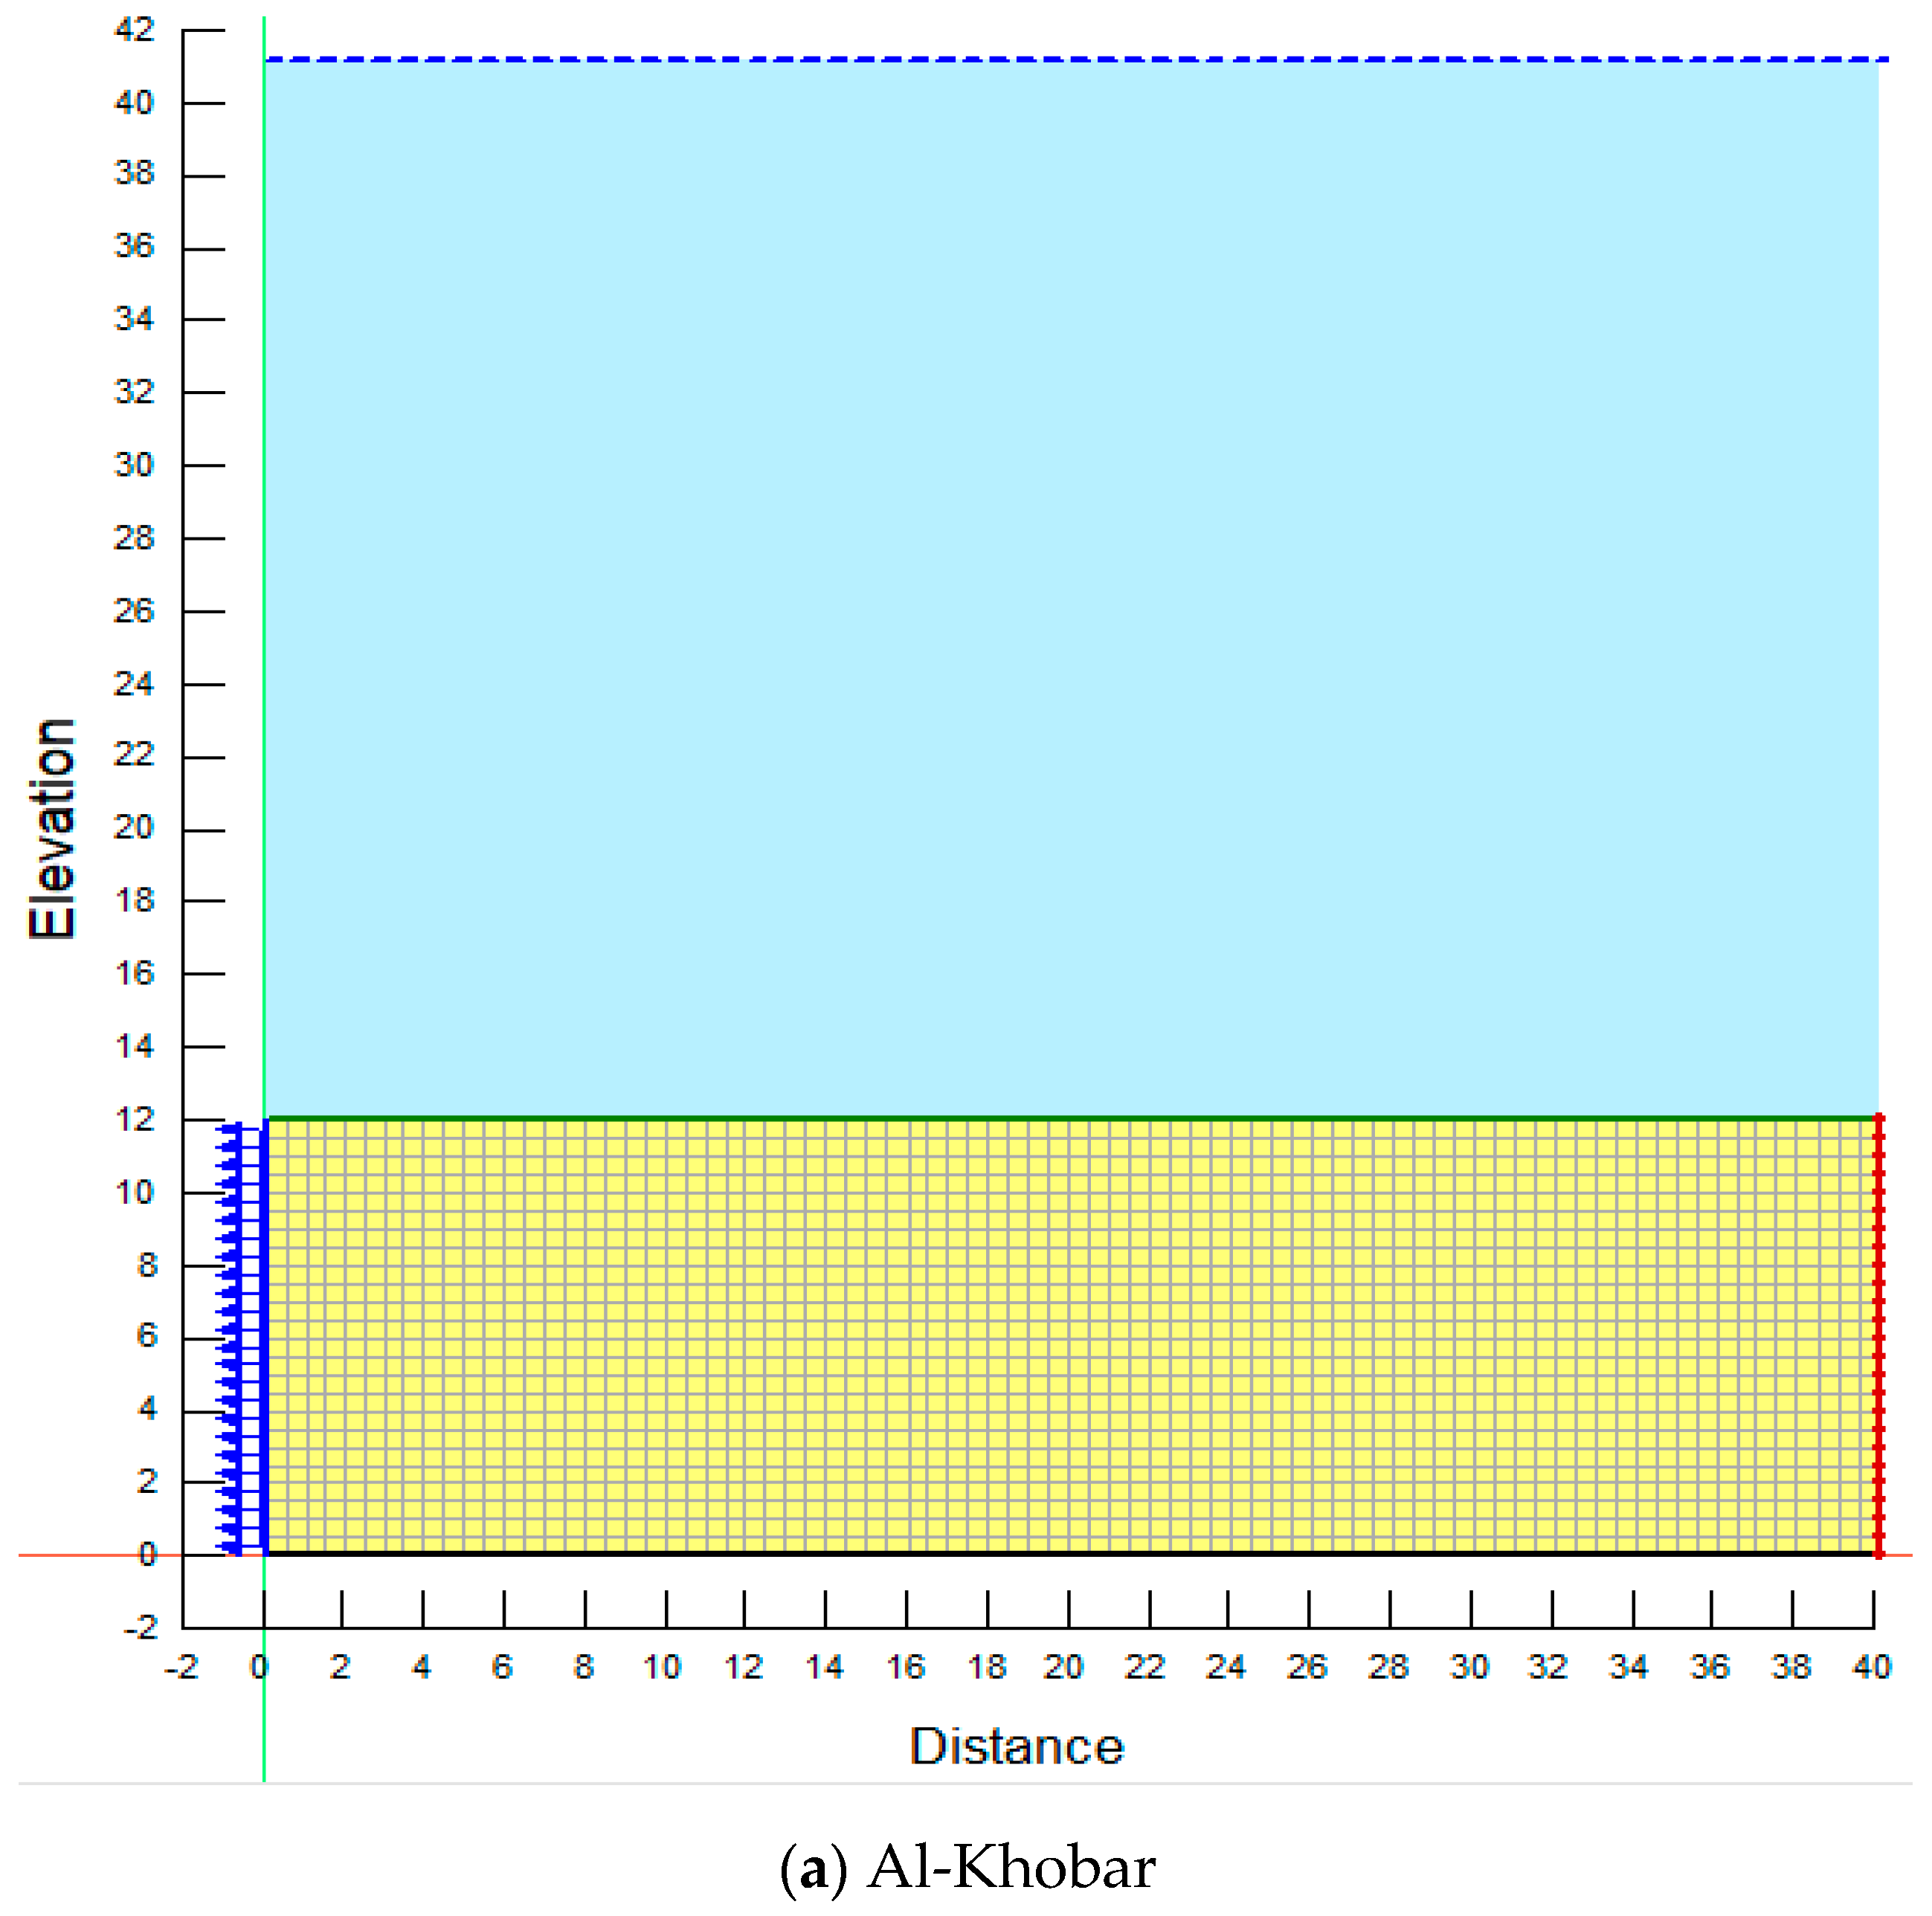
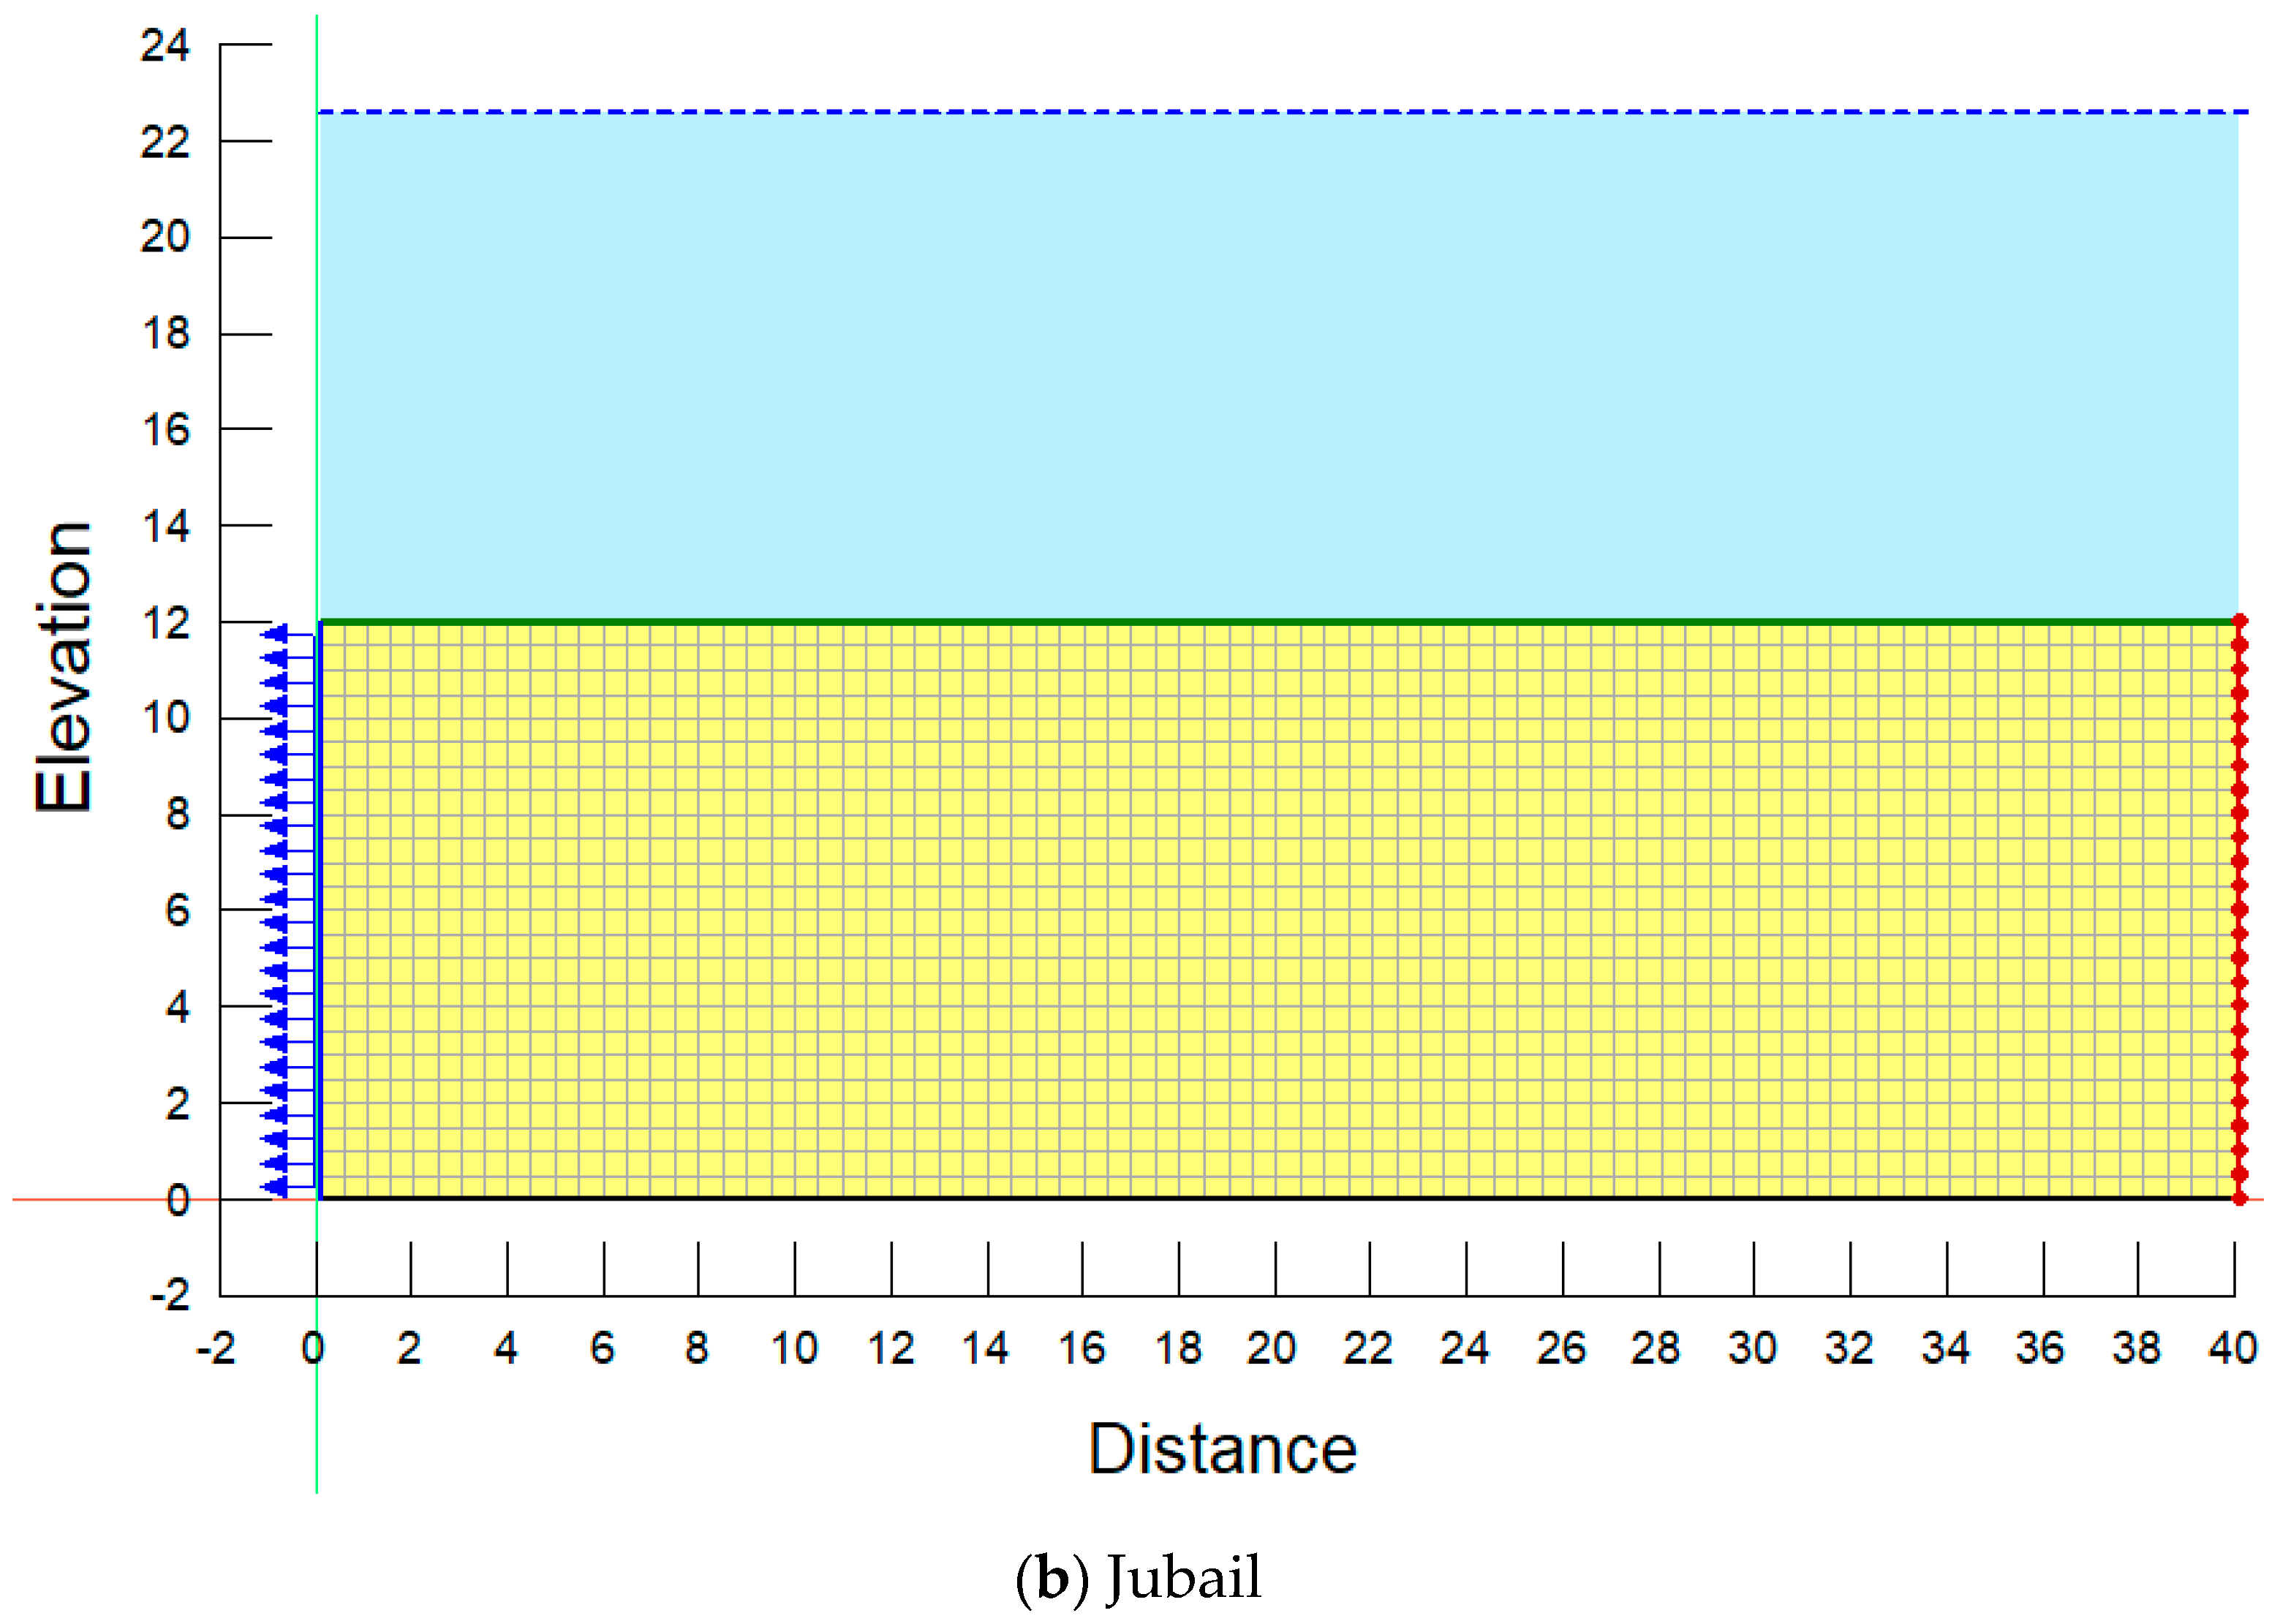
The static groundwater levels indicated that the water level was about 3.60 m and 2.85 m below the existing site grade at the Jubail and Al-Khobar sites, respectively. The 72 h pumping and a 12 h recovery test period for both sites showed a fast increase in the average discharge rate in the first 10 min. The average discharge rate for the Al-Khobar site was 25 m3/h, while for the Jubail site it was 67 m3/h.
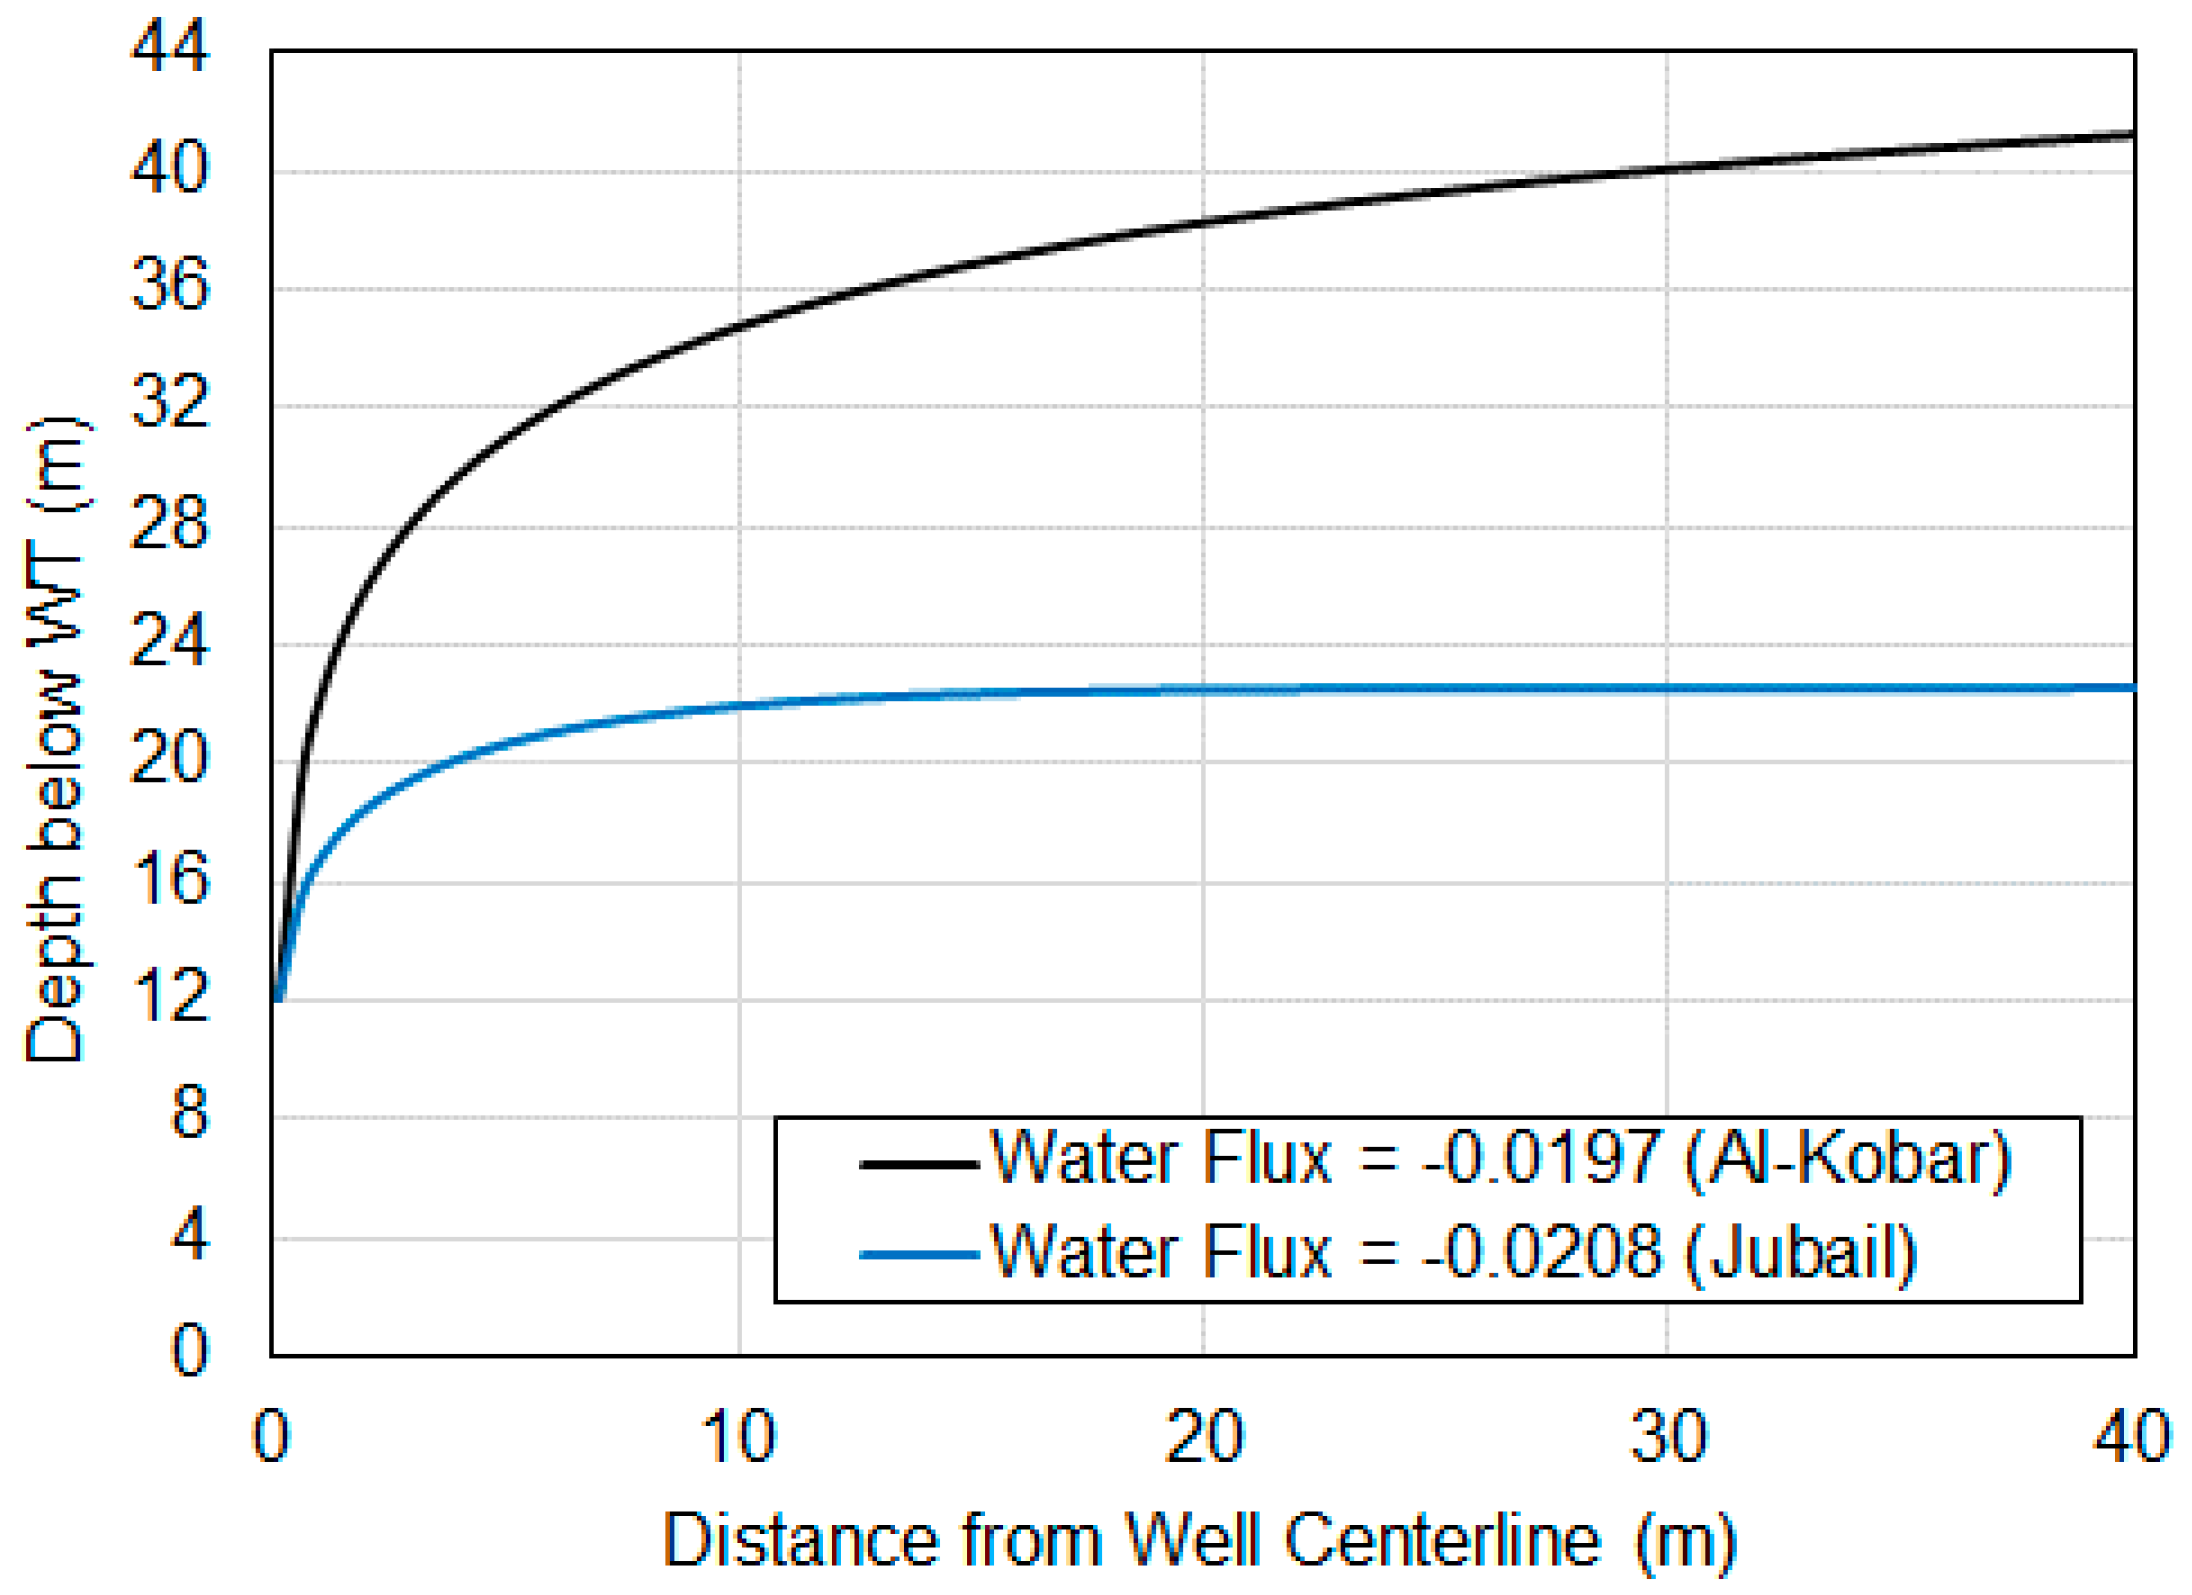
The experimental data and numerical modeling were conducted to investigate the effects of well water flux at the slotted screen section of the beach well. The water flux values for the Al-Khobar and Jubail sites were 0.0197 and 0.0208 m3/s/m2, respectively, which correspond to 72 m3/h/m2 and 1356.48 m3/h/m2. In terms of the rate of pumping flow, the model suggests production can be increased by 20 and 53 times the measured production of the Jubail and Al-Khobar sites, respectively.
The beach well water quality experimental results show that SDI15 values ranged between 5.1 and 6.2, which indicates beach well sand filtration in the Eastern Province would be a valuable pre-filtration step in reverse osmosis (RO) to be used without conventional chemical pre-treatment for the RO water purification process. The outcome of our findings is to suggest to the stakeholders at the Saline Water Conversion Corporation (SWCC) in Saudi Arabia that they undertake a scientific study on the selection and utilization of beach well intake options in the eastern part of the Kingdom of Saudi Arabia (KSA) for seawater pre-treatment. This option will be especially useful during extreme Gulf water pollution, such as during oil spills and algal blooms.

Author Contributions

O.A. (Omar Alagha): project administration, resources, conceptualization, investigation, writing—original draft preparation, review and editing. O.A. (Osama Abuhajar): visualization, methodology, formal analysis, review and editing. All authors have read and agreed to the published version of the manuscript.

Funding

This research was funded by Deanship of Scientific Research (DSR) at Imam Abdulrahman Bin Faisal University (IAU), grant number 2012190 and The APC was funded by Deanship of Scientific Research (DSR) at Imam Abdulrahman Bin Faisal University (IAU).

Acknowledgments

The authors acknowledge the financial support provided by the Deanship of Scientific Research (DSR) at Imam Abdulrahman Bin Faisal University (IAU) for funding this work through Project No. 2012190. Seawater analysis was accomplished by the SWCC Jubal research institute.

Conflicts of Interest

The authors declare no conflict of interest.

References

  1. Shirazi, S.M.; Adham, M.I.I.; Zardari, N.H.; Ismail, Z.; Imran, H.M.D.; Mangrio, M.A. Groundwater quality and hydrogeological characteristics of Malacca state in Malaysia. J. Water Land Dev. 2015, 24, 11–19. [Google Scholar] [CrossRef]
  2. Langevin, C.D.; Zygnerski, M. Effect of sea-level rise on salt water intrusion near a coastal well field in Southeastern Florida. Groundwater 2013, 51, 781–803. [Google Scholar] [CrossRef]
  3. Shuai, P.; Knappett, P.S.K.; Hossain, S.; Hosain, A.; Rhodes, K.; Ahmed, K.M.; Cardenas, M.B. The impact of the degree of aquifer confinement and anisotropy on tidal pulse propagation. Groundwater 2017, 55, 519–531. [Google Scholar] [CrossRef] [PubMed]
  4. Xu, Z.; Hu, B.X.; Ye, M. Numerical modeling and sensitivity analysis of seawater intrusion in a dual-permeability coastal karst aquifer with conduit networks. Hydrol. Earth Syst. Sci. 2018, 22, 221–239. [Google Scholar] [CrossRef] [Green Version]
  5. Cruz-Ayala, M.B.; Megdal, S.B. An overview of managed aquifer recharge in Mexico and its legal framework. Water 2020, 12, 474. [Google Scholar] [CrossRef] [Green Version]
  6. SWCC Annual Report, 2014, General Directorate of Public and Industrial Relations. 2014. Available online: https://www.swcc.gov.sa/english/MediaCenter/SWCCPublications/Pages/default.aspx (accessed on 1 August 2020). [CrossRef]
  7. Missimer, T.M.; Ghaffour, N.; Dehwah, A.H.A.; Rachman, R.; Maliva, R.G.; Amy, G. Subsurface intakes for seawater reverse osmosis facilities: Capacity limitation, water quality improvement, and economics. Desalination 2013, 322, 37–51. [Google Scholar] [CrossRef]
  8. Bartak, R.; Grischek, T.; Ghodeif, K.; Ray, C. Beach sand filtration as pre-treatment for RO desalination. Int. J. Water Sci. 2012, 1. [Google Scholar] [CrossRef]
  9. Dehwah, A.H.A.; Missimer, T.M. Subsurface intake systems: Green choice for improving feed water quality at SWRO desalination plants, Jeddah, Saudi Arabia. Water Res. 2016, 88, 216–224. [Google Scholar] [CrossRef]
  10. Edzwald, J.K.; Haarhoff, J. Seawater pre-treatment for reverse osmosis: Chemistry, contaminants, and coagulation. Water Res. 2011, 45, 5428–5440. [Google Scholar] [CrossRef]
  11. Villacorte, L.O.; Tabatabai, S.A.A.; Anderson, D.M.; Amy, G.L.; Schippers, J.C.; Kennedy, M.D. Seawater reverse osmosis desalination and (harmful) algal blooms. Desalination 2015, 360, 61–80. [Google Scholar] [CrossRef]
  12. Al-Sarkal, T.; Arafat, H.A. Ultrafiltration versus sedimentation-based pre-treatment in Fujairah-1 RO plant: Environmental impact study. Desalination 2013, 317, 55–66. [Google Scholar] [CrossRef]
  13. Bar-Zeev, E.; Belkin, N.; Liberman, B.; Berman, T.; Berman-Frank, I. Rapid sand filtration pre-treatment for SWRO: Microbial maturation dynamics and filtration efficiency of organic matter. Desalination 2012, 286, 120–130. [Google Scholar] [CrossRef]
  14. Alagha, O.; Allazem, A.; Bukhari, A.A.; Anil, I.; Mu’azu, N.D. Suitability of SBR for wastewater treatment and reuse: Pilot-scale reactor operated in different anoxic conditions. Int. J. Environ. Res. Public Health 2020, 17, 1617. [Google Scholar] [CrossRef] [PubMed] [Green Version]
  15. Dehwah, A.H.A.; Al-Mashharawi, S.; Ng, K.C.; Missimer, T.M. Aquifer treatment of sea water to remove natural organic matter before desalination. Groundwater 2017, 55, 316–326. [Google Scholar] [CrossRef]
  16. Dehwah, A.H.A.; Al-Mashharawi, S.; Missimer, T.M. Mapping to assess feasibility of using subsurface intakes for SWRO, red sea coast of saudi arabia. Desalin. Water Treat. 2014, 52, 2351–2361. [Google Scholar] [CrossRef]
  17. Dehwah, A.H.A.; Missimer, T.M. Technical feasibility of using gallery intakes for seawater RO facilities, northern red sea coast of saudi arabia: The king abdullah economic city site. desalin. Water Treat. 2013, 51, 6472–6481. [Google Scholar] [CrossRef]
  18. Dehwah, A.H.A.; Li, S.; Al-Mashharawi, S.; Winters, H.; Missimer, T.M. Changes in feedwater organic matter concentrations based on intake type and pre-treatment processes at SWRO facilities, red sea, saudi arabia. Desalination 2015, 360, 19–27. [Google Scholar] [CrossRef]
  19. Dehwah, A.H.A.; Missimer, T.M. Seabed gallery intakes: Investigation of the water pre-treatment effectiveness of the active layer using a long-term column experiment. Water Res. 2017, 121, 95–108. [Google Scholar] [CrossRef] [Green Version]
  20. Shin, J.; Hwang, S. A borehole-based approach for seawater intrusion in heterogeneous coastal aquifers, eastern part of Jeju Island, Korea. Water 2020, 12, 609. [Google Scholar] [CrossRef] [Green Version]
  21. Lee, W.D.; Yoo, Y.J.; Jeong, Y.M.; Hur, D.S. Experimental and numerical analysis on hydraulic characteristics of coastal aquifers with seawall. Water 2019, 11, 2343. [Google Scholar] [CrossRef] [Green Version]
  22. Mohammad, M.E.; Al-Ansari, N.; Knutsson, S.; Laue, J. A computational fluid dynamics simulation model of sediment deposition in a storage reservoir subject to water withdrawal. Water 2020, 12, 959. [Google Scholar] [CrossRef] [Green Version]
  23. Sowe, M.A.; Sathish, S.; Greggio, N.; Mohamed, M.M. Optimized pumping strategy for reducing the spatial extent of saltwater intrusion along the coast of Wadi Ham, UAE. Water 2020, 12, 1503. [Google Scholar] [CrossRef]
  24. Vann, S.; Puttiwongrak, A.; Suteerasak, T.; Koedsin, W. Delineation of seawater intrusion using geo-electrical survey in a coastal aquifer of Kamala beach, Phuket, Thailand. Water 2020, 12, 506. [Google Scholar] [CrossRef] [Green Version]
  25. American Public Health Association; Water Environment Federation; American Water Works Association. Standard Methods for the Examination of Water and Wastewater; American Public Health Association: Washingt, DC, USA, 1998. [Google Scholar]
  26. GeoStudio. Seepage Modeling with SEEP/W. An Engineering Methodology; Calgary, AB, Canada, 2020. Available online: www.geo-slope.com (accessed on 1 August 2020).
  27. BS 5930. Code of Practice for Ground Investigations; British Standard Institute (BSI) Standard Publications; BSI Standards Limited: London, UK, 2015. [Google Scholar]
  28. Shahabi, M.P.; McHugh, A.; Ho, G. Environmental and economic assessment of beach well intake versus open intake for seawater reverse osmosis desalination. Desalination 2015, 357, 259–266. [Google Scholar] [CrossRef]
  29. Dagan, G.; Lessoff, S.C. Transmissivity upscaling in numerical aquifer models of steady well flow: Unconditional statistics. Water Resour. Res. 2007, 43, 1–12. [Google Scholar] [CrossRef]
  30. ASTM-D6913. Standard Test Methods for Particle-Size Distribution (Gradation) of Soils Using Sieve Analysis; American Society for Testing Materials: West Conshohocken, PA, USA, 2017; Volume 04.09. [Google Scholar]
  31. ASTM-D4959. Standard test method for determination of water (moisture) content of soil by direct heating. In American Society for Testing Materials, Annual Book of ASTM Standard; American Society for Testing Materials: West Conshohocken, PA, USA, 2016; Volume 04.08. [Google Scholar]
  32. ASTM-D854. Standard test methods for specific gravity of soil solids by water pycnometer. In Annual Book of ASTM Standard; ASTM International: West Conshohocken, PA, USA, 2014; Volume 04.08. [Google Scholar]
  33. ASTM-D7363. Standard Test Methods for Laboratory Determination of Density (Unit Weight) of Soil Specimens; American Society for Testing Materials: West Conshohocken, PA, USA, 2018; Volume 04.09. [Google Scholar]
  34. ASTM-D512. Standard Test Methods for Chloride Ion in Water; ASTM Standard; American Society for Testing Materials: West Conshohocken, PA, USA, 2012; Volume 11.01. [Google Scholar]
  35. ASTM-D516. Standard Test Methods for Sulfate Ion in Water; ASTM Standard; American Society for Testing Materials: West Conshohocken, PA, USA, 2016; Volume 11.01. [Google Scholar]
  36. ASTM-D1293. Standard Test Methods for pH of Water; ASTM Standard; American Society for Testing Materials: West Conshohocken, PA, USA, 2018; Volume 11.01. [Google Scholar]
  37. AASHTO-T26. Standard Method of Test for Quality of Water to be Used in Concrete; American Association of State Highway and Transportation Officials, Inc. (AASHTO): Washington, DC, USA, 1979. [Google Scholar]
Figure 1. Beach well drilling site #1 within the Jubail Saline Water Conversion Corporation (SWCC) facility, and beach well drilling site #2 within the Al-Khobar SWCC facility in the Kingdom of Saudi Arabia (KSA).
Water 12 02420 g001
Figure 2. Beach well construction details.
Water 12 02420 g002
Figure 3. Schematic diagram of the beach well and the observation wells.
Water 12 02420 g003
Figure 4. Penetration details of the pumps installed in the beach wells.
Water 12 02420 g004
Figure 5. Average discharge from the beach wells vs. time curve for the Al-Khobar and Jubail sites.
Water 12 02420 g005
Figure 6. Discharge from the beach wells vs. time for the Al-Khobar and Jubail sites.
Water 12 02420 g006
Figure 7. Soil profiles for the Al-Khobar and Jubail sites.
Water 12 02420 g007
Figure 8. Sieve test and grain number for the Al-Khobar site.
Water 12 02420 g008
Figure 9. Sieve test and grain number for the Jubail site.
Water 12 02420 g009
Figure 10. Numerical model: Mesh and boundary conditions for the (a) Al-Khobar and (b) Jubail sites.
Water 12 02420 g010aWater 12 02420 g010b
Figure 11. Contour lines for the drawdown curves for the (a) Al-Khobar and (b) Jubail sites (based on the observation well results).
Water 12 02420 g011
Figure 12. Measured versus computed drawdown curves at the Al-Khobar and Jubail sites.
Water 12 02420 g012
Figure 13. Contour lines for the drawdown curves for the (a) Al-Khobar and (b) Jubail sites (based on water flux leading the drawdown curve to reach 12 m).
Water 12 02420 g013aWater 12 02420 g013b
Figure 14. The drawdown curves resulted from water flux applied to the (a) Al-Khobar and (b) Jubail sites.
Water 12 02420 g014
Table 1. Results obtained from the observation wells.
ParameterJubailAl-Khobar
s1, m0.300.85
s2, m0.130.07
r1, m5.05.0
r2, m10.010.0
ho, m47.5047.30
h1, m47.2046.45
h2, m47.3746.60
Rate of pumping flow, Q, m3/s (m3/h)0.0189 (67.92)0.00703 (25.3)
Permeability, k, m/s2.5 × 10−41.1 × 10⁻⁴
Coefficient of Transmissivity, T, m2/s0.01190.0052
Table 2. Sieve test and grain number (Al-Khobar).
Depth (m)ClassificationCcCuD100D60D30D10Gravel (%)Sand (%)Silt (%)Clay (%)
2Poorly graded sand with silt (SP-SM)1.043.64.750.290.150.08091.98.18.1
8Poorly graded sand (SP)1.1859.51.210.590.241.394.14.64.6
16Poorly graded sand with silt (SP-SM)1.24.24.750.390.210.09093.26.86.8
21Poorly graded sand with silt (SP-SM)7.75329.51.740.860.688.810.610.6
27Silty sand (SM)9.51.280.440.684.814.614.6
33Poorly graded sand with silt (SP-SM)24.94.751.10.4088.111.911.9
39Poorly graded sand with silt (SP-SM)1.644.620.580.350.13092.17.97.9
42Poorly graded sand with silt (SP-SM)2.095.84.750.550.330.109199
46Silty sand (SM)9.52.110.2911.564.623.923.9
49Silty sand (SM)9.50.47.459.732.932.9
Table 3. Sieve test and grain number (Jubail).
Depth (m)ClassificationCcCuD100D60D30D10Gravel (%)Sand (%)Silt (%)Clay (%)
2Poorly graded sand with silt (SP-SM)1.033.84.750.30.180.08091.58.58.5
7Well graded sand with silt (SW-SM)1.446.39.51.210.580.191.392.26.56.5
17Poorly graded sand with silt (SP-SM)1.214.34.750.380.20.09092.87.27.2
20Poorly graded sand with silt (SP-SM)8.1638.69.51.720.791.287.910.910.9
26Silty sand (SM)9.51.240.350.880.119.119.1
31Silty sand (SM)4.751.10.6087.512.512.5
40Poorly graded sand with silt (SP-SM)1.744.820.580.350.12092.27.87.8
42Well graded sand with silt (SW-SM)2.848.14.750.560.33089.710.310.3
46Silty sand (SM)9.52.210.3411.866.321.921.9
50Silty sand (SM)9.50.470.088.462.129.529.5
Table 4. Summary of soil sample test results from the Al-Khobar and Jubail sites.
Borehole No.Sample Depth (m)Fines Content USCS GroupDUW (kN/m3)MC (%)Sp. Gr.
BH-01-KH2.08SP-SM1820.22.691
BH-01-KH8.05SP1618.02.697
BH-01-KH16.07SP-SM1819.22.694
BH-01-KH21.011SP-SM1429.42.703
BH-01-KH27.015SM1524.72.700
BH-01-KH33.012SP-SM1527.92.686
BH-01-KH39.08SP-SM1722.42.692
BH-01-KH42.09SP-SM1819.32.703
BH-01-KH46.024SM1437.82.699
BH-01-KH49.033SM1346.72.705
BH-02-JB2.09SP-SM1819.02.708
BH-02-JB7.07SW-SM1617.52.682
BH-02-JB17.07SP-SM1818.12.691
BH-02-JB20.011SP-SM1527.3
BH-02-JB26.019SM1524.6
BH-02-JB31.013SM1620.02.694
BH-02-JB40.08SP-SM197.12.705
BH-02-JB42.010SW-SM1535.3
BH-02-JB46.022SM1613.8
BH-02-JB50.030SM1618.5
Note: KH = Al-Khobar, JB = Jubail, USCS = Unified Soil Classification System; Sp. Gr. = Specific gravity; DUW = Dry unit weight; MC = Moisture Content.
Table 5. Descriptive statistics of water quality parameters for intake gulf water.
UnitMinimumMaximumMeanStd. DeviationSkewness
Temperature(°C)15.0036.0025.416.610.08
Salinity(‰)40.4042.7041.370.610.75
Conductivity(µS/cm)61,20063,40062,120.17776.3480.67
TDS(mg/L)42,80047,15045,214.51302.167−0.34
Turbidity(NTU)0.209.202.332.921.69
TSS(mg/L)7.0046.7020.4710.161.36
SDI (before)(--)12.033.022.510.5−0.95
SDI (After)(--)5.106.505.930.46−0.70
pH(--)8.108.208.170.05−1.33
Total Alkalinity(mg/L)125.00132.00126.781.902.08
Total Hardness(mg/L)664886487908.58534.335−1.43
TOC(mg/L)1.802.902.290.320.51
BOD5(mg/L)0.201.400.790.370.05
Chlorophyll(µg/L)0.504.803.061.60−0.65
Table 6. Concentration of major elements and ions for intake gulf water.
ParameterUnitRange Concentration (This Study)Mean Concentration (This Study)Range Concentration (Seawater)
Chloridemg/L23,500–25,00024,10118,980–19,110
Sodiummg/L12,150–14,69013,02010,556–10,787
Calciummg/L434–536487400–412
Magnesiummg/L1436–177615011262–1267
Potassiummg/L388–543441380–398
Sulfatemg/L3216–346733092649–2700
Nitrateµg/L5.1–7.06.690.06–30
Phosphateµg/L1.05–5.502.870.00–300
Fluorideµg/L0.10–1.000.321.0–1.3
Table 7. Model Parameters.
ParametersAl-KhobarJubail
Soil Properties
Saturated X-Conductivity (m/s)0.0004430.000992
Saturated Volumetric Water Content0.40.4
Soil Compressibility mv (/kPa)0.00650.178
Boundary Conditions
Water Total Head (m)41.1522.6
Water Flux (m3/s/m2)−0.00057−0.0093

