Article

On the Origin of Deep Soil Water Infiltration in the Arid Sandy Region of China

1
School of Soil and Water Conservation, Beijing Forestry University, Beijing 100083, China
2
Institute of Desertification Control, Chinese Academy of Forestry, Beijing 100093, China
3
Inner Mongolia Low Vegetation Coverage Sand Control Technology Development Co., Ltd., Hohho 010000, China
4
Department of Geology and Geophysics, Texas A&M University, College Station, TX 77843-3115, USA
*
Authors to whom correspondence should be addressed.
Water 2020, 12(9), 2409; https://doi.org/10.3390/w12092409
Submission received: 27 July 2020 / Revised: 20 August 2020 / Accepted: 24 August 2020 / Published: 27 August 2020

Abstract

:
Soil water moisture is one of the most important influencing factors in the fragile ecosystems in arid sandy regions, and it serves as a bridge connecting the rainfall and groundwater, two important water sources in arid sandy regions. The hydrological process of an arid sandy region occurs sporadically and is highly non-uniform temporally, making it difficult to monitor and predict. The deep soil recharge (DSR) at a sufficiently deep soil layer (usually greater than 200 cm below ground surface) is an important indicator for groundwater recharge in the arid sandy region, and thus the quantitative determination of DSR is of great significance to the evaluation of water resources and the study of water balance in the arid sandy region. Due to the large amount of evaporation, small amount of precipitation, and the long term of the frozen-soil period in the winter and spring, the monitoring of infiltration and determination of DSR in the arid sandy region become challenging. This study selects the Ulanbuh desert plots in northern China to monitor DSR, precipitation and seasonal frozen soil thickness change, and reaches the following conclusions: Even though the annual precipitation is only 48.2 mm in the arid sandy region, DSR will still occur and replenish groundwater. The daily threshold of precipitation for generating measurable DSR is lower than 4 mm, where the DSR value is defined as the downward flux over a unit area per day hereinafter. DSR continues during the frozen period of the winter and spring seasons, and it is generated from water vapor transport and condensation in the deep sandy layer. Summer rainstorms do no show an obvious correlation with DSR, which is unexpected. This study reveals the characteristics of the dynamic water resources movement and transformation in the arid sandy area in Ulanbuh Desert and can serve as an important guideline for the quantitative assessment of water resources in arid sandy regions.

1. Introduction

The United Nations Environment Program defines regions with a drought index below 0.65 as arid areas, which account for 40% of the global land area. The arid zone is not a restricted zone of life [1]. The net primary productivity of the arid zone is close to 40% of the world total [2,3]. It provides human beings with food, energy and forest products, and has an important regulatory effect on global change and ecosystems’ evolution [4,5]. Among the world’s total arid region, 10–20% belongs to arid sandy regions, which are affected by desertification considerably [6,7]. Therefore, research on the ecohydrological process in arid sandy regions becomes increasingly important. On a global scale, the overall vegetation in the arid regions tends to degenerate [8,9]. In recent years, some studies have also shown that some arid regions have become revegetated [10,11]. In general, the spatial and temporal changes of the vegetation in the arid regions and their driving mechanisms have not been well recognized.
In arid sandy regions, due to the relatively dry shallow soil layers and the fragile ecological environment, the terrestrial surface water process significantly impacts the ecological environment, soil characteristics and human activities [12,13]. Therefore, study of the soil water dynamic and its relationship with the overlying surface process (such as precipitation and runoff) and the underlying groundwater flow is an important scientific issue that is related to regional development.
In arid sandy regions, due to the small amount of precipitation and large amount of evaporation, the residence time of terrestrial surface water is short, and the terrestrial surface water process has become the main limiting factor of ecosystem development in this area [14]. Any subtle changes of the terrestrial surface water process may cause drastic changes in the arid sandy region. A single precipitation process in an arid sandy region can cause significant fluctuations in surface energy transport and plant physiological characteristics [15,16]. The precipitation amount in the arid sandy region was relatively small, and the evaporable water resources were limited, and, for these reasons, water vapor plays a significant role in regulating the ecohydrological process in arid sandy regions [16,17]. The water vapor could be absorbed by the plant leaves to replenish the vegetation water. Dew accumulation in some areas exceeds precipitation amount [16]. Due to the relatively permeable nature of sandy soil, the transport mechanism of soil moisture was different from other soil types [18]. Groundwater in an arid sandy region can also be evaporated to replenish shallow soil water through evaporation [19]. Arid sandy regions were generally accompanied by a desert oasis, and the shallow moisture and vapor transport process behaved quite differently in the two landforms (bare sandy soil and oasis) [20]. Due to the lack of long-term observation of the replenishment of DSR in arid sandy regions, there were considerable disagreements on issues such as 1) what is the original source of water in an arid sandy region? And 2) how much water is there? In particular, what are the original sources of lakes and groundwater in arid sandy regions and what are their transport pathways? At the same time, due to the dry soil and scarce vegetation, the terrestrial surface water process in the dry sandy region has very limited capability to regulate the temperature change of the climate system, making the climate system in the region more sensitive to global warming. Compared with other humid areas, ecosystems in arid sandy regions are more vulnerable to global warming.
Since the beginning of the 20th century, a large number of scientists have begun to study the surface water process of the dry land and have conducted continuous monitoring works on the natural precipitation, evaporation, capillary suction, and deep soil recharge (DSR), and have obtained certain understandings about arid land water cycle [21,22,23,24]. For instance, it is found that condensation water in an arid sandy region has an important ecological significance, even exceeding the supply of precipitation [17,25,26]. Vegetation distribution is scarce in arid sandy regions, but the range of vegetation root activity will generate a soil moisture enrichment layer [27,28], which is extremely important to the arid land ecosystem [29]. However, as far as the current research progress is concerned, observational study and theoretical analysis of terrestrial surface ecosystems are obviously inadequate, and the understanding of the water cycle process in arid sandy regions is still very limited. There are still lots of doubts, including the arid sand replenishment effect and replenishment intensity of precipitation in deep soil water in the arid sandy land [30,31]. Soil water is the link between surface precipitation and groundwater, and plays an important role in the formation, transformation and consumption of the arid land water resources. Studying the changes and sources of soil moisture in an arid sandy region is of great research value for understanding the characteristics of arid sandy land, maintaining regional water balance, fixing mobile sandy lands, thereby controlling desertification, and curbing natural disasters such as sandstorms.
The objective of this study is to explore the redistribution process of precipitation moisture in shallow soil in an arid sandy region, because the fragile ecosystems in arid sandy regions are extremely sensitive to water deficits. There are a number of questions that we are trying to look for answers to in this study. First, does the deep soil layer receive any detectable DSR during the five-month freeze–thaw period of the shallow soil layer in the arid sandy region of this study? Second, what is the ratio of annual DSR to the annual precipitation? Third, how important is the precipitation in the rainy season and how much does it contribute to the overall annual DSR?

2. Seasonal Characteristics of Shallow Soil in an Arid Sandy Region

The soil moisture in an arid sandy region determines the occurrence and reversal of desertification and is the main environmental regulator of desertification [32]. The water stored in sandy soil layer is the link between atmospheric water, surface water and groundwater, and plays an important role in the formation, conversion and consumption of water resources cycle [33,34]. Precipitation infiltration is the main water source of replenishment of soil moisture in sandy regions [35]. Deep soil moisture can be stored in the soil without evaporation and can recharge groundwater [36]. Moreover, deep soil moisture can alleviate the demand for water resources of sand-fixing vegetation in several dry season, reduce water deficit, and maintain the minimum demand for vegetation in the arid sandy regions [37,38]. At present, there are few studies on the soil moisture dynamics and monitoring precipitation infiltration process in arid sandy regions; however, the deep layer infiltration process in arid sandy regions is often overlooked. In particular, there is very few studies on the long-term monitoring of deep soil moisture infiltration in arid sandy regions.
In the middle and high latitudes regions, winter cold weather conditions can form a certain depth of seasonal frozen soil. The seasonal frozen soil can affect the infiltration process of precipitation and snowmelt. When the frozen soil moisture content is relatively low, a great deal of pores have not been filled by the frozen soil moisture and thus can retain a relatively high permeability for infiltration to occur. When the frozen soil moisture content is relatively high, a great deal of pores have been occupied by the frozen soil moistures; thus, the frozen soil may become much less permeable or even completely impermeable to infiltration, resulting in surface runoff, which is usually not seen during the non-frozen period in arid sandy regions. Although a large number of experimental and modelling studies have shown that the seasonal frozen soil has a significant effect on infiltration, these studies largely rely on the use of an estimated infiltration rate, which can significantly affect the distribution of soil moisture during the frozen process [39]. Up to present, there are almost no studies concerning the energy balance and soil moisture redistribution at the lower boundary of the frozen soil. If a certain thickness of seasonal frozen soil has formed, snowfall becomes the main factor for moisture input at the upper interface (and evaporation is the main factor of soil moisture output at the upper interface), and DSR becomes the only exit for soil moisture output at the lower boundary.
Snowfall accumulates on the upper boundary of the frozen shallow soil. If the solar radiation is strong enough, the snowmelt will infiltrate into the frozen soil layer, and continue to fill the soil voids and increase the moisture content of the seasonal frozen soil. Because of the temperature difference between the deep soil and the frozen soil layer, energy exchange will occur at the lower boundary of the frozen soil layer, causing the frozen soil layer to melt. The melted water becomes DSR to recharge the underneath groundwater. To verify this hypothesis, this study measures the depth change of the lower boundary of the frozen soil layer and the change of DSR in an arid sandy region that experiences the seasonal freeze–thaw process.

3. Material and Methods

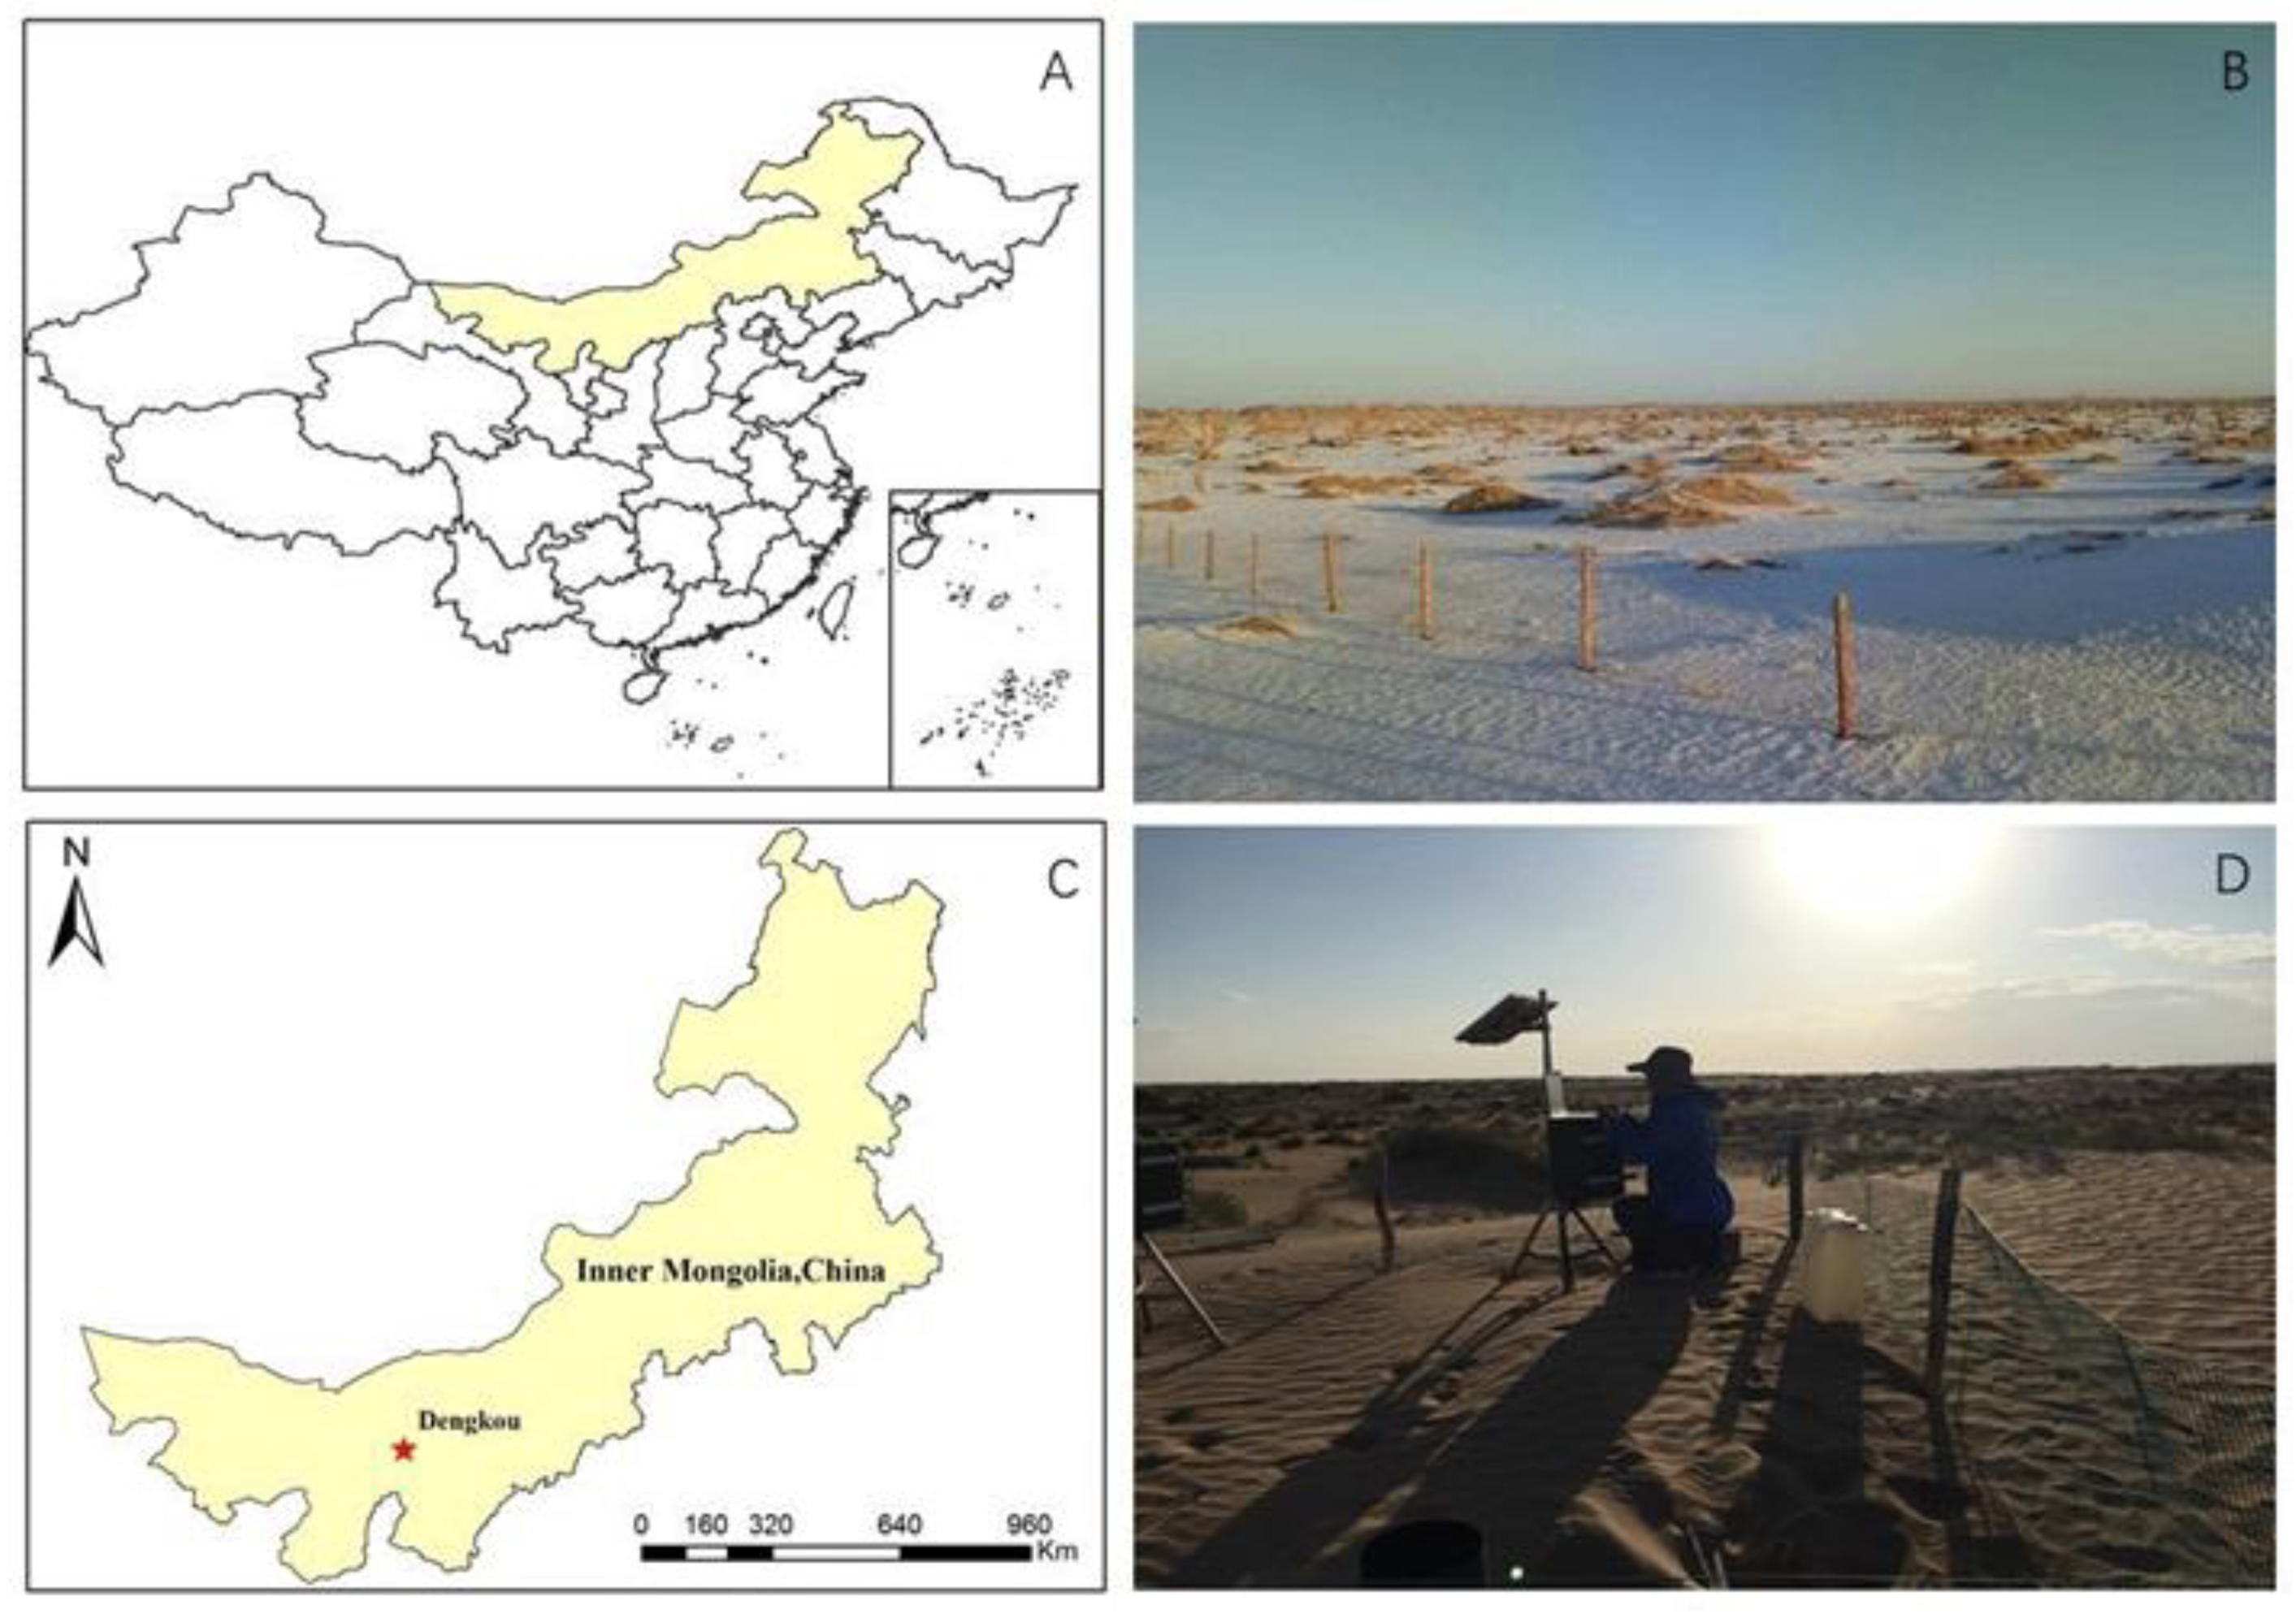
3.1. Overview of the Experimental Plot

The experiments were carried out in Ulanbuh Desert, Inner Mongolia, China (40°26′41.2″ N 106°44′25.9″ E), as shown in Figure 1. The average altitude of Ulanbuh desert is 1046 m above mean sea level (a.m.s.l.). The landform is a chain-like sandy dune. The height of the dune is generally 1–3 m, and the terrain is relatively flat. The climate type is a temperate desert climate with both continental and seasonal precipitation characteristics. The annual precipitation is concentrated from June to September, and there is significant snowfall in the winter. Multi-year observation records show that the maximum temperature is 39 °C and the minimum temperature is minus 29.6 °C. The annual average temperature is 7.6 °C, and the highest temperature usually occurs in July. The average temperature in July is 23.8 °C. The average temperature in January is minus 10.8 °C. The annual sunshine hours are 3000 h. The annual average wind speed is 3.7 m/s and the maximum wind speed is 15 m/s. The southwest wind is dominant in the region. The annual average precipitation is 102.9 mm, and there is snow accumulation in the winter and the annual average potential evaporation is 2551.9 mm. The depth of groundwater is 6–8 m [40]. The heterogeneity of sand in the soil layer below 20 cm of the test site is small and porosity of the soil layer within 200 cm is quite high, in the range of 44.09–45.63%, the saturated hydraulic conductivity of the in-site sandy layer is 12.85 cm/h [41].

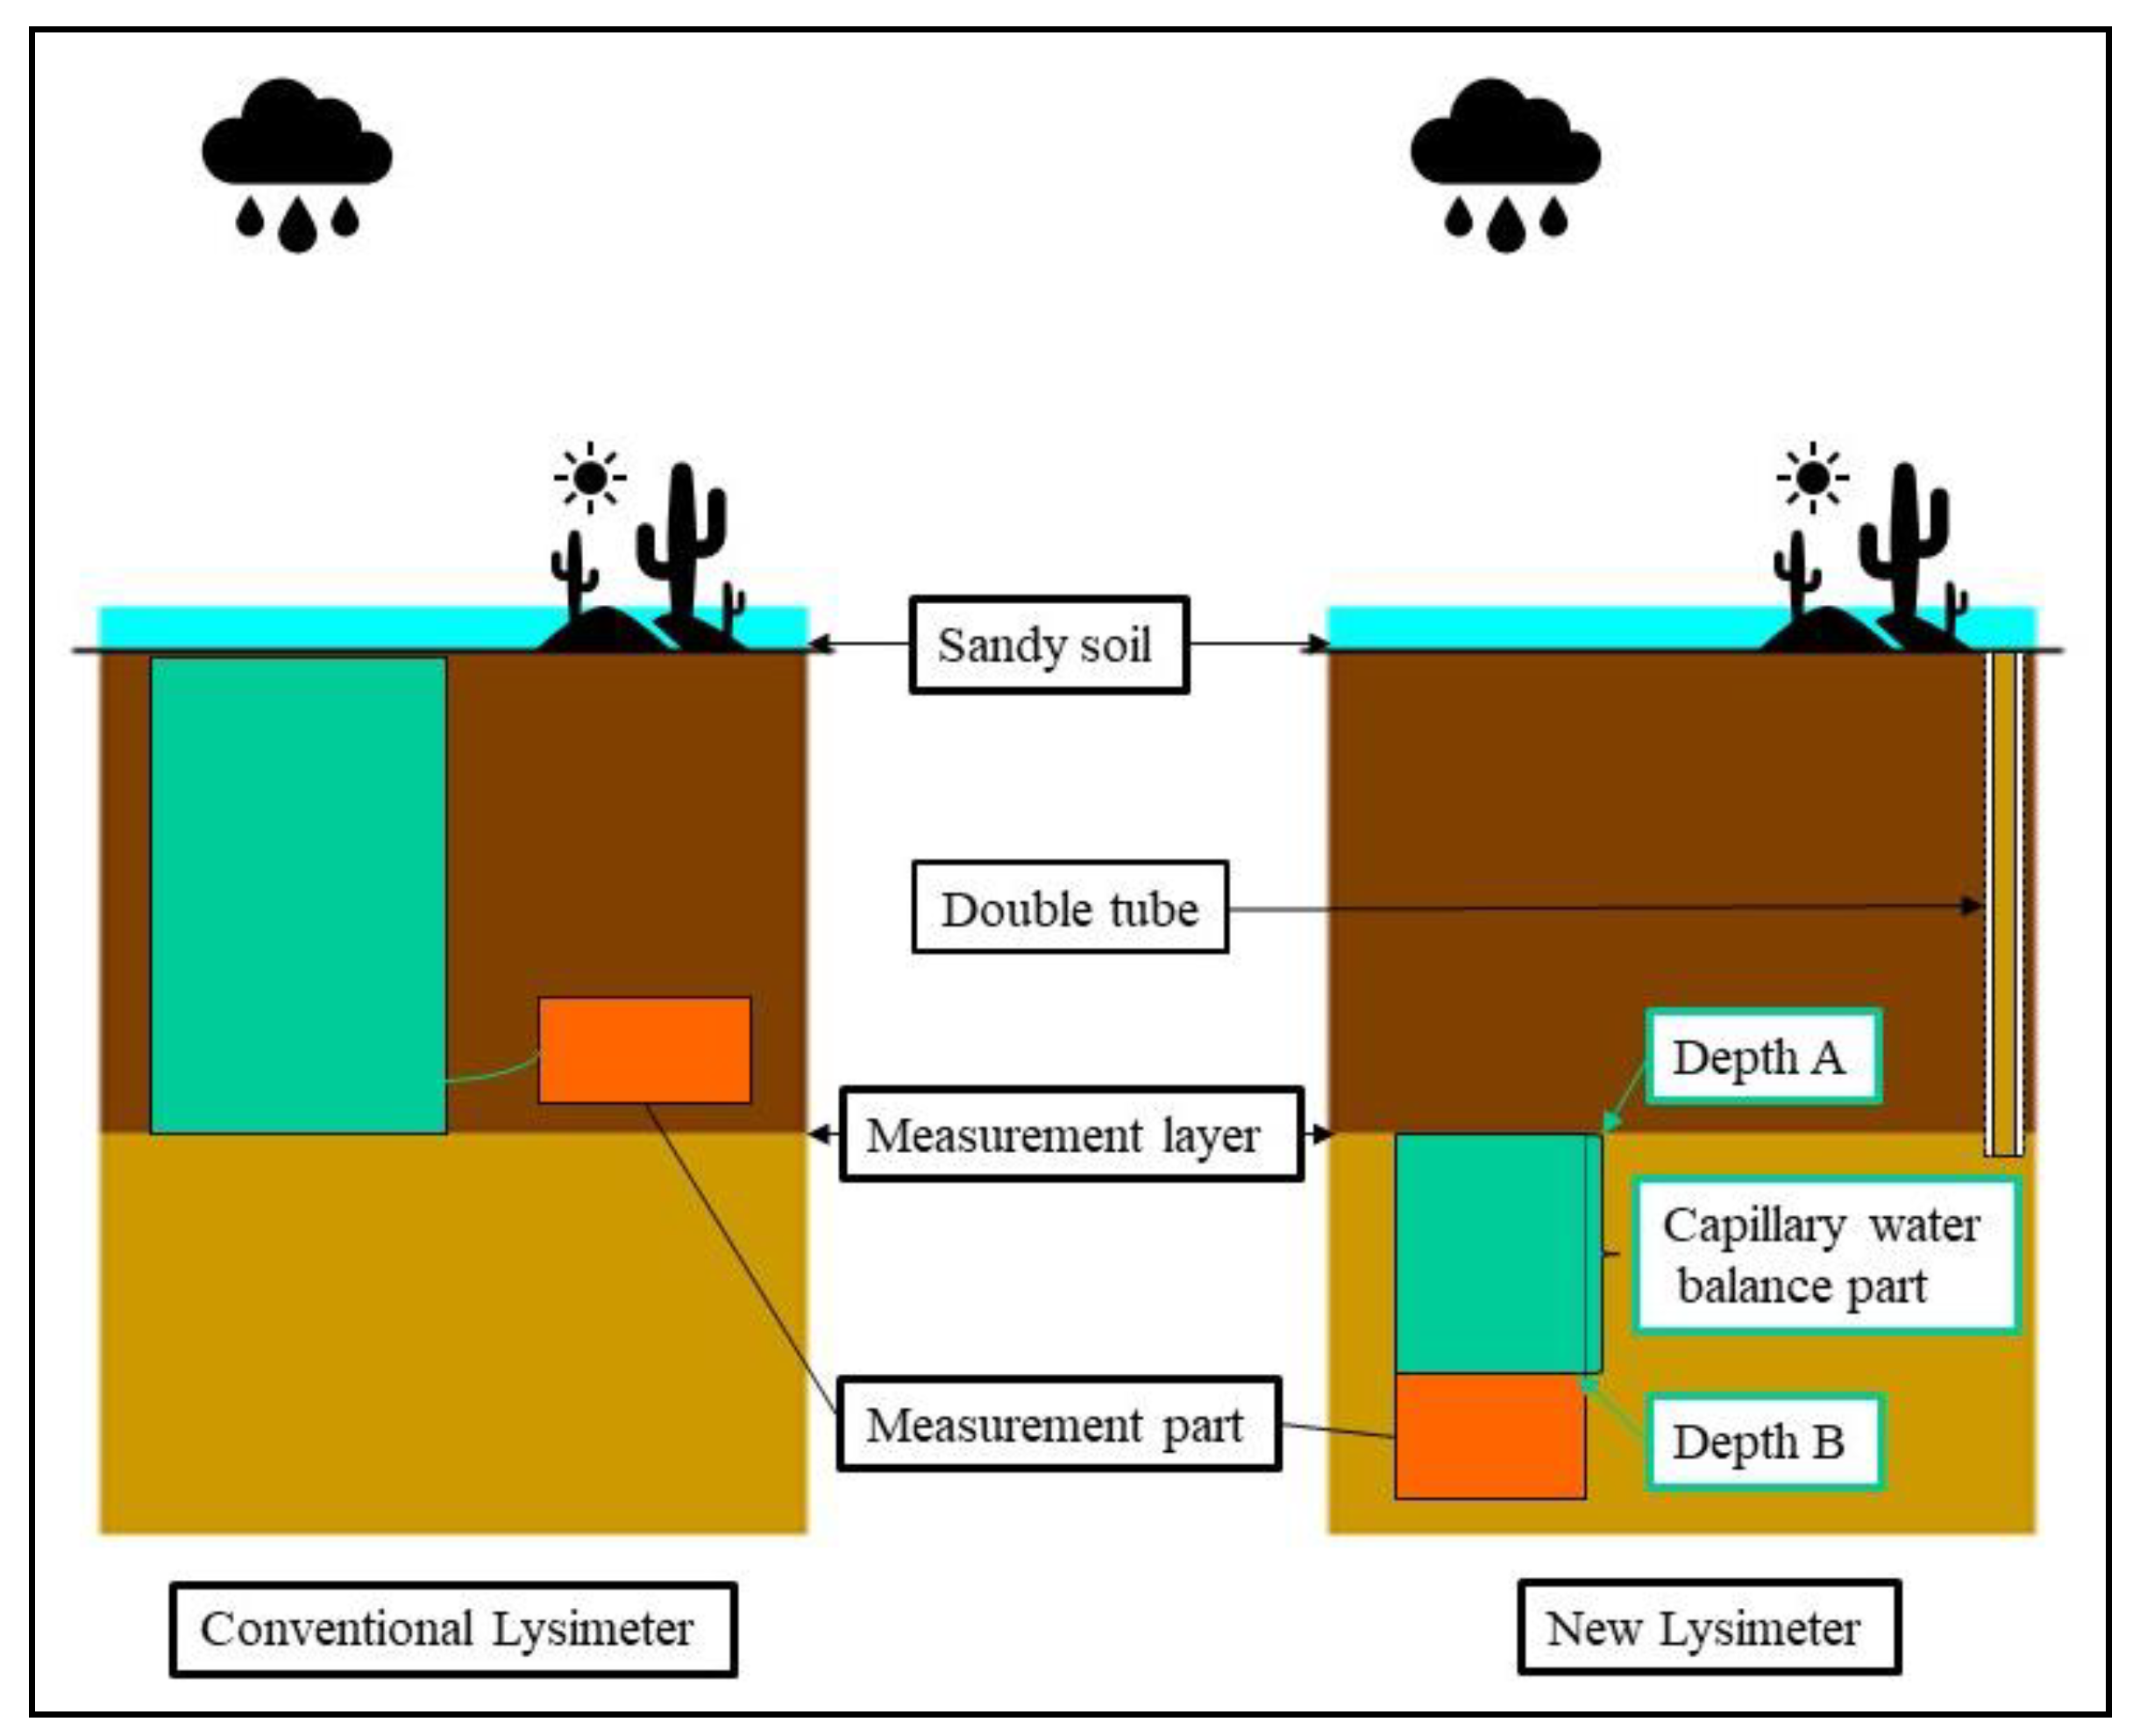
3.2. Experiment Design

3.2.1. Observation of Annual Evapotranspiration

Evaporation is an integral part of the surface water balance, and it is also one of the most directly affected by land use and climate change in the hydrological cycle. At the same time, evaporation is also a critical component in energy balance. Therefore, studying the change of evaporation is indispensable to understand the changes of climate and hydrological cycle characteristics in the region. In this study, measuring the daily evaporation can be used to compare the amount of precipitation and evaporation during this period. The average annual temperature of the experimental site reached minus zero for up to 150 days, which can profoundly affect the evaporation during this period. An American Class A evaporating pan is used to measure the amount of potential evaporation. The daily measurement range is 0–250 mm, and the measurement accuracy is 0.2 mm. The actual evaporation is often smaller than the measured potential evaporation with an empirical reduction coefficient. The results of the Class A evaporating pan experiments by researchers in China and Australia show that the empirical reduction coefficient is 0.68–0.76 for the arid sandy region of this study [42].

3.2.2. Observation on Annual Precipitation and DSR

Precipitation is an important source of water resources in the study site, a precipitation sensor (rain gauge, AV-3665R, AVALON, United States; precision: 0.2 mm) was placed above ground at the site to monitor annual precipitation. The experimental plot is an arid sandy region with large evaporation. The soil type in the experimental area is sandy soil, the infiltration rate is fast, and the shallow dry sand layer can suppress the evaporation. The study shows that, when the thickness of the shallow dry sand layer reaches more than 5 cm, the shallow dry sand layer becomes the most important factor controlling the evaporation [43,44]. As the thickness of the shallow dry sand layer increases, the amount of soil evaporation gradually decreases. For example, a shallow dry sand layer with 5 cm thickness can suppress the evaporation up to 70.6%, and a shallow dry sand layer with 30 cm thickness can suppress the evaporation up to 92.38%. There is clearly identifiable linear relationship between the thickness of the shallow dry sand layer and the amount of evaporation. This indicates that once precipitation moisture enters the deep soil layer, water resources can be stored in the deep soil layer and become part of ecological water resource, because of the suppression of evaporation at the shallow dry soil layer.
Because of the relatively low precipitation and the sporadic and highly variable precipitation strength in the region, the traditional method of using a correlation coefficient to estimate the annual DSR based on the annual precipitation can cause huge errors [11]. In this study, a newly designed lysimeter is used to directly measure DSR at a depth of 200 cm (or Depth A in Figure 2 is 200 cm). The choice of 200 cm here is to ensure that any downward infiltration that can pass Depth A will continue to move downward to recharge the deep groundwater [12]. The newly designed lysimeter has a small size, easy to install, and can measure DSR automatically with high accuracy [36,37]. As shown in Figure 2, the conventional lysimeter uses an impermeable container (constructed all the way from ground surface downward) to wrap the soil column, blocking the horizontal flow of the soil layer; thus, there is inevitable water potential difference existing inside and outside the container of the Lysimeter. The advantage of this newly designed instrument is that it can be directly installed at a depth of 2 m, and there is no need to wrap a soil column like a conventional Lysimeter to block the horizontal flow of soil. Because the layered structure of the native soil is destroyed when filling the soil into the lysimeter, and fissures are easily generated between the filling soil and the wall of lysimeter, precipitated water can easily flow downward along those fissures, resulting in an overestimation of soil infiltration and DSR. The newly designed lysimeter has a water balance part (from Depth A to Depth B in Figure 2), which uses a cylindrical impermeable side wall to wrap the original soil column and a measurement part (below Depth B).
There are several formulas for calculating the water holding height of capillaries (or capillary rise) in sandy soil. This study used the following formula to calculate the water holding height of capillaries based on the soil particle size [45]:
H C = σ n 2 μ ρ g K cos α + ( 1 n ) h a
where Hc is capillary water rise, σ is the surface tension of water, α is the advancing contact angle, ρ is the density of water, g is the gravity constant, K is the saturated hydraulic conductivity, ha is air entry head, and n is the porosity of soil. The capillary rises computed for the experimental plot vary from 28.4 to 44.6 cm. Based on this, the length of the balance part (the distance from Depth A to Depth B) used in this study is set to be 50 cm, which is slightly larger than the maximum capillary rise at the study site. The advantage of this new design of lysimeter has been explained in details in Cheng et al. (2017, 2018). The measurement part uses a gauge with an accuracy of 0.2 mm to measure DSR. The groundwater water in the study site is sufficiently deep and will not affect the measurement of DSR. After installing the lysimeter and backfilling the excavated site all the way to ground surface using the in situ soil, one usually has to wait for one year to ensure that soil settlement has approximately reached its pre-installation status.

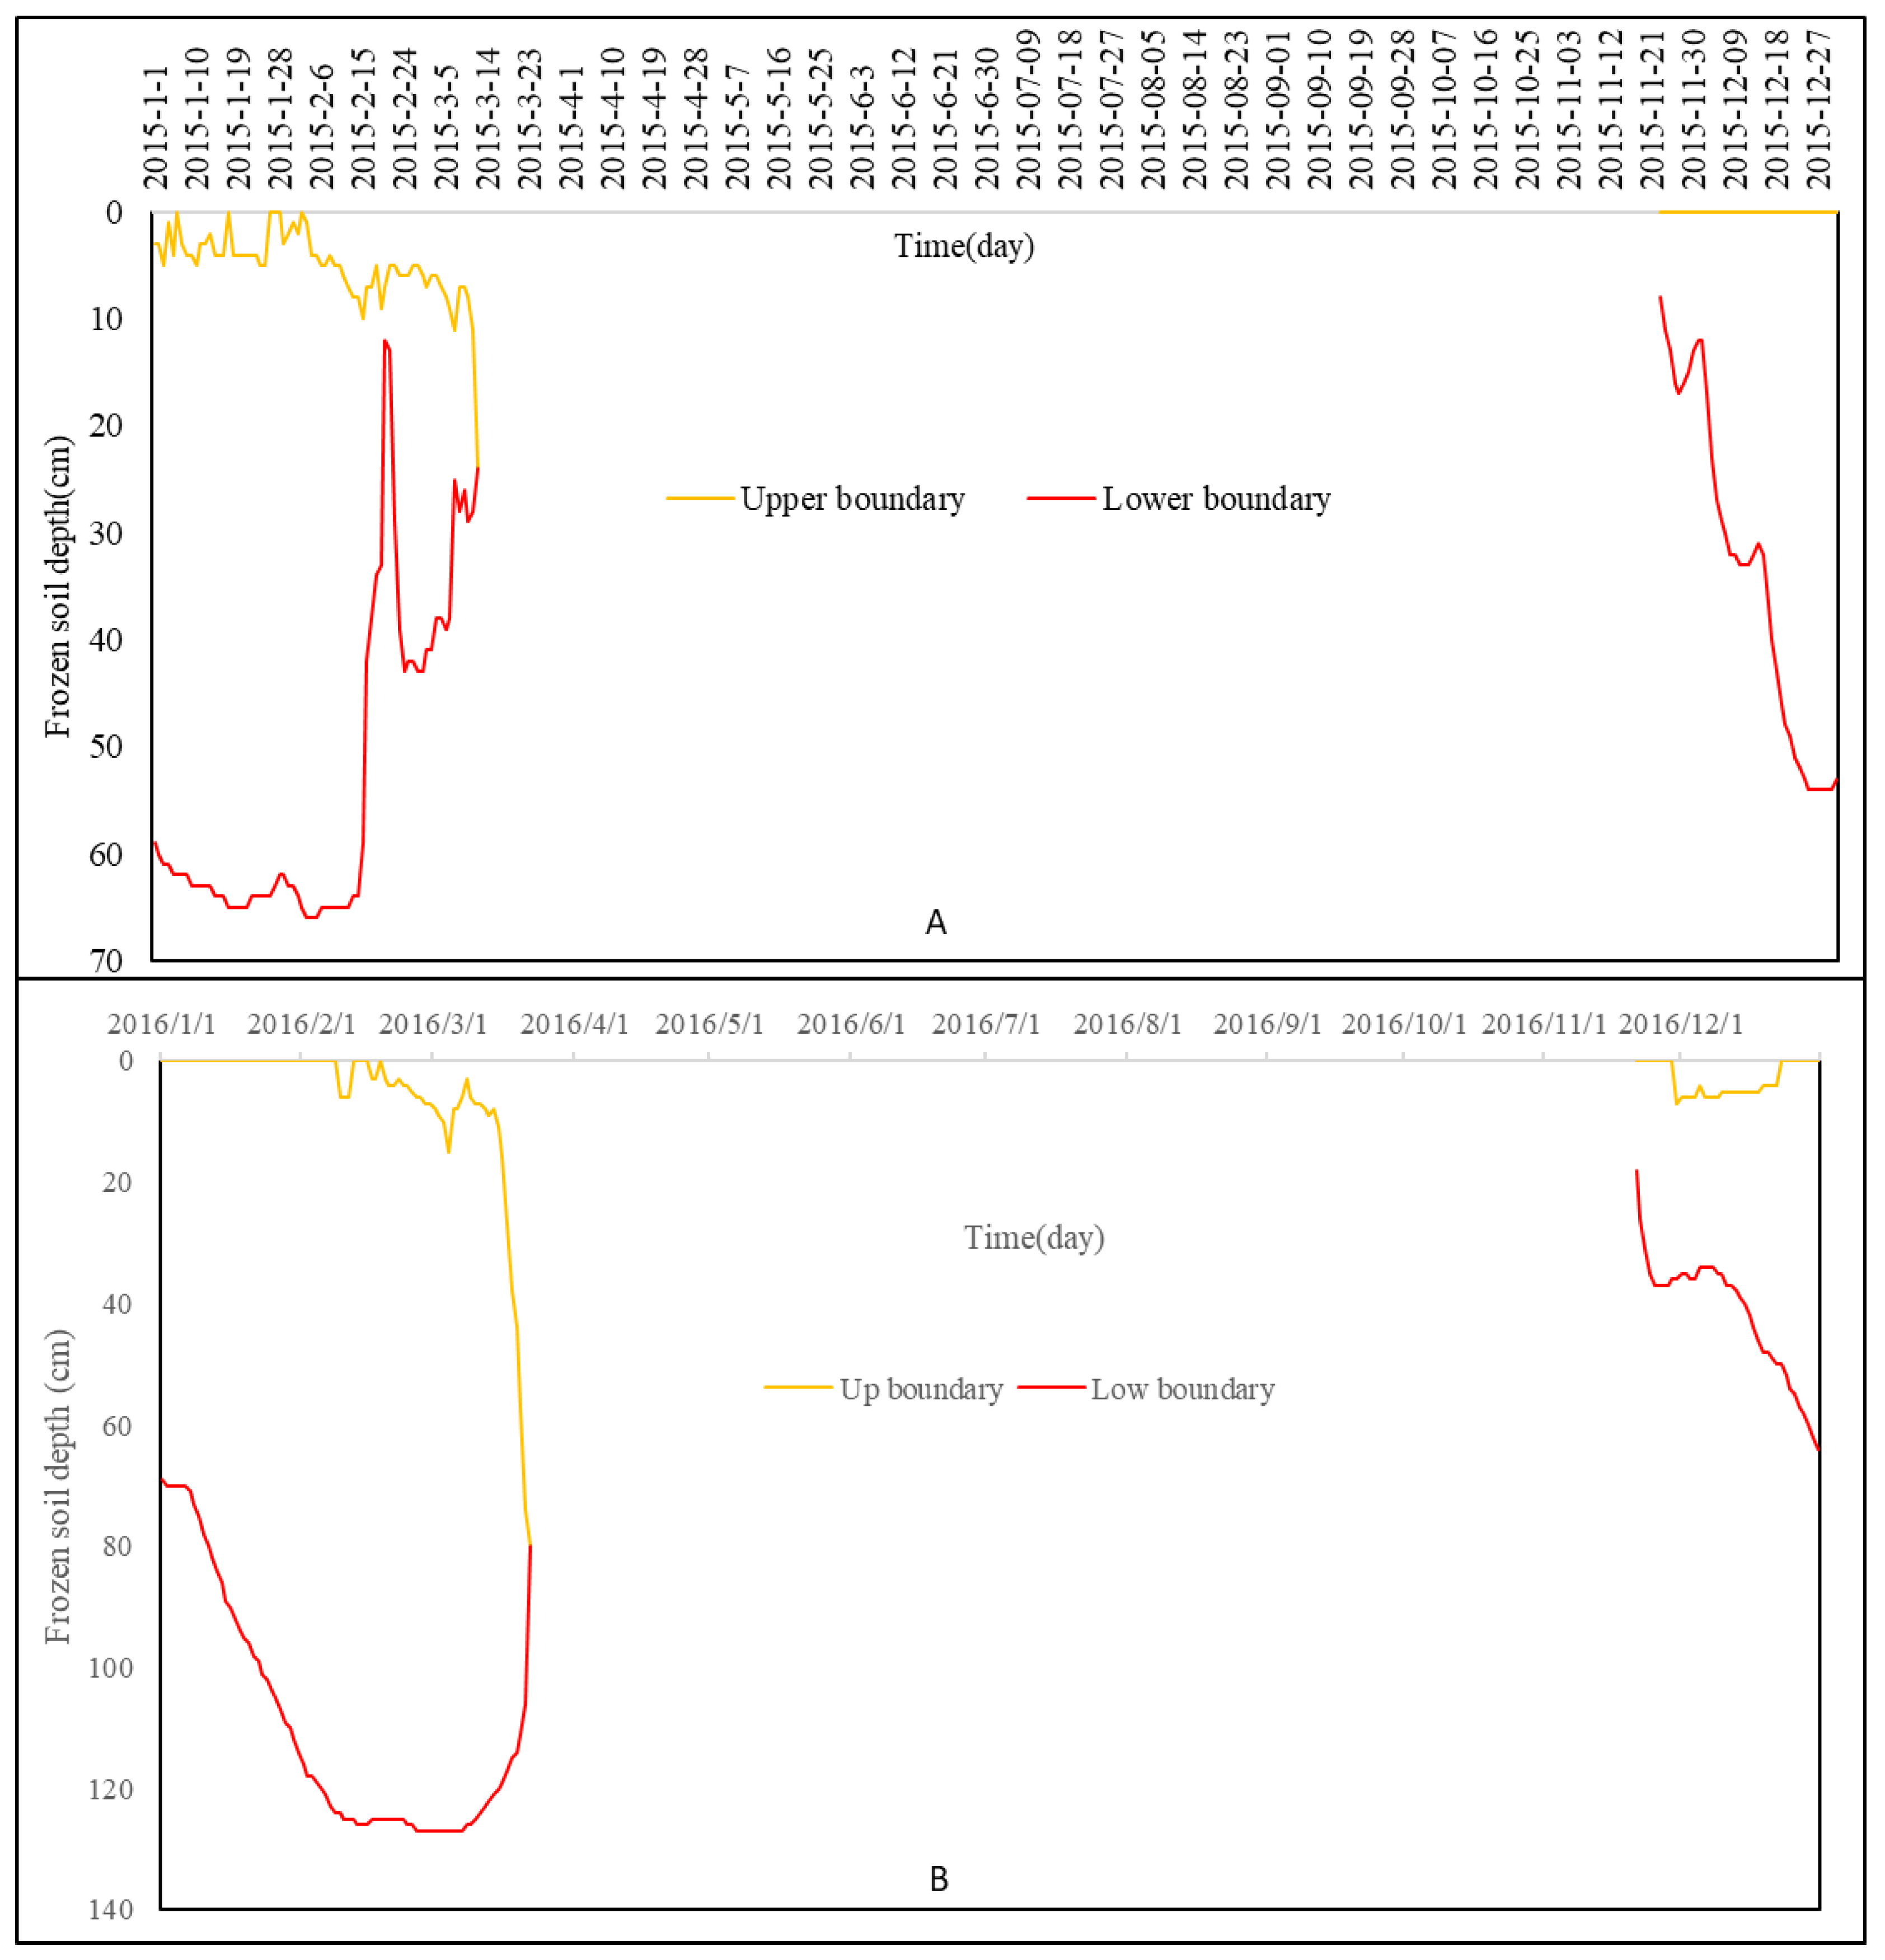
3.2.3. Observation on Frozen Soil Thickness Change

The surface soil is usually frozen during winter and spring seasons at the study site, making it difficult to monitor the soil moisture change and DSR. To overcome this difficulty, we have designed a double-tube apparatus to measure the depth of the freeze–thaw layer. The double-tube apparatus consists of a hollow barrel (diameter: 20 mm) with a vent hole and a rubber tube (diameter: 18 mm) inside the barrel. First, the hollow barrel with the vent hole is buried vertically in the experimental plot. The upper level of the barrel is at the ground surface and the length of the barrel is 200 cm. The rubber tube filled with water is placed in the cylinder, and it will be extracted at 8 P.M. every day to record the frozen depth, which can be used to interpret the thickness of the frozen soil at that moment at the study site. The freeze–thaw period in the study is relatively long, lasting about 150 days per year, and there is significant snowfall in the winter, and the snowmelt could be an important water resource replenishing the shallow soil moisture. The frozen soil serves as an impermeable layer, which essentially isolates the hydraulic connection above and below this layer. In another word, the DSR measurements recorded during the winter and spring seasons (when the frozen soil layer exists) should reflect the information of soil moisture variation caused by the freezing–thawing process below the frozen soil layer.

4. Results and Analysis

4.1. The Annual Tendency of Change on Evaporation

The main factors influencing the amount of evaporation include sunshine hours, air temperature, and air saturation difference. The annual evaporation in 2013 is shown in Figure 3. The annual cumulative potential evaporation in 2013 reached 2610.3 mm, where the annual cumulative potential evaporation is defined as the upward flux due to potential evaporation per unit area per year. The maximum daily evaporation amount was 26 mm, and the minimum daily evaporation value was 0 mm. The annual evaporation in the experimental plot has shown an upward trend since March. It began to decline after reaching the maximum value in July and reached the minimum value in December. In summer, the amount of evaporation is large, and the precipitation is quickly evaporated, resulting in a decrease in the amount of infiltration. The accumulation of snowmelt on the surface may increase the amount of infiltration during the freeze–thaw period.

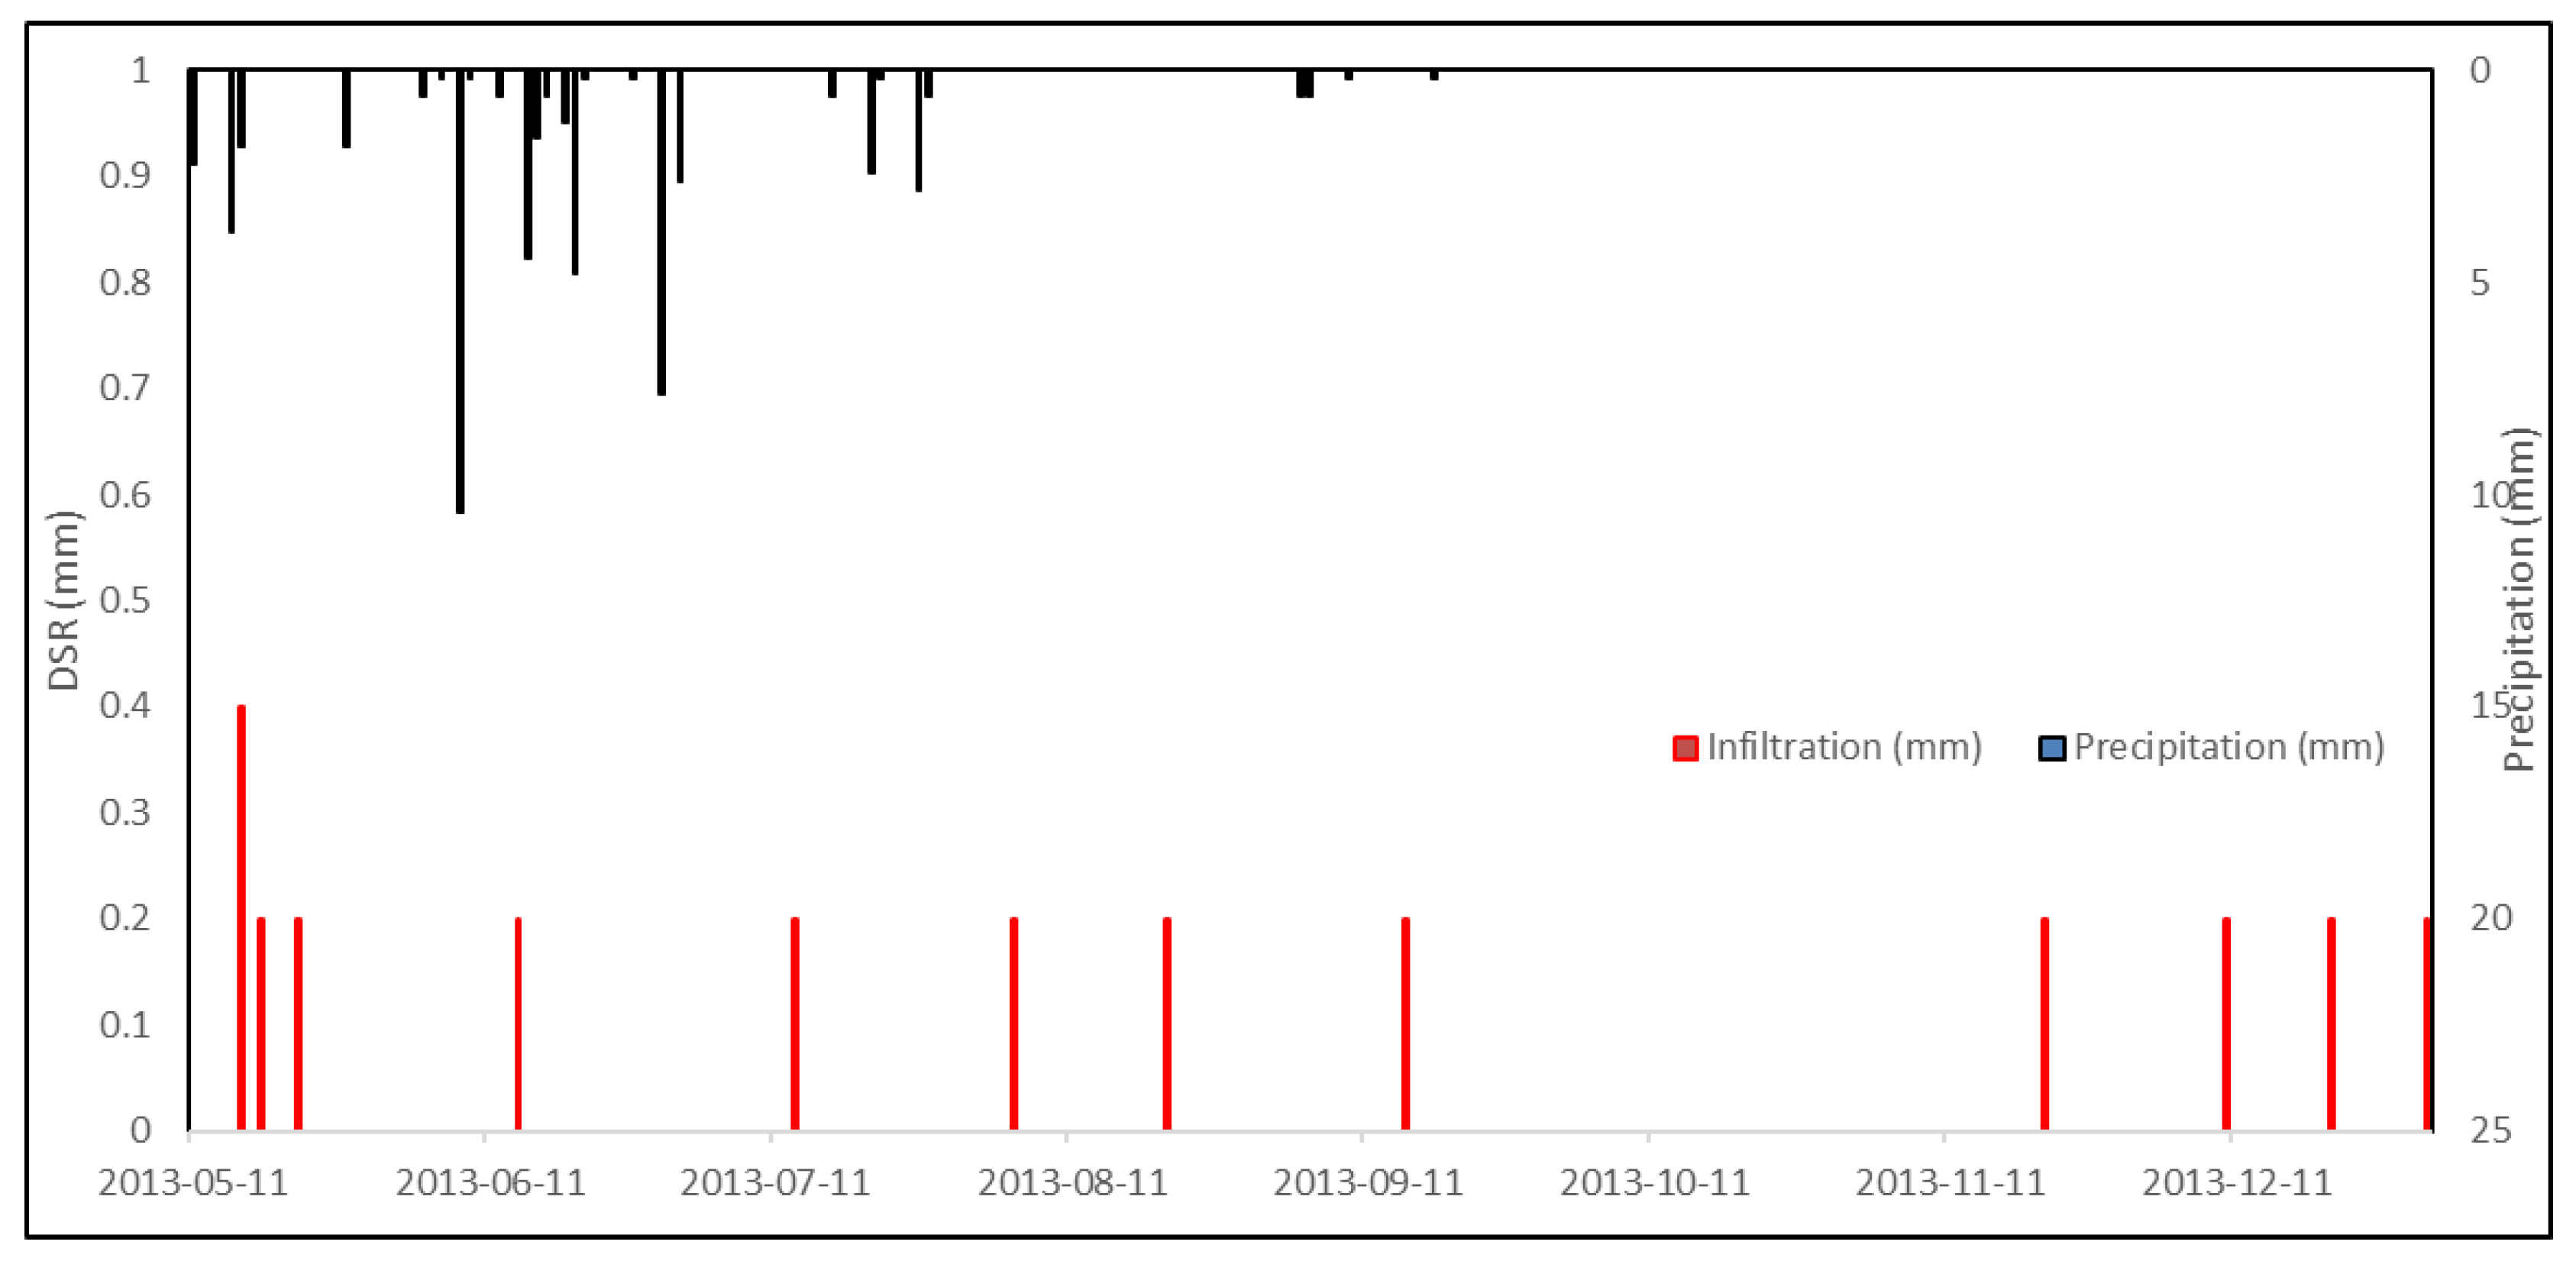
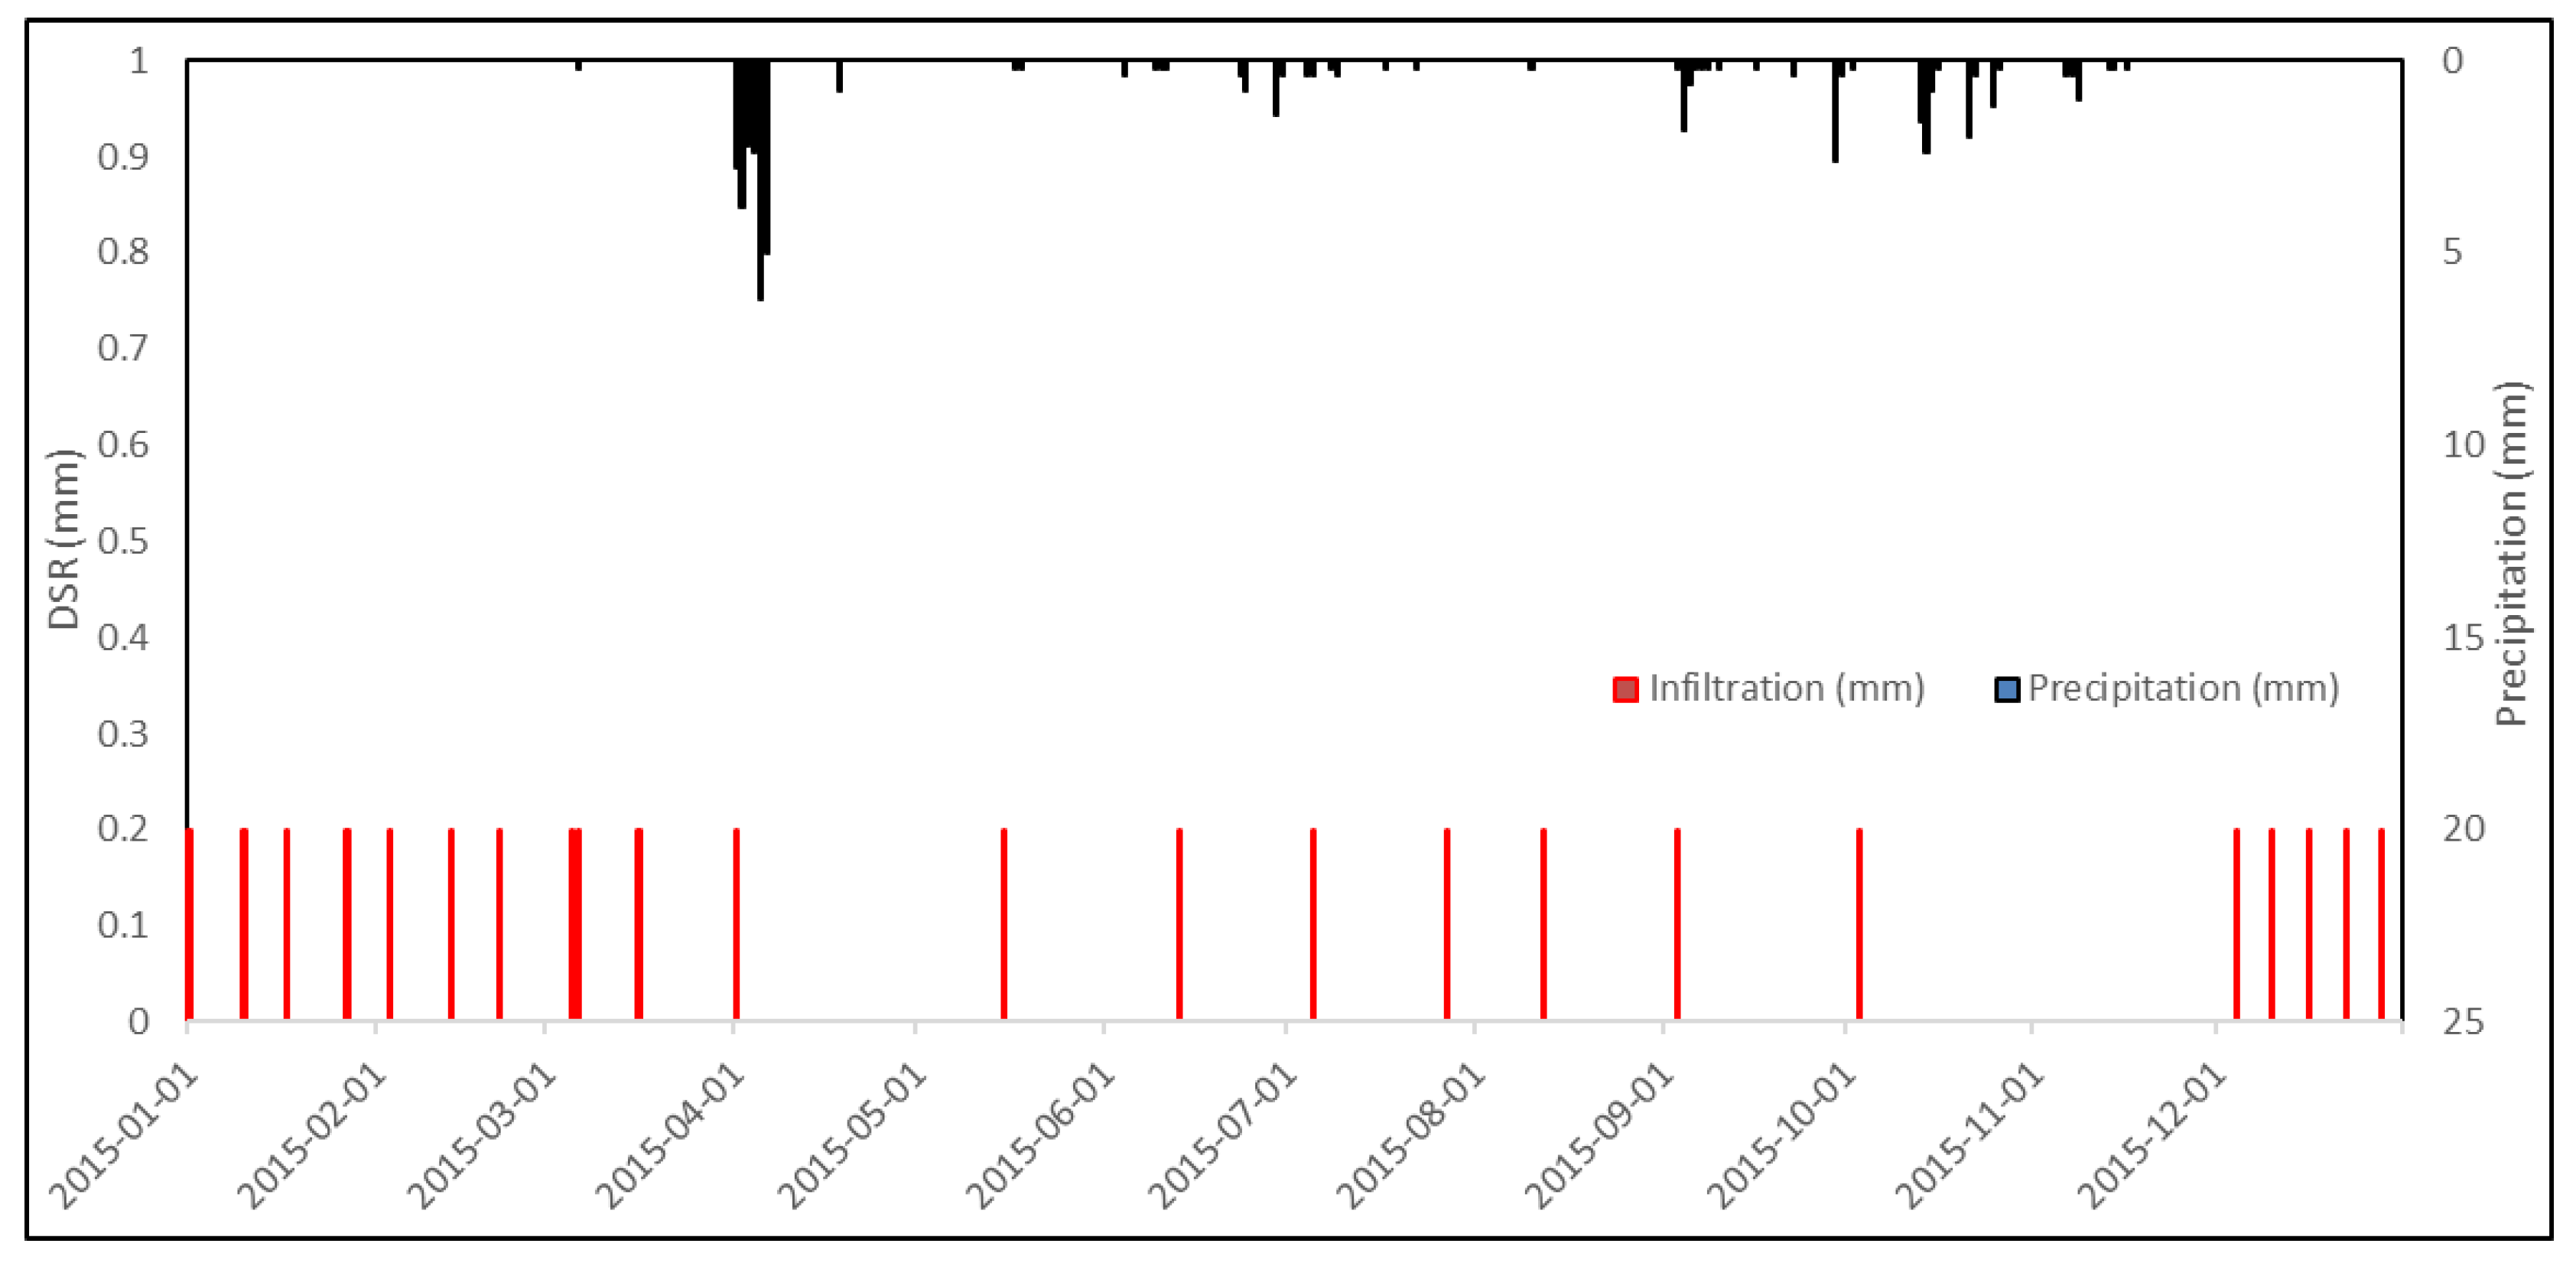
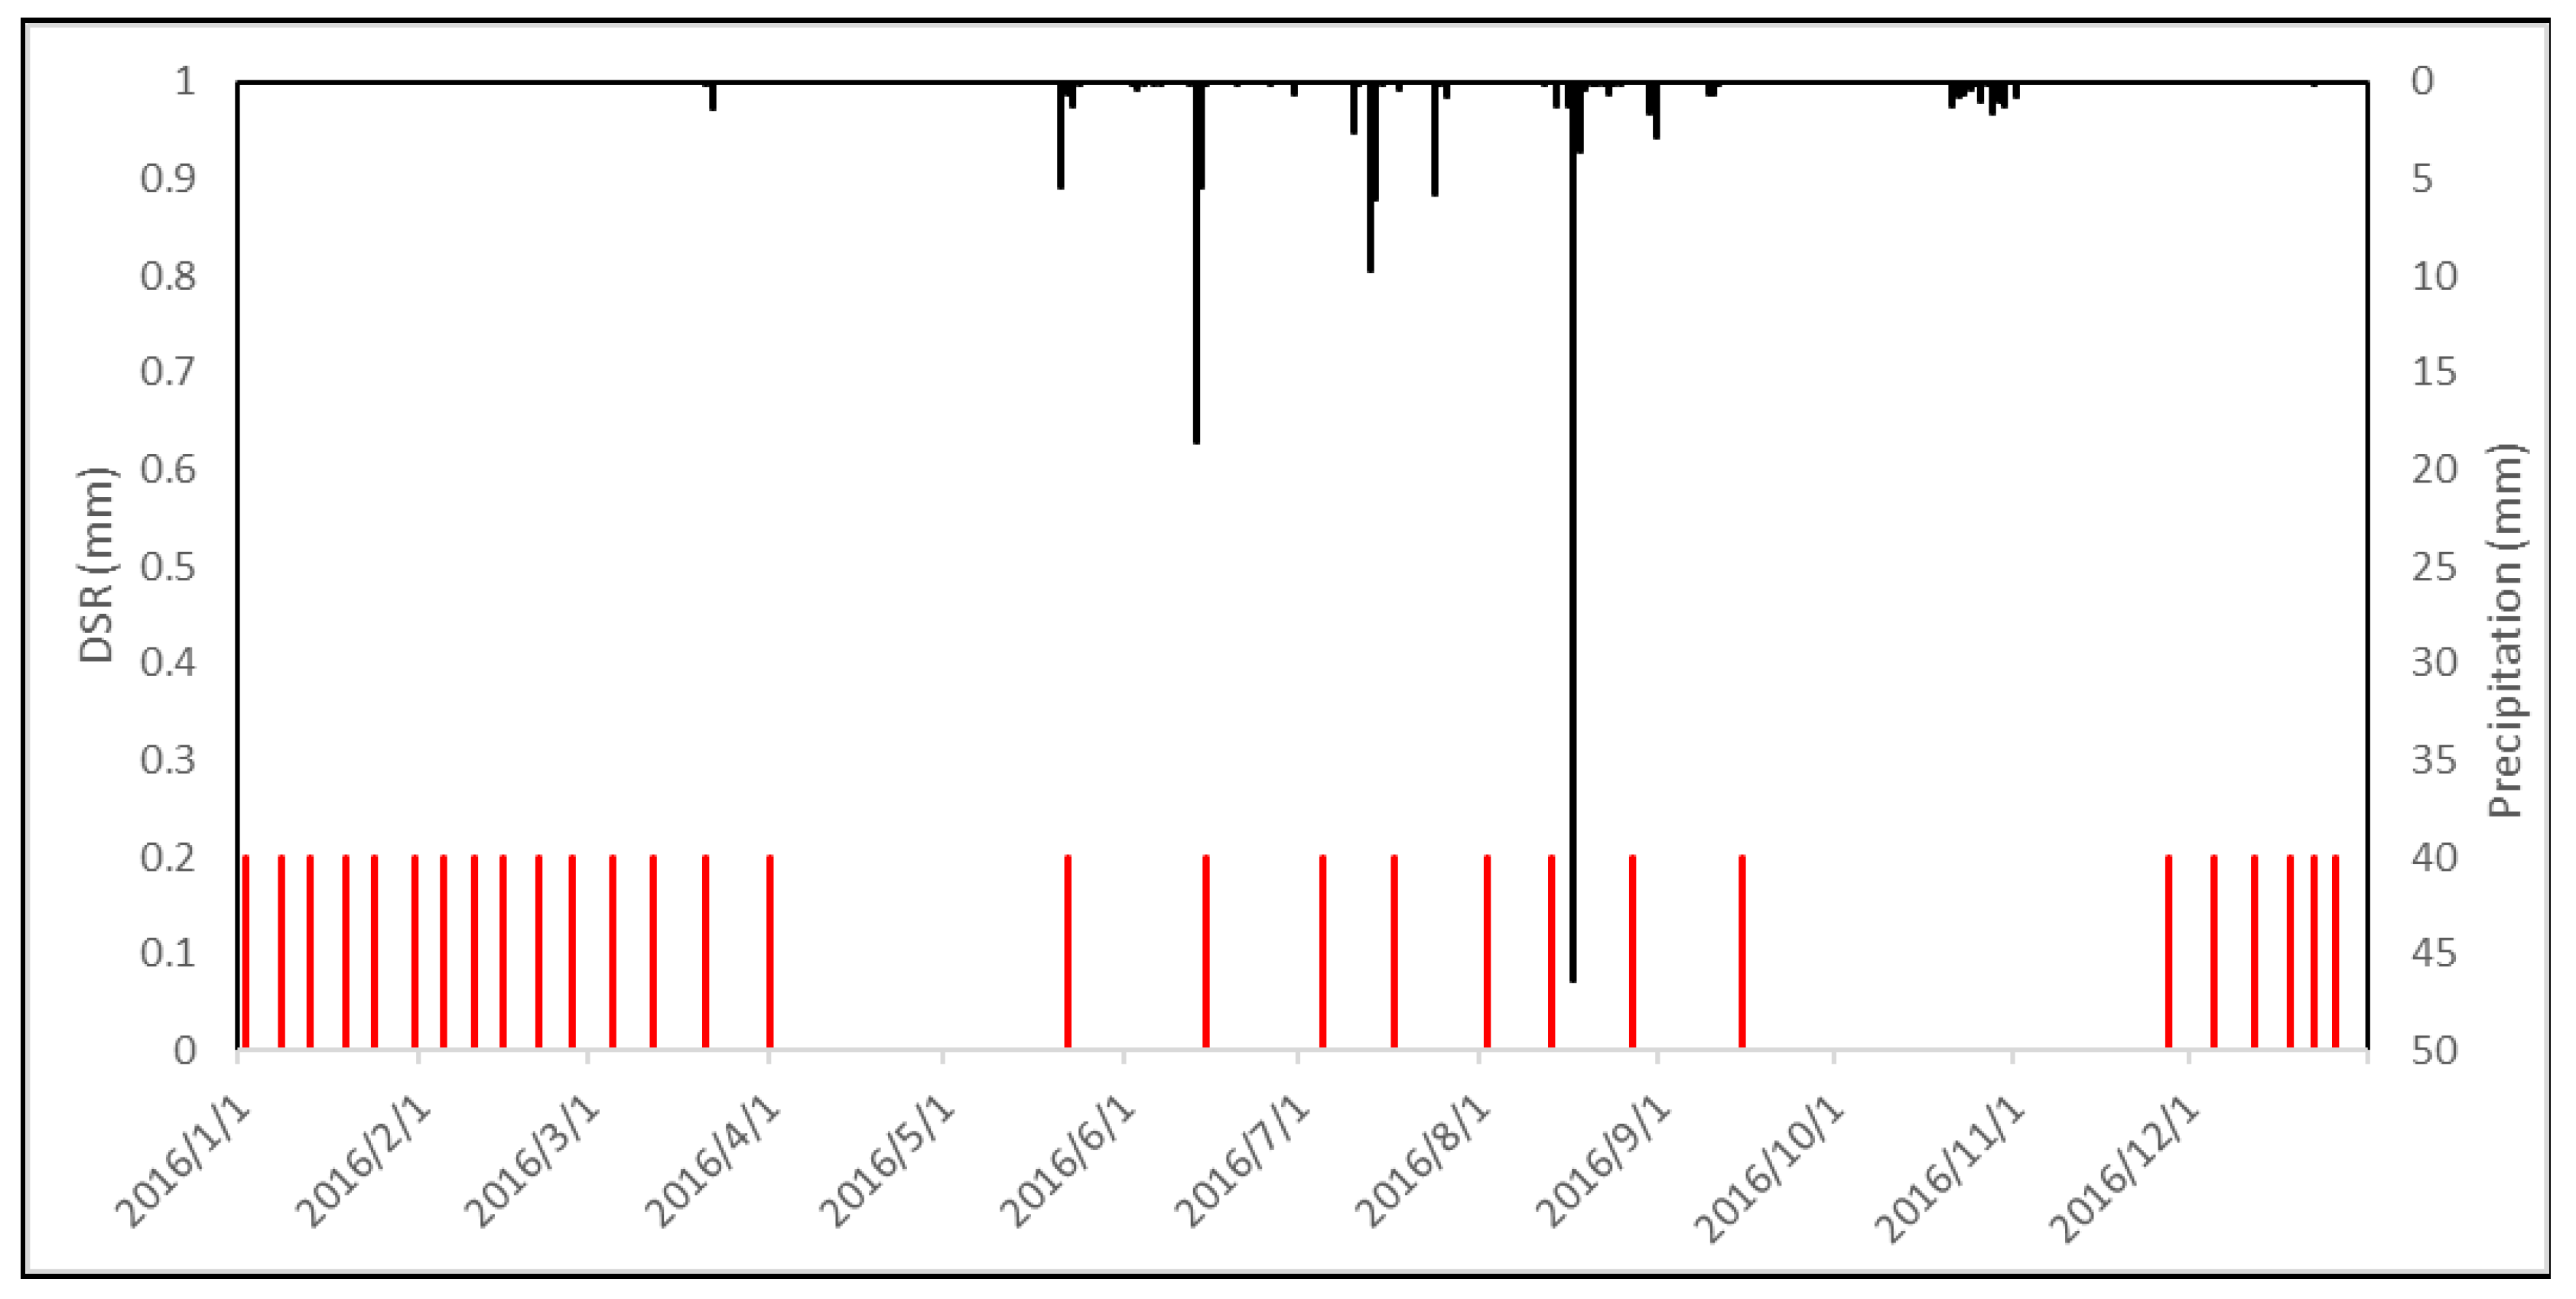
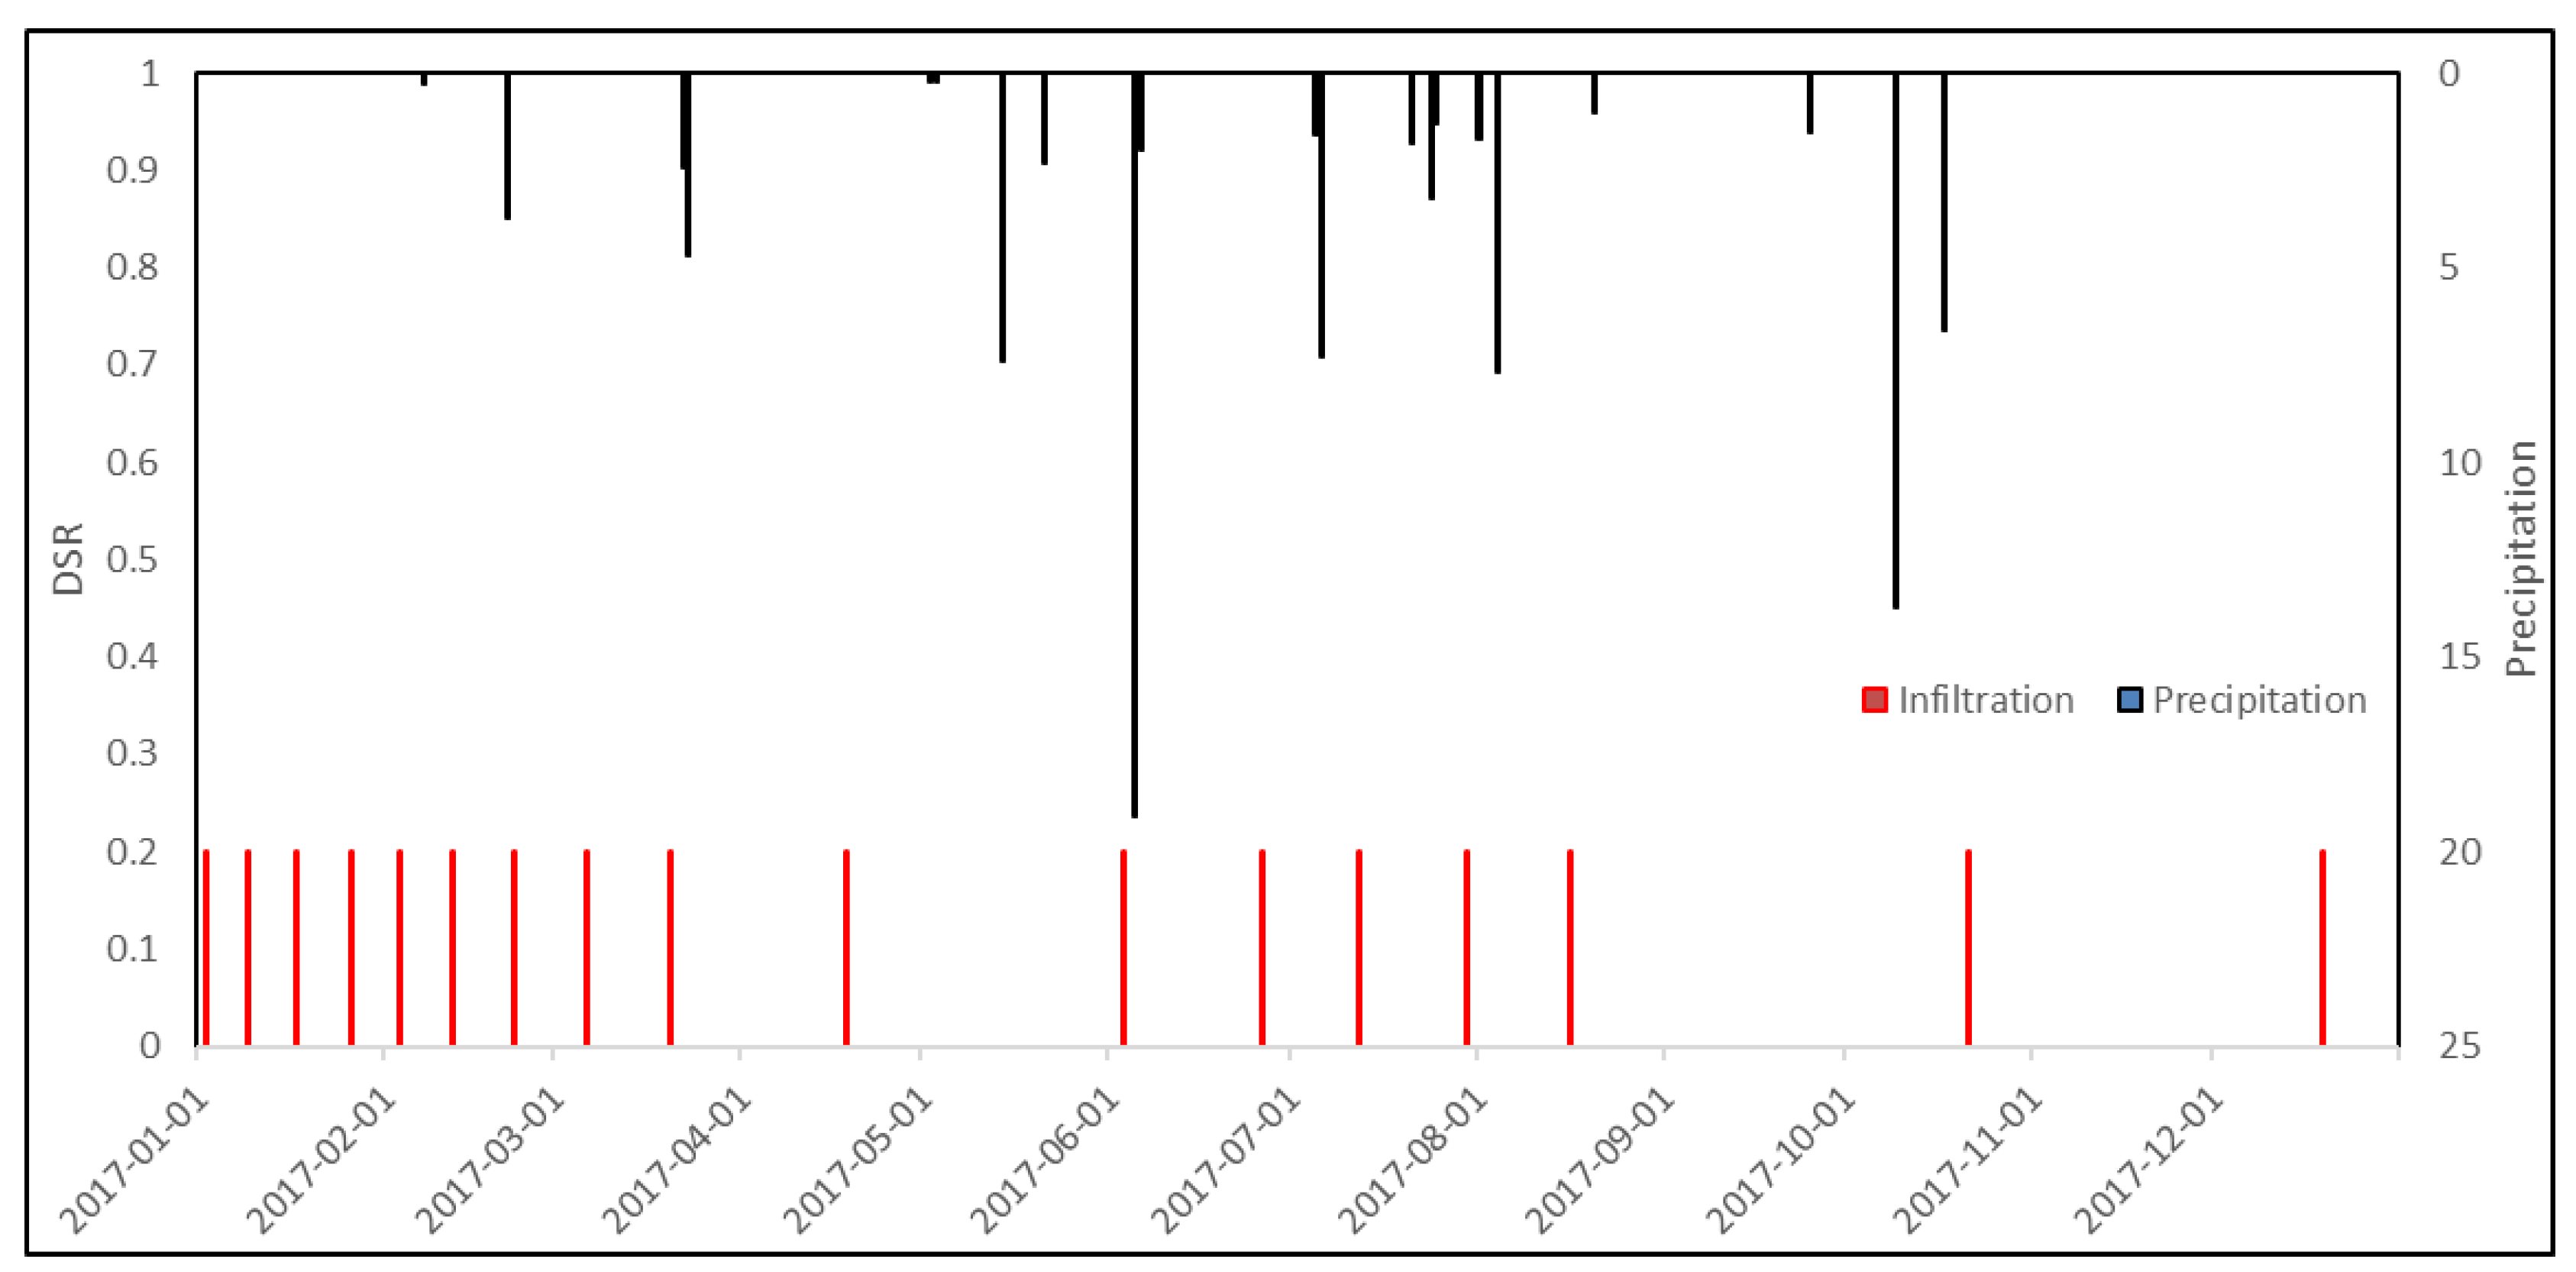
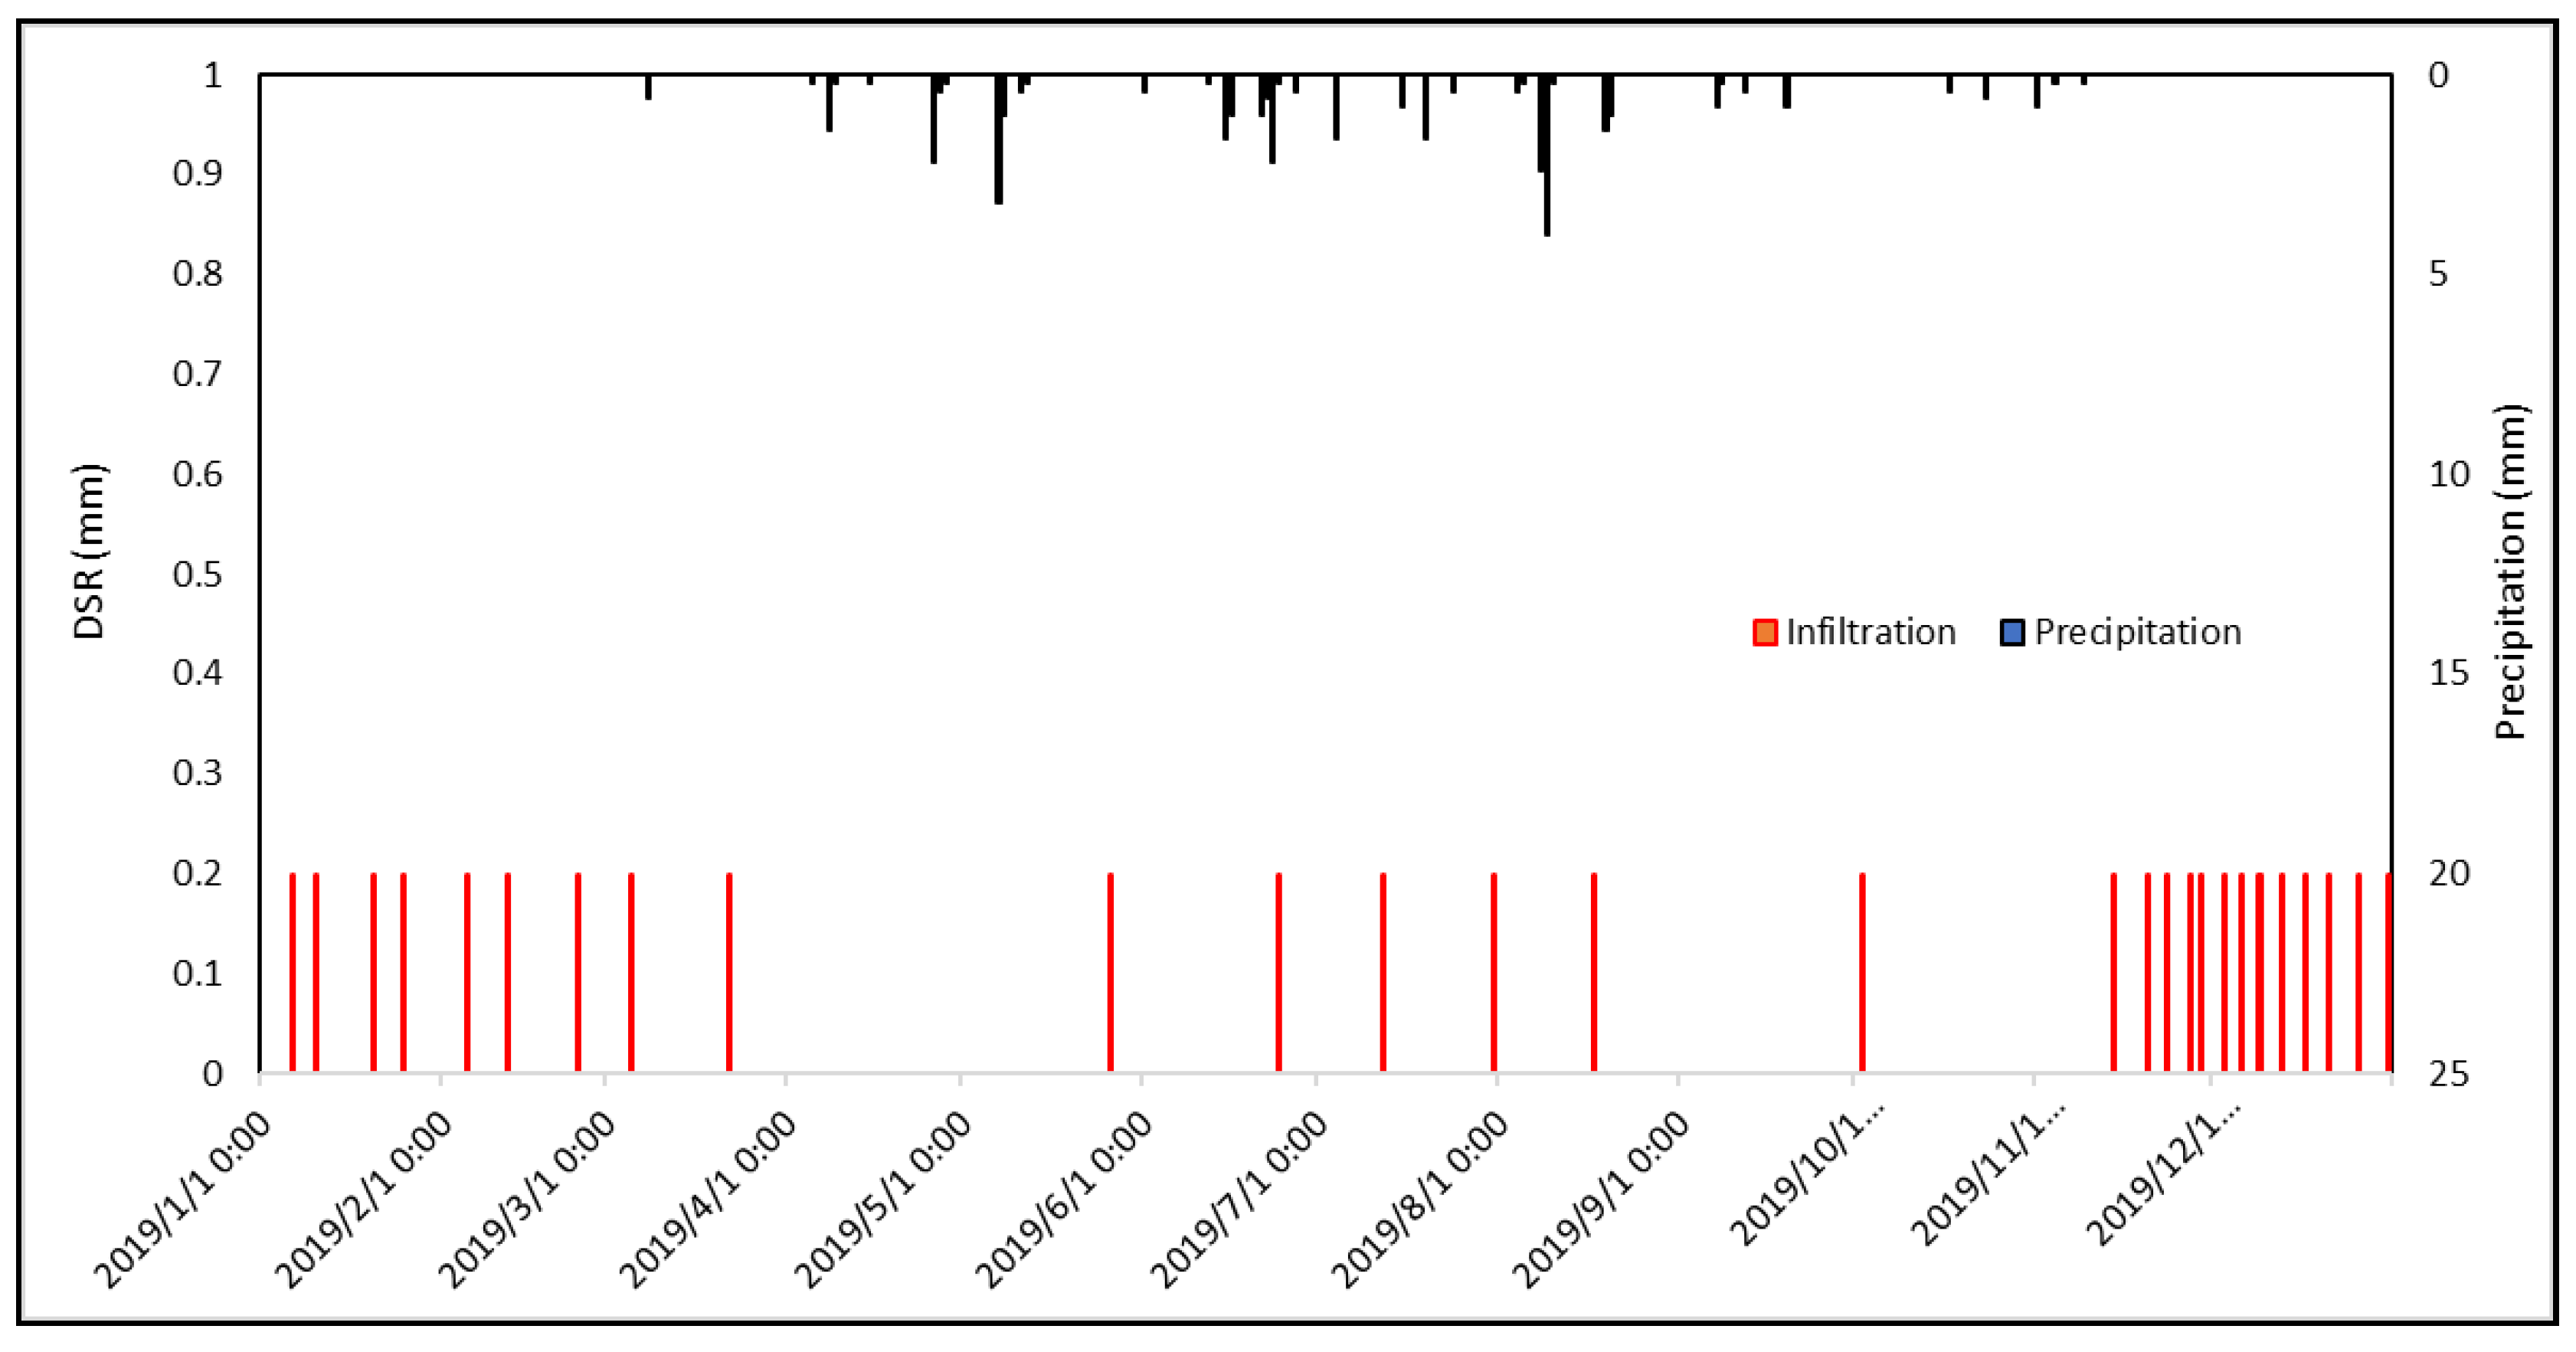
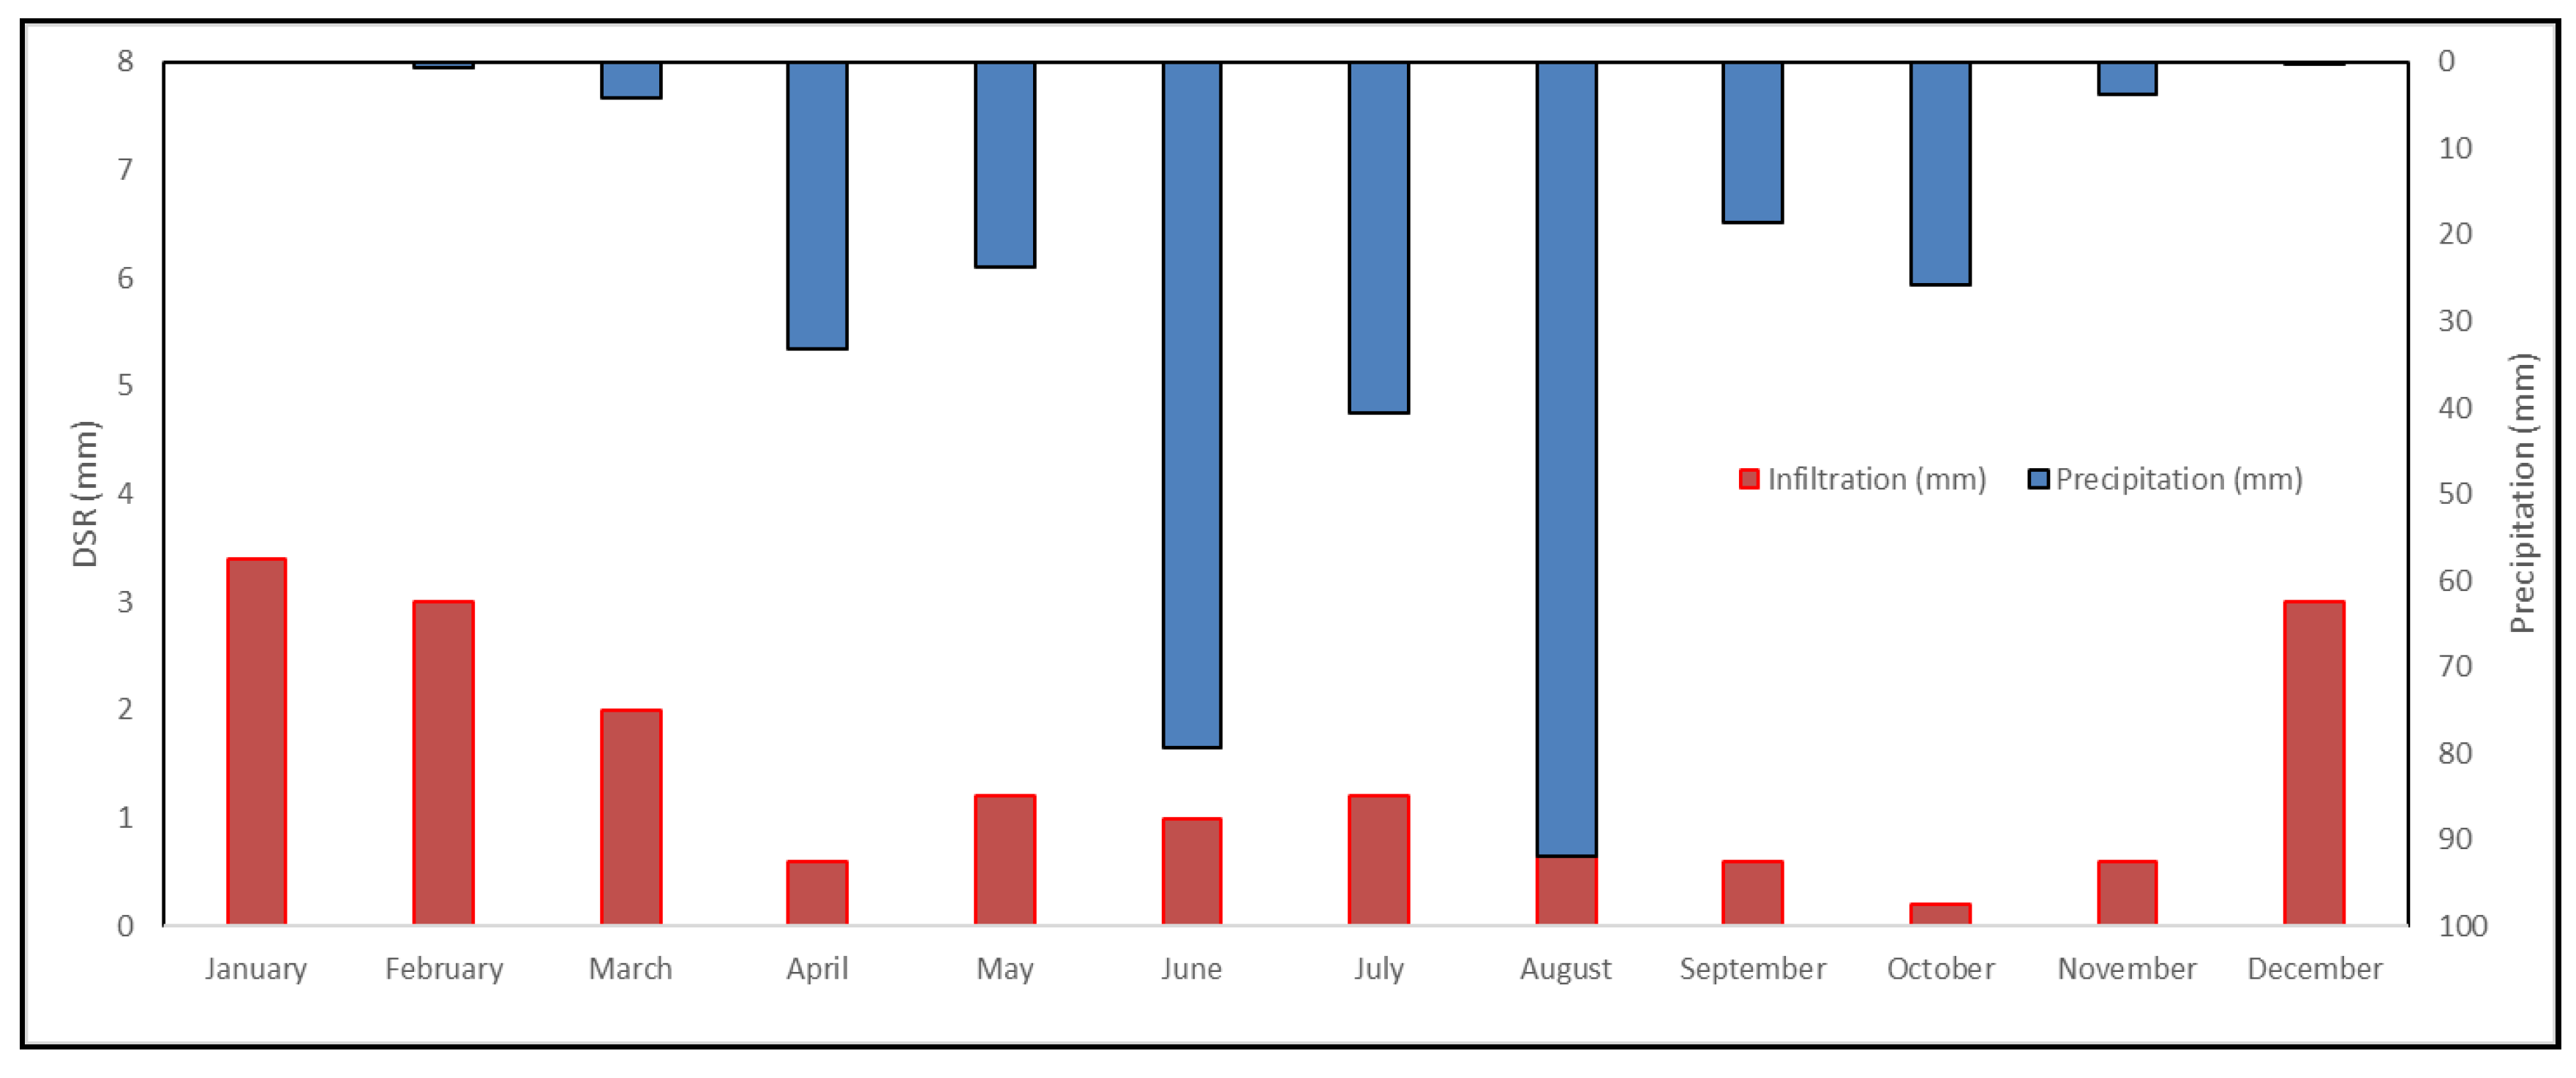
4.2. The Inter-Annual Trends of Precipitation and DSR

The statistical results of annual precipitation and DSR are shown in Table 1. The annual precipitations from 2013 to 2019 are 53, 79, 48.2, 131.2, 89.7, and 66.6 mm, respectively; the DSR values from 2013 to 2019 are 2.6, 3.4, 4.6, 5.8, 3.4, and 5.6 mm, respectively. The average annual precipitation of the experiment site is 102.9 mm, and it can be seen that the annual precipitation fluctuates considerably from year to year. From 2013 to 2016, the ratios of DSR to the annual precipitation were 4.9%, 4.3%, 9.54%, and 4.42%, respectively. In 2015, the annual precipitation was only 48.2 mm, which was the minimum value over the period of 2013–2019, but the amount of DSR reached 4.6 mm, which accounted for 9.54% of the annual precipitation, the largest ratio over the six year period (2013–2019). The precipitation in 2016 was 131.2 mm, which was the largest annual precipitation over the six year period (2013–2019), but the amount of DSR was only 5.8 mm, which accounted for 4.42% of the precipitation. It can be seen from Table 1 that precipitation and DSR are not linearly related at all. More specifically, DSR does not appear to be related to the annual precipitation at all. From this observation, we can infer that it is inaccurate to use a coefficient to determine the amount of annual DSR based on the annual precipitation the arid sandy region of this study. This conclusion is consistent with other recent studies conducted by the authors in arid sandy regions (Cheng et al., 2017; Cheng et al., 2018).
To examine the connection (or disconnection) of the annual precipitation and the amount of DSR in more details, we conducted a year-by-year analysis of precipitation and DSR from 2013 to 2016. After installing the lysimeter in May 2012, and backfilling the excavated site all the way to ground surface using the in situ soil, one usually has to wait for one year to ensure that soil settlement has approximately reached its pre-installation status. As shown in Figure 4, the precipitation in 2013 was concentrated between 11 May and 28 June, with a maximum precipitation event of 10.4 mm/d, a single maximum DSR of 0.4 mm, and three DSR events in May. DSR events are relatively concentrated and there were detected DSR events between September and November in 2013. As the precipitation and DSR data are only available from May to December in 2013, they may not be representative of this study site for other time periods. Nevertheless, one can see that even when the annual precipitation is as low as 53 mm in 2013 in the arid sandy region of the study site, DSR still occurs.
The distributions of precipitation and DSR in 2014 are shown in Figure 5. The annual precipitation in 2014 was 79 mm, the annual DSR was 3.4 mm, and DSR accounted for 4.3% of the annual precipitation. In 2014, the precipitation was concentrated from 16 April and 30 August. The maximum daily precipitation was 14.2 mm on 30 August, and the minimum daily precipitation was 0.2 mm, which occurred many times throughout the year. In 2014, 17 DSR events were monitored with the same DSR value of 0.2 mm. As shown in Figure 5, DSR events were concentrated from 8 January to 24 March 2014, with a total of 9 DSR events, accounting for more than half of the total DSR events. From April to June and September to November, there were no DSR events at all. This implies that melting in the shallow frozen soil will not replenish the deep soil moisture. One can conclude that DSR generated during the spring and winter seasons (when a frozen soil layer exists) is greater than that of during the summer and fall seasons (when a frozen soil layer does not exist). The snow and ice accumulated in the winter and spring has no obvious replenishment effect on DSR during the melting seasons. From this observation, we can infer that there are other forms of water redistribution and movement below the frozen soil layer, such as deep soil layer water vapor condensation and infiltration.
The distributions of the annual precipitation and DSR in 2015 are shown in Figure 6. The total annual precipitation in 2015 was 48.2 mm, the annual DSR was 4.6 mm, and annual DSR accounted for 9.54% of the annual precipitation in this year. The precipitation in 2015 was distributed between 6 March and 16 November. The maximum daily precipitation of 6.2 mm occurred on 6 April, and the minimum daily precipitation was 0.2 mm, which occurred many times throughout the year. In 2015, we have recorded 23 DSR events with the same DSR of 0.2 mm. Relative to the average annual precipitation of 102.9 mm over 2013–2019, the annual precipitation of 48.2 mm in 2015 signifies a very dry year. Despite this, DSR can still occur in this year when the maximum daily precipitation event of 6.2 mm occurs. This implies that the threshold of daily infiltration for generating measurable DSR is probably around 6.2 mm. Comparing the precipitation-DSR relation from 2014 to 2015, it can be found that the precipitation in 2015 is evenly distributed. The experiment shows that the evaporation during the freezing period is quite limited, indicating that snowfall may accumulate without evaporation on the surface and become a potentially important source to recharge the deep soil during this time the frozen soil layer disappears. From April to June and from October to December of 2015, there were no DSR events, indicating that the accumulated snowfall on the surface layer actually did not replenish the deep soil water during the melting season. Based on this observation, one can conclude that the threshold of daily precipitation for generating detectable DSR is 6.2 mm, and the snowfalls in the winter and spring have no replenishment effect on the deep soil moisture.
The distribution of precipitation-DSR in 2016 is shown in Figure 7. The annual precipitation in 2016 was 131.2 mm, the annual DSR was 5.8 mm, and the annual DSR accounted for 4.42% of the annual precipitation of this year. The precipitation was distributed from 21 May to 31 October 2016, with a maximum daily precipitation of 46.4 mm occurring on 13 June. Unfortunately, the heavy precipitation on 17 August did not infiltrate into the deep soil layer, and a large amount of surface runoff was observed at the experimental plot on that day. The minimum daily precipitation is 0.2 mm, which occurred multiple times throughout 2016. We have detected 23 DSR events with the same daily DSR value of 0.2 mm in 2016. From April to June, October to December of 2016, there were no DSR events.
It is interesting to see that heavy precipitation over a short period of time in arid sandy soil does not always lead to considerable DSR, as expected. This is because of the following reasons. The sandy soil in the arid region of this study has a relatively large value of porosity, and a great portion of the pore spaces are occupied by air, before the start of a heavy precipitation event. When a heavy precipitation event occurs, the shallow soil layer was filled with water so quick that the air underneath the shallow saturated soil layer was trapped there [46]. When the trapped air was suppressed, its pressure increased, and such trapped air then becomes an impermeable layer for further downward water infiltration [47,48]. When the downward infiltration becomes difficult or completely ceases, the precipitated water will start to pond on the ground surface, leading to surface runoff or evaporated [49].
The relationship between the annual precipitation-DSR in 2017 is shown in Figure 8. The annual precipitation in 2017 was 89.7 mm, the annual DSR was 3.5 mm, and the annual DSR accounted for 3.8% of the annual precipitation in this year. The precipitation in 2017 was distributed differently from the previous three years. In 2017, the distribution of precipitation in each month is more uniform than the previous three years. The maximum daily precipitation of 19.1 mm occurred on June 5. Surface runoff associated with such a heavy precipitation event of 19.1 mm was observed, but the amount of DSR did not increase significantly as a result of this precipitation event. This observation once again showed that heavy precipitation in an arid sandy region did not always have a significant replenishment effect on the DSR. The reason for this is associated with the trapped air in the sandy soil, as explained above.
The surface data logger instrument was destroyed in 2018, probably due to strong wind or for other unclear reasons, so there was no data recorded in 2018. The relationship between precipitation and DSR in 2019 is shown in Figure 9. The total precipitation in 2019 was 66.6 mm, the annual DSR was 5.6 mm, and the annual DSR accounted for 8.41% of the annual precipitation in this year. The daily precipitation intensity is generally small in 2019. There were 109 precipitation events throughout the year of 2019, of which the daily maximum precipitation was 4 mm, occurred on August 9. We have recorded 28 DSR events with the same DSR of 0.2 mm. From April to June and from September to December of 2019, there were no DSR events. Observation results again verify that the freeze–thaw process did not make a noticeable contribution to the deep soil moisture. In general, the annual precipitation in this year was not directly related to the amount of DSR.
Figure 10 is a summary of monthly precipitation and DSR from 2013 to 2019. A few general observations can be made. First, the precipitation events were concentrated in the non-frozen period, from April to October, while the DSR events were concentrated in the frozen period, from December to March. Second, precipitation did not show a direct correlation with the DSR in this region. Third, the amount of DSR generated in the freeze–thaw period was greater than that in the rainy season. This result implies that the vapor moisture condensation below the frozen soil layer in the freeze–thaw period season was the main source of DSR, and the replenishment of winter infiltration on DSR exceeds the replenishment of summer precipitation on DSR.
According to the above observations, the exchange of soil moisture between the frozen interface and the deep soil during the frozen period in winter is the main cause of the DSR in winter. Figure 11A,B shows the change in frozen soil layer thickness in the winter and spring of 2015–2016. The intermittent winter frozen period in 2015 was divided into two parts, from 1 January to 14 March and from 12 November to 31 December. One can find that from 12 November to 31 December, the thickness of the frozen soil gradually increased, and DSR was recorded. After the surface soil freezes, it forms an impervious layer that continues to thicken. The water vapor coming from the deep soil continues to convert into condensed water and infiltrated downward. From 1 January to 14 March is the freeze–thaw period. As the time approaches 14 March, the soil ice is melting, but there was no obvious DSR in the deep soil during the late freeze–thaw period. We speculated that the radiation from the surface makes the frozen layer melt, and the melted water evaporated upward into the atmosphere.

5. Discussion

There were many studies on the deep soil moisture in arid sandy regions, and the characteristics of precipitation infiltration and water redistribution under different vegetation cover conditions [50,51], but there were few studies on the effect of DSR replenishment. This study used a newly designed Lysimeter to measure the DSR at a depth of two meters in the sandy land and track the changes in the thickness of the frozen soil during the freeze–thaw period. Through the observation of DSR in specific soil layers, the results show that precipitation is not the main source of DSR in arid sandy land, and condensation water is the main source of replenishment for DSR. In dry years (the years when the annual precipitation is lower than the multi-year average precipitation is a dry year), taking 2015 as an example, the DSR in the summer rainfall season is 1.4 mm, and the DSR in the freeze–thaw period (condensate water is the main source of DSR replenishment) is 3.2 mm. In wet years (the years when the annual precipitation is higher than the multi-year average precipitation), taking 2016 as an example, the DSR in the summer rain season is 1.6 mm, and the DSR in the freeze–thaw period is 4.2 mm.
Under the global climate change conditions in perceivable future, extreme weather will occur more frequently. Due to the limited amount of DSR caused by precipitation, extreme high temperatures will further increase evaporation in arid sandy areas, the sandy soil in the arid region may become more dried and groundwater level may decline continuously. Consequently, the ecological degradation becomes inevitable when the groundwater level declines continuously, and it is indeed important to systematically study the recharge process of DSR under dynamically changing precipitation conditions.
Various investigators have conducted controlled precipitation experiments in arid sandy regions to study the infiltration process of precipitation, the sources of vegetation water used, and have divided precipitation to effective and ineffective precipitation for the arid sandy regions [51,52], where the ineffective precipitation refers to precipitation that cannot generate sufficiently strong infiltration that can penetrate a soil layer deeper than 40 cm. The results of this study show that, under natural conditions, instantaneous rainstorms cannot infiltrate into the deep soil layer. Most of the instantaneous rainstorms become shallow infiltration and runoff, which eventually returns to the atmosphere via evapotranspiration. This is because the instantaneous rainstorms fully saturate the shallow sandy soils quickly and form an airtight saturated layer that essentially block the escape routes of air underneath the shallow sandy soils. In return, the blocked air in the deep soil layer becomes an effective barrier for further infiltration to deep soil layers. After the rainstorms, the intense evapotranspiration in the arid sandy regions depletes the surface soil moisture. This was obviously inconsistent with the experimental results of simulated precipitation experiment infiltration. Under the condition of vegetation coverage in the sandy area of the arid region, almost no surface runoff will be formed [53,54], studies have shown that precipitation intensity at 46.4 mm/d will not form surface runoff in dry sand areas [55], and almost no precipitation intensity reached 46.4 mm/d in this study area. The surface runoff in the sandy area is affected by the covering, and the crust will increase the possibility of surface runoff formation [56,57].
During the freezing and thawing period, the DSR accounts for a great portion of the annual infiltration. During this period, the surface frozen soil layer prevents the infiltration of the surface snowmelt, suggesting that the DSR in this period is originated from the condensation of water vapor in the deep sand layer, not the infiltration of snowmelt. The results of this study show that in arid sandy areas, the condensate formed by the condensation of water vapor in the soil voids has an important effect on the replenishment of deep soil moisture. The replenishment effect of condensed water on deep soil exceeds the replenishment effect of rainfall moisture on deep soil moisture.
There is a notable limitation of this study that should be improved in the future. When measuring DSR, a gauge with a measurement accuracy of 0.2 mm was used to automatically record the amount of DSR. The measuring mechanism of this gauge was that when the accumulated amount of DSR reached a certain amount (0.2 mm), which is the downward volumetric flux over a unit area over a certain time lapse, then a data point will be recorded. With this measuring mechanism, it is impossible to know precisely the DSR variation over that time lapse. In the future, we need a more sensitive measuring apparatus that can precisely record the DSR variation with time in a higher precision.

6. Conclusions

This study carried out a 6 year (2013–2019) deep soil layer infiltration observation in an arid sandy soil region, which provided a reliable basis for accurately assessing the effect of precipitation on the replenishment of DSR. The replenishment process of precipitation to DSR in the arid sandy region was very complicated. Environmental factors and the heterogeneous soil make this research particularly difficult. The following conclusions can be obtained from this research.
  • Even with an annual precipitation of 48.2 mm in a very dry year in the arid sandy region, DSR is still recorded at a depth of 200 cm, signifying that groundwater recharge is possible during such a dry year. The threshold of daily precipitation that can induce DSR is around 4 mm in the arid sandy region, and DSR can be recorded under frozen surface layer conditions in winter and spring seasons.
  • There is no direct correlation between the amount of DSR and the annual precipitation in the arid sandy region. Most recorded DSR events are concentrated in the freeze–thaw period in winter and spring seasons. The instantaneous rainstorm in the arid sandy region has no obvious replenishment effect on DSR.
  • The ice and snow accumulated in the frozen season in winter and spring will not replenish the deep soil moisture in the freeze–thaw season. Instead, the condensed water in the deep soil is the main source of DSR in the freeze–thaw season. The amount of DSR replenishment during the rainy season in the arid sandy region is less than that during the winter and spring freeze–thaw season.

Author Contributions

Data curation, Y.C., Y.W., W.Y.; Formal analysis, Y.C., M.S.; Funding acquisition, W.Y. and Q.J.; Investigation, H.Z.; Writing—review & editing, Y.C. All authors have read and agreed to the published version of the manuscript.

Funding

This research received funding from the Demonstration of Near-Natural Restoration Technology for Sandy Ecosystem (Inner Mongolia~2019ZD003), the National Nonprofit Institute Research Grant of Chinese Academy of Forestry (grant number CAFYBB2018ZA004), and the National Science and Technology Major Project and Ministry of Science and Technology of China (No. 2017ZX07101004, No. 2018YFC0507100, NO. 2015ZCQ-SB-01, NO. 2019ZD003).

Acknowledgments

This research was supported by research grants from the Fundamental Research Funds for the Central Universities (BLX201814). We gratefully acknowledge the Beijing Municipal Education Commission for their financial support through Innovative Transdisciplinary Program “Ecological Restoration Engineering”. Thanks to the experimental site provided by Inner Mongolia Dengkou Desert Ecosystem National Observation Research Station, the Experimental Center of Desert Forestry, Chinese Academy Forestry.

Conflicts of Interest

The authors declare no conflict of interest.

References

  1. Zarch, M.A.A.; Malekinezhad, H.; Mobin, M.H.; Dastorani, M.T.; Kousari, M.R. Drought monitoring by reconnaissance drought index (RDI) in Iran. Water Res. Manag. 2011, 25, 3485. [Google Scholar] [CrossRef] [Green Version]
  2. Ren, W.; Tian, H.; Chen, G.; Liu, M.; Zhang, C.; Chappelka, A.H.; Pan, S. Influence of ozone pollution and climate variability on net primary productivity and carbon storage in China’s grassland ecosystems from 1961 to 2000. Environ. Pollut. 2007, 149, 327–335. [Google Scholar] [CrossRef] [PubMed]
  3. Cramer, W.; Kicklighter, D.W.; Bondeau, A.; Iii, B.M.; Churkina, G.; Nemry, B.; Ruimy, A.; Schloss, A.L. Intercomparison, Comparing global models of terrestrial net primary productivity (NPP): Overview and key results. Glob. Change Biol. 1999, 5 (Suppl. S1), 1–15. [Google Scholar] [CrossRef]
  4. LeBauer, D.S.; Treseder, K.K. Nitrogen limitation of net primary productivity in terrestrial ecosystems is globally distributed. Ecology 2008, 89, 371–379. [Google Scholar] [CrossRef] [Green Version]
  5. Haberl, H.; Erb, K.-H.; Krausmann, F. Human appropriation of net primary production: Patterns, trends, and planetary boundaries. Ann. Rev. Environ. Res. 2014, 39, 363–391. [Google Scholar] [CrossRef]
  6. Seifan, M. Long-term effects of anthropogenic activities on semi-arid sand dunes. J. Arid Environ. 2009, 73, 332–337. [Google Scholar] [CrossRef]
  7. Ma, Z.; Xie, Y.; Jiao, J.; Wang, X. The construction and application of an Aledo-NDVI based desertification monitoring model. Proc. Environ. Sci. 2011, 10, 2029–2035. [Google Scholar] [CrossRef] [Green Version]
  8. Modarres, R.V.; da Silva, P.R. Rainfall trends in arid and semi-arid regions of Iran. J. Arid Environ. 2007, 70, 344–355. [Google Scholar] [CrossRef]
  9. Cao, S.; Chen, L.; Shankman, D.; Wang, C.; Wang, X.; Zhang, H. Excessive reliance on afforestation in China’s arid and semi-arid regions: Lessons in ecological restoration. Earth-Sci. Rev. 2011, 104, 240–245. [Google Scholar] [CrossRef]
  10. Chen, C.; Park, T.; Wang, X.; Piao, S.; Xu, B.; Chaturvedi, R.K.; Fuchs, R.; Brovkin, V.; Ciais, P.; Fensholt, R. China and India lead in greening of the world through land-use management. Nat. Sustain. 2019, 2, 122–129. [Google Scholar] [CrossRef]
  11. Cao, S.; Chen, L.; Yu, X. Impact of China’s grain for green project on the landscape of vulnerable arid and semi-arid agricultural regions: A case study in northern Shaanxi Province. J. Appl. Ecol. 2009, 46, 536–543. [Google Scholar] [CrossRef]
  12. Jiang, Z.; Lian, Y.; Qin, X. Rocky desertification in Southwest China: Impacts, causes, and restoration. Earth-Sci. Rev. 2014, 132, 1–12. [Google Scholar] [CrossRef]
  13. Wang, Y.; Shao, M.A.; Zhu, Y.; Liu, Z. Impacts of land use and plant characteristics on dried soil layers in different climatic regions on the Loess Plateau of China. Agric. For. Meteorol. 2011, 151, 437–448. [Google Scholar] [CrossRef]
  14. Kleidon, A.; Fraedrich, K.; Heimann, M. A green planet versus a desert world: Estimating the maximum effect of vegetation on the land surface climate. Clim. Chang. 2000, 44, 471–493. [Google Scholar] [CrossRef]
  15. Huxman, T.E.; Snyder, K.A.; Tissue, D.; Leffler, A.J.; Ogle, K.; Pockman, W.T.; Sandquist, D.R.; Potts, D.L.; Schwinning, S. Precipitation pulses and carbon fluxes in semiarid and arid ecosystems. Oecologia 2004, 141, 254–268. [Google Scholar] [CrossRef] [PubMed]
  16. Agam, N.; Berliner, P.R. Dew formation and water vapor adsorption in semi-arid environments—a review. J. Arid Environ. 2006, 65, 572–590. [Google Scholar] [CrossRef]
  17. Pan, Y.-X.; Wang, X.-P.; Zhang, Y.-F. Dew formation characteristics in a revegetation-stabilized desert ecosystem in Shapotou area, Northern China. J. Hydrol. 2010, 387, 265–272. [Google Scholar] [CrossRef]
  18. Kidron, G.J. Analysis of dew precipitation in three habitats within a small arid drainage basin, Negev Highlands, Israel. Atmos. Res. 2000, 55, 257–270. [Google Scholar] [CrossRef]
  19. Tweed, S.; Leblanc, M.; Cartwright, I.; Favreau, G.; Leduc, C. Arid zone groundwater recharge and salinisation processes; an example from the Lake Eyre Basin, Australia. J. Hydrol. 2011, 408, 257–275. [Google Scholar] [CrossRef]
  20. Gran, M.; Carrera, J.; Massana, J.; Saaltink, M.W.; Olivella, S.; Ayora, C.; Lloret, A. Dynamics of water vapor flux and water separation processes during evaporation from a salty dry soil. J. Hydrol. 2011, 396, 215–220. [Google Scholar] [CrossRef]
  21. Jolly, I.D.; McEwan, K.L.; Holland, K.L. A review of groundwater–surface water interactions in arid/semi-arid wetlands and the consequences of salinity for wetland ecology. Ecohydrol. Ecosyst. Land Water Process Interact. Ecohydrogeomorphol. 2008, 1, 43–58. [Google Scholar] [CrossRef]
  22. Wang, G.-X.; Cheng, G.-D. The characteristics of water resources and the changes of the hydrological process and environment in the arid zone of northwest China. Environ. Geol. 2000, 39, 783–790. [Google Scholar] [CrossRef]
  23. Sternberg, T. Environmental challenges in Mongolia’s dryland pastoral landscape. J. Arid Environ. 2008, 72, 1294–1304. [Google Scholar] [CrossRef]
  24. Wheater, H. Hydrological Processes, Groundwater Recharge and Surface-Water/Groundwater Interactions in Arid and Semi-Arid Areas. Groundwater Modeling in Arid and Semi-Arid Areas, 1st ed.; Cambridge University Press: Cambridge, UK, 2010; pp. 5–37. [Google Scholar]
  25. Zhuang, Y.; Zhao, W. Advances in the condensation water of arid regions. Adv. Earth Sci. 2008, 23, 31–38. [Google Scholar]
  26. Cui, Y.; Shao, J. The role of ground water in arid/semiarid ecosystems, Northwest China. Groundwater 2005, 43, 471–477. [Google Scholar] [CrossRef]
  27. Brodersen, C.; Pohl, S.; Lindenlaub, M.; Leibundgut, C.; Wilpert, K.V. Influence of vegetation structure on isotope content of throughfall and soil water. Hydrol. Process. 2000, 14, 1439–1448. [Google Scholar] [CrossRef]
  28. Bostic, E.; White, J. Soil phosphorus and vegetation influence on wetland phosphorus release after simulated drought. Soil Sci. Soc. Am. J. 2007, 71, 238–244. [Google Scholar] [CrossRef]
  29. Rodriguez-Iturbe, I.; D’odorico, P.; Porporato, A.; Ridolfi, L. On the spatial and temporal links between vegetation, climate, and soil moisture. Water Res. Res. 1999, 35, 3709–3722. [Google Scholar] [CrossRef]
  30. Gerten, D.; Schaphoff, S.; Haberlandt, U.; Lucht, W.; Sitch, S. Terrestrial vegetation and water balance—hydrological evaluation of a dynamic global vegetation model. J. Hydrol. 2004, 286, 249–270. [Google Scholar] [CrossRef]
  31. Musa, A.; Ya, L.; Anzhi, W.; Cunyang, N. Characteristics of soil freeze–thaw cycles and their effects on water enrichment in the rhizosphere. Geoderma 2016, 264, 132–139. [Google Scholar] [CrossRef]
  32. Allington, G.; Valone, T. Reversal of desertification: The role of physical and chemical soil properties. J. Arid Environ. 2010, 74, 973–977. [Google Scholar] [CrossRef]
  33. Feng, Q.; Cheng, G.; Endo, K. Water content variations and respective ecosystems of sandy land in China. Environ. Geol. 2001, 40, 1075–1083. [Google Scholar]
  34. Qi, F.; Kunihiko, E.; Guodong, C. Soil water and chemical characteristics of sandy soils and their significance to land reclamation. J. Arid Environ. 2002, 51, 35–54. [Google Scholar] [CrossRef]
  35. Wang, X.P.; Li, X.R.; Xiao, H.L.; Berndtsson, R.; Pan, Y.X. Effects of surface characteristics on infiltration patterns in an arid shrub desert. Hydrol. Process. Int. J. 2007, 21, 72–79. [Google Scholar] [CrossRef]
  36. Cheng, Y.; Zhan, H.; Yang, W.; Dang, H.; Li, W. Is annual recharge coefficient a valid concept in arid and semi-arid regions? Hydrol. Earth Syst. Sci. 2017, 21, 5031. [Google Scholar] [CrossRef] [Green Version]
  37. Cheng, Y.; Li, Y.; Zhan, H.; Liang, H.; Yang, W.; Zhao, Y.; Li, T. New comparative experiments of different soil types for farmland water conservation in arid regions. Water 2018, 10, 298. [Google Scholar] [CrossRef] [Green Version]
  38. Li, S.; Xiao, H.; Cheng, Y.; Wang, F. Water use measurement by non-irrigated Tamarix ramosissima in arid regions of Northwest China. Sci. Cold Arid Reg. 2015, 7, 146–156. [Google Scholar]
  39. Zhao, L.; Gray, D. Estimating snowmelt infiltration into frozen soils. Hydrol. Process. 1999, 13, 1827–1842. [Google Scholar] [CrossRef]
  40. Chun, X.; Chen, F.-H.; Fan, Y.-X.; Xia, D.-S.; Zhao, H. Formation of Ulan Buh Desert and its environmental evolution. J. Desert Res. 2007, 6, 193–199. [Google Scholar]
  41. Tian, Y.; He, Y.; Guo, L. Soil water carrying capacity of vegetation in the northeast of Ulan Buh Desert, China. Front. For. China 2009, 4, 309–316. [Google Scholar] [CrossRef]
  42. McMahon, T.; Peel, M.; Lowe, L.; Srikanthan, R.; McVicar, T. Estimating actual, potential, reference crop and pan evaporation using standard meteorological data: A pragmatic synthesis. Hydrol. Earth Syst. Sci. 2013, 17, 1331–1363. [Google Scholar] [CrossRef] [Green Version]
  43. Zuo, X.; Zhao, X.; Zhao, H.; Zhang, T.; Guo, Y.; Li, Y.; Huang, Y. Spatial heterogeneity of soil properties and vegetation–soil relationships following vegetation restoration of mobile dunes in Horqin Sandy Land, Northern China. Plant Soil 2009, 318, 153–167. [Google Scholar] [CrossRef]
  44. Zhang, J.; Zhao, H.; Zhang, T.; Zhao, X.; Drake, S. Community succession along a chronosequence of vegetation restoration on sand dunes in Horqin Sandy Land. J. Arid Environ. 2005, 62, 555–566. [Google Scholar] [CrossRef]
  45. Liu, Q.; Yasufuku, N.; Miao, J.; Ren, J. An approach for quick estimation of maximum height of capillary rise. Soils Found. 2014, 54, 1241–1245. [Google Scholar] [CrossRef] [Green Version]
  46. Puigdefábregas, J.; Sole, A.; Gutierrez, L.; del Barrio, G.; Boer, M.J.E.-S.R. Scales and processes of water and sediment redistribution in drylands: Results from the Rambla Honda field site in Southeast Spain. Earth Sci. Rev. 1999, 48, 39–70. [Google Scholar] [CrossRef]
  47. Massmann, G.; Sültenfuß, J. Identification of processes affecting excess air formation during natural bank filtration and managed aquifer recharge. J. Hidrol. 2008, 359, 235–246. [Google Scholar] [CrossRef]
  48. Ferguson, B.K. Stormwater Infiltration; CRC Press: Boca Raton, FL, USA, 1994. [Google Scholar]
  49. Chen, X.; Hu, Q.J.J. Groundwater influences on soil moisture and surface evaporation. J. Hidrol. 2004, 297, 285–300. [Google Scholar] [CrossRef] [Green Version]
  50. Cerdà, A. Seasonal variability of infiltration rates under contrasting slope conditions in southeast Spain. Geoderma 1996, 69, 217–232. [Google Scholar] [CrossRef] [Green Version]
  51. Huang, J.; Wu, P.; Zhao, X. Effects of rainfall intensity, underlying surface and slope gradient on soil infiltration under simulated rainfall experiments. Catena 2013, 104, 93–102. [Google Scholar] [CrossRef]
  52. Casenave, A.; Valentin, C. A runoff capability classification system based on surface features criteria in semi-arid areas of West Africa. J. Hydrol. 1992, 130, 231–249. [Google Scholar] [CrossRef]
  53. Yair, A.; Lavee, J.S.P. Runoff generative process and runoff yield from arid talus mantled slopes. Earth Surf. Process. 1976, 1, 235–247. [Google Scholar] [CrossRef]
  54. Jordán, A.; Zavala, L.M.; Gil, J.J.C. Effects of mulching on soil physical properties and runoff under semi-arid conditions in southern Spain. Catena 2010, 81, 77–85. [Google Scholar] [CrossRef]
  55. Kidron, G.J.; Yair, A. Rainfall–runoff relationship over encrusted dune surfaces, Nizzana, Western Negev, Israel. Earth Surf. Process. Landf. J. Br. Geomorphol. Group 1997, 22, 1169–1184. [Google Scholar] [CrossRef]
  56. Yair, A.; Almog, R.; Veste, M. Differential hydrological response of biological topsoil crusts along a rainfall gradient in a sandy arid area: Northern Negev desert, Israel. Catena 2011, 87, 326–333. [Google Scholar] [CrossRef]
  57. Lange, J.; Leibundgut, C.; Greenbaum, N.; Schick, A.W.R.R. A noncalibrated rainfall-runoff model for large, arid catchments. Water Resour. Res. 1999, 35, 2161–2172. [Google Scholar] [CrossRef]
Figure 1. Geographic location of the experimental area. (A) refers to the location of the study area in China, (B) refers to the area covered by a large amount of snow in winter, (C) refers to the location of the study area in the arid and semi-arid area of Inner Mongolia, and (D) refers to the landscape of the experimental site.
Water 12 02409 g001
Figure 2. Design of the new lysimeter and experimental plot design.
Water 12 02409 g002
Figure 3. Daily evaporation in the year 2013.
Water 12 02409 g003
Figure 4. Relationship between precipitation and DSR in 2013.
Water 12 02409 g004
Figure 5. Relationship between precipitation and DSR in 2014.
Water 12 02409 g005
Figure 6. Relationship between precipitation and DSR in 2015.
Water 12 02409 g006
Figure 7. Relationship between precipitation and DSR in 2016.
Water 12 02409 g007
Figure 8. Relationship between precipitation and DSR in 2017.
Water 12 02409 g008
Figure 9. Relationship between precipitation and DSR in 2019.
Water 12 02409 g009
Figure 10. Every month add together.
Water 12 02409 g010
Figure 11. Frozen soil boundary of the field in 2015. (A) frozen soil boundary changes in 2015; (B) frozen soil boundary changes in 2016.
Water 12 02409 g011
Table 1. Changes in precipitation and deep soil recharge (DSR) from 2013 to 2019.
TimePrecipitation (mm)DSR (mm)Infiltration/Precipitation (%)
2013532.64.9
2014793.44.3
201548.24.69.54
2016131.25.84.42
201789.73.43.8
201966.65.68.41

