Article

Variation Characteristics of Stable Isotopes in Precipitation and Response to Regional Climate Conditions during Pre-monsoon, Monsoon and Post-monsoon Periods in the Tianshui Area

College of Geography and Environmental Science, Northwest Normal University, Lanzhou 730070, China
*
Author to whom correspondence should be addressed.
Water 2020, 12(9), 2391; https://doi.org/10.3390/w12092391
Submission received: 23 July 2020 / Revised: 20 August 2020 / Accepted: 22 August 2020 / Published: 26 August 2020
(This article belongs to the Section Hydrology)

Abstract

:
The stable isotopes in precipitation provide a new understanding for the mechanism study of water cycles in the Loess Plateau. However, there has never been an introduction for the Tianshui area, which is transitioning from semi-humid to semi-arid. We analyzed the time series changes of stable isotopes in precipitation at seven sampling points during pre-monsoon, monsoon and post-monsoon periods (April to October) in the Tianshui area. The results show that the temperature effect not only shows spatial differences but also seasonal changes and a weak precipitation effect is only found during the monsoon period. At the same time, the variation characteristics of precipitation isotopes before and after the monsoon clearly record the advancing and retreating time of the monsoon. We captured this important time node around 7 May and 21 September. Due to the influence of the regional microclimate formed by different natural conditions, the kinetic fractionation effect of isotopes in precipitation cause obvious differences in the slope and intercept of the meteoric water line in different natural regions, which shows that the stable isotopes in precipitation with high-resolution changes in a short period of time are of great significance to deeply explore the hydrological process of regional microclimates.

1. Introduction

The stable hydrogen and oxygen isotopes in precipitation, as “genetic factors” in the water cycle, provide important information for revealing paleo-climate changes [1], tracing water vapor sources [2], ecological hydrology [3], water cycle mechanisms [4] and so on. As the water vapor formed on the ocean surface undergoes different natural conditions during the transportation process, the stable isotopes in the water vapor undergo corresponding fractionation, which is manifested in the obvious correlation between the changes and intensity of convective activities in the water vapor source area and the characteristics of the stable isotopes of precipitation. This result provides a new idea for using precipitation isotopes to indicate monsoon advance and retreat [5,6,7,8]. In the Tibetan Plateau controlled by the Indian Ocean monsoon and westerly winds, precipitation isotope data have successfully found the monsoon influence range; there is a significant precipitation effect in the south and temperature effect in the north [9,10,11,12,13,14]. In the Qilian Mountains in the arid region, there are obvious spatial differences in the stable isotopes of the water bodies on the north slope and the contribution of water vapor in mountains, oasis and desert areas is different [15]. At the same time, the impact of water vapor recycling in the hydrological process is clearly quantified [16]. Studies have found that the semi-arid Lanzhou area is mainly affected by westerly water vapor and there are obvious water vapor channels in different periods but a clear analysis of the advancing and retreating time of the monsoon has not yet been given [17,18].
The above studies are of great significance for understanding the water cycle in arid regions. However, previous studies mostly involved areas with larger scales [19] and relatively simple climatic conditions and paid less attention to the complex microclimates in the transition zone from semi-humid to semi-arid. Considering the unique geographical location of the Tianshui area and its location at the edge of the monsoon, it used to only involve research on vegetation and climate change [20] and there has never been a report on stable isotopes in precipitation in this area. Liu [21] used the General Circulation Models to study the interannual changes in the arid area of northwestern China but did not analyze the details of seasonal changes on a small scale.
In this study, seven stations are selected from three natural sub-regions in the Tianshui area and the observation network system of stable isotopes in precipitation in the Weibei, the River Valley and the Guanshan regions is constructed for the first time. On the basis of previous studies, this study aims to strengthen the understanding of the time transformation of the regional microclimate from pre-monsoon to post-monsoon. It also more systematically analyzes the temporal and spatial characteristics of the study area in the pre-monsoon and the post-monsoon period and, on this basis, the influencing factors of stable isotopes in precipitation in different periods are discussed. The results of this study will also provide new ideas and important data for studying the hydrological process of similar regional microclimates and will be of great significance for subsequent study on the hydrological cycle mechanism in this area.

2. Materials and Methods

2.1. Study Area

Our study area, the Tianshui area (Figure 1) (34°05′–35°10′ N, 104°34′–106°43′ E) is located in the hinterland of the Northwest Arid Area of China. The terrain of the Tianshui area shows a trend of high in the west and low in the east. It is a typical mountain valley basin city with a poor geological environment and frequent natural disaster activities [22]. Due to the unique geographical location and topographic features of the Tianshui area, it belongs to the marginal zone of a semi-humid and semi-arid continental monsoon climate and has three distinct microclimate types in space [23]. The region of the Weihe River in the Yellow River Basin in the north of the Tianshui area is about 11.695 × 10³ km2 and the area of Jialing River in the Yangtze River Basin in the south of the Tianshui area is about 2.622 × 10³ km2. The Weibei region (Gangu, Wushan, Qin’an) has obvious arid climate characteristics with an average annual precipitation of 433 mm and an average temperature of 10.51 °C. The average annual precipitation in the central valley region (Qinzhou, Maiji) is 502 mm and the average temperature is 11.36 °C; average annual precipitation in the Guanshan region (Zhangchuan, Qingshui) in the northeast is 531 mm and the average temperature is 9.52 °C. The seasonal precipitation in the study area has uneven temporal and spatial changes, mainly concentrates in summer and the annual precipitation gradually decreases from the southeast to the northwest. The seasonal difference in temperature is also obvious with the highest in summer and the lowest in winter.

2.2. Sampling and Measurements

During the sampling periods (from April 2019 to October 2019), seven precipitation sampling sites were set up in the source area of the Tianshui area (Table 1). The measurement accuracy of δ18O and δ2H were 0.2‰ and 0.6‰, respectively. In addition, the δ18O and δ2H values of precipitation samples were measured using a liquid isotope analyzer (DLT-100, Los Gatos Research Center, CA, USA) from the School of Geography and Environmental Science of the Northwest Normal University. The analyzed aliquot volume of measured samples was 1.5 mL. Each sample was measured six times and the first two values were discarded in order to avoid the memory effect associated with continuous flow methods. The measured results were expressed as δ-values relative to Vienna Standard Mean Ocean Water (V-SMOW).
δ s a m p l e = ( R s a m p l e R v s m o w 1 ) × 1000
where the Rsample is the ratio of 18O/16O or 2H/1H in the samples and the R standard is the ratio of 18O/16O or 2H/1H in V-SMOW.
Long-term hourly meteorological observation data (air temperature, relative humidity, precipitation amount and vapor pressure) from April to October 2019 at the Tianshui meteorological station were acquired from the China Meteorological Data Network (http://www.nmic.cn/). In moisture sources, the framework of the Hybrid Single Particles Lagrangian Integrated Trajectory (HYSPLIT4.0) model provided by NOAA (http://ready.arl.noaa.gov/HYSPLIT.php) and Global Reanalysis datasets from the National Centre for Environmental Prediction (NCEP) were used. As suggested in previous studies [24], the air mass trajectories for five days before the precipitation event were simulated (April to September). The height of the initiation of each trajectory was selected as 1500 m [25]. In addition, daily Outgoing Longwave Radiation (OLR) data (https://www.esrl.noaa.gov/psd/data/gridded/data.uninterp_OLR.html) from NOAA satellites at a resolution of 2.5° × 2.5° were used as proxies of local and regional convective activities for the study period.

3. Results and Discussion

3.1. Relationships Between Local Climate and Daily Precipitation Isotopes

This study analyzed the isotopes of daily precipitation at seven observation stations in the Weibei, the River Valley and the Guanshan regions. Figure 2 depicts the changes between the δ18O and different meteorological factors (precipitation, temperature, water pressure) in the three natural regions. The values of δ18O ranged from −21.96‰ to 4.54‰, −18.95‰ to 3.57‰ and −20.31‰ to 3.6‰. The average value was −5.66‰, −5.45‰ and −4.8‰, respectively. The values of δD ranged from −143.9‰ to 48.8‰, −134.5‰ to 35.6‰ and −143.91‰ to 44.5‰. The average value was −36.3‰, −32.7‰ and −31.1‰, respectively. The above analysis results were within the stable isotopes range of global precipitation (δ18O: 10‰ to −50‰; δD: 50‰ to −350‰) [26].
In the pre-monsoon period (April to May), the precipitation in the Tianshui area was generally low and 70% of precipitation events had a daily precipitation of less than 10 mm. Precipitation was significantly affected by below-cloud secondary evaporation, which caused a strong enrichment in the δ18O values of precipitation leading to values even higher than 0‰. At the same time, when water vapor condensed to form raindrops, heavy isotopes were transferred to liquid water due to their large mass, which made light isotopes enriched in water vapor and heavy isotopes enriched in precipitation [2,27,28]. Before the onset of the monsoon, the water vapor in the Loess Plateau was dominated by the westerly zone, the source of the water vapor was relatively single [29,30] and the precipitation in the study area was relatively small compared with the monsoon period. At the same time, the changes of δ18O, water vapor pressure and temperature showed a slight increase trend overall. The positive correlation between the stable isotope (δ18O) and temperature was in the 0.01 confidence interval. However, there was a significant negative correlation between the δ18O and relative humidity (Table 2).
During the monsoon period (June to August), with the weakening of the westerly wind and the strengthening of the summer monsoon, the temperature and water vapor pressure increased significantly. During the period from 8 June to 21 June 2019, although the δ18O of the three natural regions was depleted to varying degrees, the δ18O of precipitation in the Weibei region significantly decreased from a high value of 4.36‰ to a low value of −7.11‰ and its short-term change gradient was higher than that in the River Valley and the Guanshan regions. This result may have been caused by the long distance oceanic air mass transported by the summer monsoon. The specific reasons are analyzed in detail in Section 3.3. Among all precipitation events from 6 July to the end of August 2019, δ18O tended to be enriched as a whole and its fluctuations were small. We also found that the temperature effect decreased rapidly during the monsoon period or did not even exist and the relationship between δ18O and precipitation was negatively correlated compared with the pre-monsoon period. Previous studies have found that the precipitation effect generally existed in the middle and low latitudes [31] and the latitudes of the River Valley region (Maiji, Qinzhou) are relatively low. The correlation coefficient between the δ18O of precipitation and precipitation was relatively high at −0.265 while the correlation coefficients between the Guanshan region and the Weibei region, which are located at relatively high latitudes, were −0.128 and −0.09, respectively. This may have been due to the cover of the temperature effect in the pre-monsoon period and the precipitation effect could not be manifested. However, due to the relatively low stable isotopes of water vapor carried by the ocean air mass during the monsoon period, there was still a weak precipitation effect in the Tianshui area. At the same time, during the monsoon period the δ18O in precipitation had a significant negative correlation with the vapor pressure compared with the pre-monsoon period, while its negative correlation with the relative humidity was weakened.
In the post-monsoon period (September to October), temperature, vapor pressure and relative humidity gradually decreased as the Asian summer monsoon subsided. The study found that continuous precipitation occurred during the 11 days from 9 September to 19 September 2019; the amount of precipitation was relatively large and the oxygen stable isotope fractionation of cloud water vapor was relatively high. Therefore, the δ18O in the precipitation at the Qin’an site on 14 September 2019 showed a very low value of −21.96‰. Interestingly, on 21 September 2019, the δ18O of the precipitation in Zhangchuan increased to −6.6‰. In all subsequent precipitation events in October, the δ18O in precipitation in the Tianshui area was relatively high, with an average of −8.16‰, and the precipitation was generally small. Although there was no obvious correlation between the δ18O and various meteorological factors in the post-monsoon period (Table 2), there was still a significant temperature effect on 9 September to 19 September 2019. The correlation coefficients of δ18O and temperature in the Weibei region, the River Valley region and the Guanshan region were 0.47, 0.63 and 0.36, respectively. The correlation coefficients of the Weibei region and the River Valley region were both within the 0.05 confidence interval. Based on this, we can infer that 21 September 2019 was an important time node at the end of the monsoon in the Tianshui area.
In summary, although the geographical distances of the three different natural areas in the Tianshui area are relatively small, their natural environments are quite different. Therefore, the precipitation isotopes observed in the different regions in the same period were different, especially during the monsoon transition period. According to the analysis of the principle of continental effect, the process of water vapor transporting through the ocean to the inland causes the continuous depletion of heavy isotopes. The water vapor transport path in the Tianshui area during the monsoon period may be through the Guanshan and the River Valley regions and then to the northwestern Weibei region. This principle also explains the extremely low short-term changes in precipitation isotopes in the Weibei region during the monsoon. Secondly, regional temperature and humidity are the main factors that affect the evaporation of raindrops during the fall and the participation of recycled water vapor is also a factor that leads to changes in precipitation isotopes in different regions.

3.2. Local Meteoric Water Line (LMWL)

Due to the isotope fractionation during the evaporation and condensation process of water vapor in the place of origin, there is an obvious linear relationship between δ18O and δD in atmospheric precipitation. In the early days, Craig [32] used the Global Network of Isotope in Precipitation (GNIP) to analyze and discover this obvious law and defined this relationship as the global meteoric water line (GMWL), which is δD = 8δ18O + 10. Affected by ground weather conditions, different regions have local meteoric water lines (LMWL) that reflect their precipitation patterns. Analyzing the local meteoric water line can provide a reference for the study of the local water cycle process [33,34,35].
According to the least square method, the local meteoric water lines in the Weibei, the River Valley and the Guanshan regions were obtained (Figure 3). It can be seen from Figure 3 that the slope and intercept of the atmospheric precipitation line in the different periods of the three natural subregions in the Tianshui area were different from the global meteoric water line (δD = 8δ18O + 10). The slopes and intercepts of the River Valley and the Guanshan regions during the monsoon period were lower than those in the pre-monsoon and post-monsoon periods. On the contrary, the Weibei region is a semi-arid area due to its low annual precipitation and the area has high temperatures and low humidity. In the pre-monsoon period, the average daily precipitation in all precipitation events is only 4.6 mm; the evaporation is much greater than the precipitation and the slope of the meteoric water line is relatively lower than in the monsoon and post-monsoon periods.
In general, through the analysis of the meteoric water line during the entire study period (Figure 3d), the slopes and intercepts of the River Valley(δD = 7.822δ18O + 9.965)and the Guanshan(δD = 7.954δ18O + 7.554)regions were not significantly different from the global meteoric water line. However, in the northwestern Weibei region(δD = 7.457δ18O + 5.873), the meteoric water line had a lower slope and a smaller intercept, which showed that due to the low relative humidity in the dry climate of the Weibei region raindrops were obviously affected by below-cloud secondary evaporation in the process of forming precipitation through condensation. At the same time, in the process of water vapor transportation, the degree of isotope fractionation increased as it went to the northwest inland areas.

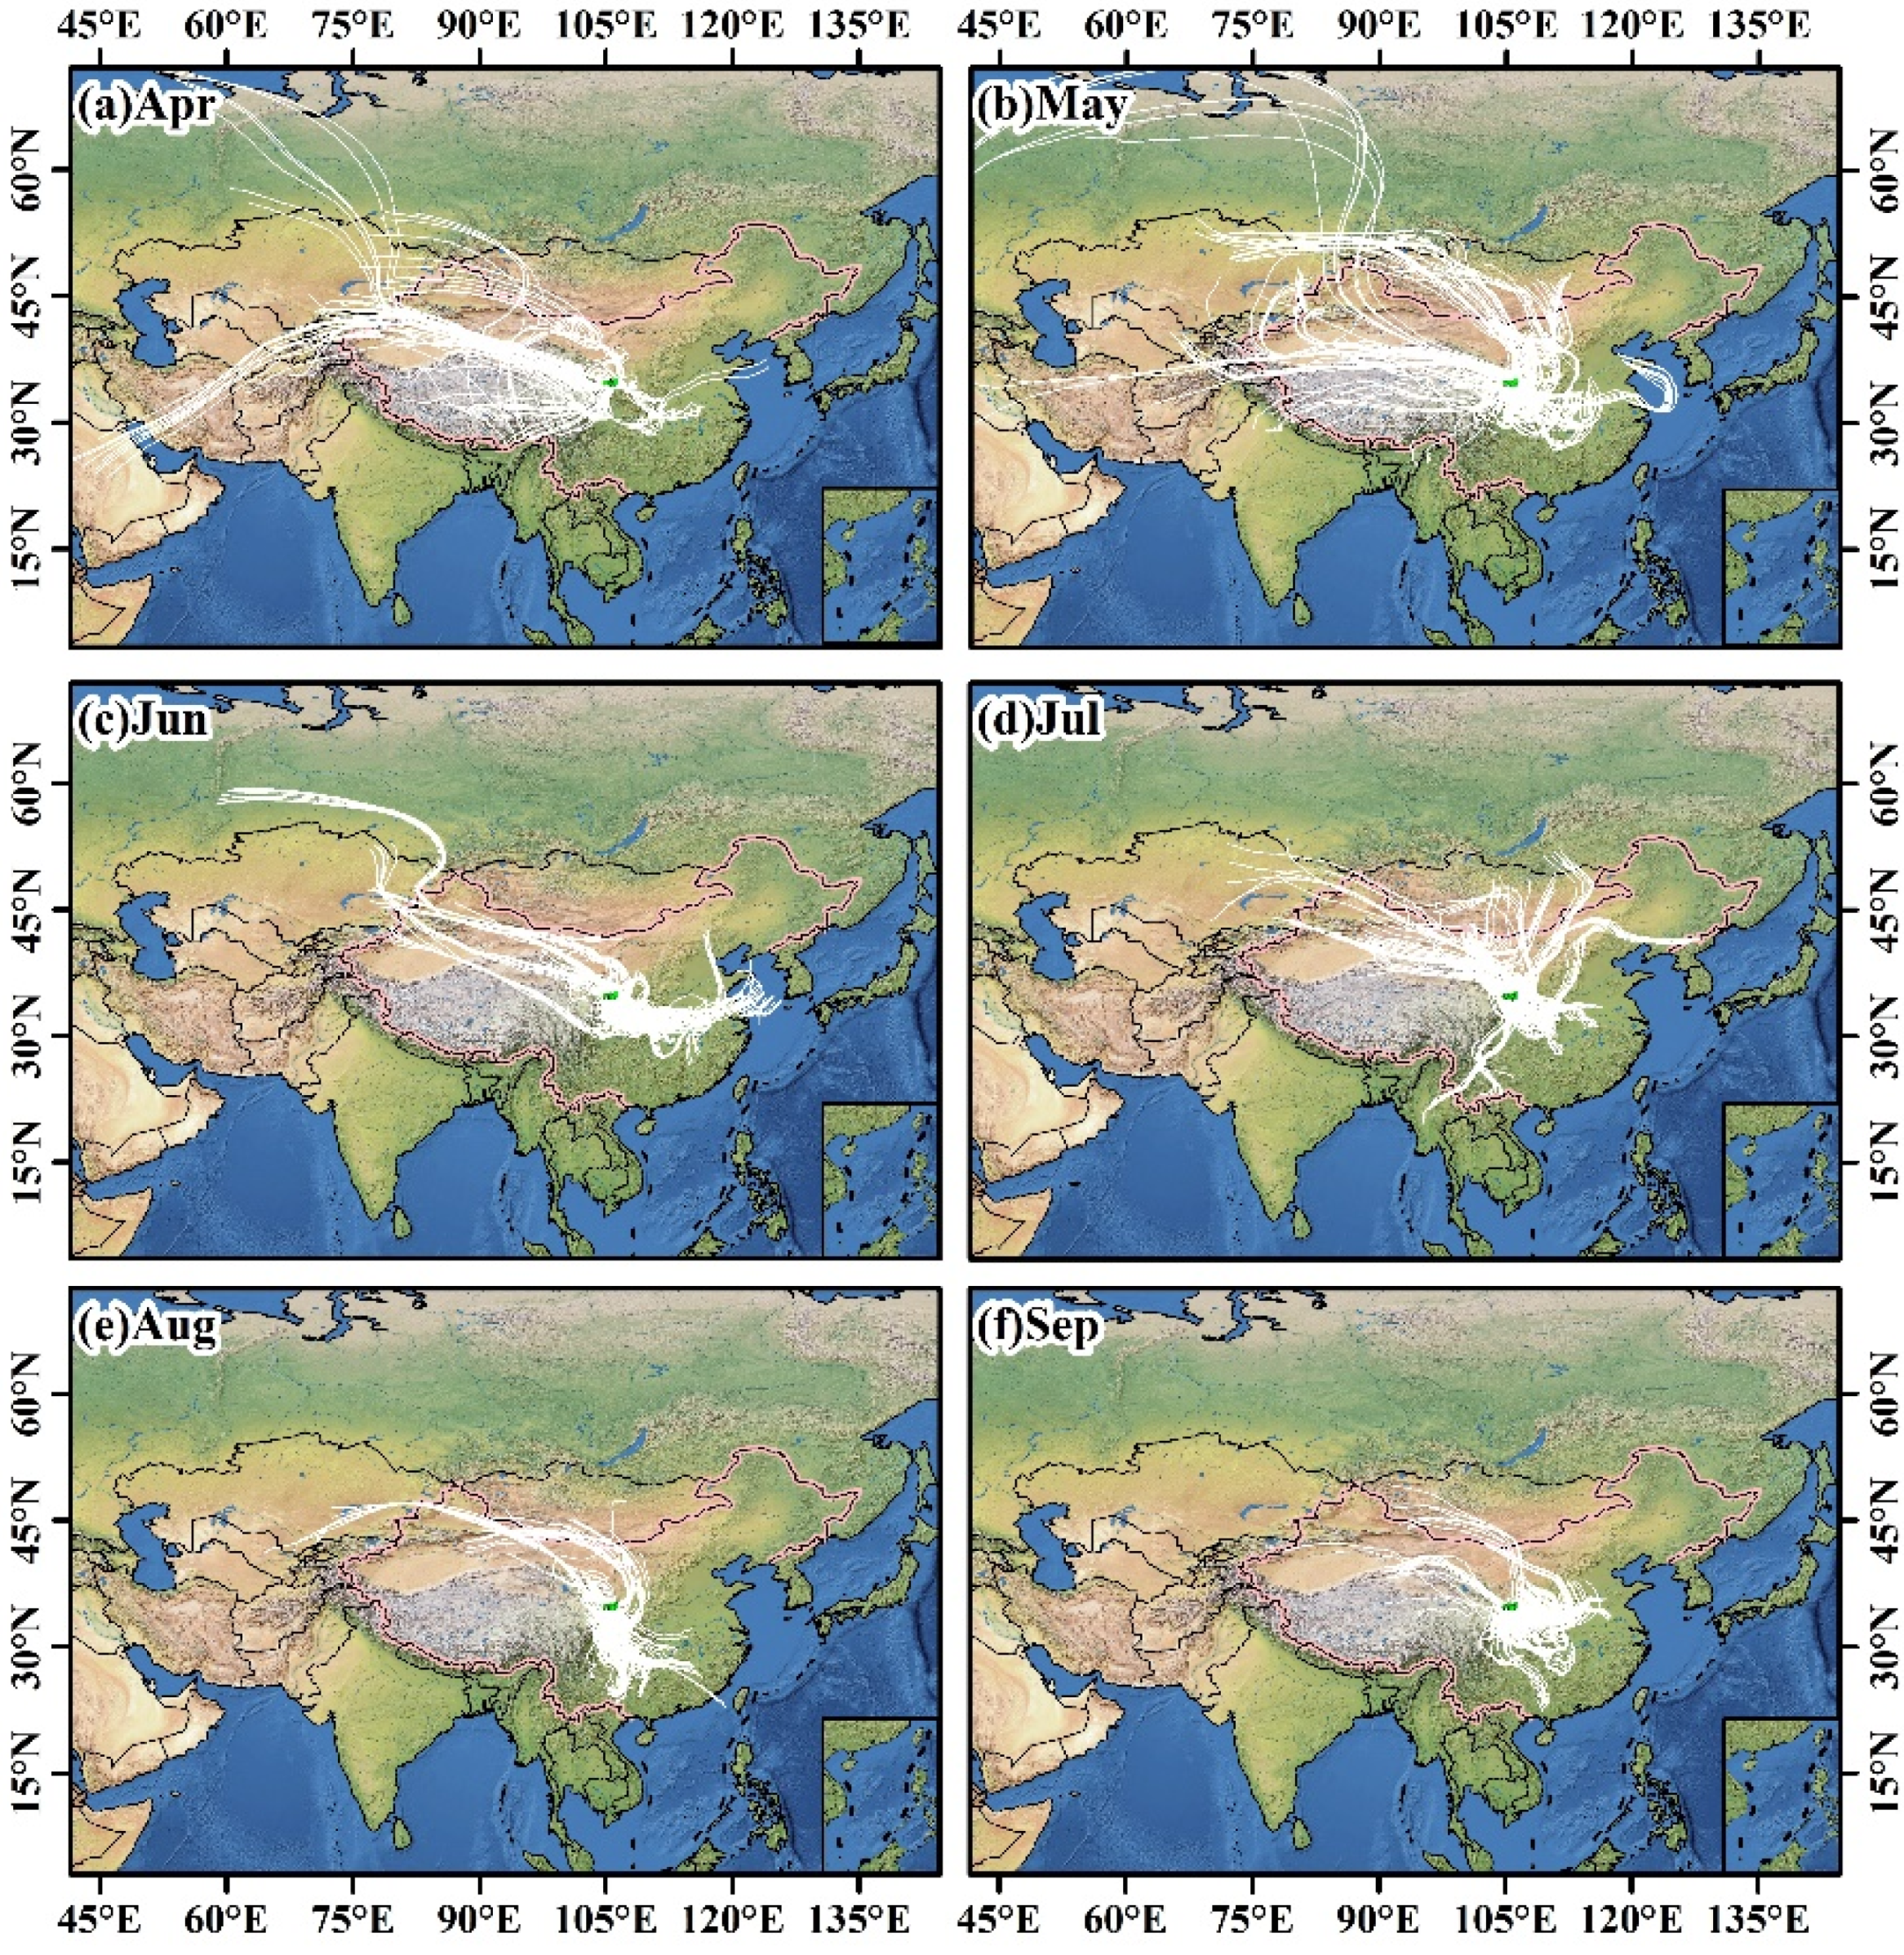
3.3. Air Mass Trajectory and Regional Convection

Convective activities in the atmosphere and different sources of water vapor are another important factor that affect stable isotopes in precipitation during the monsoon period [36,37]. In order to further analyze the change characteristics of stable isotopes of precipitation before and after the monsoon in the Tianshui area, we studied the water vapor sources and large-scale convective activities of precipitation events at various sampling points from April to September 2019.
OLR data can directly reflect the intensity of atmospheric convection activity and indicate the center position of the subtropical high and its moving path. OLR is negatively correlated with the intensity of convection [38,39]; that is, the lower the OLR value, the stronger the convection. Low OLR values are often used to determine the onset of tropical convection and monsoon precipitation [40,41].
The analysis of the results showed that in the pre-monsoon period, the water source area was originally controlled by the subtropical high pressure controlled by the Indian Ocean low pressure, which represented part of the southward water vapor. It could be seen from the water vapor backward trajectory (Figure 4) that the study area was dominated by the westerly zone. However, the water vapor at the seven sampling points on 7 May 2019 obviously came from the western Pacific. The δ18O value in the precipitation was also at the lowest value during the entire pre-monsoon period and the average value was −11.22‰.
In June 2019, the Bay of Bengal intertropical convergence zone (ITCZ) continued to deepen and the OLR values in the Bay of Bengal and Western India were low. At the same time, there was a certain range of convective activity in the Pacific Northwest (Figure 5). Analysis found that a clear southeast monsoon water vapor channel had been established in June 2019. At this time, it was the initial stage of the monsoon reaching the Tianshui area. The monsoon precipitation caused by strong convective activity made the short-term δ18O continuously deplete. This result also verified the speculative analysis in Section 3.1. In July and August 2019, with the northward movement of the Bay of Bengal ITCZ and the establishment and prosperity of the western Pacific ITCZ, the change in the OLR value was at the lowest value for the entire period (OLR < 140W/m²) and strong convective activity made the southeast monsoon become the main water vapor transport channel in the Tianshui area. The southwest monsoon brought abundant precipitation to South China and Central China and there was very little water vapor directly reaching the Tianshui area. However, the backward trajectories on 28, 29 and 31 July 2019 indicated that long distance water vapor in the Bay of Bengal still existed. A few studies [42,43] have found that middle and late September is an important node period when the monsoon subsides and the westerly circulation establishes. The center of maritime low pressure begins to move south and even fades. The water vapor source in the Tianshui area was again dominated by westerly winds and the δ18O in precipitation was relatively enriched. With the return of the subtropical high, the correlation between the OLR and isotopes in precipitation also disappeared.
In summary, the sources of water vapor in the different natural subregions in the Tianshui area were generally consistent and there were obvious temporal changes during the monsoon transition period. During the transition period from the pre-monsoon to the monsoon, the source of water vapor began to change from relatively simple to complex and the precipitation isotopes also changed accordingly. Due to the strong regional convective activity during the monsoon period, the oceanic air masses became the main water source area in the Tianshui area and the long distance transportation of water vapor caused the relative depletion of isotopes. Subsequently, the δ18O value in the precipitation during the post-monsoon period decreased first and then increased, which may have been caused by the weakening of the southeast monsoon and the participation of local re-evaporated water vapor. Although the change of recycled water vapor was more complicated and its specific mechanism has not been analyzed in depth, the change of precipitation isotopes was still obvious. In short, the use of backward trajectory models and convective activities clearly reflected the change characteristics of precipitation isotopes to a certain extent.

4. Conclusions

In this study, we analyzed for the first time the isotopes in daily precipitation and meteorological data of three different natural areas in the Tianshui area during pre-monsoon, monsoon and post-monsoon periods. The overall analysis showed that the temperature effect of the Tianshui area changed with the seasons. During the non-monsoon period (pre-monsoon and post-monsoon), the change of δ18O in precipitation was mainly controlled by temperature; during the monsoon period, the intensity of the convective activity and precipitation were the main influencing factors. However, during the entire study period, the relationship between the surface air temperature and δ18O in precipitation in the Weibei region, the River Valley region and the Guanshan region was significant and their gradients were 0.41‰/°C, 0.27‰/°C and 0.35‰/°C, respectively. The Guanshan region to the Weibei region in the Tianshui area is in a special position in the transition from a semi-humid to a semi-arid area in China. In addition, the slope and intercept of the meteoric water line decreased significantly in sequence and changed greatly in different periods. At the same time, further research found that during the summer monsoon, the Tianshui area had obvious southeast monsoon water vapor caused by large-scale convective activities but there was still water vapor in the Bay of Bengal that had been transported over long distances in certain time periods.

Author Contributions

Conceptualization, F.C.; Software, X.Z.; Validation, X.Z.; Formal analysis, X.Z.; Investigation, X.Z.; Methodology, X.Z. and F.C; Resources, X.W. and R.Q.; Data curation, S.W.; Writing—original draft preparation, X.Z.; Writing—review and editing, X.Z. and F.C.; Supervision, X.L.; Funding acquisition, F.C. All authors have read and agreed to the published version of the manuscript.

Funding

The study was supported by the Scientific Research Program of Higher Education Institutions of Gansu Province Nos. 2018C-02.

Acknowledgments

The authors greatly thank colleagues in the Northwest Normal University for their help in the laboratory analysis. Special thanks are given to the anonymous reviewers for their constructive comments.

Conflicts of Interest

The authors declare no conflict of interest. The work described here has not been submitted elsewhere for publication, in whole or in part, and all the authors listed have approved the manuscript that is enclosed.

References

  1. Johnsen, S.J.; Dansgaard, W.; Clausen, H.B.; Langway, C.C., Jr. Oxygen isotope profiles through the Antarctic and Greenland ice sheets. Nature 1972, 235, 429–434. [Google Scholar] [CrossRef]
  2. Dansgaard, W. Stable isotopes in precipitation. Tellus 1964, 16, 436–468. [Google Scholar] [CrossRef]
  3. Merz, N.; Gfeller, G.; Born, A.; Raible, C.; Stocker, T.; Fischer, H. Influence of ice sheet topography on Greenland precipitation during the Eemian interglacial. J. Geophys. Res. Atmos. 2014, 119, 10749–10768. [Google Scholar] [CrossRef] [Green Version]
  4. Wang, S.J.; Zhang, M.J.; Che, Y.J.; Chen, F.L.; Qiang, F. Contribution of recycled moisture to precipitation in oases of arid central Asia: A stable isotope approach. Water Resour. Res. 2016, 52, 3246–3257. [Google Scholar] [CrossRef] [Green Version]
  5. Peng, T.R.; Wang, C.H.; Huang, C.C.; Fei, L.; Chen, C.T.; Hwong, J.L. Stable isotopic characteristic of Taiwan’s precipitation: A case study of western Pacific monsoon region. Earth. Planet. Sci. Lett. 2010, 289, 357–366. [Google Scholar] [CrossRef]
  6. Ansari, A.; Noble, J.; Deodhar, A.; Saravana Kumar, U. Atmospheric factors controlling the stable isotopes (δ18O and δH) of the Indian Summer Monsoon precipitation in a drying region of Eastern India. J. Hydrol. 2020. [Google Scholar] [CrossRef]
  7. Zhang, T.; Zhang, Y.S.; Guo, Y.H.; Ma, N.; Dai, D.; Song, H.T.; Qu, D.M.; Gao, H.F. Controls of stable isotopes in precipitation on the central Tibetan Plateau: A seasonal perspective. Quat. Int. 2019, 513, 66–79. [Google Scholar] [CrossRef]
  8. Nlend, B.; Celle-Jeanton, H.; Risi, C.; Pohl, B.; Huneau, F.; Boum-Nkot, S.N.; Seze, G.; Roucou, P.; Camberlin, P.; Étamé, J.; et al. Identification of processes that control the stable isotope composition of rainwater in the humid tropical West-Central Africa. J. Hydrol. 2020, 584. [Google Scholar] [CrossRef]
  9. Joswiak, D.R.; Yao, T.; Wu, G.; Tian, L.; Xu, B. Ice-core evidence of westerly and monsoon moisture contributions in the central Tibetan Plateau. J. Glaciol. 2013, 59, 56–66. [Google Scholar] [CrossRef] [Green Version]
  10. Yao, T.; Masson-Delmotte, V.; Gao, J.; Yu, W.; Yang, X.; Risi, C.; Sturm, C.; Werner, M.; Zhao, H.; He, Y.; et al. A review of climatic controls on δ18O in precipitation over the Tibetan Plateau: Observations and simulations. Rev. Geophys. 2013, 51, 525–548. [Google Scholar] [CrossRef]
  11. Yu, W.S.; Yao, T.D.; Tian, L.D.; Ma, Y.M.; Wen, R.; Devkota, L.P.; Wang, W.C.; Qu, D.; Chhetri, T.B. Short-term variability in the dates of the Indian monsoon onset and retreat on the southern and northern slopes of the central Himalayas as determined by precipitation stable isotopes. Clim. Dyn. 2016, 47, 159–172. [Google Scholar] [CrossRef]
  12. Yu, W.S.; Wei, F.L.; Ma, Y.M.; Liu, W.J.; Zhang, Y.Y.; Luo, L.; Tian, L.D.; Xu, B.Q.; Qu, D.M. Stable isotope variations in precipitation over Deqin on the southeastern margin of the Tibetan Plateau during different seasons related to various meteorological factors and moisture sources. Atmos. Res. 2016, 170, 123–130. [Google Scholar] [CrossRef]
  13. He, S.; Richards, K. Stable isotopes in monsoon precipitation and water vapour in Nagqu, Tibet, and their implications for monsoon moisture. J. Hydrol. 2016, 540, 615–622. [Google Scholar] [CrossRef]
  14. Tian, L.D.; Yu, W.S.; Schuster, P.F.; Wen, R.; Cai, Z.Y.; Wang, D.; Shao, L.L.; Cui, J.P.; Guo, X.Y. Control of seasonal water vapor isotope variations at Lhasa, southern Tibetan Plateau. J. Hydrol. 2020, 580. [Google Scholar] [CrossRef]
  15. Li, Z.X.; Feng, Q.; Yong, S.; Wang, Q.J.; Jiao, Y.; Li, Y.G.; Li, J.G.; Guo, X.Y. Stable isotope composition of precipitation in the south and north slopes of Wushaoling Mountain, northwestern China. Atmos. Res. 2016, 182, 87–101. [Google Scholar] [CrossRef]
  16. Zhu, G.F.; Guo, H.W.; Qin, D.H.; Pan, H.X.; Zhang, Y.; Jia, W.X.; Ma, X.G. Contribution of recycled moisture to precipitation in the monsoon marginal zone: Estimate based on stable isotope data. J. Hydrol. 2019, 569, 423–435. [Google Scholar] [CrossRef]
  17. Ma, Q.; Zhang, M.J.; Wang, S.J.; Wang, Q.; Liu, W.L.; Li, F.; Chen, F.L. An investigation of moisture sources and secondary evaporation in Lanzhou, Northwest China. Environ. Earth Sci. 2014, 71, 3375–3385. [Google Scholar] [CrossRef]
  18. Chen, F.L.; Zhang, M.J.; Ma, Q.; Wang, S.J.; Li, X.F.; Zhu, X.F. Stable isotopic characteristics of precipitation in Lanzhou City and its surrounding areas, Northwest China. Environ. Earth. Sci. 2015, 73, 4671–4680. [Google Scholar] [CrossRef]
  19. Landwehr, J.M.; Coplen, T.B.; Stewart, D.W. Spatial, seasonal, and source variability in the stable oxygen and hydrogen isotopic composition of tap waters throughout the USA. Hydrol. Process. 2014, 28, 5382–5422. [Google Scholar] [CrossRef]
  20. Hui, Z.C.; Li, J.J.; Xu, Q.H.; Song, C.H.; Zhang, J.; Wu, F.L.; Zhao, Z.J. Miocene vegetation and climatic changes reconstructed from a sporopollen record of the Tianshui Basin, NE Tibetan Plateau. Palaeogeogr. Palaeoclimatol. Palaeoecol. 2011, 308, 373–382. [Google Scholar] [CrossRef]
  21. Liu, Y.M.; Zhang, M.J.; Wang, S.J.; Qiang, F.; Che, Y.J. Interannual variation of stable hydrogen and oxygen isotopes in precipitation in Arid North west China Based on GCMs. Res. Soil Water Conserv. 2016, 23, 260–267. (In Chinese) [Google Scholar] [CrossRef]
  22. Wu, W.J. Landslide and debris flow hazards in City of Tianshui. Hydrogeol. Eng. Geol. 2003, 30, 75–78. [Google Scholar] [CrossRef]
  23. Wan, Z.W.; Xu, Y.P.; Yao, X.L.; Xu, Y.K. Impact of climate change on peach yield at Tianshui, Gansu in recent 30 years. Arid Land Geogr. 2016, 39, 738–746. [Google Scholar] [CrossRef]
  24. Yu, W.S.; Tian, L.D.; Ma, Y.M.; Xu, B.Q. Simultaneous monitoring of stable oxygen isotope composition in water vapour and precipitation over the central Tibetan Plateau. Atmos. Chem. Phys. 2015, 15, 10251–10262. [Google Scholar] [CrossRef] [Green Version]
  25. Aggarwal, P.K.; Froehlich, K.; Kulkarni, K.M.; Gourcy, L.L. Stable isotope evidence for moisture sources in the Asian summer monsoon under present and past climate regimes. Geophys. Res. Lett. 2004, 31. [Google Scholar] [CrossRef]
  26. Araguas-Araguas, L.; Froehlich, K.; Rozanski, K. Deuterium and oxygen-18 isotopes composition of precipitation and atmospheric moisture. Hydrol. Process. 2000, 14, 1341–1355. [Google Scholar] [CrossRef]
  27. Miyake, Y. An isotopic study on meteoric precipitation. Pap. Meteorol. Geophys. 1968, 19, 243–266. [Google Scholar] [CrossRef]
  28. Cappa, C.D.; Hendricks, M.B.; DePaolo, D.J.; Cohen, R.C. Isotopic fractionation of water during evaporation. J. Geophys. Res. Atmos. 2003, 108, 1–10. [Google Scholar] [CrossRef]
  29. Chen, X.; Li, Z.; Cheng, L.P.; Liu, W.Z.; Wang, R. Analysis of stable isotopic composition and vapor source of precipitation at the Changwu Loess Tableland. Acta Ecol. Sin. 2016, 36, 98–106. [Google Scholar] [CrossRef]
  30. Wan, H.; Liu, W.G.; Xing, M. Isotopic composition of atmospheric precipitation and its tracing significance in the Laohequ Basin, Loess plateau, China. Sci. Total Environ. 2018, 640, 989–996. [Google Scholar] [CrossRef]
  31. Cai, Z.Y.; Tian, L.D. Atmospheric controls on seasonal and interannual variations in the precipitation isotope in the East Asian Monsoon region. J. Clim. 2015, 39, 1339–1352. [Google Scholar] [CrossRef]
  32. Craig, H. Isotopic variations in meteoric waters. Science 1961, 133, 1702–1703. [Google Scholar] [CrossRef]
  33. Lucianetti, G.; Penna, D.; Mastrorillo, L.; Mazza, R. The Role of Snowmelt on the Spatio-Temporal Variability of Spring Recharge in a Dolomitic Mountain Group, Italian Alps. Water 2020, 12, 2256. [Google Scholar] [CrossRef]
  34. Cervi, F.; Dadomo, A.; Martinelli, G. The Analysis of Short-Term Dataset of Water Stable Isotopes Provides Information on Hydrological Processes Occurring in Large Catchments from the Northern Italian Apennines. Water 2019, 11, 1360. [Google Scholar] [CrossRef] [Green Version]
  35. Conroy, J.L.; Noone, D.; Cobb, K.M.; Moerman, J.W.; Konecky, B.L. Paired stable isotopologues in precipitation and vapor: A case study of the amount effect within western tropical Pacific storms. J. Geophys. Res. Atmos. 2016, 121, 3290–3303. [Google Scholar] [CrossRef] [Green Version]
  36. Breitenbach, S.F.M.; Adkins, J.F.; Meyer, H.; Marwan, N.; Kumar, K.K.; Haug, G.H. Strong influence of water vapor source dynamics on stable isotopes in precipitation observed in Southern Meghalaya, NE India. Earth Planet. Sci. Lett. 2010, 292, 212–220. [Google Scholar] [CrossRef]
  37. Gao, J.; Masson-Delmotte, V.; Risi, C.; He, Y.; Yao, T.D. What controls precipitation δ18O in the southern Tibetan Plateau at seasonal and intra-seasonal scales? A case study at Lhasa and Nyalam. Tellus 2013, B65, 21043. [Google Scholar] [CrossRef]
  38. Risi, C.; Bony, S.; Vimeux, F. Influence of convective processes on the isotopic composition (18O and 2H) of precipitation and water vapor in the tropics: 2. Physical interpretation of the amount effect. J. Geophys. Res. 2008, 113, D19306. [Google Scholar] [CrossRef]
  39. Guo, X.Y.; Tian, L.D.; Wen, R.; Yu, W.S.; Qu, D.M. Controls of precipitation δ18O on the northwestern Tibetan Plateau: A case study at Nagari station. Atmos. Res. 2017, 189, 141–151. [Google Scholar] [CrossRef]
  40. Susskind, J.; Molnar, G.; Iredell, L.; Loeb, N.G. Interannual variability of outgoing long wave radiation as observed by AIRS and CERES. J. Geophys. Res. Atmos. 2012, 117, D23107. [Google Scholar] [CrossRef]
  41. Sandeep, S.; Stordal, F. Use of OLR data in detecting precipitation extremes in the tropics. Remote Sens. Lett. 2013, 4, 570–578. [Google Scholar] [CrossRef]
  42. Qin, X.; Yao, T.D.; Lin, S.; Sun, W.Z. The features of δ18O and its relation to vapor sources of snowfall in Dasuopu Glacier on peak Xixabangma. J. Glaciol. Geocryol. 1999, 21, 237–241. [Google Scholar]
  43. Xu, Y.W.; Kang, S.C.; Zhou, S.Q.; Cong, Z.Y.; Chi, Y.Y.; Zhang, Q.G. Variations of δ18O in summer and autumn precipitation and their relationships with moisture source and air temperature in Nam Lake Basin, Tibet Plateau. Sci. Geogr. Sin. 2007, 27, 718–723. [Google Scholar] [CrossRef]
Figure 1. The three natural subregions of the sampling sites in the Tianshui area (marked using dashed white lines). Spatial distribution of altitude in the Tianshui area is derived from China 30 Arc-Second Elevation (GDEMV2; http://www.gscloud.cn/). The satellite-derived land cover base map is from Natural Earth (http://www.naturalearthdata.com). (ac) Monthly mean air temperatures (T) and total precipitation (P) at the Weibei, the River Valley and the Guanshan regions. The line represents air temperature (T) and histogram represents precipitation (P).
Water 12 02391 g001
Figure 2. Temporal variation of daily precipitation δ18O and local precipitation amount, temperature and vapor pressure at Guanshan (a), River Valley (b) and Weibei (c). The grey, blank and oblique lines represent pre-monsoon, monsoon and post-monsoon seasons, respectively.
Water 12 02391 g002
Figure 3. Relationships between δ18O and δD in precipitation at Weibei (a), River Valley (b) and Guanshan (c), respectively within the different seasons. (d) represents the entire study area.
Water 12 02391 g003
Figure 4. Back trajectories simulated by HYSPLIT model for the Tianshui area in April (a), May (b), June (c), July (d), August (e) and September 2019 (f). The white lines are the daily precipitation event vapor trajectories during the preceding five days (120 h) at 1500 m agl (above the ground level).
Water 12 02391 g004
Figure 5. The distribution of OLR in (a) April, (b) May, (c) June, (d) July, (e) August and (f) September 2019. The red rectangle shows the Zone 1 region discussed in the text.
Water 12 02391 g005
Table 1. Sampling stations in study area.
ItemsStationLatitude (° N)Longitude (° E)Altitude (m)Sample Number
Guanshan RegionZhangchuan34.99106.211664.554
Qingshui34.75106.151378.243
River Valley RegionQinzhou34.58105.761141.649
Maiji34.56105.881085.253
Weibei RegionQinan34.86105.651216.140
Gangu34.75105.331271.929
Wushan34.73104.921495.452
Table 2. Statistical correlations between daily precipitation δ18O and local meteorological parameters at Guanshan, River Valley and Weibei during the different seasons.
δ18O-Tδ18O-Vpδ18O-Pδ18O-RHδ18O-Ap
Guanshan RegionPre-monsoon0.641 **0.376 *0.0214−0.464 **−0.0766
Monsoon0.006−0.281−0.128−0.2830.133
Post-monsoon0.200.06−0.36−0.48 *−0.02
River Valley RegionPre-monsoon0.549 **0.2410.0304−0.465 *−0.172
Monsoon−0.104−0.49 **−0.265−0.364 *−0.126
Post-monsoon−0.133–0.12−0.05−0.08−0.06
Weibei RegionPre-monsoon0.446 **0.114−0.0644−0.311 *−0.104
Monsoon−0.0664−0.554 **−0.0907−0.304−0.194
Post-monsoon−0.06−0.08−0.03−0.090.11
Note: “T”: temperature (°C); “Vp”: vapor pressure (hPa); “P”: precipitation amount (mm); “RH”: relative humidity (%); “Ap”: atmospheric pressure (hPa). Numbers with “**” indicate significance for 99% confidence level; “*” for 95% confidence level; numbers without asterisks did not pass the significant test.

