Article

A Holistic Modelling Approach for the Estimation of Return Levels of Peak Flows in Bavaria

1
Department of Geography, Ludwig-Maximilians-Universität München, 80333 Munich, Germany
2
Leibniz Supercomputing Centre, Garching, 85748 Munich, Germany
3
Federal Office for Radiation Protection, 85764 Oberschleißheim, Germany
*
Author to whom correspondence should be addressed.
Water 2020, 12(9), 2349; https://doi.org/10.3390/w12092349
Submission received: 20 July 2020 / Revised: 15 August 2020 / Accepted: 18 August 2020 / Published: 21 August 2020
(This article belongs to the Section Hydrology)

Abstract

:
This study introduces a holistic approach for the hydrological modelling of peak flows for the major Bavarian river basins, referred to as Hydrological Bavaria. This approach, intended to develop a robust modelling framework to support water resources management under climate change conditions, comprises a regionalized parameterization of the water balance simulation model (WaSiM) for 98 catchments in high temporal (3 h) and spatial (500 m) resolution using spatially coherent information and an automatized calibration (dynamically dimensioned search–simulated annealing, DDS-SA) for storage components. The performance of the model was examined using common metrics (Nash & Sutcliffe Efficiency (NSE), Kling-Gupta Efficiency (KGE)). The simulations provided the means for the calculation of a level of trust (LOT) by comparing observed and simulated high flows with a five, ten, and 20-year return period. These estimates were derived by the Generalized Pareto Distribution (GPD) applying the peak over threshold (POT) sampling method. Results show that the model overall performs well with regard to the selected objective measures, but also exhibits regional disparities mainly due to the availability of meteorological inputs or water management data. For most catchments, the LOT shows moderate to high confidence in the estimation of return periods with the hydrological model. Therefore, we consider the holistic modelling approach applicable for climate change impact studies concerned with dynamic alterations in peak flows.

1. Introduction

Within the last three decades hydrological extreme events (i.e., major floods and droughts) frequently occurred in Bavaria (floods: 1999, 2002, 2005, 2013, 2016; droughts: 2003, 2007, 2011, 2015, 2018). Such events impose severe risk and damage to infrastructure, economies, and civil security and–according to the Intergovernmental Panel on Climate Change (IPCC)–are likely to amplify in the future due to changes in extreme precipitation [1,2]. Providing a hydrological modelling scheme that will remain applicable under changing (climatic) driving conditions requires a high-resolution, process-based, and spatially explicit and thus often computationally demanding solution tool. The ever-increasing computational power (especially the application of high-performance computing (HPC)) allows for new approaches to be developed and applied to investigate current and future extreme events. Most hydrological models-usually driven by daily data on the mesoscale (i.e., 102 to 104 km2 [3])–are supposed to sufficiently simulate mean hydrological conditions and long-term water balances using different approaches. However, observed hydrological extreme events show, that over complex terrain processes on shorter timescales are important and that peak flows are underestimated on daily timescales.
In order to investigate the possible changes in extreme hydrological events for Bavarian catchments the ClimEx project (Climate Change and Extreme Events–Risks and Perspectives for Water Resources Management in Bavaria and Québec) was founded to investigate and assess changes in hydro-meteorological extreme events induced by a changing climate. In this project a complex model chain was introduced comprising the creation of a large ensemble of a single initial condition climate model [4] employing the IPCC emission scenario (Representative Concentration Pathways RCP8.5 [5]). The project concludes in an application of these data for a hydrological model to investigate the impacts of climate change on the hydrology of Bavaria.
In recent years, several other studies focused on the analysis of the impacts of climate or global change on the water resources of the Danube [6,7,8]. Therefore, these studies employed different climate models to drive different hydrological models (e.g., PROMET [9], WaSiM, former WaSiM-ETH [10]) to assess climate induced changes in the hydrology of the upper Danube basin by measures of mean yearly and monthly flows. Apart from the model PROMET, the hydrological models applied in these studies were locally calibrated for each sub-catchment and were set up on rather coarse spatio-temporal resolutions. In Bavaria changes in frequency and intensity of hydrological extreme events have so far not been extensively investigated. In a recent study by Hattermann et al. [11] the semi-distributed hydrological model SWIM (Soil and Water Integrated Model) [12] was employed to investigate possible future changes of flood events (frequency and intensity) in the entire Danube basin divided into 50 sub-catchments.
Hydrological simulations for individual catchments within a larger river basin are prone to equifinality of the parameters gained by local calibration since these parameters are non-unique and may vary from catchment to catchment [13,14,15]. However, Samaniego et al. [16] and Kouchi et al. [17] summarize that parameters for process based hydrological models operating on the mesoscale have to be calibrated as they cannot be measured. To overcome the issue of equifinality (i.e., multiple sets of parameters provide similar model performance [15]) and over-parameterization (i.e., fitting parameters to countervail flaws in the model structure and observations [18,19]) there are several approaches proposed by various authors. One of these approaches is the application of a macroscale model that employs a vast amount of gauges for a local calibration [18,20]. Another approach proposed by Gaborit et al. [18] is the use of a physically based hydrological model that does not require calibration over a large area (e.g., PROMET). However, this approach requires a profound database and is demanding in terms of labor and time [18,20]. Finally, the regionalization of model parameters among various but similar catchment is widely adopted for hydrological modelling on the mesoscale [14,16,18,19,21], also referred to as global parameterization [14,18]. This approach assumes that similar catchments exhibit a similar runoff behavior, with similarity being defined by spatial proximity or catchment characteristics (i.e., land use, topography, soil types) [15,18,19].
In this study, the hydrological model WaSiM is set up for the major Bavarian river basins, i.e., upper Danube (comprising Danube, its tributaries and the Inn), Main and small parts of the Elbe (hereafter referred to as Hydrological Bavaria) covering basins from different German states and adjacent countries (Austria and Switzerland). Following the work of Ricard et al. [14] and Gaborit et al. [18], this approach comprises the identification of a set of model parameters which are valid for similar catchment characteristics of the Hydrological Bavaria. Since the regionalization is conducted over an entire region rather than pre-selected individual catchments, we further refer to this approach as holistic. Hence, we opt for global model settings (i.e., one model approach representing a specific process of the hydrological cycle) if the model structure supports it. Therefore, the hydrological model WaSiM is set up using a database comprised of a single data set for each spatially distributed input (soil, land use, hydrogeology, and meteorology) to foster a holistic parameterization approach during the calibration.
To our knowledge, this is the first time a single hydrological model is set up for the 98 selected catchments of the entire Hydrological Bavaria in high spatial (500 m) and temporal (3 h) resolution. Hence, compared to preceding studies [6,8,9], the focus on the upper Danube basin is expanded with the Main basin. With regard to Hattermann et al. [11], the study area is narrowed but displayed in more detail in terms of examined gauges and sub-catchments. The global parameterization approach presented by Ricard et al. [14] and Gaborit et al. [18] is extended to interconnected rather than independent catchments an incorporated into a single model setup.
With regard to the aforementioned projected changes in hydrological extremes, the intention of the presented analysis in this paper is to provide a modelling framework to support the estimation of robust return levels of peak flows to foster climate change impact studies concerning high flows. Therefore, this paper seeks to provide insight about the capability of the holistic modelling approach (i.e., one set of parameters applied to a variety of catchments) to sufficiently represent the observed discharge, with a focus on peak flows and their return levels, at the 98 presented gauges distributed across the Hydrological Bavaria.

2. Study Area, Data, and Methods

2.1. Study Area

The study area illustrated in Figure 1 encompasses the catchments of three major river systems and its tributaries flowing inward and outward of Bavaria. Namely the upper Danube upstream of Achleiten, the river Main upstream of Frankfurt Osthafen, and the Inn river to its confluence with the Danube at the city of Passau. Furthermore, it comprises three minor tributaries to the Elbe catchment. The Hydrological Bavaria covers parts of multiple German states (Bavaria, Baden-Württemberg, Hessen, and Thuringia) along the upper Danube, Main and Elbe tributaries as well as parts of Austria and Switzerland on the Inn. For this study, the Hydrological Bavaria was further divided into 98 sub-catchments due to their importance for flood protection and representation of the respective catchment characteristics.
With an overall catchment size of approximately 103,200 km2 the Hydrological Bavaria includes different complex landscapes: the Alps in the South, the Alpine foreland north of the Alps bounded by the course of the Danube, the southern German escarpment and the eastern mountain ranges to the East. The elevation ranges from 90 m.a.s.l. at the gauge Frankfurt Osthafen in the North to 4049 m.a.s.l. at Piz Bernina (Switzerland) in the Southwest. Hence, the Hydrological Bavaria is characterized by a complex geography featuring a variety of runoff regimes [22] as well as different climatological conditions.
The rivers of the Hydrological Bavaria are in parts severely influenced by structural retention facilities (i.e., reservoirs for flood protection or hydro power generation) or transfer systems for drinking water supply or raising low flow levels in the Regnitz and Main river (e.g., Main-Donau-Channel). Only a few rivers remain in their natural condition. Besides these artificial retention structures, also natural lakes influence the discharge of rivers. These natural and artificial structures must be considered for the hydrological modelling to avoid large deviations between simulated and observed runoff.
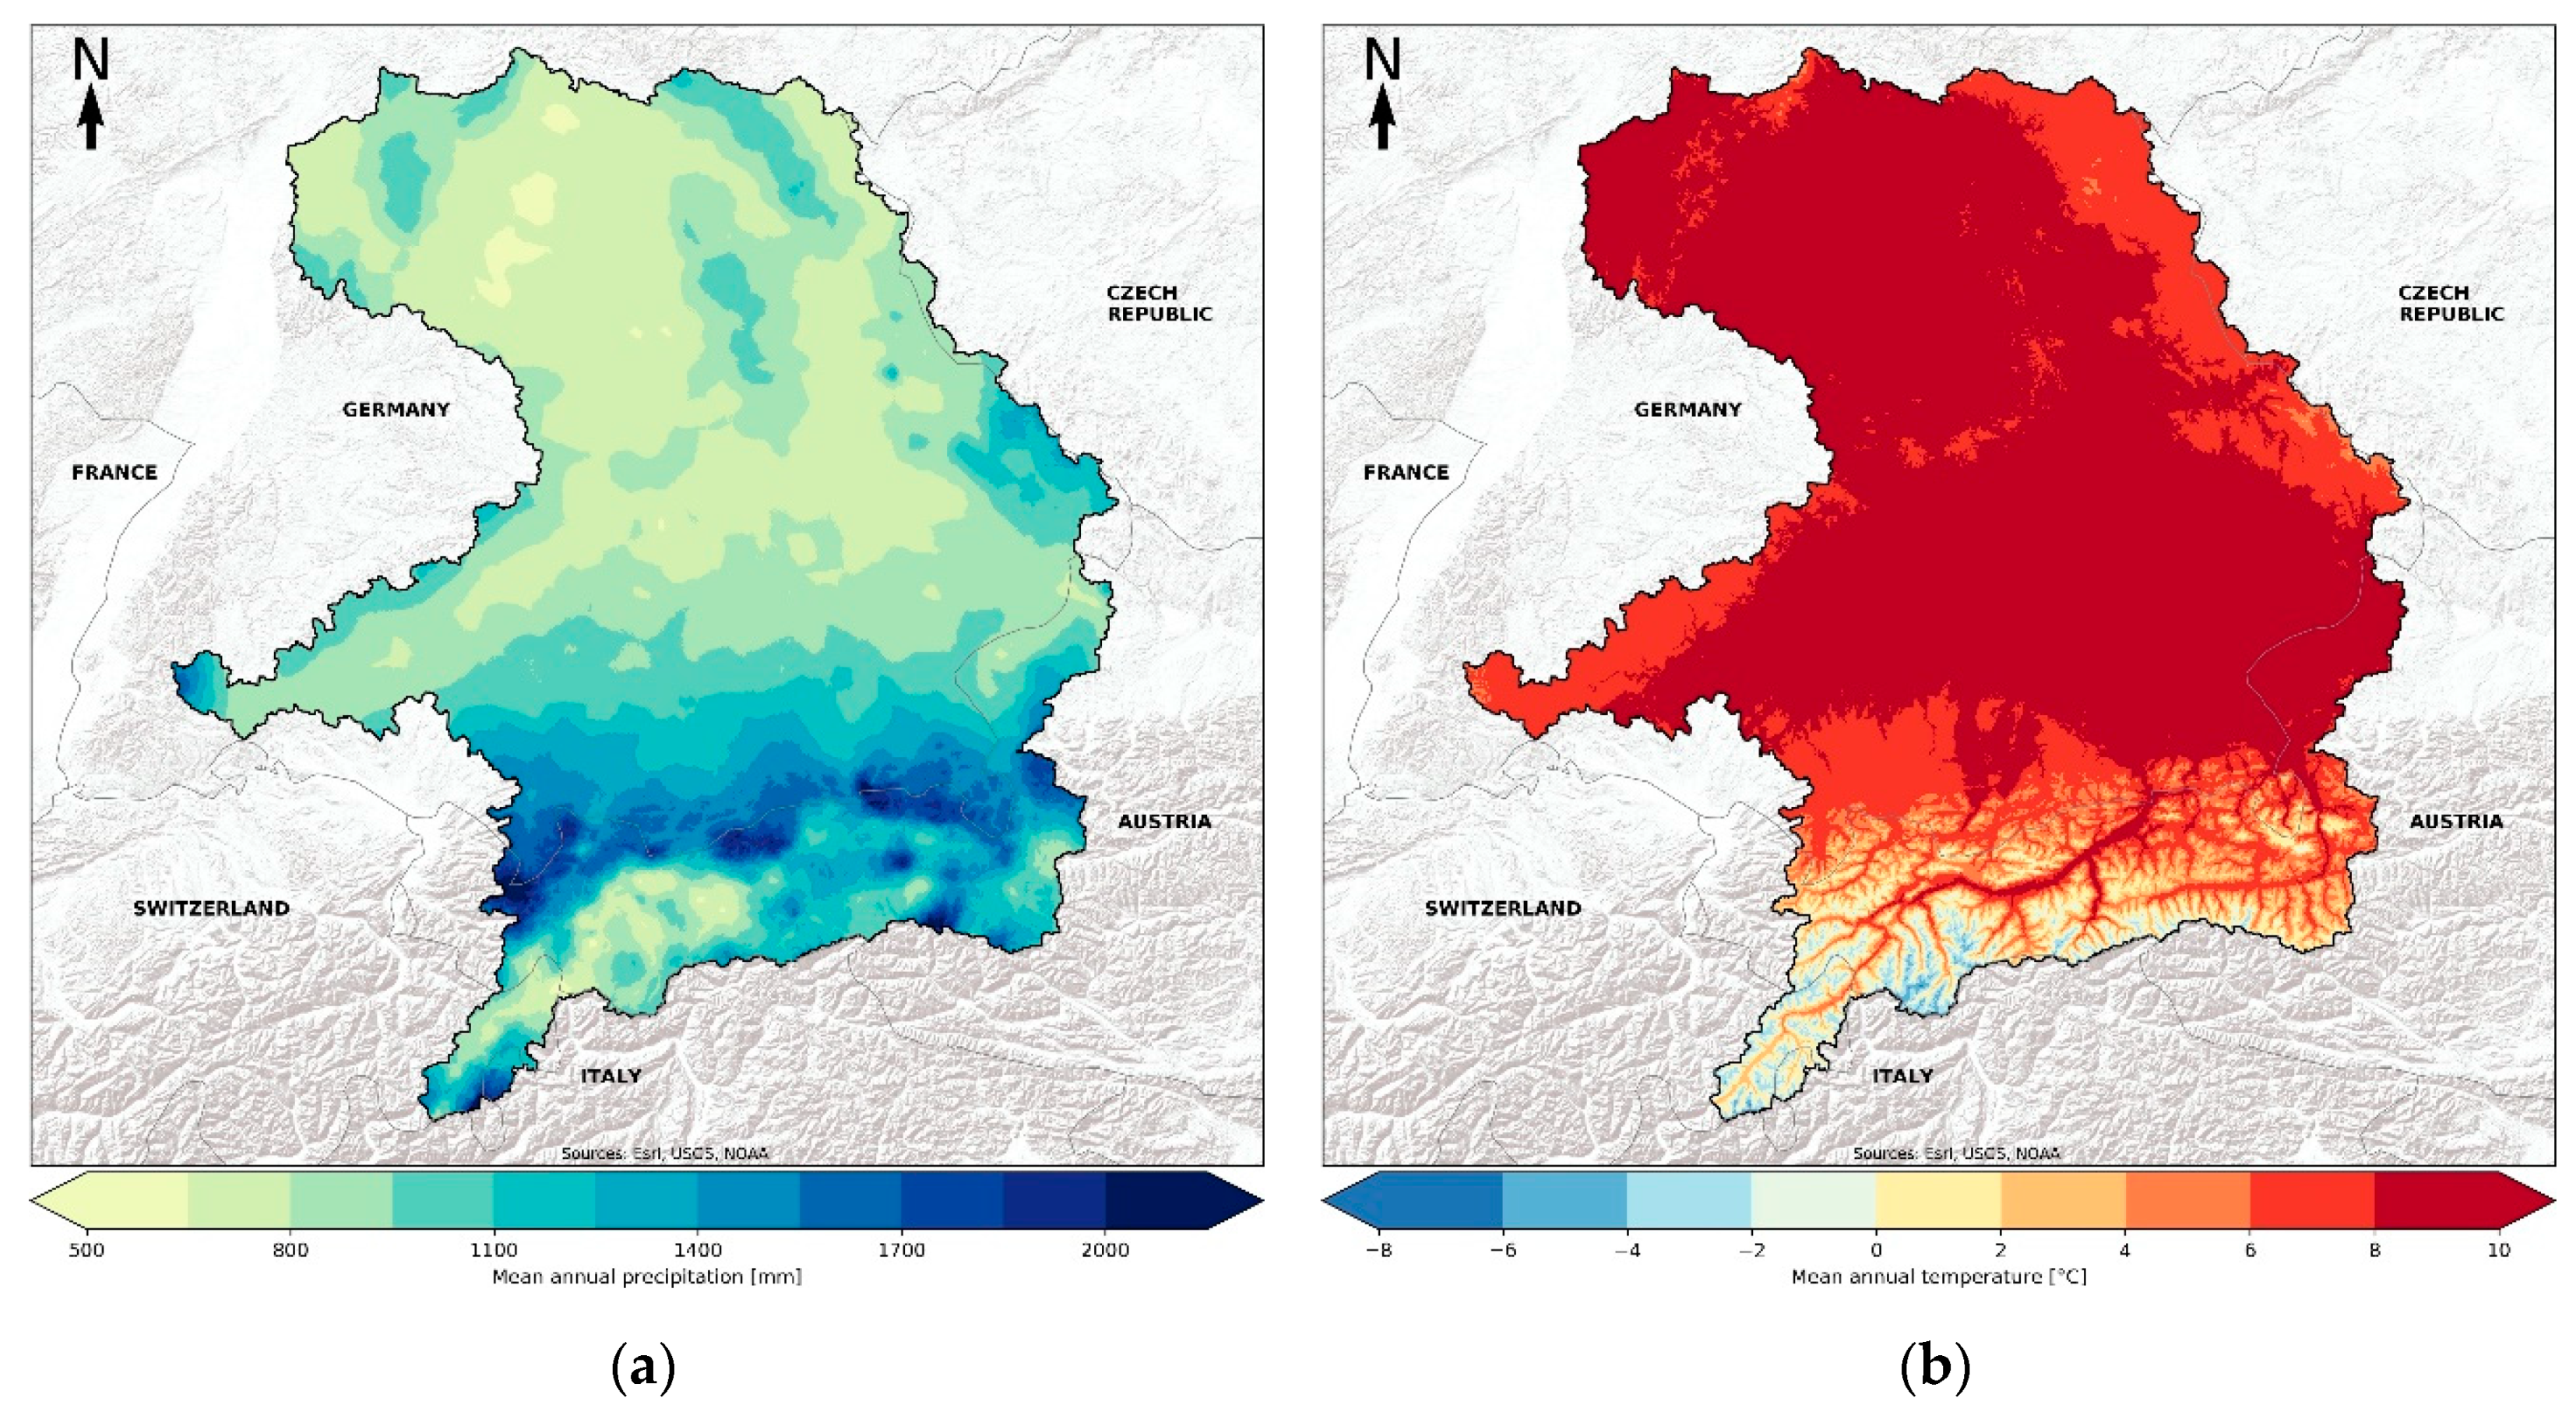
The mean climate of the Hydrological Bavaria is characterized by a general increase of mean annual precipitation (Figure 2a) sums from north (500–1100 mm, the southern German escarpment) to south (1500–2500 mm, the northern Alps). However, within the Austrian Alps the Inn catchment represents a more arid region with its dry valley encompassing precipitation sums between 600 and 1400 mm, whereas outside the valley exceeding 1400 mm. The catchment of the upper Salzach exhibits higher yearly mean precipitation sums between 800 and 2100 mm. The annual mean temperatures (Figure 2b) also depict a North-South gradient with higher values in the Main catchment (10 °C) and lower values in the Alps (5 °C). While the lowest values are observed on alpine summits (−8 °C), the highest values occur along the Main valley as well as near the Main outlet (10.5 °C) Annual air temperatures for catchments of the upper Danube north of the Alps vary between 6 °C in the vicinity of the Alps and 9 °C for the remaining regions.

2.2. Data

2.2.1. Spatial Model Inputs and Discharge Data

The applied hydrological model requires a plethora of data to perform the simulation in its most physically based process representation. Table 1 gives an overview of the data used for this study either as model input (e.g., spatially distributed inputs) or for validation purposes (e.g., discharge data). The digital elevation model forms the basis for the hydrological simulations since it is used to derive important model inputs (e.g., slope, exposition, catchment delineation). For this study the Digital Elevation Model over Europe (EU-DEM) [23] was used. Information on land use was obtained from the Corine Land Cover 2006 (CLC) [24] dataset. Similar land use types were merged to a single category to avoid redundancy and overfitting of land use parameters. Soil data from the European Soil Database (ESDB v2.0) [25,26] was used to provide a common basis for the political Bavaria and adjacent states and countries. This dataset fits into the study’s framework of a holistic parameterization approach as the provided parameters were derived by homogenizing particle-size and hydraulic properties of soils across European datasets yielding the Hydraulic Properties of European Soils (HYPRES) database [27]. HYPRES provides Mualem–van Genuchten parameters for eleven soil textural classes (5 for topsoil, 5 for subsoil and one organic) required for the hydrological modelling. These parameters were used to describe the hydraulic properties for each individual soil type and their two different horizons. Apart from data for land use and soil texture, information regarding groundwater conductivity was required to model groundwater fluxes. While detailed data was available for the German regions of the Hydrological Bavaria from the Hydrogeologische Übersichtskarte 200 (HÜK200) [28], for regions outside of Germany the information on groundwater conductivity was retrieved from the coarser resolution International Hydrogeological Map of Europe (IHME1500 v1.1) [29]. This coarser resolution IMHE1500 was further refined based on the slope, with steeper slopes receiving lower values of conductivity values and flat areas higher values. The rationale behind this approach is that shallow areas within the Alps (mainly valleys) tend to accumulate gravel and other coarse material with higher hydraulic conductivity than steep areas with raw soils or bare rocks. Overall, the resulting spatial pattern of hydraulic conductivity classes was comparable with that of the IHME1500 dataset. All spatial data were scaled to a spatial resolution of 500 m × 500 m.
For this study discharge data of 98 gauges for the period of 1 January 1980 to 31 December 2010 was provided by the Bavarian Environment Agency (Bayerisches Landesamt für Umwelt-LfU) in a temporal resolution of 1 h. This data was aggregated to a 3-hourly timestep.

2.2.2. Meteorological Data

In the framework of this study a new spatially distributed dataset of meteorological observations was created. Therefore, available meteorological data comprising point measurements of precipitation (P), air temperature (T), relative humidity (RH), incoming shortwave radiation (R), and near surface wind speed (WS) at various temporal scales (daily, hourly, sub-hourly) were homogenized (temporal scale) and spatially interpolated. Sub-daily records of precipitation data began in 1989. However, the spatial coverage and the number of available stations was insufficient for a robust spatial interpolation. Hence, daily observations were temporally disaggregated to time series of 3-hourly resolution using the method of fragments (MOF) approach [30] to extend the otherwise scarce data base. The disaggregation is based on resampling sub-daily fragments for a daily observation by choosing from a set of ratios (fragments) of sub-daily to daily precipitation. Compared to other stochastic methods for disaggregation of precipitation (e.g., Bartlet–Lewis or cascade-based methods) MOF does not require parameterization and is supposed to outperform more complex methods [31]. For this study the regionalized MOF after Westra et al. [32] was applied as it provides a larger sampling size by including records of nearby stations and also acknowledges the characteristics of preceding and successive rainfall of a prolonged event. The applied MOF framework is also described in Poschlod et al. [33]. The approach was further adjusted regarding the temporal course to be applicable to other meteorological data. The received time series of P, T, RH, R and WS were spatially interpolated according to the REGNIE (REgionaler NIEderschlag; eng.: regionalized precipitation) method [34] on a spatial resolution of 500 m. Originally developed as an interpolation scheme for precipitation it combines inverse distance weighting and a multiple linear regression which considers orographical conditions. Adjustments regarding the statistics of the remaining meteorological variables were made to provide a consistent approach. This new high-resolution set of meteorological data is hereafter referred to as Sub-Daily CLImate REFerence (SDCLIREF).

2.3. Methods

2.3.1. The Holistic Modelling Approach

The goal of the holistic modelling approach is to find a single set of parameters for the hydrological model, which is valid across the entire domain of the Hydrological Bavaria. This approach is similar to a global parameterization which might be performed using independent catchments as well as model setups [14,18]. However, it is considered as holistic as it derives model parameters using a single model setup for several interconnected (and thus interdependent) sub-catchments. Hence, this approach encompasses two major premises: the application of homogeneous spatially distributed input data as well as a set of homogeneous model parameters for spatially distributed components of the hydrological model. The holistic approach should make the results from individual catchments more comparable across the domain by reducing the risk of over-parameterization often seen in single modeling setups. Especially in hydrological setups focused on the impacts from external forcing (e.g., climate change) a holistic approach is preferable. Furthermore, by avoiding over-parameterization the holistic approach may contribute to a convergence of the different philosophies of climate and hydrological modelling.
To assure the homogeneity of spatially distributed input data, we opted for data sets covering the entire Hydrological Bavaria. In limited cases where no high detailed data was available for the entirety of the domain, we have merged datasets and applied an additional set of refinement steps in post-processing (e.g., for the hydrogeology inputs).
The parameters for spatially distributed model components (i.e., parameters for land use, snow, and glaciers) were manually calibrated over the entire Hydrological Bavaria. Other parameters directly influencing the shape of discharge compartments (recession parameters for inter-, and direct flow) which are dependent on the unique features of each catchment, were automatically calibrated for each gauge separately. Hence, the final parameter set of the model can be divided in a global and local component.

2.3.2. The Hydrological Model and Parameterization Approach

In this study the water balance simulation model WaSiM [10] was applied to perform the hydrological simulations. This model is characterized as being physically based, fully distributed, and deterministic, operating on constant time steps ranging from minutes to days. WaSiM is parallelized for distributed memory architectures using the message passing interface (MPI) and shows a good scalability on modern high-performance clusters. This enables the model to simulate physical processes with a high degree of accuracy using complex methods for the representation of hydrological processes (see Table 2). It also enables high spatial and temporal resolutions for this study. For this study, the hydrological model runs have been performed on the high-performance hardware on the Leibniz Supercomputing Centre (LRZ).
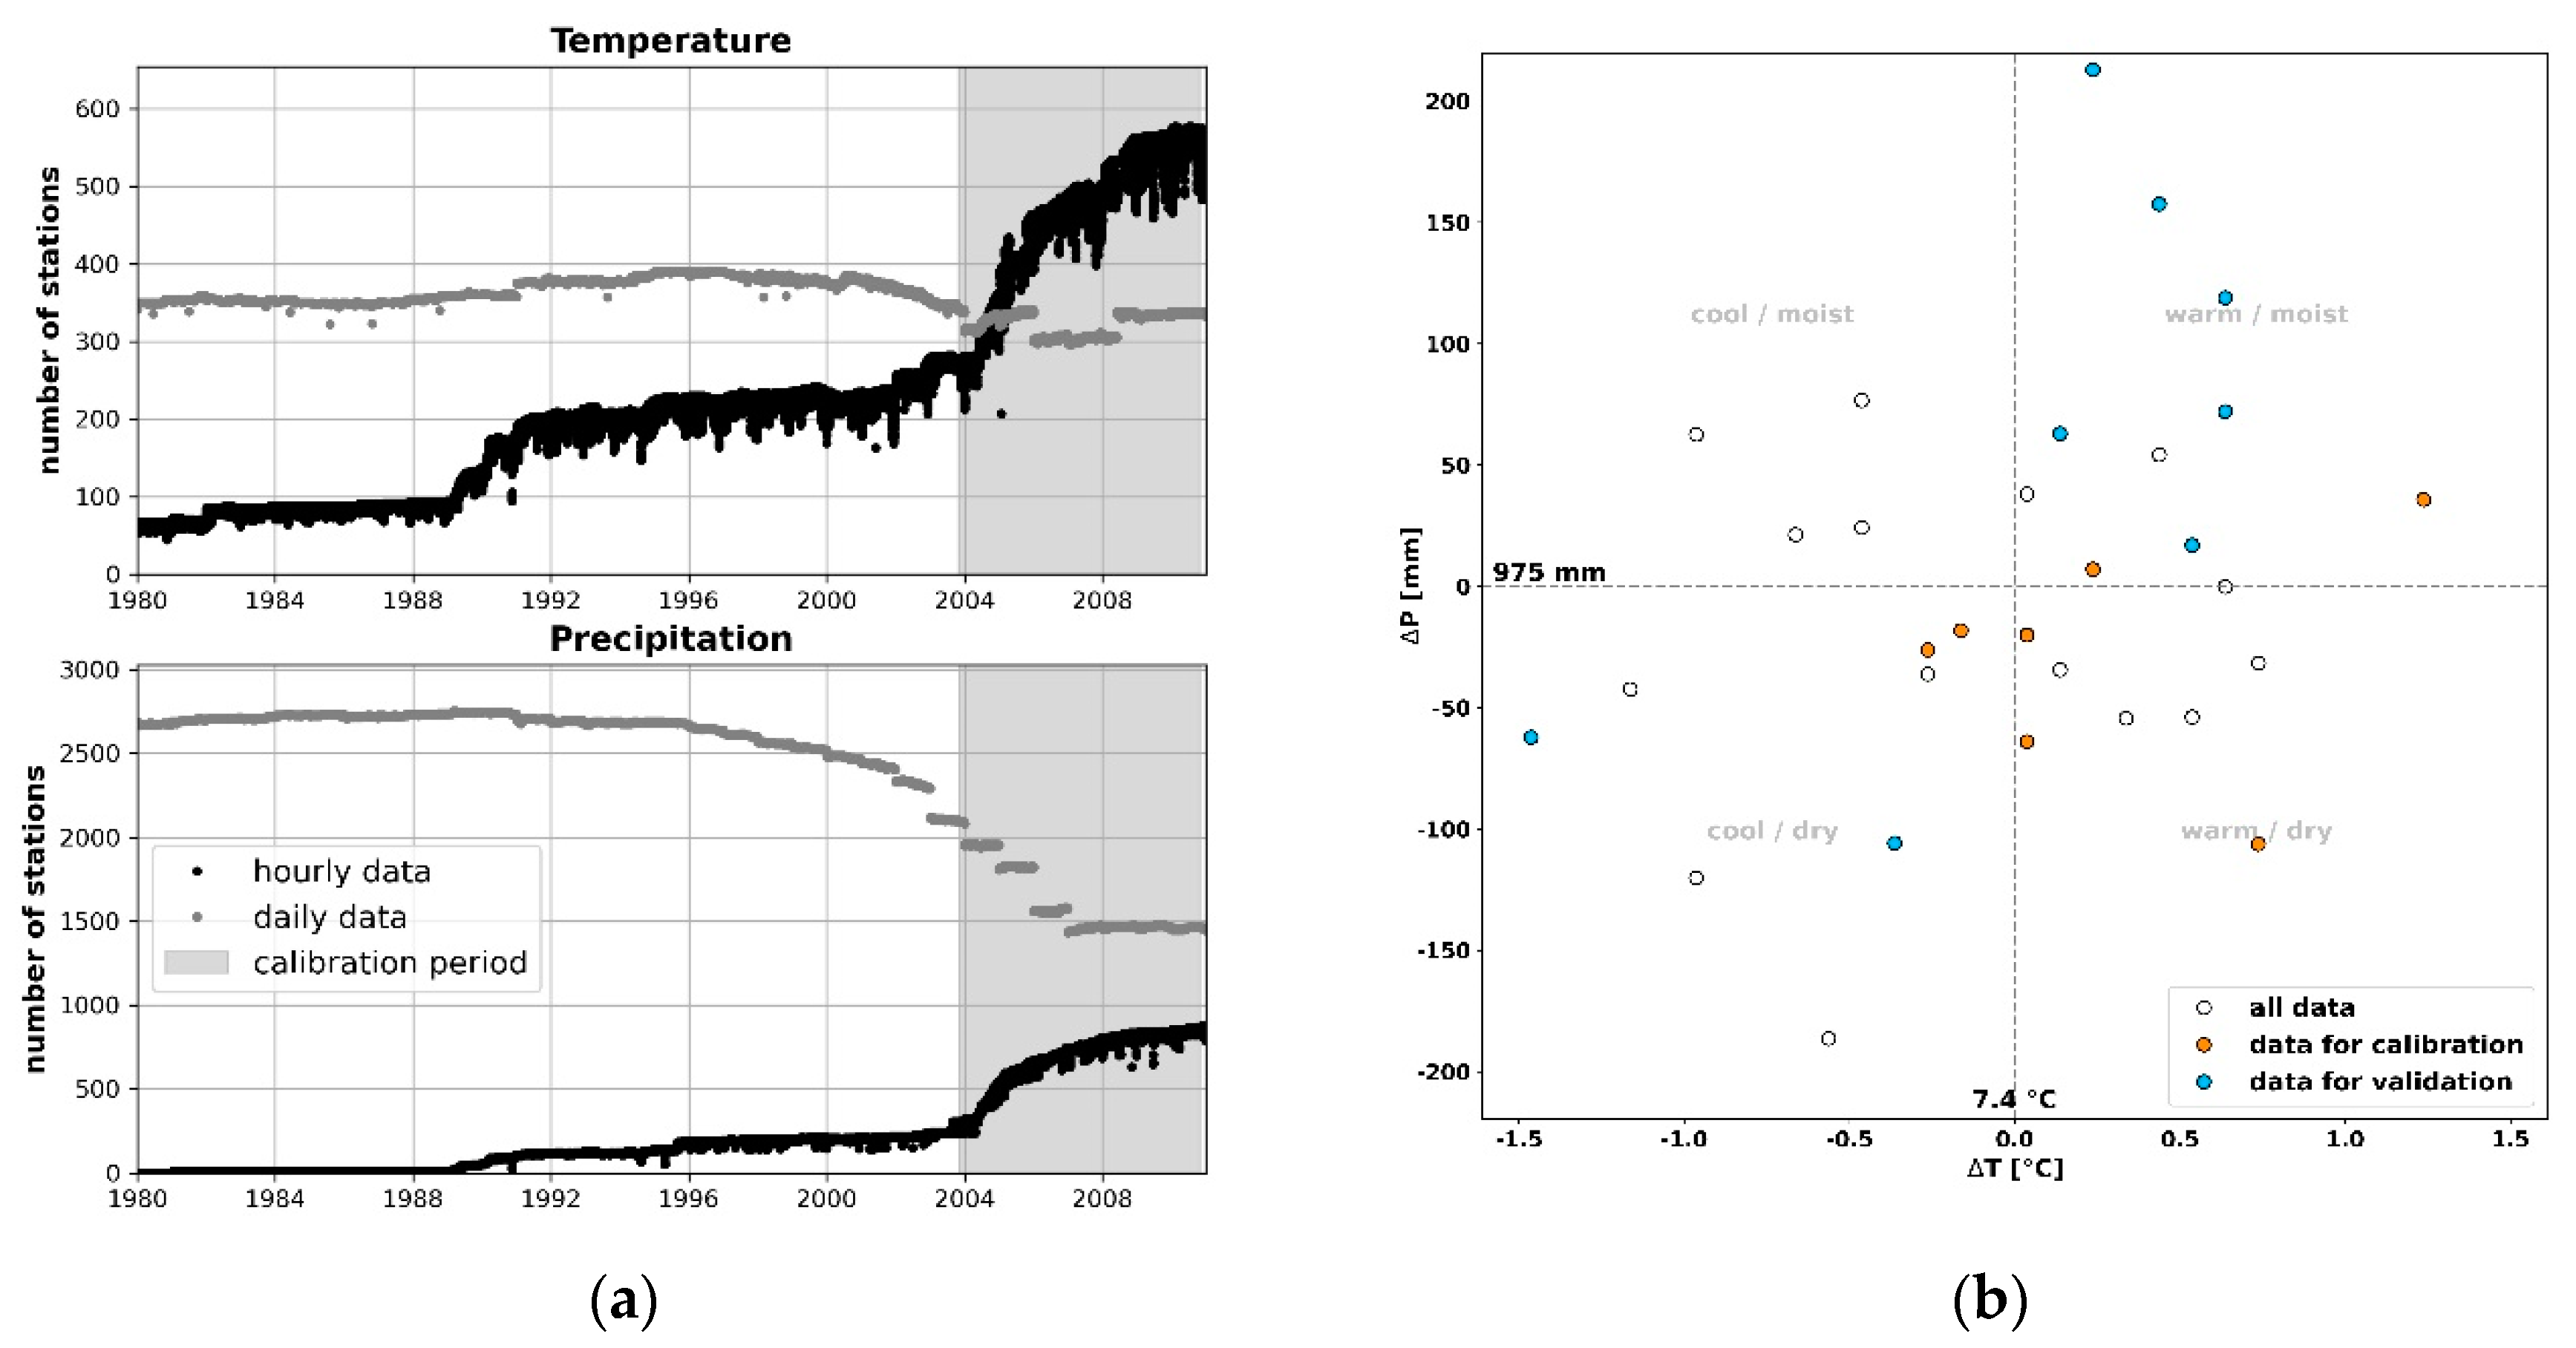
For the parameterization of the model a split sample approach was used for calibration and validation. Therefore, two periods comprising the hydrological years (1 November to 31 October) from 2004 to 2010 and 1995 to 2002 were selected from the reference period from 1981 to 2010 for calibration and validation, respectively. The calibration period was set at the end of the reference period, since here a larger availability of observed sub-daily meteorological records can be found (Figure 3a). This should minimize errors in the simulation due to possible changes in the temporal distribution imposed by the temporal disaggregation of observations. The calibration period (Figure 3b, orange dots) covers rather average or below average years in terms of annual precipitation and air temperature with regard to the entire reference period (1981–2010). Only two years exhibit moister conditions than the mean of the reference period. Contrary, the validation period (Figure 3b, blue dots) covers mainly above average years (six years), with three of the six years showing a mean deviation greater than 100 mm. Hence, the results of the hydrological simulations for the validation period as well as for the entire reference period should indicate whether the parameters received by the calibration are suitable for the simulation of above average moist conditions. Whether the parameters are time invariant regarding future periods cannot be decided based on the presented data. However, it should be noted that the choice of reference period might affect climate change signals [38].
The calibration was performed in parts by manual alternation of parameters for spatially distributed processes (i.e., parameters regarding evapotranspiration, infiltration rate, groundwater fluxes, snowmelt, and glacier dynamics), while four free parameters directly affecting the shape of the discharge (i.e., drainage density, recession factors for direct and interflow, snow fraction factor) were automatically estimated for each of the 98 individual catchments separately. Here, the adjusted dynamically dimensioned search (DDS) algorithm after Tolson and Shoemaker [39] was used for the automatic parameter estimation. This approach can be described as a simple stochastic and adaptive algorithm and is supposed to provide robust parameter sets if the number of iterations or evaluations is small as it adapts its search strategy according to the predefined number of iterations [40,41,42]. Preliminary tests have shown that an evaluation budget of 200 is sufficient for finding appropriate combinations of the four free parameters. Since the applied model was complex and computationally demanding, this resulted in run times of approximately 48 h per run. The adjusted algorithm applies a simulated annealing (SA) approach to diminish the limits of variation for the parameters to be calibrated with increasing iterations. Since the algorithm starts its search globally and becomes more and more local with increasing iterations [41], the SA further enhances the transition from a global to a local search. This approach is further referred to as DDS-SA.
In this study, several different objective measures (OM) were applied to evaluate the capability of the model to reproduce observed discharge values at the 98 gauges. The OM include the Nash and Sutcliffe Efficiency and its logarithmic form (NSE; logNSE, [43]), the Kling Gupta Efficiency (KGE, [44]), and the ratio of the root mean square error to standard deviation of measured data (RSR, [45]). The respective equations are presented in the Supplementary Materials. The choice of these efficiency measures is based on their respective focus on the evaluation of observed and simulated discharge (NSE: high flows; KGE: shape and bias; logNSE: low flows; RSR: volume error) [45,46]. Since the automatic calibration requires a single value to be optimized (here minimized), the efficiency criteria were combined to an overall objective measure (OMoverall) using different weights according to their contribution to calibrate the model towards high flows (see Equation (1)). A perfect fit would receive a value of zero.
OM overall = 0.5 × ( 1 NSE ) + 0.25 × ( 1 KGE ) + 0.15 × ( 1 logNSE ) + 0.1 × RSR
In order to avoid downstream propagation of simulation errors, observed discharges were used as external input for individual downstream catchments during the automatized calibration.

2.3.3. Evaluation of Simulated Return Levels

In the field of flood frequency analysis (FFA) there are two different approaches to estimate return levels: the annual maximum (AM) method relying solely on the yearly peak flow, and the peak over threshold method (POT, also known as partial duration series approach) that considers all discharge values exceeding a predefined threshold [47,48,49,50]. While the AM method is still used as a standard in many countries, its application is often criticized due to a loss of information by only employing the annual maximum peak flows of a complete time series [47,50]. Hence, low peak flow values, which are not considered an actual flood, are used to fit an extreme value distribution function (EVDF). Since historical records of stream flow are often incomplete or short, the AM method does not provide a sufficient sample size. The POT approach offers more flexibility in the representation of a flood by including all values above a chosen threshold into consideration yielding a larger sample size for an EVDF fit [47,48,49,50]. Therefore, in this study we opt for the POT method. According to [51,52] a series of samples of independent and identically distributed (iid) data which exceed a high enough threshold follow a Generalized Pareto Distribution (GPD) [48,50,53,54]. This theorem emphasizes two major requirements for the POT approach: independence of events (i.e., independent clusters of excess values) and the careful selection of a threshold. Although a plethora of methods for the estimation of a suitable threshold (e.g., graphical methods, analytical methods, mixture models) [48,50,55,56] exists to date, the selection remains subjective to an extent where several values may lead to similar results [49]. The independence criteria is described by a minimum time span between events and determined by the nature of the underlying physical process [49,50,54].
In this study we use a common procedure for all observed and simulated data as it fits the scope of a holistic modelling and evaluation approach. Nevertheless, we are aware, that this might lead to deviations from an optimal fit of the GPD at some gauges as the choice of threshold affects the bias and/or variance of the fit [48,53], and that the inherent relation between discharge and return levels for a certain gauging period may be disturbed [47]. At first, a series of independent events is created by de-clustering the observations using a physically based threshold up [54] which is defined by the average number of events per year λT [49] (see Equation (2)). Here, we opt for a value λT = 8.
u p = 1 ( λ T 365.25 )
The events are further separated by an intermittence time of 5 days following [48,49,57,58]. The resulting series of separated events (clusters) form the basis for the GPD fit. A statistical threshold us [54] equal to the 90th highest value of the clustered data is applied for the model fit to ensure that only values of an actual flood event are included for the estimation. Thus, the requirement of the GPD for a sufficiently high threshold is met. The GPD parameters (shape and scale) were estimated using the method of L-moments (LM) [59] as it shows good performance for small and moderate sample sizes [60,61]. Figure 4 illustrates the different steps of our workflow to derive return levels from the complete time series of discharge.
The applied thresholds upT, respectively) and us are seemingly large compared to other studies [47,49,54,57,62,63]. However, a sensitivity analysis using several thresholds for the evaluation of the GPD model fit showed the best results for this combination across all gauges (see Supplementary Materials).
Further, we use the GPD model fit to estimate the return levels of five, ten, and 20-year return periods for both observations and simulated data, respectively. The 20-year return period is deemed as an appropriate level for comparison, since for 90% of the gauges at least once the associated 20-year return level occurred within the observational record, considering a 10% error for observed maximum flows. Choosing a return period beyond 20-years means relying on an extrapolation for most gauges (e.g., more than 50% percent of gauges at a 50-year return period). A level of trust (LOT) is then calculated by a simple comparison after Equation (3) using the estimates of the return periods, where HFx represents the high flow values of return interval x, for the simulated sim data and observations obs.
LOT = abs ( HF x sim HF x obs HF x obs ) × 100
The LOT is subdivided into the qualitative categories very high (LOT ≤ 10%), high (10% < LOT ≤ 20%), moderate (20% < LOT ≤ 30%), low (30% < LOT < 50%), and very low (LOT ≥ 50%). These categories are considered to be feasible for the comparison of high flows and return levels due to the uncertainties immanent to high flow observations which are imposed by the calculation of discharge using the water level to discharge relationships established for the individual gauges. These relationships might change over time (e.g., with changes in the riverbed at the gauge) and are further limited by a maximum water level which might be exceeded by severe floods (overflowing).

3. Results

3.1. Results from the Holistic Modelling

Although multiple performance criteria were used during the calibration, the focus in this section is on the NSE and KGE. These two metrics provide a thorough overview of the quality of the model. In addition, the NSE provides a first hint on the model’s capability to reproduce observed high flows, since it is sensitive to deviations in high values of a time series. The KGE is less sensitive to these high value deviations, and hence often indicates a better performance than the NSE.
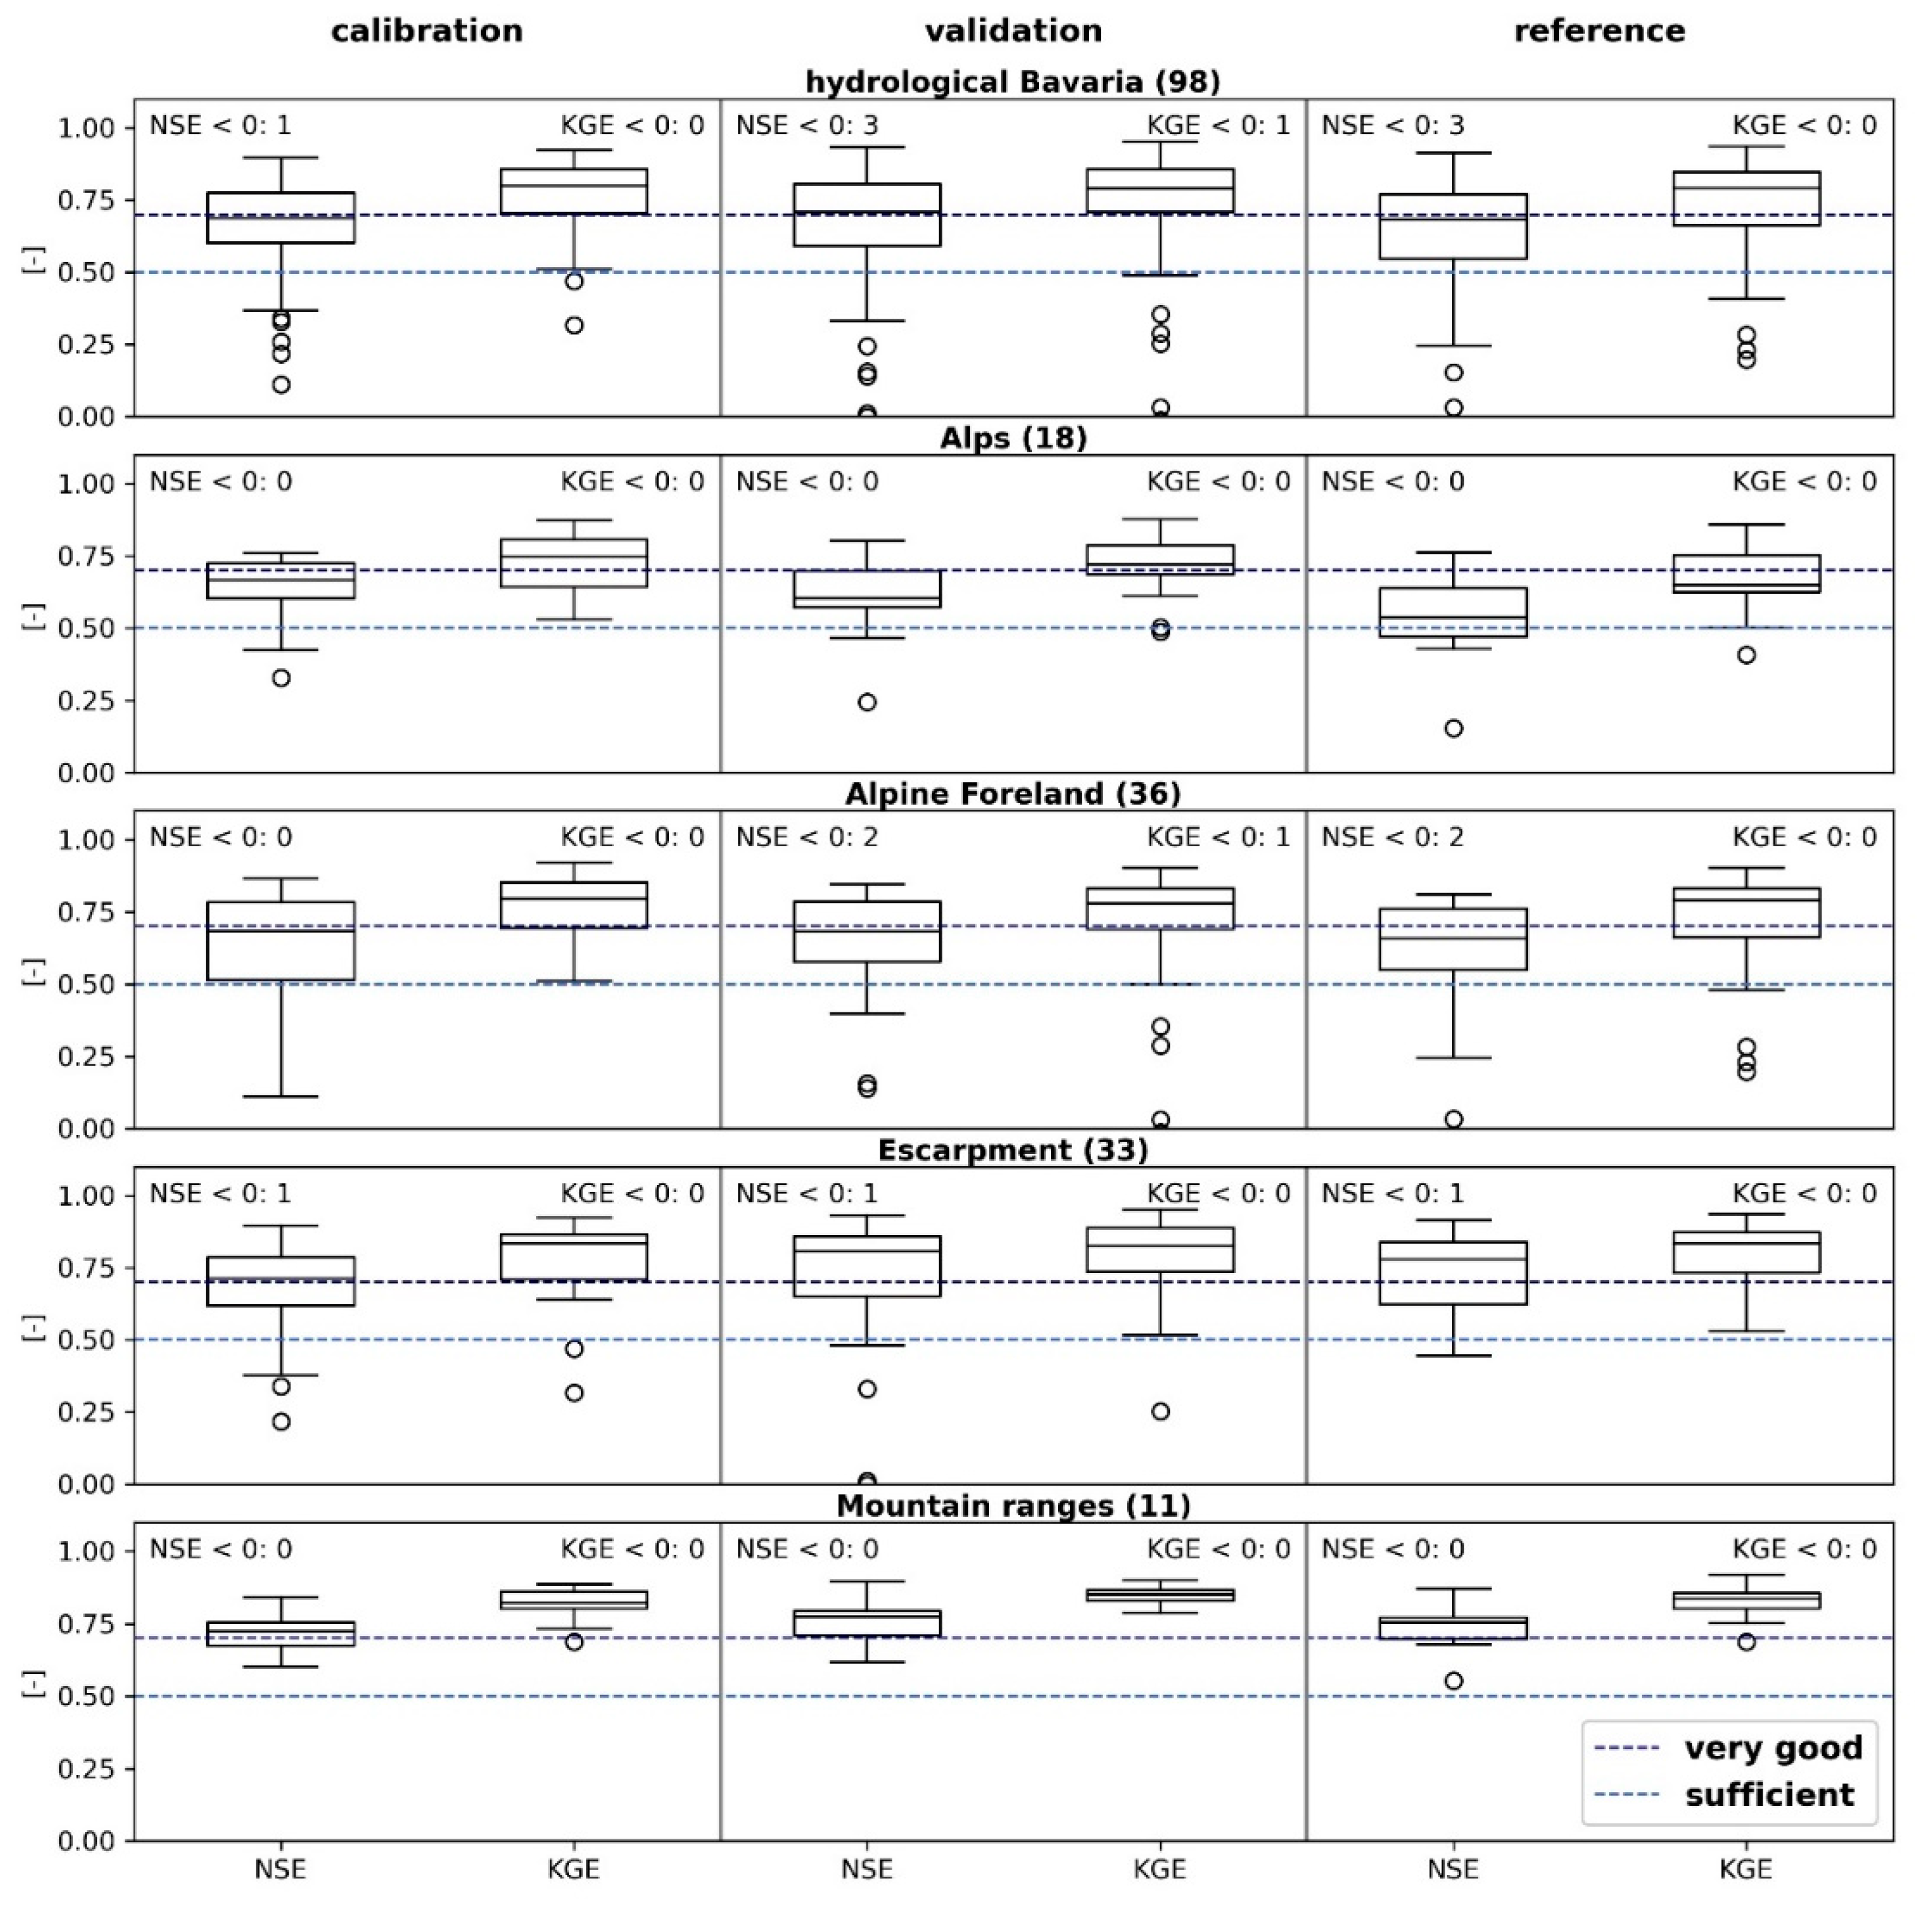
The results for the periods of model calibration, validation, and the reference period for all gauges of the Hydrological Bavaria are shown in Figure 5 (top). Overall, the model shows sufficient values in both criteria.
Regarding the NSE, the model calibration yields sufficient representations of observed discharge for more than 75% of the gauges (values above 0.5). Furthermore, the holistic model setup results in a very good fit for almost half of the gauges of the Hydrological Bavaria. However, for some gauges, the proposed approach leads to an insufficient model performance with values below zero. The KGE indicates a better overall model fit than the NSE. 75% of the gauges exhibit a very good performance according to the KGE. Only two gauges show values below 0.5. Furthermore, a smaller variance in performance for the KGE than for the NSE indicates that the model is more robust regarding the overall regime than discharge extremes.
The validation of the model also illustrates a sufficient model performance with respect to the NSE, as more than 75% of the gauges of the Hydrological Bavaria exhibit values greater than 0.5. Compared to the calibration period, the model overall represents the observations better with more than 50% of gauges showing values above 0.7. However, the simulations show insufficient NSE values (NSE < 0) for three gauges. The KGE shows an overall better fit of the model to the observations as well. A significantly worse performance is also recognizable for two gauges for the KGE and follows the development of NSE for the validation period.
The model performance of the reference period is particularly interesting for the subsequent estimation of return levels based on the simulations and the comparison with return levels derived from observations. The simulation results for this period indicate an overall slight decrease in model performance for the NSE and KGE, respectively. However, more than 75% of all gauges exhibit sufficient values for both objective measures. Almost 50% of the simulated discharges exhibit a very good model performance in terms of NSE and almost 75% in terms of KGE. As for the validation period, the simulation results for three gauges yields insufficient model fit regarding the NSE.
Figure 5 further illustrates the model performance for all gauges separated by their location within the greater landscape.
The gauges within the Alps show a sufficient performance at most gauges for the calibration and validation period. Here, the model performance of the validation period is worse than for the calibration. The reference period exhibits the worst values, particularly for the NSE where the model yields sufficient results for slightly more than 50% of the gauges. Again, the variance in the criteria increases from calibration to the reference simulation. This in parts unsatisfactory model performance for the Alps may be ascribed to three major factors. First, meteorological observation is the Alps are scarce and most gauges are located in the valleys rather than in high altitudes with steep slopes or even glaciers. Hence, there is an undercatch in the precipitation measurements [22,34,64,65], which influences runoff generation. Furthermore, since the model also employs a dynamic glacier routine to simulate glacier runoff, the globally defined parameters may not be suitable for every glacier within the study area. At last, the discharge within the Alps is severely influenced by water management infrastructure (e.g., hydro power generation, detention basins) and operation data of these facilities is usually not available. In this study, only the most dominant structures were implemented.
The model overall performs better for gauges within the Alpine foreland. However, two gauges show an insufficient model fit for the validation and reference period regarding the NSE. These gauges exhibit a poorly distinctive annual runoff regime compared to the remaining gauges of the Hydrological Bavaria. Hence, some unique processes leading to these regimes might not be reproduced by the holistic modelling approach. Apart from those two gauges, more than 75% of the gauges show at least a sufficient agreement between simulations and observations. Furthermore, the rivers of the Alpine foreland are affected by water management structures as well. In many cases, the modes of operation are estimated and stationary with time as explicit operation data are again not available.
For gauges situated in the escarpment, the model performance shows better results compared to the Alps and the Alpine foreland throughout all simulation periods. The NSE and KGE are sufficient at most gauges with only a few outliers. These underperforming simulation results are either induced by a lack of information about the fuzzy control mechanisms of the Main-Danube transfer system or an insufficient parameterization of karstic soils of the Franconian Jura. Along the Main there are several hydro power plants as well. However, since these structures are run-of-river power plants, they have less impact on the natural runoff regime than the structures in the Alps and Alpine foreland. Hence, the model yields better representations of observed runoff for the Main.
Gauges situated in the eastern mountain ranges exhibit the best model performance among all gauges. Across all periods, the NSE and KGE never fall below 0.5. Furthermore, the variance of these values is rather small compared to those of the gauges within other landscapes. An explanation for the better performance is, that almost all gauges are unaffected by water management and thus considered as natural.
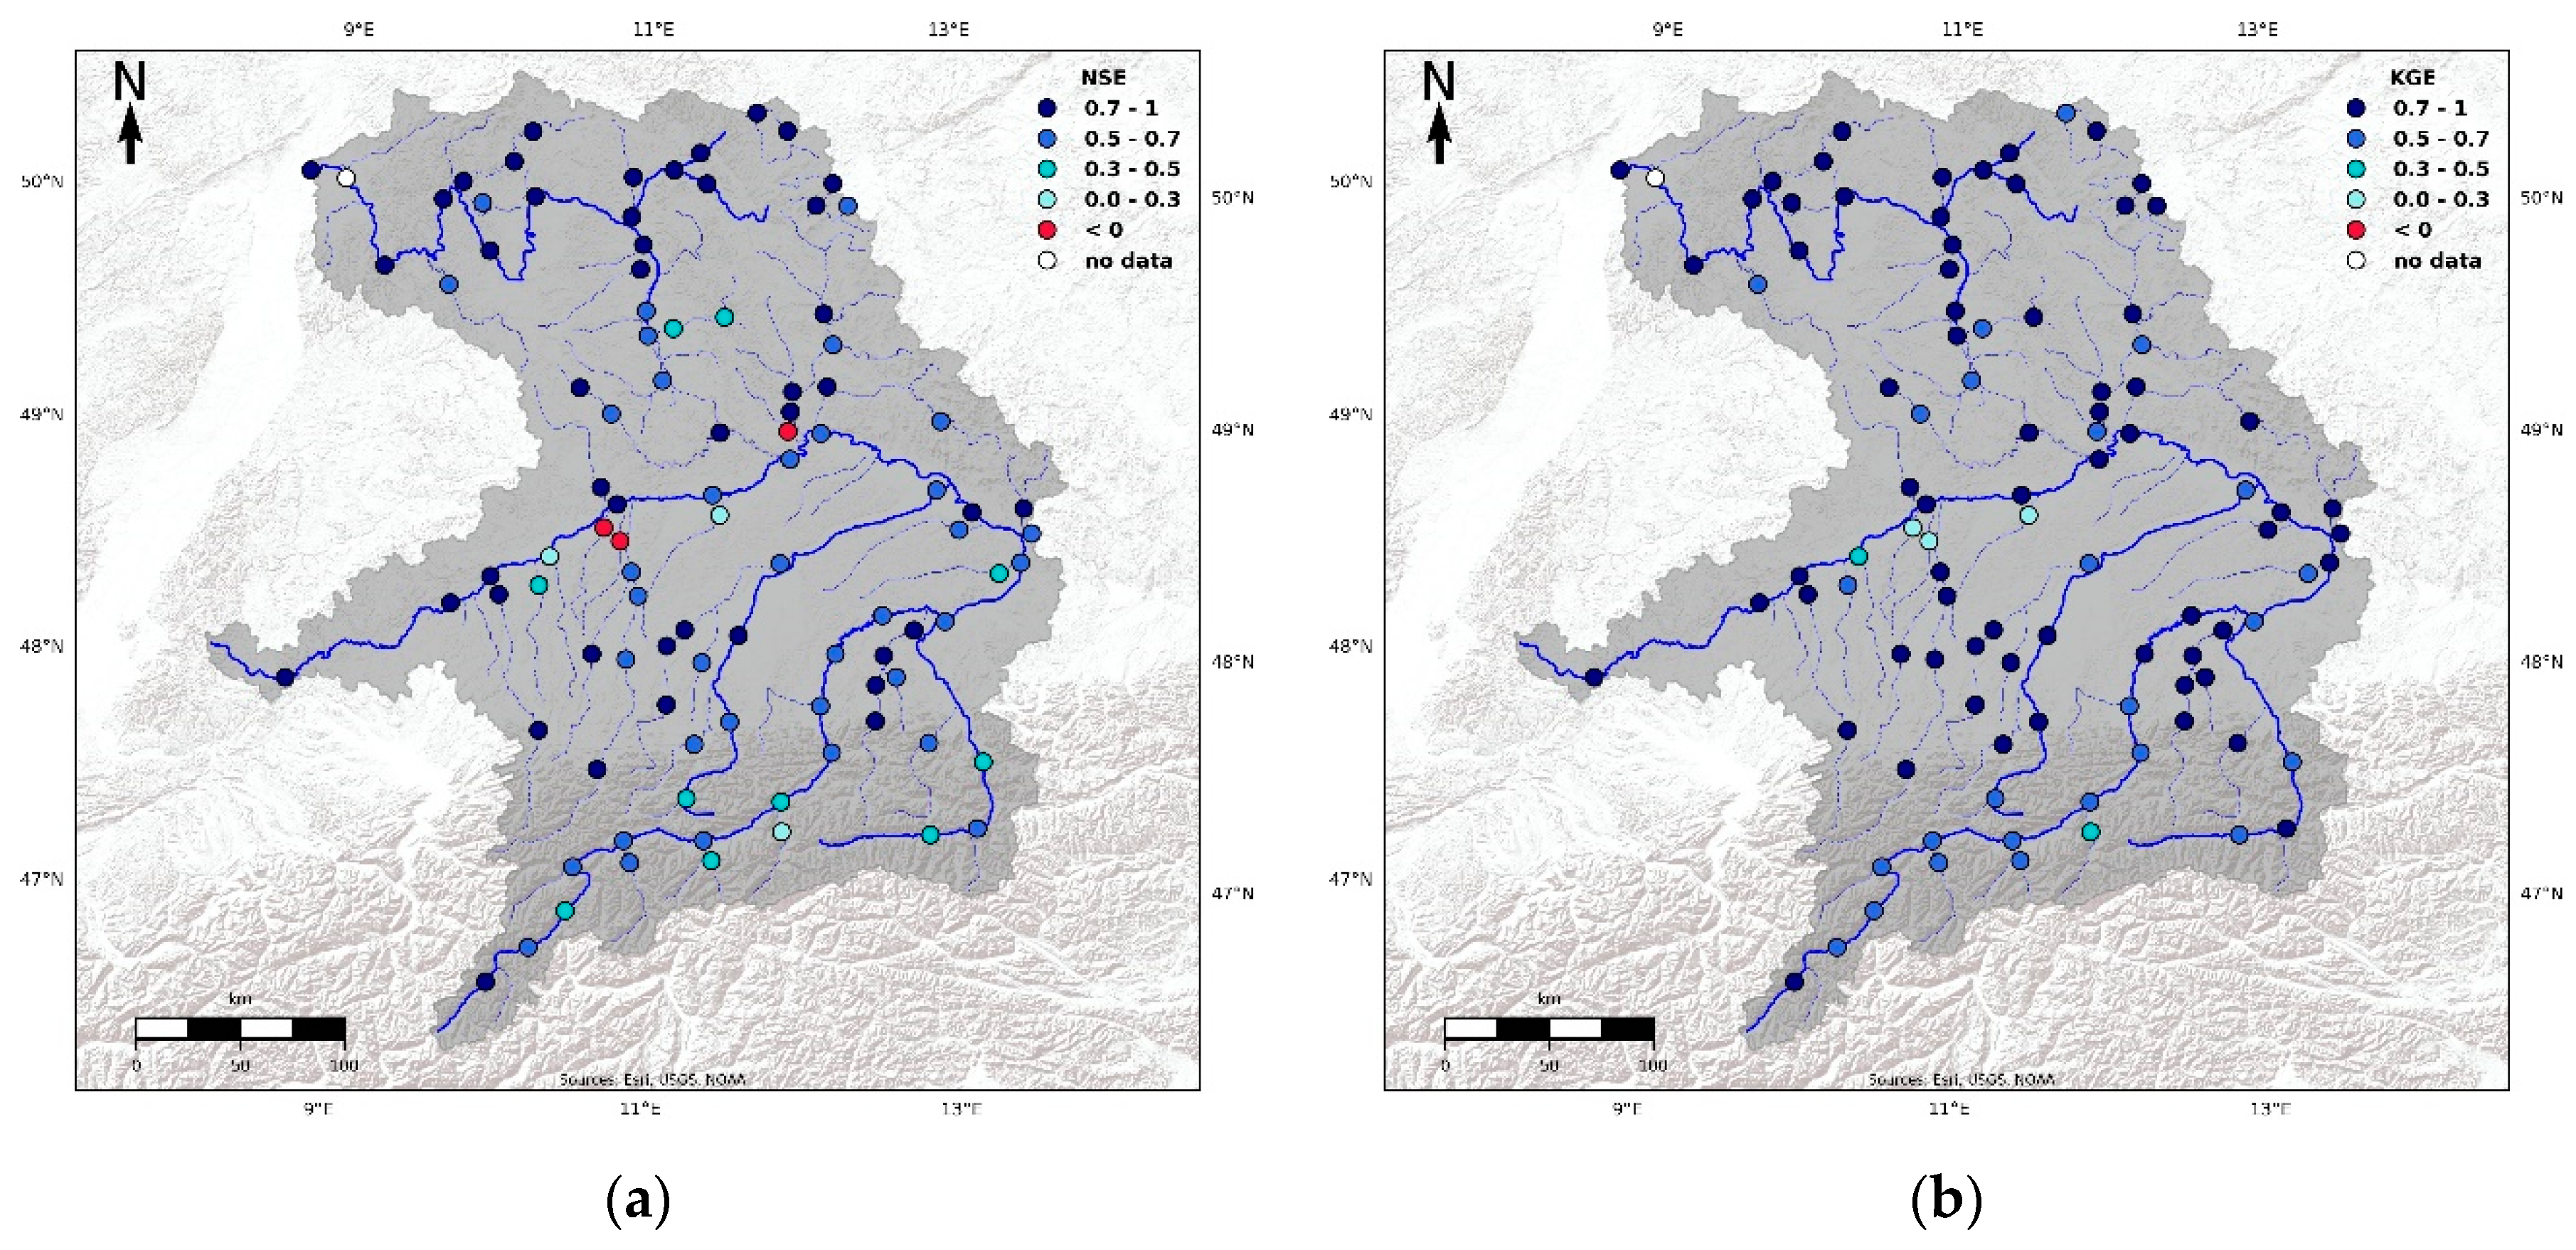
Figure 6 shows the spatial distribution of the NSE and KGE (adapted from Poschlod et al. [22]) for the reference period. Despite the efforts taken to reduce forward propagation of model errors from upstream to downstream gauges (i.e., use of observed discharge as input for the automatic calibration of a downstream sub-catchment), the gauges along the Danube show a decrease in performance from its source to the outlet. The model performance in most cases is better for headwater catchments. However, the figure illustrates an overall sufficient performance for most of the gauges.
The two illustrated model criterions exhibit–with the exceptions mentioned–only little variation for the respective modelling period. Hence, the model parameters are to some extent robust towards changes in land use, water management and other non-stationary conditions affecting the runoff formation. However, the presented reference period is rather short and thus, these changes might be moderate.
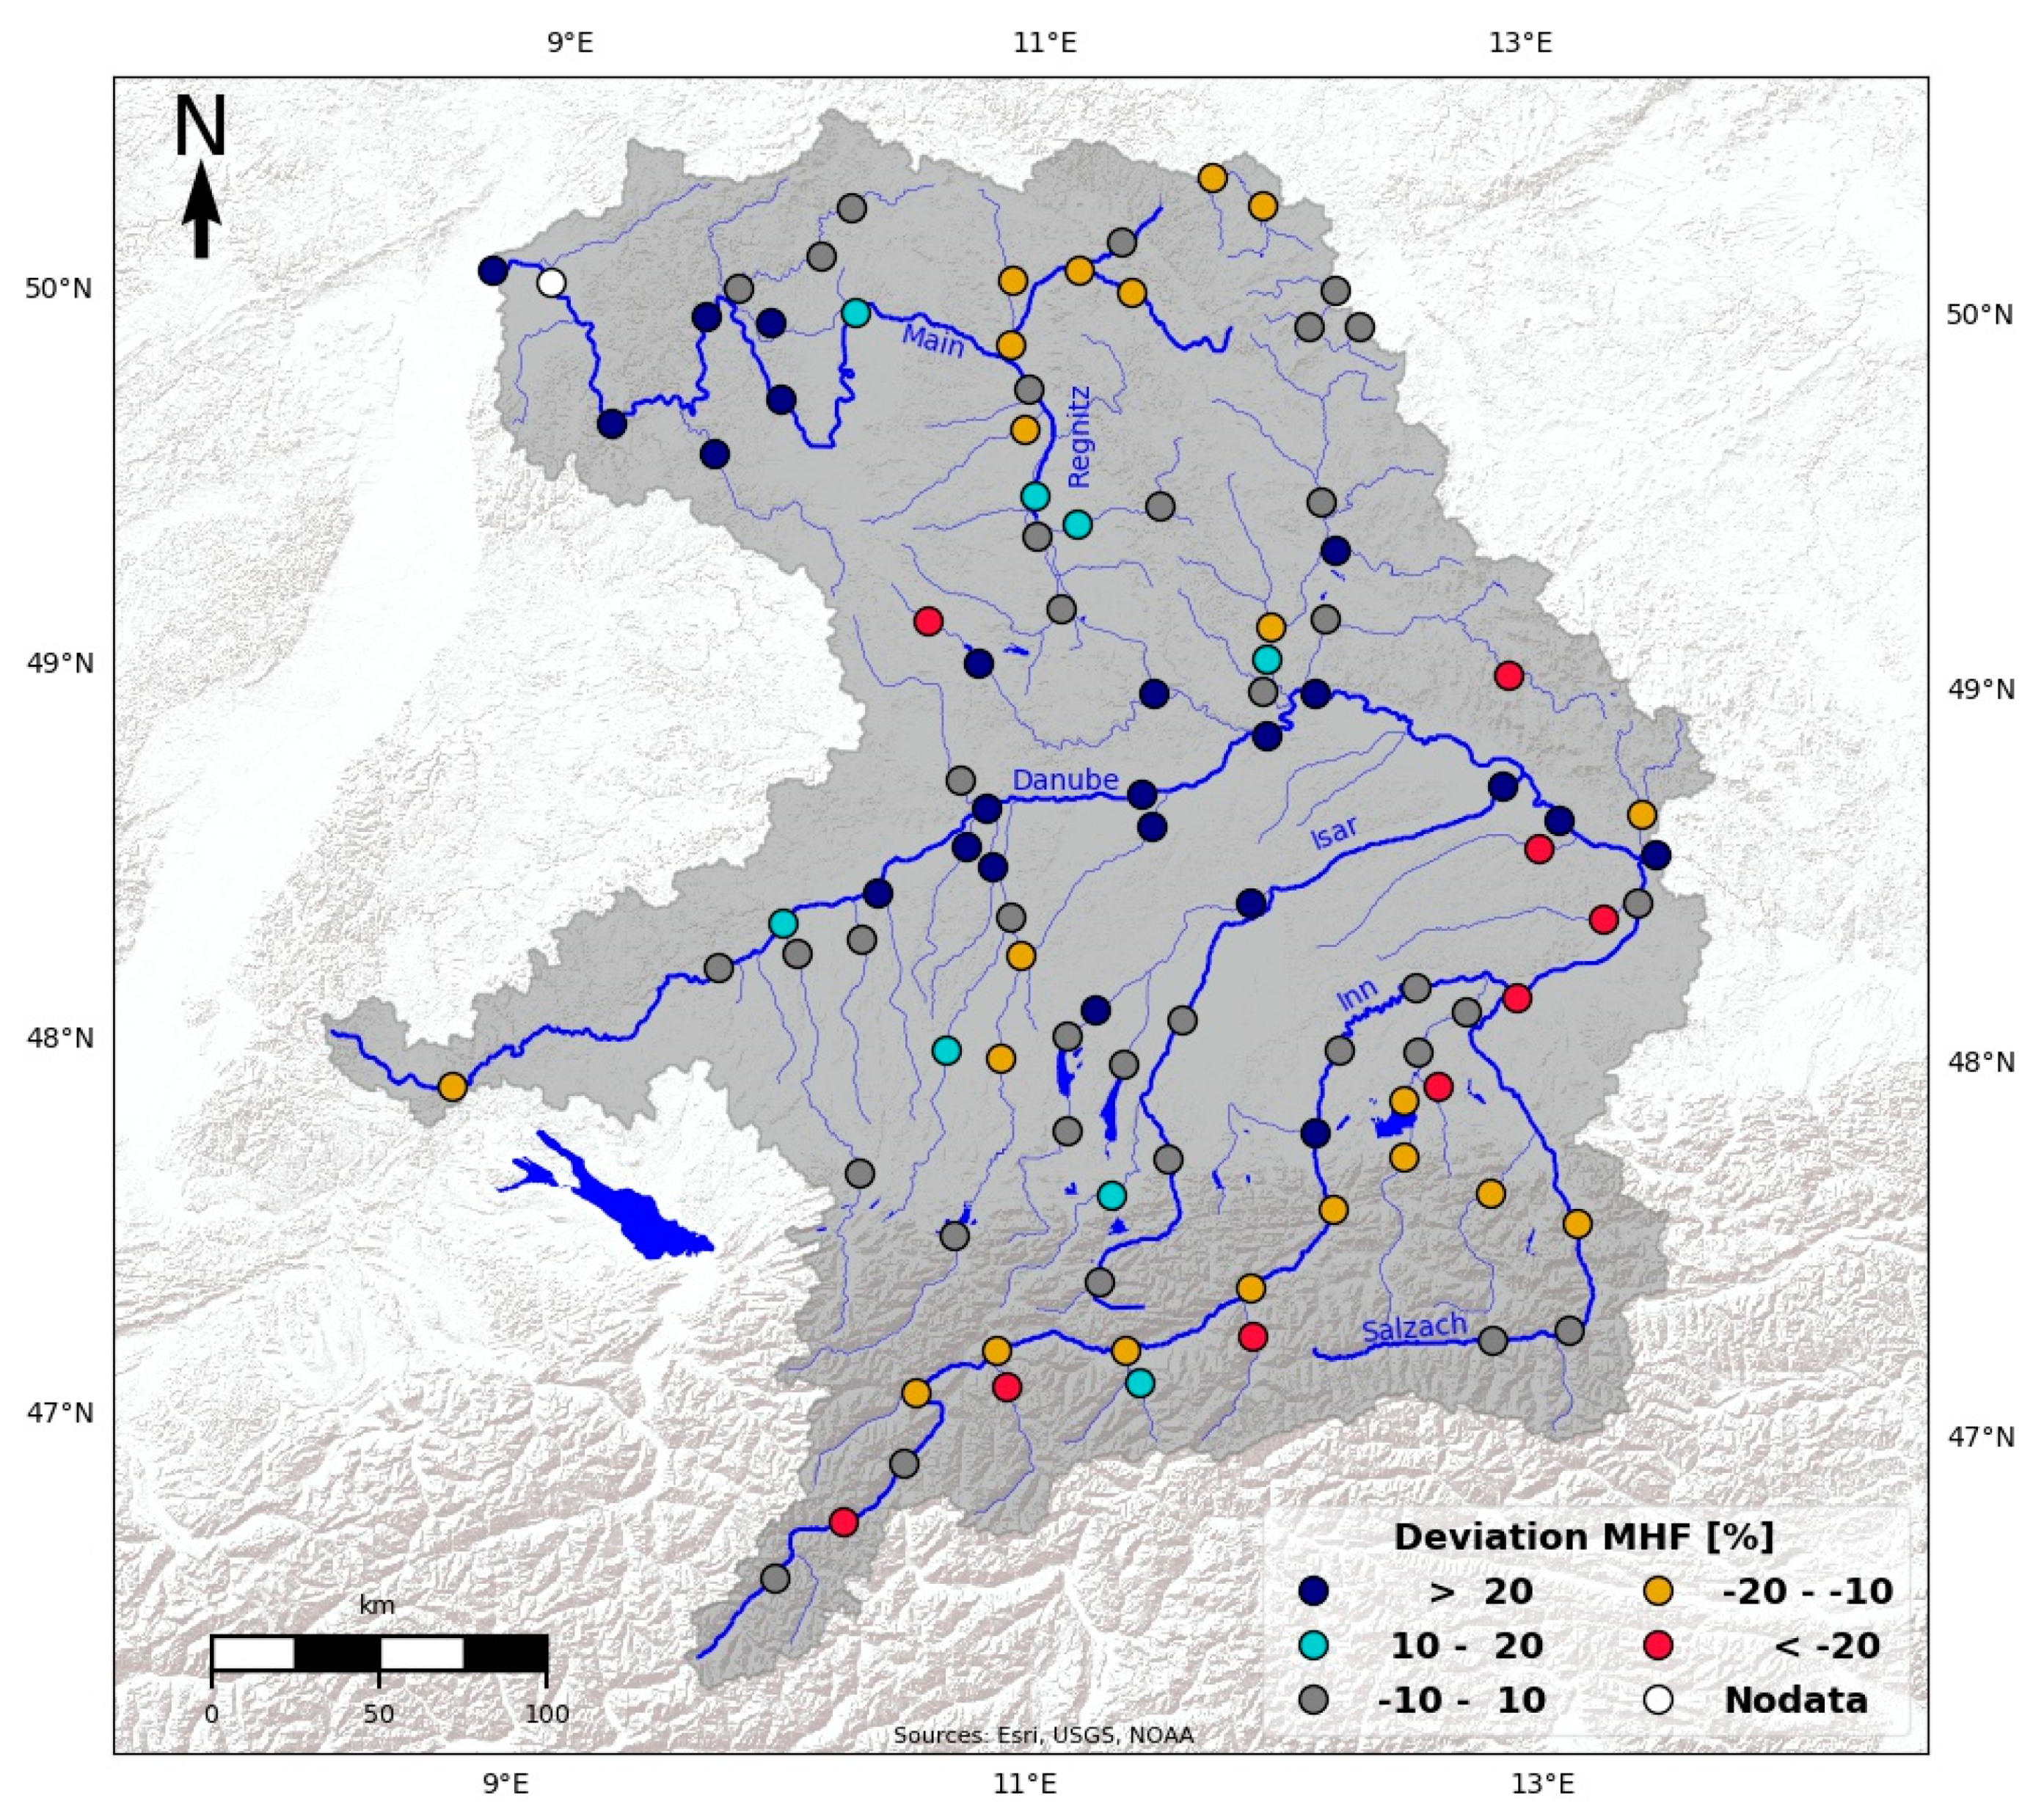
An indication for the applicability of the holistic model setup to estimate return levels is provided by the relative deviations between the observed and simulated mean high flows (MHF, i.e., average of annual maximum peaks of discharge over a given period, here 30 years of the reference period) illustrated in Figure 7. The deviations of MHF between simulations and observations are diverse within the entire Hydrological Bavaria. However, there are regions that exhibit considerable larger deviations than others. Simulated MHF for gauges situated in the Alps tend to underestimate the MHF derived from observations with values below −20% and up to −10% difference. This underestimation in MHF is ascribed to the underrepresentation of precipitation in the meteorological data that results in a smaller storage of snow and ice during the winter and thus a reduced discharge from snow and ice melt together with precipitation during spring and summer. For gauges in the vicinity of the Alps and south of the Danube, there are only few gauges that depict a larger deviation in MHF. For the majority of these gauges, the deviation is between −10% and +10%. However, along the Danube and the Isar, the differences in MHF become larger with distance from the source and with the increasing number of tributaries contributing to the Danube’s discharge. These deviations originate to some extent from the automatized calibration approach using observed discharge of tributaries as input for downstream catchments. Since the discharge of a downstream catchment is to a certain extent governed by the discharge of its tributaries (stronger dependency with larger upstream catchments), this approach leads to very good model fits during the calibration regardless of the automatized algorithm efforts to find an optimal parameter set. On the other hand, some tributaries to the Danube and Inn exhibit a stronger underestimation of simulated MHF (<−20%). In these cases, the model in general performs rather poorly leading to these deviations. For the gauges of the escarpment we generally find an underestimation along the upper Main, an overestimation along the lower Main, and small deviations for the gauges of the Regnitz river system. For the mountain ranges the model performs sufficiently well for most gauges.

3.2. Qualitiy Assessment of the Representation of Return Levels

The quality of the estimates of return levels, based on the model results and observations in the reference period is illustrated by LOT. The LOT is analyzed for the return periods of five, ten, and 20 years. Higher return periods are not considered here, as their estimate would be a result of an extrapolation of the GPD fit. The high flow values of the prior mentioned return periods are further referred to as HF5, HF10, and HF20, respectively.
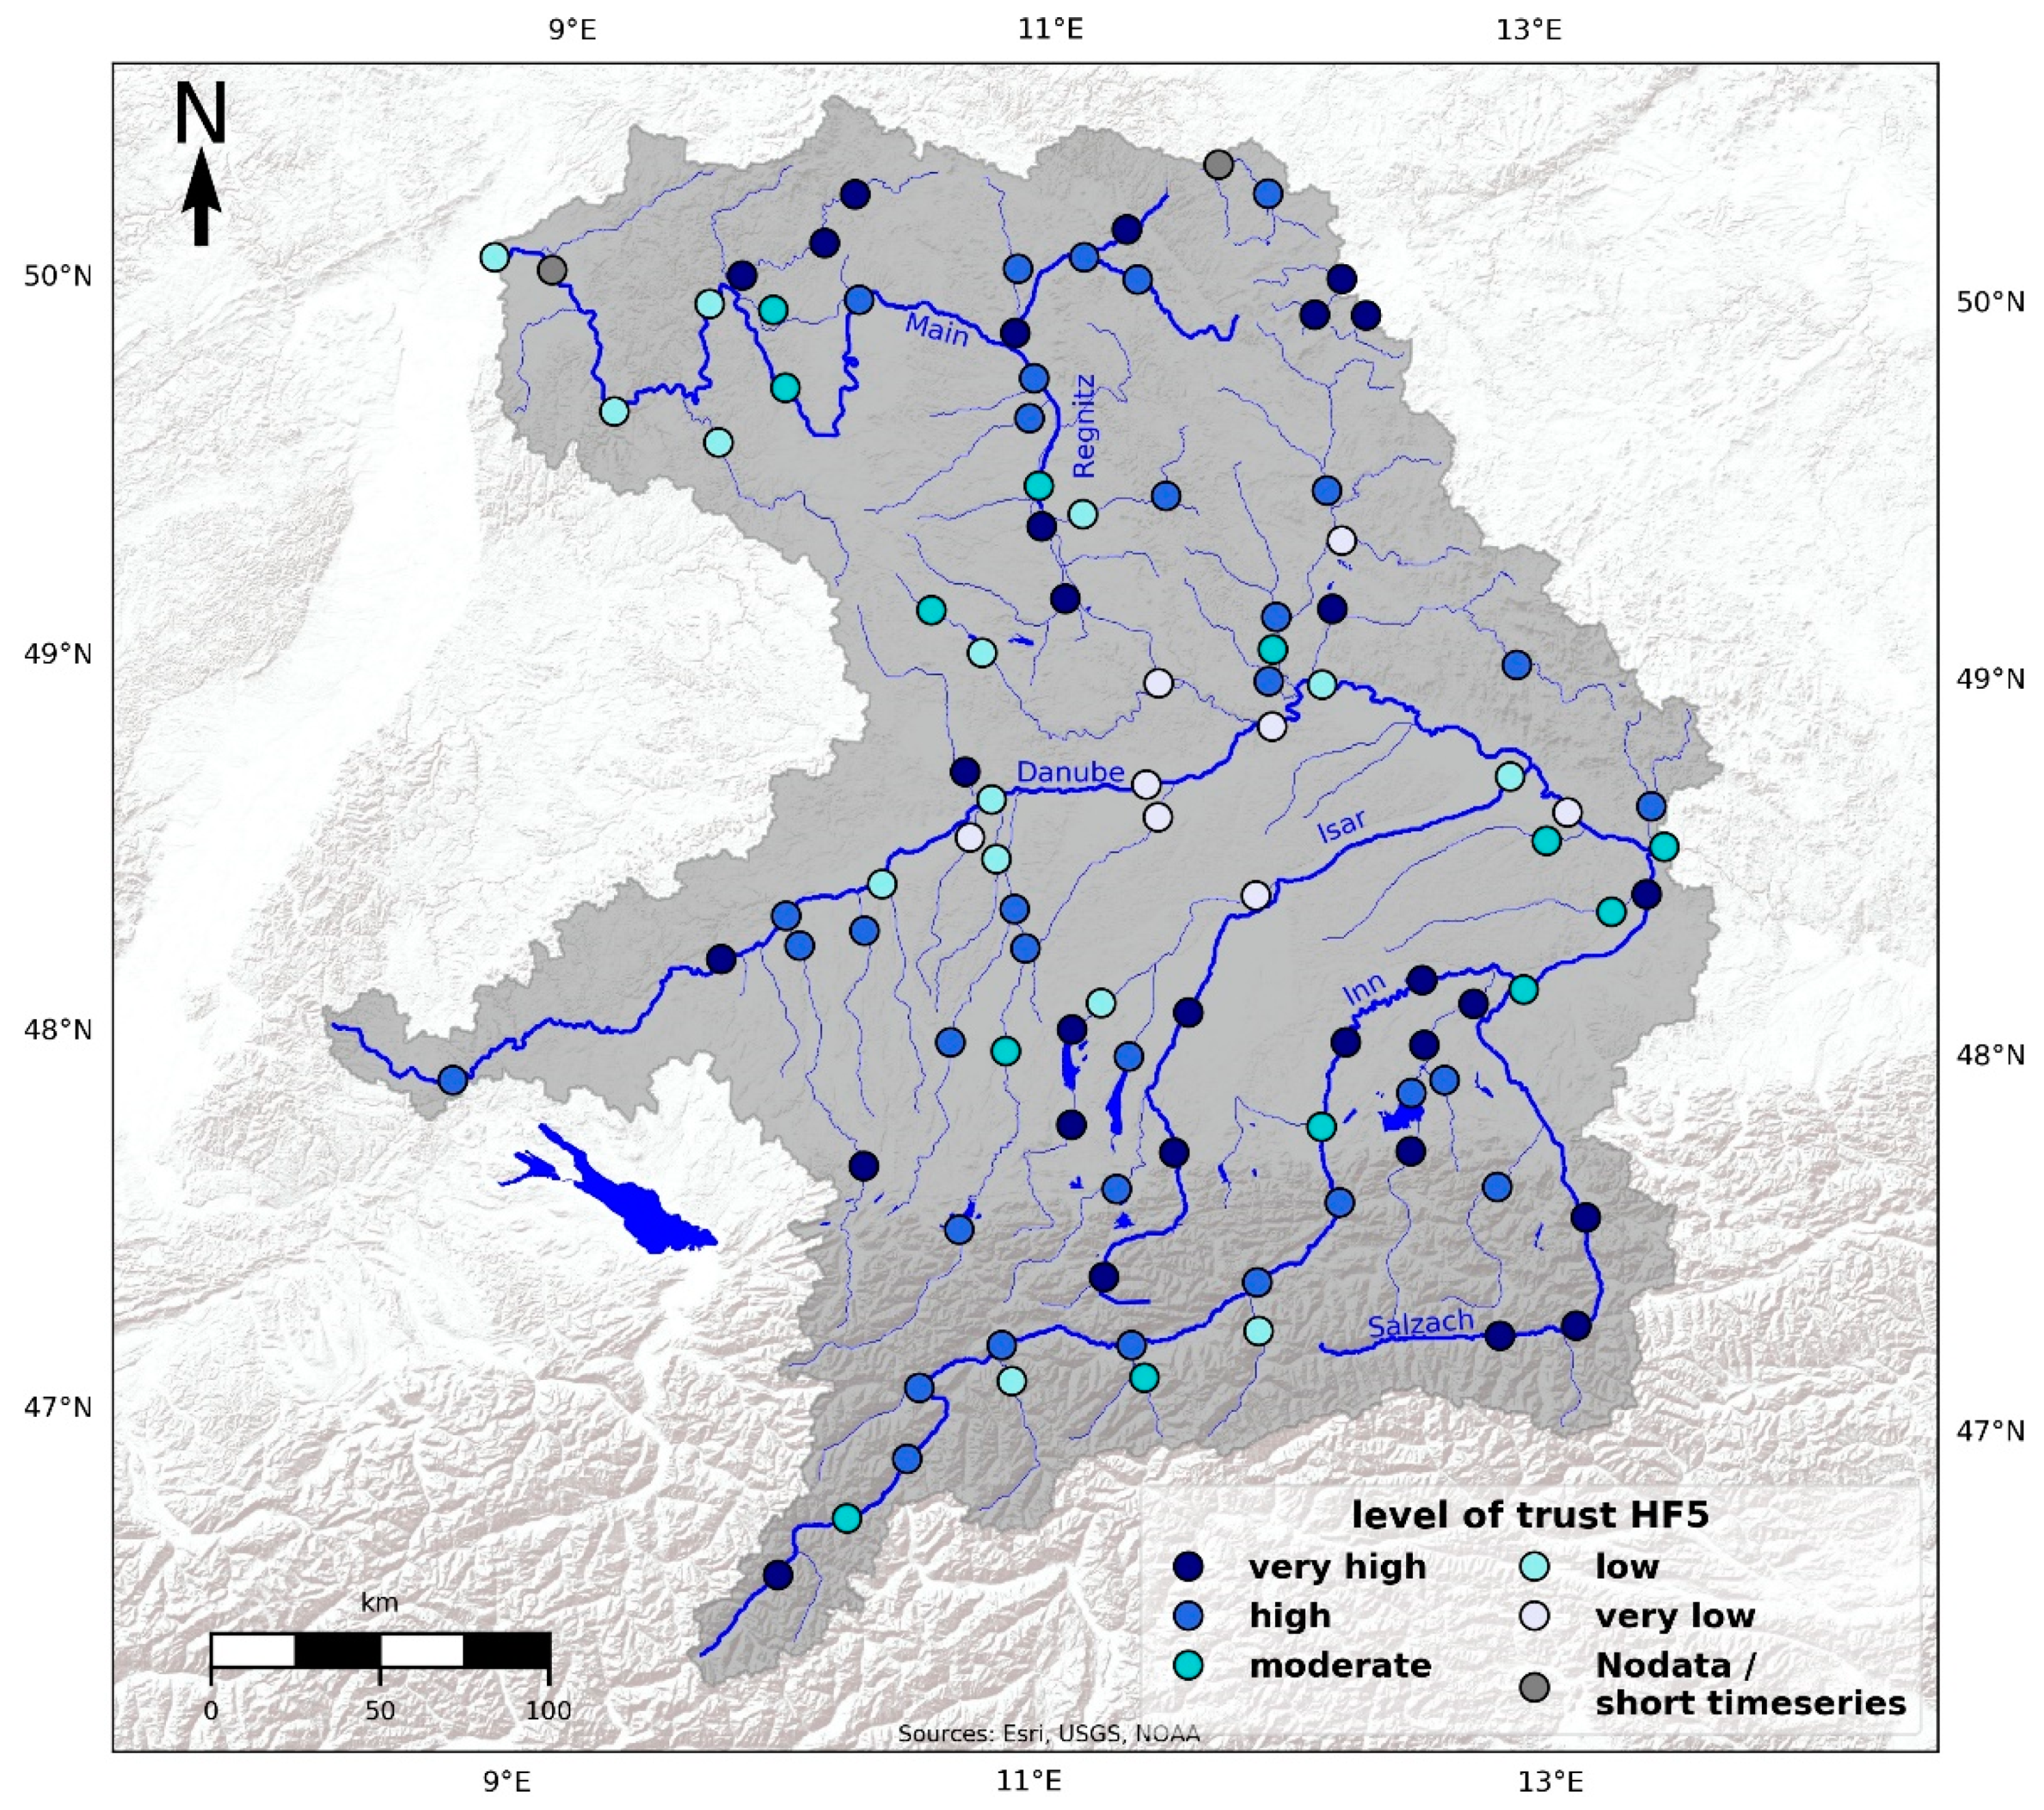
The LOT of the HF5 for all gauges are shown in Figure 8. Most gauges of the Danube basin exhibit a moderate to very high LOT. Exceptions with little to no trust in absolute values of the simulations are found for eight gauges, most of them situated at the Danube or its tributaries. Gauges within the Alps in most cases show a moderate to very high LOT as well, whereas only two values indicate a low confidence. The Main and Elbe basins depict a moderate to very high confidence in the representation of the HF5. Only four gauges downstream the Main show a low to very low LOT as well as one tributary to the Regnitz.
The LOT for high flow events with a return period of 10 years (HF10) is given in Figure 9. Here, a moderate to high LOT may be declared for gauges within the Danube basin. As it was the case for the HF5, the model does not allow for statements about actual values of the HF10 for some gauges of the Danube and its southern confluxes since the LOT is low or worse. The gauges of the basins of the Main and Elbe depict a decent confidence in HF10 values derived from simulations (moderate to very high LOT). Just a few gauges show a low confidence level. Compared to the HF5 the LOT diminishes for some gauges within the Alps, but still shows moderate to very high confidence for most gauges except for two smaller Austrian tributaries to the Inn.
Figure 10 shows the LOT for high flows with a 20-year return period (HF20). Compared to the HF5 and HF10, the overall confidence in simulated HF20 values decreases slightly. However, the confidence in the simulations is still moderate to very high for most gauges of the Danube with exceptions already noted for the HF5 and HF10. Hence, the simulations for these gauges are not suitable for the estimation of actual values of recurrence periods of any annuality. The simulations for the Main and Elbe basins still yield moderate to very high confidence in the representation of the HF20 as well. There are only minor shifts in confidence for the individual gauges and those showing a low or very low LOT for HF5 and HF10 remain within this category for the HF20, too. The model results for alpine gauges show a sustained moderate to very high confidence in the estimates of HF20. However, there is a shift from high to low confidence for one gauge of the Salzach catchment, indicating a divergence of the GPD between observations and model data for higher annualities.
In some cases, the LOT does not show a distinct pattern of decrease or increase for individual gauges with higher annualities, but instead gains or loses confidence independently from the annuality. Hence, the GPD features a distinct difference in shape between observations and modelled discharge for these gauges.

4. Discussion

4.1. On the Holistic Model Approach

The holistic modelling approach applied in this study to simulate the discharges for 98 catchments allows for a sufficient representation of the observations with regard to the presented objective measures of the NSE and KGE. Furthermore, the model provides sufficient results over different runoff regimes, including glacio-nival to nival regimes in the Alps, pluvio-nival in the Pre-Alps, nivo-pluvial in the Alpine foreland, and pluvial regimes of the Main and its tributaries [22]. Since the results are similar throughout the simulated periods for most of the individual gauges, the model is considered robust (i.e., unlikely over-parameterization [19]) towards changes in land cover and use, water management, and other processes affecting runoff formation. However, there are catchments with poor performance in every simulation period. Here, the model may not be able to represent the observations using parameters that are considered valid for various regions of the Hydrological Bavaria. This loss of performance when applying regionalized parameters is reported in several studies (e.g., [14,18,19,44]).
These studies seek to find optimal regionalized or globally applicable parameters by analyzing catchments which are either not affected by water management or other kinds of anthropogenic alteration, or the implemented structures only have minor effects on runoff formation. Hence, the parameters reflect the physical processes of these catchments. However, the catchments of the Hydrological Bavaria are severely influenced by different water management structures (e.g., detention basins, hydropower plants) or governed by the discharge of natural lakes. For the political Bavaria, the Bavarian Environment Agency (LfU) lists more than 4200 hydropower plants, 25 reservoirs or detention basins governed by the Bavarian state, and 150 larger natural lakes [66]. Since not every structure or natural lake affects the discharge of the catchments presented in this study, only the most important were included in the modeling approach. These structures might have a certain impact on the global definition of parameters. This is especially the case for the Main-Danube transfer system which is a complex structure comprising the transfer channel as well as the transfer of water between three artificial lakes which are additionally used for low flow elevation.
The holistic modelling approach might further benefit from an improved data basis for soils and hydrogeology as this information is crucial for the hydrological simulation with WaSiM. Since the data provided by the ESDB comprises only eleven texture classes (five for top- and sub-soils each and one organic) [27] for European soils, the parameterization of the individual soil types is limited to these classes. To avoid larger uncertainties due to over-parameterization, these parameters were not adjusted for most catchments of the Hydrological Bavaria. However, for three catchments the calibration indicated that the parameter values for a dominating soil type were responsible for an insufficient performance. By comparing the grain size distribution of the USDA metric [67] with the common soil texture metric for Germany [68] these EDSB parameters have been replaced.
Furthermore, the hydrological model itself could be improved to further enhance the overall performance of the holistic modelling approach. WaSiM employs a single selected routine for the simulation of snowfall and -melt, as well as glacier development. For this study we opted for a method after Warscher et al. [36] which includes a high degree of physical processes (i.e., radiation-based melt, distribution of snow by gravity and wind). This approach was developed for high Alpine terrain and thus might not yield any benefit in regions outside the Alps. Hence, the hydrological model could be adapted to employ several different snow melt approaches suitable for different landscapes.
Usually, automatized calibration approaches like SCE-UA or DDS are used to facilitate the parameterization of a model [14,18,19,39,69,70,71]. However, in most cases these algorithms are applied to single headwater catchments. The automatic calibration approach for downstream catchments applied in this study using observed discharge as inflows seems to affect the performance of gauges with further distance from its headwater. The intension of this practice was to avoid the propagation of modelling errors. Since the discharge at gauges defining larger catchments is mostly governed by its tributaries, the objective metrics during the calibration using the DDS-SA approach were close to optimal by definition. Hence, the parameters gained by the automatized calibration for downstream catchments do not reflect the physical processes of that sub-catchment but rather an attempt to adjust the cumulative discharge of its tributaries.
Nonetheless, a poor performance at individual gauges is overall outweighed by a gain in spatial consistency, reduction of equifinality by avoiding over-parameterization, and the provisioning of a holistic simulation approach [14].

4.2. On the LOT

The four performance criteria used in this study were selected due to their focus on different regions of the statistical distribution of discharge values according to [44,45,46]. Furthermore, for the automatic calibration the NSE and KGE were emphasized by assigning higher weights. Since the model was targeted at representing the high flows, we have assigned the highest weights to the NSE. The NSE is known to be more sensitive for deviations in high flows [46] due to its sensitivity to deviations between higher discharge values, received the highest weight. However, Mizukami et al. [72] state that a parameterization based on the KGE leads to a better simulation of high flow values as it considers the mean and variance. The performance of a model with respect to high flows might further increase when weights are applied to the compartments of the KGE (correlation coefficient, bias of mean and variance). Hence, the selected weights for the automatic calibration might be misleading for the parameterization of the model towards a sufficient representation of high flows. On the other hand, Knoben et al. [73] point out that the NSE and the KGE should not be interpreted the same way as the “KGE does not have an inherent benchmark against which flows are compared”. For the NSE this benchmark is represented by the mean of the observations, whereas for the KGE the benchmark must be specified by the user. Therefore, the weights of the overall calibration metric can be considered reasonable.
The LOT of return periods strongly depends on the model’s capability to sufficiently simulate high flows. Furthermore, it also relies on the approach selected for the estimation of EVD. In this study we opt for the GPD in conjunction with the POT to estimate for the reference period from 1981 to 2010. The POT method is supposed to yield a better EVD than when applying AM, especially if the time series is short (i.e., less than 14 years) [62]. However, an estimation of higher return periods requires a larger sample size that cannot be provided by AM in most cases. Since the reference period comprises 30 years, the sample of 30 annual peaks is still not sufficient for the estimation of longer return periods. Therefore, the POT method was chosen to form a sufficient sample size for the EVD. The GPD is sensitive to the threshold defining the sample size as well as to the statistical threshold defining the value when an event is considered extreme [47,48,49,54]. Thus, an individual threshold for each gauge of the Hydrological Bavaria might result in an increase in confidence in the presented estimated return periods. Nevertheless, these thresholds derived by either graphical or analytical methods are still prone to the subjective choice by the user as there is no optimal value [48,49,53]. Furthermore, an individual threshold might still not increase the LOT for the worst performing gauges.
A low LOT implies that the model is not applicable to estimate actual values of return levels. Here, the holistic modelling approach does not provide parameters that result in a sufficient representation of high flows. This behavior is also reported by Ricard et al. [14] when applying regionalized parameters to model various catchments.
Further improvements for the presented hydrological model comprise the adjustment of the undercatch of precipitation in the Alps and the adjustment of operating rules for the implemented reservoirs and lakes. These features affect the runoff formation and thus the simulation of high flows.

5. Conclusions

A first holistic modelling approach intended to develop a robust toolset to support water resources management under climate change conditions with robust estimates of return levels was introduced. The approach comprises a semi-global and semi-automatized calibration for the 98 catchments of the Hydrological Bavaria. The model applies a regionalized set of parameters that exhibit satisfactory results with regard to the presented evaluation metrics and simulation periods, with the values of the NSE and KGE exceeding 0.6 for the majority of the 98 gauges. For many gauges, the holistic modelling approach lead to satisfactory results for the MHF where relative deviations between observed and simulated values were kept at around ±10%. However, there are gauges where deviations are larger in MHF and for various return levels (>20%), thus creating lower confidence. Deviations of such magnitude reduce the trustworthiness of model performance; in consequence, a low level of confidence should be markedly illustrated when estimating changes in absolute values of peak flow return levels. Most of these poor performances can be attributed to deficiencies in the provided input data (e.g., lack of operational rulesets for water management structures, soil data, meteorological data) rather than the holistic modelling approach.
Even though individual adjustments could be made to improve the performance of single catchments, the overall benefits gained from a holistic modelling approach outweighs the shortcomings of a few gauges. By using a holistic modelling approach, it is possible to model larger catchments without the need to sacrifice model complexity.
For many applications, CCI studies are interested in the course of future trends compared to a certain reference period rather than in absolute values [18]. Changes in streamflow are a response to changes in climate conditions (or changes in land use or water management). Hence, we consider the model to perform sufficiently well to derive relative changes in the frequency and intensity from simulations.
For future applications of the model, there is potential to further improve its performance. One would be to increase the volume of precipitation over the Alps in the meteorological reference SDCLIREF to reduce the underestimation of runoff in this region. The model could also benefit from an increase of the level of detail of homogenized soil information, and a better representation of humanmade hydraulic/hydrologic structures.

Supplementary Materials

The following refer to [43,44,45,49] and are available online at https://www.mdpi.com/2073-4441/12/9/2349/s1, Equations (S1a) and (S1b): The Nash & Sutcliffe efficiency (a) and its logarithmic form (b), Equations (S2a), (S2b), and (S2c): The Kling-Gupta Efficiency (a) and its compartments (b) and (c). Equation (S3): the ratio of root mean square error to standard deviation of observations, Equation (S4): Normalization of return levels of discharge, Figure S1: Mean and standard deviation for standardized return levels of the HF5 over all 98 gauges, Figure S2: Mean and standard deviation for standardized return levels of the HF10 over all 98 gauges, Figure S3: Mean and standard deviation for standardized return levels of the HF20 over all 98 gauges.

Author Contributions

Conceptualization, F.W.; methodology, F.W., B.P.; software, F.W., R.R.W. and J.W.; validation, F.W. and F.v.T.; formal analysis, F.W.; investigation, F.W.; resources, R.L.; data curation, F.W., R.R.W. and F.v.T.; writing—original draft preparation, F.W.; writing—review and editing, R.R.W., F.v.T., B.P., J.W. and R.L.; visualization, F.W.; supervision, R.L.; project administration, R.L.; funding acquisition, R.L. All authors have read and agreed to the published version of the manuscript.

Funding

This research was funded by the Bavarian State Ministry for the Environment and Consumer Protection (StMUV). Computations with WaSiM-ETH for the ClimEx project were conducted on the SuperMUC supercomputer of the Leibniz Supercomputing Centre (LRZ) of the Bavarian Academy of Sciences and Humanities. The operation of this supercomputer was granted and funded via the Gauss Centre for Supercomputing (GCS) by the German Federal Ministry of Education and Research and the Bavarian State Ministry of Education, Science, and the Arts.

Acknowledgments

The authors thank Gilbert Brietzke and André Kurzmann from the LRZ Garching for their technical support and advice using the LRZ’s supercomputing facilities. Furthermore, the authors would like to acknowledge the LRZ for the provisioning of extensive computation resources to perform the hydrological modelling. We also thank Jörg Schulla for his efforts in improving the hydrological model WaSiM and his advice of its application. Also, we thank Holger Komischke (LfU, StMUV) for his support regarding data acquisition.

Conflicts of Interest

The authors declare no conflict of interest. The funders had no role in the design of the study; in the collection, analyses, or interpretation of data; in the writing of the manuscript, or in the decision to publish the results.

References

  1. Collins, M.; Knutti, R.; Arblaster, J.; Dufresne, J.-L.; Fichefet, T.; Friedlingstein, P.; Gao, X.; Gutowski, W.J.; Johns, T.; Krinner, G.; et al. Long-term climate change: Projections, commitments and irreversibility. In Climate Change 2013-The Physical Science Basis: Contribution of Working Group I to the Fifth Assessment Report of the Intergovernmental Panel on Climate Change; Stocker, T.F., Qin, D., Plattner, G.-K., Tignor, M., Allen, S.K., Boschung, J., Nauels, A., Xia, Y., Bex, V., Midgley, P.M., Eds.; Cambridge University Press: Cambridge, UK, 2013; pp. 1029–1136. ISBN 9781107057991. [Google Scholar]
  2. IPCC. Climate Change 2014: Synthesis Report. Contribution of Working Groups I, II and III to the Fifth Assessment Report of the Intergovernmental Panel on Climate Change; Pachauri, R., Meyer, L., Eds.; IPCC: Geneva, Switzerland, 2014; p. 151. [Google Scholar]
  3. Dooge, J.C.I. Looking for hydrologic laws. Water Resour. Res. 1986, 22, 46–58. [Google Scholar] [CrossRef]
  4. Leduc, M.; Mailhot, A.; Frigon, A.; Martel, J.-L.; Ludwig, R.; Brietzke, G.B.; Giguère, M.; Brissette, F.; Turcotte, R.; Braun, M. The ClimEx Project: A 50-member ensemble of climate change projections at 12-km resolution over Europe and Northeastern North America with the Canadian regional climate model (CRCM5). J. Appl. Meteorol. Climatol. 2019, 58, 663–693. [Google Scholar] [CrossRef] [Green Version]
  5. Van Vuuren, D.P.; Edmonds, J.; Kainuma, M.; Riahi, K.; Thomson, A.; Hibbard, K.; Hurtt, G.C.; Kram, T.; Krey, V.; Lamarque, J.-F.; et al. The representative concentration pathways: An overview. Clim. Chang. 2011, 109, 5. [Google Scholar] [CrossRef]
  6. Mauser, W.; Prasch, M. (Eds.) Regional Assessment of Global Change Impacts: The Project GLOWA-Danube; Springer: Berlin/Heidelberg, Germany, 2015. [Google Scholar] [CrossRef]
  7. Muerth, M.; Gauvin St-Denis, B.; Ricard, S.; Velázquez, J.A.; Schmid, J.; Minville, M.; Caya, D.; Chaumont, D.; Ludwig, R.; Turcotte, R. On the need for bias correction in regional climate scenarios to assess climate change impacts on river runoff. Hydrol. Earth Syst. Sci. 2013, 17, 1189–1204. [Google Scholar] [CrossRef] [Green Version]
  8. Velázquez, J.A.; Schmid, J.; Ricard, S.; Muerth, M.J.; St-Denis, B.G.; Minville, M.; Chaumont, D.; Caya, D.; Ludwig, R.; Turcotte, R. An ensemble approach to assess hydrological models’ contribution to uncertainties in the analysis of climate change impact on water resources. Hydrol. Earth Syst. Sci. 2013, 17, 565–578. [Google Scholar] [CrossRef] [Green Version]
  9. Mauser, W.; Bach, H. PROMET–Large scale distributed hydrological modelling to study the impact of climate change on the water flows of mountain watersheds. J. Hydrol. 2009, 376, 362–377. [Google Scholar] [CrossRef]
  10. Schulla, J. Model Description WaSiM: (Water Balance Simulation Model). Available online: www.wasim.ch (accessed on 9 June 2020).
  11. Hattermann, F.F.; Wortmann, M.; Liersch, S.; Toumi, R.; Sparks, N.; Genillard, C.; Schröter, K.; Steinhausen, M.; Gyalai-Korpos, M.; Máté, K.; et al. Simulation of flood hazard and risk in the Danube basin with the Future Danube Model. Clim. Serv. 2018, 12, 14–26. [Google Scholar] [CrossRef]
  12. Krysanova, V.; Hattermann, F.; Wechsung, F. Development of the ecohydrological model SWIM for regional impact studies and vulnerability assessment. Hydrol. Process. 2005, 19, 763–783. [Google Scholar] [CrossRef]
  13. Beven, K.; Freer, J. Equifinality, data assimilation, and uncertainty estimation in mechanistic modelling of complex environmental systems using the GLUE methodology. J. Hydrol. 2001, 249, 11–29. [Google Scholar] [CrossRef]
  14. Ricard, S.; Bourdillon, R.; Rousse, L.D.; Turcotte, R. Global Calibration of Distributed Hydrological Models for Large-Scale Applications. J. Hydrol. Eng. 2013, 18, 719–721. [Google Scholar] [CrossRef]
  15. Bárdossy, A. Calibration of hydrological model parameters for ungauged catchments. Hydrol. Earth Syst. Sci. 2007, 11, 703–710. [Google Scholar] [CrossRef] [Green Version]
  16. Samaniego, L.; Kumar, R.; Attinger, S. Multiscale parameter regionalization of a grid-based hydrologic model at the mesoscale. Water Resour. Res. 2010, 46. [Google Scholar] [CrossRef] [Green Version]
  17. Kouchi, D.H.; Esmaili, K.; Faridhosseini, A.; Sanaeinejad, S.H.; Khalili, D.; Abbaspour, K.C. Sensitivity of Calibrated Parameters and Water Resource Estimates on Different Objective Functions and Optimization Algorithms. Water 2017, 9, 384. [Google Scholar] [CrossRef] [Green Version]
  18. Gaborit, É.; Ricard, S.; Lachance-Cloutier, S.; Anctil, F.; Turcotte, R. Comparing global and local calibration schemes from a differential split-sample test perspective. Can. J. Earth Sci. 2015, 52, 990–999. [Google Scholar] [CrossRef]
  19. Merz, R.; Blöschl, G. Regionalisation of catchment model parameters. J. Hydrol. 2004, 287, 95–123. [Google Scholar] [CrossRef] [Green Version]
  20. Xu, C.-Y.; Widén, E.; Halldin, S. Modelling hydrological consequences of climate change—Progress and challenges. Adv. Atmos. Sci. 2005, 22, 789–797. [Google Scholar] [CrossRef]
  21. Blöschl, G.; Sivapalan, M. Scale issues in hydrological modelling: A review. Hydrol. Process. 1995, 9, 251–290. [Google Scholar] [CrossRef]
  22. Poschlod, B.; Willkofer, F.; Ludwig, R. Impact of Climate Change on the Hydrological Regimes in Bavaria. Water 2020, 12, 1599. [Google Scholar] [CrossRef]
  23. European Environment Agency. Digital Elevation Model over Europe (EU-DEM). 2013. Available online: https://www.eea.europa.eu/data-and-maps/data/eu-dem (accessed on 9 June 2020).
  24. European Environment Agency. Corine Land Cover 2006 v17. 2013. Available online: https://www.eea.europa.eu/data-and-maps/data/clc-2006-raster-3 (accessed on 9 June 2020).
  25. European Commission and the European Soil Bureau Network. The European Soil Database Distribution Version 2.0 EUR 19945 EN. 2004. Available online: https://esdac.jrc.ec.europa.eu/content/european-soil-database-v20-vector-and-attribute-data (accessed on 9 June 2020).
  26. Panagos, P. The European soil database. GEO Connex. 2006, 5, 32–33. [Google Scholar]
  27. Wösten, J.H.M.; Lilly, A.; Nemes, A.; Le Bas, C. Development and use of a database of hydraulic properties of European soils. Geoderma 1999, 90, 169–185. [Google Scholar] [CrossRef]
  28. Dörhöfer, G.; Hannappel, S.; Reutter, E.; Voigt, H.-J. Die Hydrogeologische Übersichtskarte von Deutschland HÜK200. Z. Für Angew. Geol. 2001, 47, 153–159. [Google Scholar]
  29. BGR; UNESCO (Eds.) International Hydrogeological Map of Europe 1:1,500,000 (IHME1500 v1.1); Bundesanstalt für Geowissenschaften und Rohstoffe (BGR): Hannover, Germany; Paris, France, 2014. [Google Scholar]
  30. Shamra, A.; Srikanthan, S. Continuous rainfall simulation: A nonparametric alternative. In Proceedings of the 30th Hydrology & Water Resources Symposium: Past, Present & Future, Launceston, Australia, 4–7 December 2006. [Google Scholar]
  31. Pui, A.; Sharma, A.; Mehrotra, R.; Sivakumar, B.; Jeremiah, E. A comparison of alternatives for daily to sub-daily rainfall disaggregation. J. Hydrol. 2012, 470, 138–157. [Google Scholar] [CrossRef] [Green Version]
  32. Westra, S.; Mehrotra, R.; Sharma, A.; Srikanthan, R. Continuous rainfall simulation: 1. A regionalized subdaily disaggregation approach. Water Resour. Res. 2012, 48. [Google Scholar] [CrossRef] [Green Version]
  33. Poschlod, B.; Hodnebrog, Ø.; Wood, R.R.; Alterskjær, K.; Ludwig, R.; Myhre, G.; Sillmann, J. Comparison and Evaluation of Statistical Rainfall Disaggregation and High-Resolution Dynamical Downscaling over Complex Terrain. J. Hydrometeorol. 2018, 19, 1973–1982. [Google Scholar] [CrossRef]
  34. Rauthe, M.; Steiner, H.; Riediger, U.; Mazurkiewicz, A.; Gratzki, A. A Central European precipitation climatology—Part I: Generation and validation of a high-resolution gridded daily data set (HYRAS). Meteorol. Z. 2013, 22, 235–256. [Google Scholar] [CrossRef]
  35. Monteith, J.L. Evaporation and environment. Symp. Soc. Exp. Biol. 1965, 19, 205–234. [Google Scholar]
  36. Warscher, M.; Strasser, U.; Kraller, G.; Marke, T.; Franz, H.; Kunstmann, H. Performance of complex snow cover descriptions in a distributed hydrological model system: A case study for the high Alpine terrain of the Berchtesgaden Alps. Water Resour. Res. 2013, 49, 2619–2637. [Google Scholar] [CrossRef] [Green Version]
  37. Richards, L.A. Capillary conduction of liquids through porous mediums. Physics 1931, 1, 318–333. [Google Scholar] [CrossRef]
  38. Liersch, S.; Drews, M.; Pilz, T.; Salack, S.; Sietz, D.; Aich, V.; Larsen, M.A.D.; Gädeke, A.; Halsnæs, K.; Thiery, W. One simulation, different conclusions—The baseline period makes the difference! Environ. Res. Lett. 2020. [Google Scholar] [CrossRef]
  39. Tolson, B.A.; Shoemaker, C.A. Dynamically dimensioned search algorithm for computationally efficient watershed model calibration. Water Resour. Res. 2007, 43. [Google Scholar] [CrossRef]
  40. Behrangi, A.; Khakbaz, B.; Vrugt, J.A.; Duan, Q.; Sorooshian, S. Comment on “Dynamically dimensioned search algorithm for computationally efficient watershed model calibration” by Bryan A. Tolson and Christine A. Shoemaker. Water Resour. Res. 2008, 44. [Google Scholar] [CrossRef] [Green Version]
  41. Huang, X.; Liao, W.; Lei, X.; Jia, Y.; Wang, Y.; Wang, X.; Jiang, Y.; Wang, H. Parameter optimization of distributed hydrological model with a modified dynamically dimensioned search algorithm. Environ. Model. Softw. 2014, 52, 98–110. [Google Scholar] [CrossRef]
  42. Arsenault, R.; Poulin, A.; Côté, P.; Brissette, F. Comparison of stochastic optimization algorithms in hydrological model calibration. J. Hydrol. Eng. 2014, 19, 1374–1384. [Google Scholar] [CrossRef]
  43. Nash, J.E.; Sutcliffe, J.V. River flow forecasting through conceptual models part I—A discussion of principles. J. Hydrol. 1970, 10, 282–290. [Google Scholar] [CrossRef]
  44. Gupta, H.V.; Kling, H.; Yilmaz, K.K.; Martinez, G.F. Decomposition of the mean squared error and NSE performance criteria: Implications for improving hydrological modelling. J. Hydrol. 2009, 377, 80–91. [Google Scholar] [CrossRef] [Green Version]
  45. Moriasi, D.N.; Arnold, J.G.; van Liew, M.W.; Bingner, R.L.; Harmel, R.D.; Veith, T.L. Model evaluation guidelines for systematic quantification of accuracy in watershed simulations. Trans. ASABE 2007, 50, 885–900. [Google Scholar] [CrossRef]
  46. Krause, P.; Boyle, D.P.; Bäse, F. Comparison of different efficiency criteria for hydrological model assessment. Adv. Geosci. 2005, 5, 89–97. [Google Scholar] [CrossRef] [Green Version]
  47. Bezak, N.; Brilly, M.; Šraj, M. Comparison between the peaks-over-threshold method and the annual maximum method for flood frequency analysis. Hydrol. Sci. J. 2014, 59, 959–977. [Google Scholar] [CrossRef] [Green Version]
  48. Curceac, S.; Atkinson, P.M.; Milne, A.; Wu, L.; Harris, P. An evaluation of automated GPD threshold selection methods for hydrological extremes across different scales. J. Hydrol. 2020, 585, 124845. [Google Scholar] [CrossRef]
  49. Lang, M.; Ouarda, T.B.M.J.; Bobée, B. Towards operational guidelines for over-threshold modeling. J. Hydrol. 1999, 225, 103–117. [Google Scholar] [CrossRef]
  50. Solari, S.; Losada, M.A. A unified statistical model for hydrological variables including the selection of threshold for the peak over threshold method. Water Resour. Res. 2012, 48. [Google Scholar] [CrossRef]
  51. Pickands, J. Statistical Inference Using Extreme Order Statistics. Ann. Stat. 1975, 3, 119–131. [Google Scholar] [CrossRef]
  52. Balkema, A.A.; de Haan, L. Residual Life Time at Great Age. Ann. Probab. 1974, 2, 792–804. [Google Scholar] [CrossRef]
  53. Scarrott, C.; MacDonald, A. A review of extreme value threshold estimation and uncertainty quantification. REVSTAT Stat. J. 2012, 10, 33–60. [Google Scholar]
  54. Bernardara, P.; Mazas, F.; Kergadallan, X.; Hamm, L. A two-step framework for over-threshold modelling of environmental extremes. Nat. Hazards Earth Syst. Sci. 2014, 14, 635. [Google Scholar] [CrossRef] [Green Version]
  55. Coles, S.; Bawa, J.; Trenner, L.; Dorazio, P. An Introduction to Statistical Modeling of Extreme Values; Springer: Berlin/Heidelberg, Germany, 2001. [Google Scholar] [CrossRef]
  56. Gharib, A.; Davies, E.; Goss, G.; Faramarzi, M. Assessment of the Combined Effects of Threshold Selection and Parameter Estimation of Generalized Pareto Distribution with Applications to Flood Frequency Analysis. Water 2017, 9, 692. [Google Scholar] [CrossRef]
  57. Cunnane, C. A note on the Poisson assumption in partial duration series models. Water Resour. Res. 1979, 15, 489–494. [Google Scholar] [CrossRef]
  58. Fischer, S.; Schumann, A. Robust flood statistics: Comparison of peak over threshold approaches based on monthly maxima and TL-moments. Hydrol. Sci. J. 2016, 61, 457–470. [Google Scholar] [CrossRef] [Green Version]
  59. Hosking, J.R.M. L-Moments: Analysis and Estimation of Distributions Using Linear Combinations of Order Statistics. J. R. Stat. Soc. Ser. B 1990, 52, 105–124. [Google Scholar] [CrossRef]
  60. Hosking, J.R.M.; Wallis, J.R. Regional Frequency Analysis. An Approach Based on L-Moments; Cambridge University Press: Cambridge, UK, 1997. [Google Scholar] [CrossRef]
  61. Reiss, R.-D.; Thomas, M. Statistical Analysis of Extreme Values. with Applications to Insurance, Finance, Hydrology and Other Fields, 3rd ed.; Birkhäuser Verlag AG: Basel, Switzerland, 2007. [Google Scholar] [CrossRef]
  62. Robson, A.; Reed, D. Flood Estimation Handbook Volume 3: Statistical Procedures for Flood Frequency Estimation; Centre for Ecology and Hydrology: Wallingford, UK, 1999; ISBN 0948540915. [Google Scholar]
  63. Bačová-Mitková, V.; Onderka, M. Analysis of extreme hydrological Events on the Danube using the Peak Over Threshold method. J. Hydrol. Hydromech. 2010, 58, 88–101. [Google Scholar] [CrossRef] [Green Version]
  64. Prein, A.F.; Gobiet, A. Impacts of uncertainties in European gridded precipitation observations on regional climate analysis. Int. J. Climatol. 2017, 37, 305–327. [Google Scholar] [CrossRef] [PubMed]
  65. Meyer, J.; Kohn, I.; Stahl, K.; Hakala, K.; Seibert, J.; Cannon, A.J. Effects of univariate and multivariate bias correction on hydrological impact projections in alpine catchments. Hydrol. Earth Syst. Sci. 2019, 1339–1354. [Google Scholar] [CrossRef] [Green Version]
  66. Bayerisches Landesamt für Umwelt. Allgemeine Daten zur Wasserwirtschaft. Available online: https://www.lfu.bayern.de/wasser/allgemeine_daten_wasserwirtschaft/index.htm (accessed on 2 July 2020).
  67. United States Department of Agricultire (USDA). Soil Survey Manual; Government Printing Office: Washington, DC, USA, 1951.
  68. Deutscher Verband für Wasserwirtschaft und Kulturbau Fachausschuss Verdunstung. Ermittlung der Verdunstung von Land- und Wasserflächen; Wirtschafts- und Verl.-Ges. Gas und Wasser: Bonn, Germany, 1996; Volume 238, pp. 1–135. ISBN 389554034X. [Google Scholar]
  69. Tolson, B.A.; Shoemaker, C.A. Efficient prediction uncertainty approximation in the calibration of environmental simulation models. Water Resour. Res. 2008, 44. [Google Scholar] [CrossRef]
  70. Gupta, H.V.; Sorooshian, S.; Yapo, P.O. Status of Automatic Calibration for Hydrologic Models: Comparison with Multilevel Expert Calibration. J. Hydrol. Eng. 1999, 4, 135–143. [Google Scholar] [CrossRef]
  71. Seong, C.; Her, Y.; Benham, B. Automatic Calibration Tool for Hydrologic Simulation Program-FORTRAN Using a Shuffled Complex Evolution Algorithm. Water 2015, 7, 503–527. [Google Scholar] [CrossRef] [Green Version]
  72. Mizukami, N.; Rakovec, O.; Newman, A.J.; Clark, M.P.; Wood, A.W.; Gupta, H.V.; Kumar, R. On the choice of calibration metrics for “high-flow” estimation using hydrologic models. Hydrol. Earth Syst. Sci. 2019, 23, 2601–2614. [Google Scholar] [CrossRef] [Green Version]
  73. Knoben, W.J.M.; Freer, J.E.; Woods, R.A. Technical note: Inherent benchmark or not? Comparing Nash–Sutcliffe and Kling–Gupta efficiency scores. Hydrol. Earth Syst. Sci. 2019, 23, 4323–4331. [Google Scholar] [CrossRef] [Green Version]
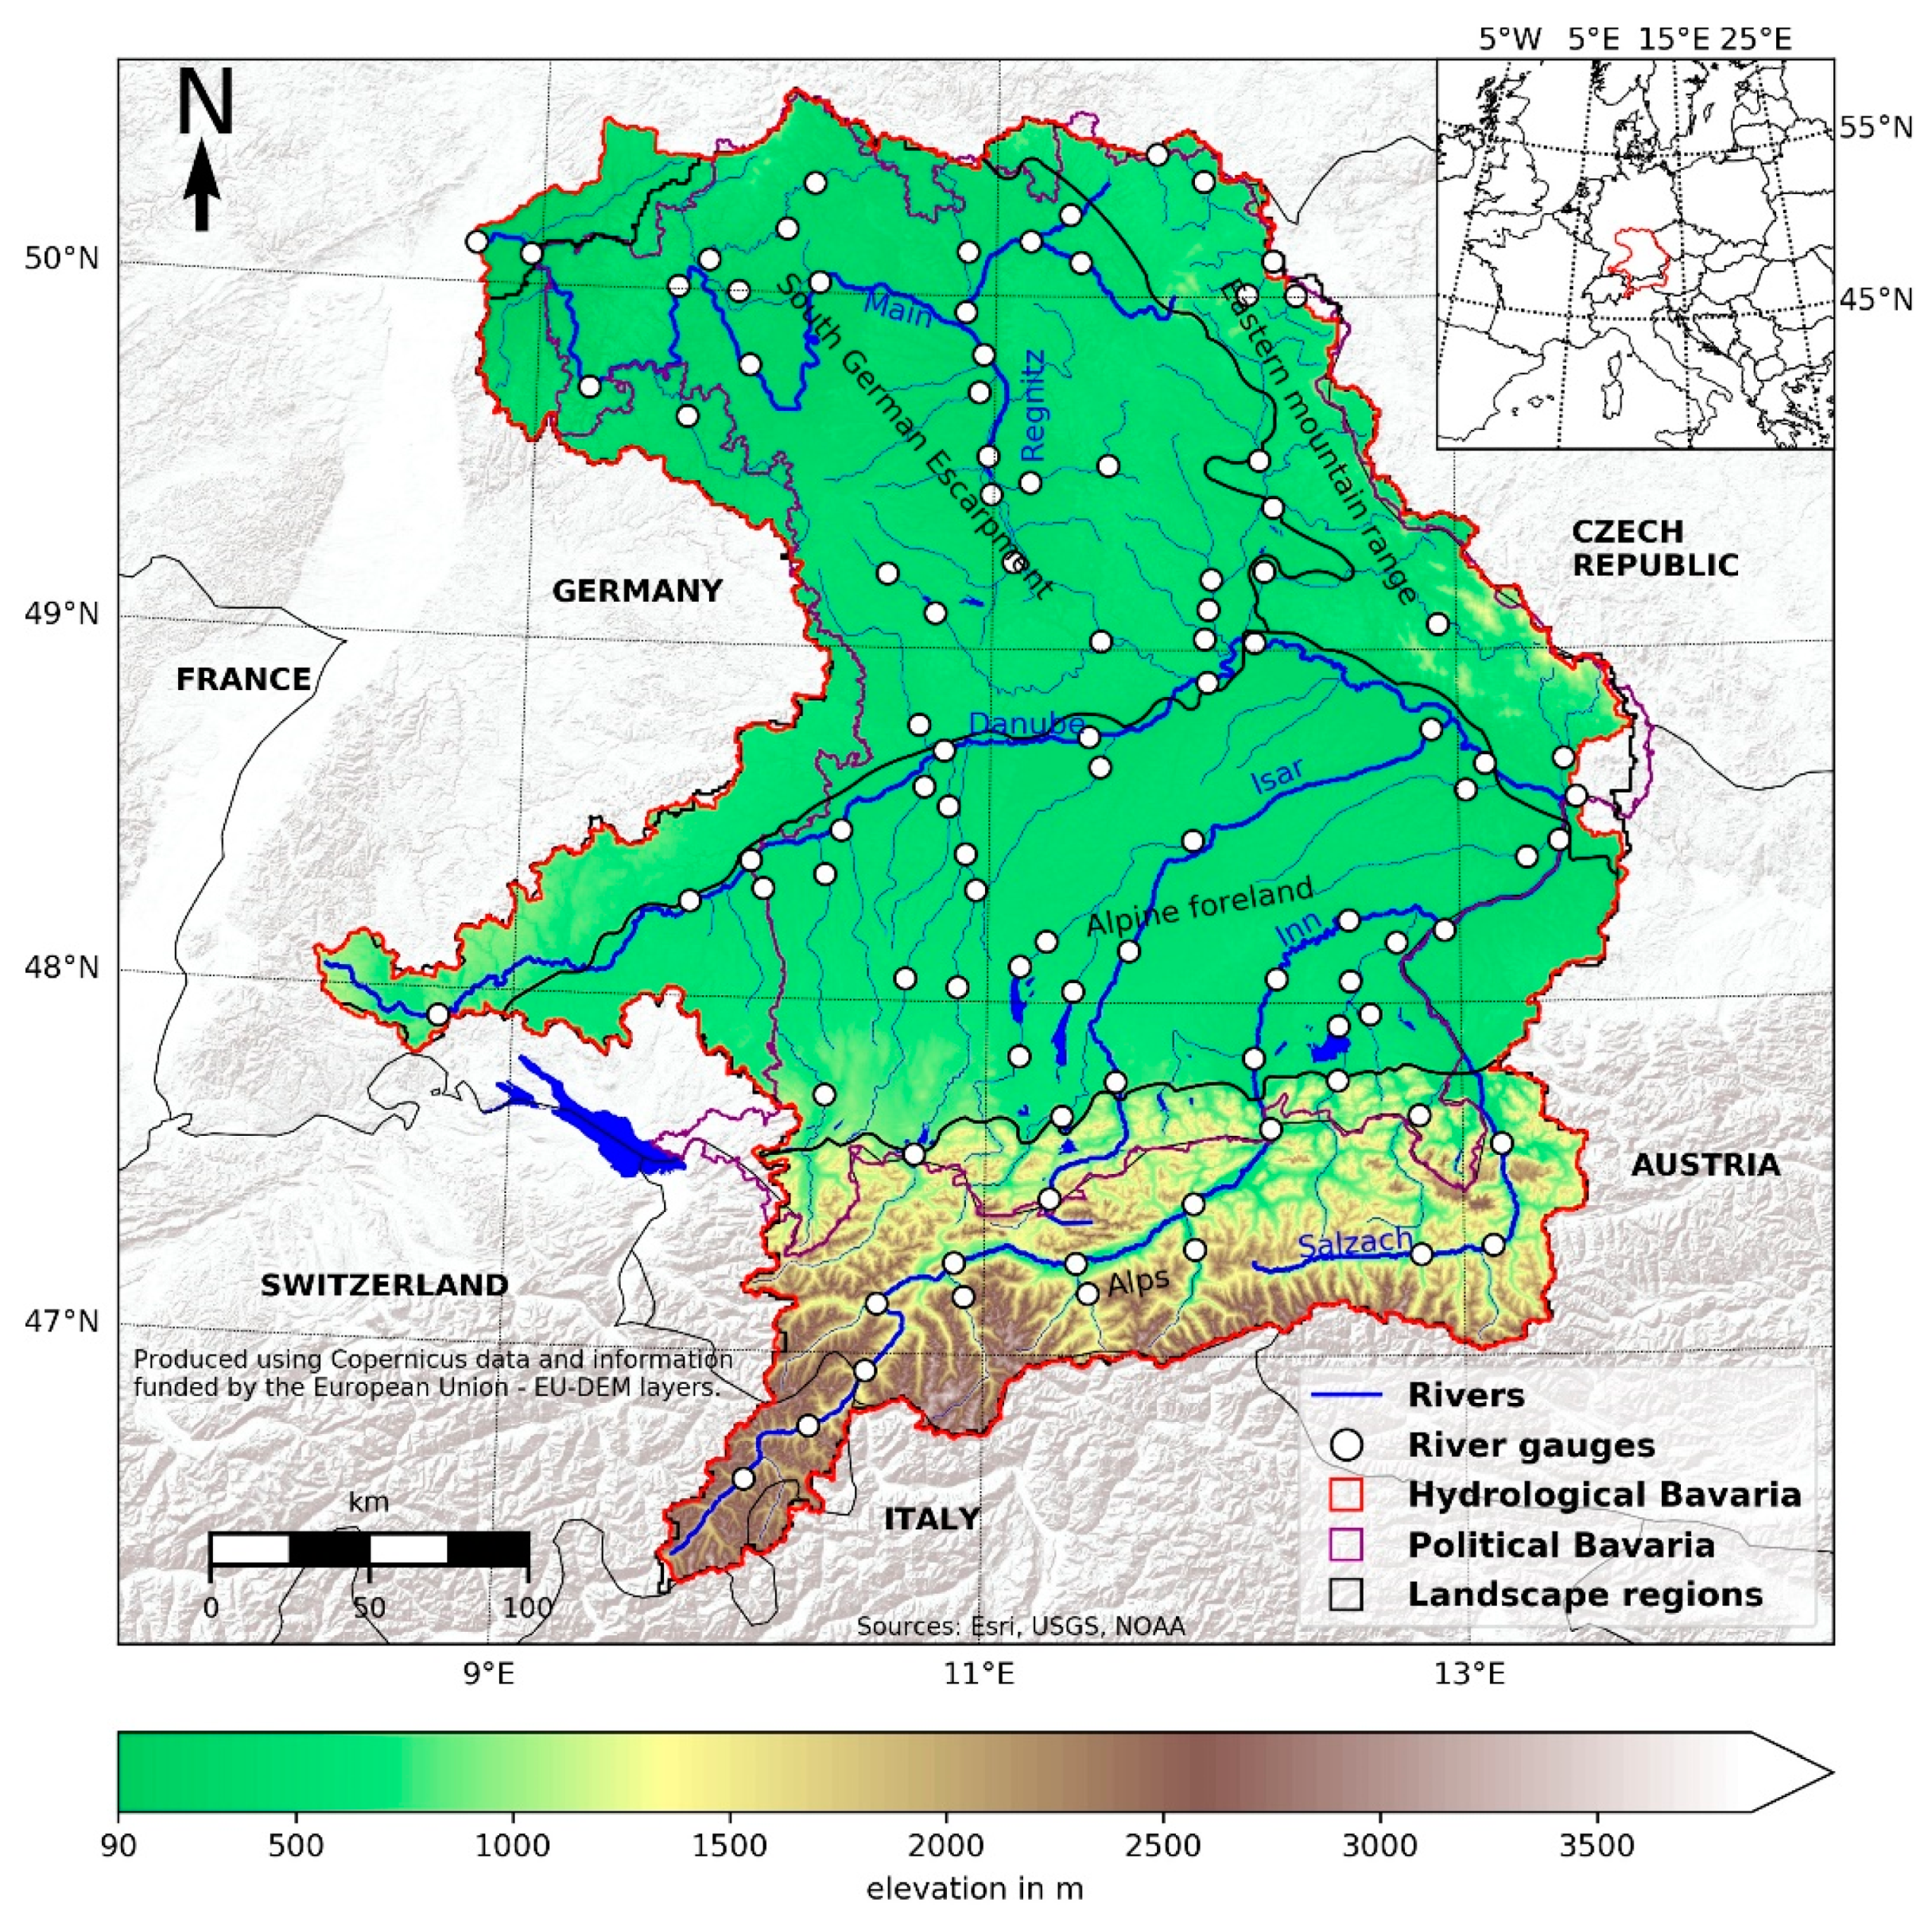
Figure 1. Map of the Hydrological Bavaria (red line) comprising different landscape regions (black lines) and the political Bavaria (purple line). The map further indicates the 98 gauges used in this study (white dots) at their respective rivers (blue lines).
Water 12 02349 g001
Figure 2. Mean annual precipitation [mm] (a) and air temperature [°C] (b) of the Hydrological Bavaria for the reference period 1981–2010 derived from the meteorological reference dataset (see Section 2.2.2).
Water 12 02349 g002
Figure 3. Selection of a calibration period based on meteorological data. (a) Number of stations available for spatial interpolation and temporal disaggregation for air temperature and precipitation. Black dots represent stations with hourly records, gray dots represent daily measurements. (b) Spatially averaged annual precipitation and temperature anomalies w.r.t 1981–2010 for the Hydrological Bavaria. Orange dots represent years selected for calibration.
Water 12 02349 g003
Figure 4. Scheme of the applied approach to estimate return levels for the 98 gauges.
Water 12 02349 g004
Figure 5. WaSiM model performance (NSE and KGE) for the three different periods (calibration, validation, reference period) for gauges of the Hydrological Bavaria and further subdivided by the four different landscapes (Alps, Alpine foreland, escarpment, mountain ranges). The number of gauges in each subregion is marked in brackets. The dashed lines indicate margins of a sufficient (light blue) and very good (dark blue) model fit. The values at the top of each frame indicate the number of gauges where the model performance of NSE or KGE is below zero.
Water 12 02349 g005
Figure 6. Maps of the WaSiM model performance for the 98 gauges ((a) NSE, (b) KGE) for the reference period (1981–2010). Blueish colors indicate values above zero with better performance indicated by darker colors. Red dots represent gauges with values below zero and white dots gauges with no observations available for the reference period.
Water 12 02349 g006
Figure 7. Relative deviations between observed and simulated mean high flows (MHF) for the 98 gauges of the Hydrological Bavaria.
Water 12 02349 g007
Figure 8. The level of trust (LOT) for high flows with a 5-year return period (HF5). Gray dots indicate gauges with no data or short timeseries. Qualitative categories: very high (LOT ≤ 10%), high (10% < LOT ≤ 20%), moderate (20% < LOT ≤ 30%), low (30% < LOT < 50%), and very low (LOT ≥ 50%).
Water 12 02349 g008
Figure 9. The level of trust (LOT) for high flows with a 10-year return period (HF10). Gray dots indicate gauges with no data or short timeseries. Qualitative categories: very high (LOT ≤ 10%), high (10% < LOT ≤ 20%), moderate (20% < LOT ≤ 30%), low (30% < LOT < 50%), and very low (LOT ≥ 50%).
Water 12 02349 g009
Figure 10. The level of trust (LOT) for high flows with a 20-year return period (HF20). Gray dots indicate gauges with no data or short timeseries. Qualitative categories: very high (LOT ≤ 10%), high (10% < LOT ≤ 20%), moderate (20% < LOT ≤ 30%), low (30% < LOT < 50%), and very low (LOT ≥ 50%).
Water 12 02349 g010
Table 1. Input and validation data for the hydrological model.
TypeNameResolutionSource
Land useCorine Land Cover 2006 v17 (CLC)100 m × 100 m[24]
SoilEuropean Soil Database v2.0 (ESDB)1:1,000,000[25,26]
Digital elevation model (DEM)Digital Elevation Model over Europe (EU-DEM)1′ (≅25 m)[23]
HydrogeologyHydrogeologische Übersichtskarte 200 (HÜK200) v2.5/International Hydrogeological Map of Europe 1:1,500,000 (IHME1500 v1.1)1:200,000/1:1,500,000HÜK200 © BGR & SGD 2011, [28]/IHME1500 v1.1 © BGR, Hannover, 2014, [29]
Meteorological dataSub Daily Climate Reference (SDCLIREF)500 m × 500 m
DischargeGauging stations Bavarian Environment Agency (LfU)
Table 2. Applied processes and their associated approaches within the WaSiM setup.
WaSiM ModuleApproachSource (If Available)
EvapotranspirationPenman-Monteith[35]
SnowmeltEnhanced energy balance with snow redistribution by wind and gravitation[36]
Soil water movementRichards equation[37]
Groundwater movementDarcy equation
Soil parameterizationVan Genuchten parameter[27]