MIDAS: A New Integrated Flood Early Warning System for the Miño River
Abstract
1. Introduction
2. Study Area and Methodology
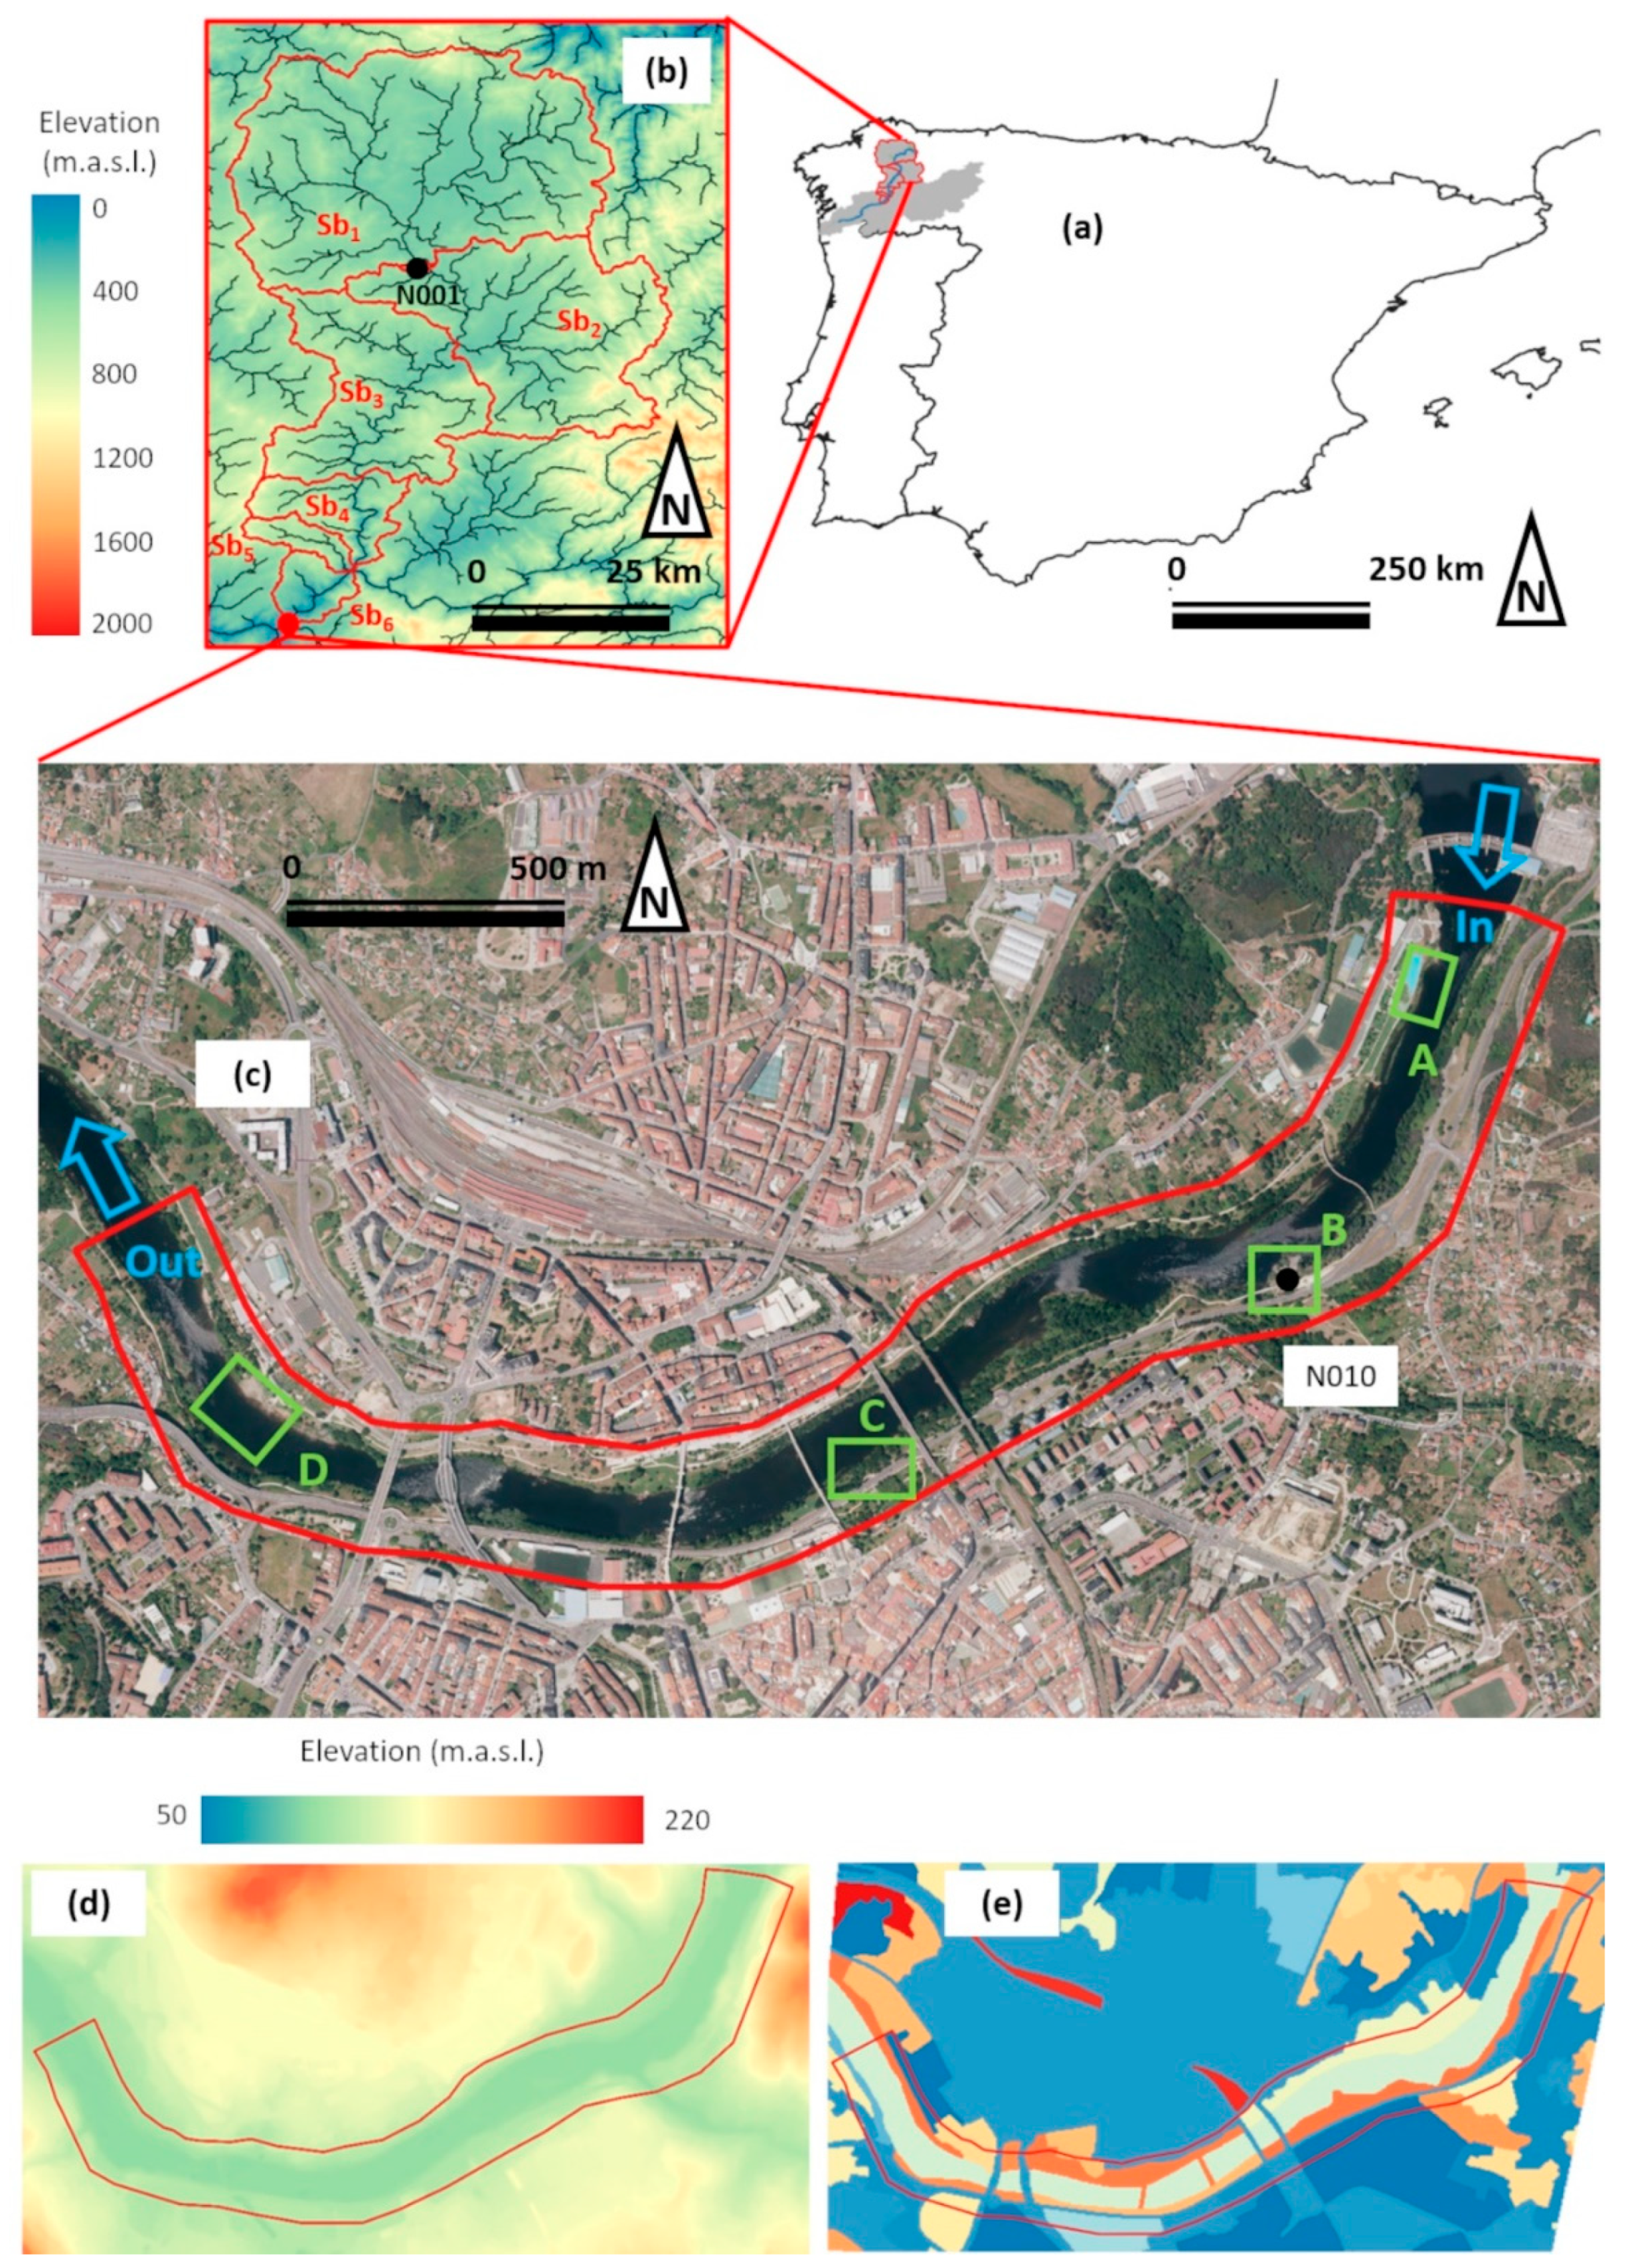
2.1. Study Area
2.2. Description of the Early Warning System
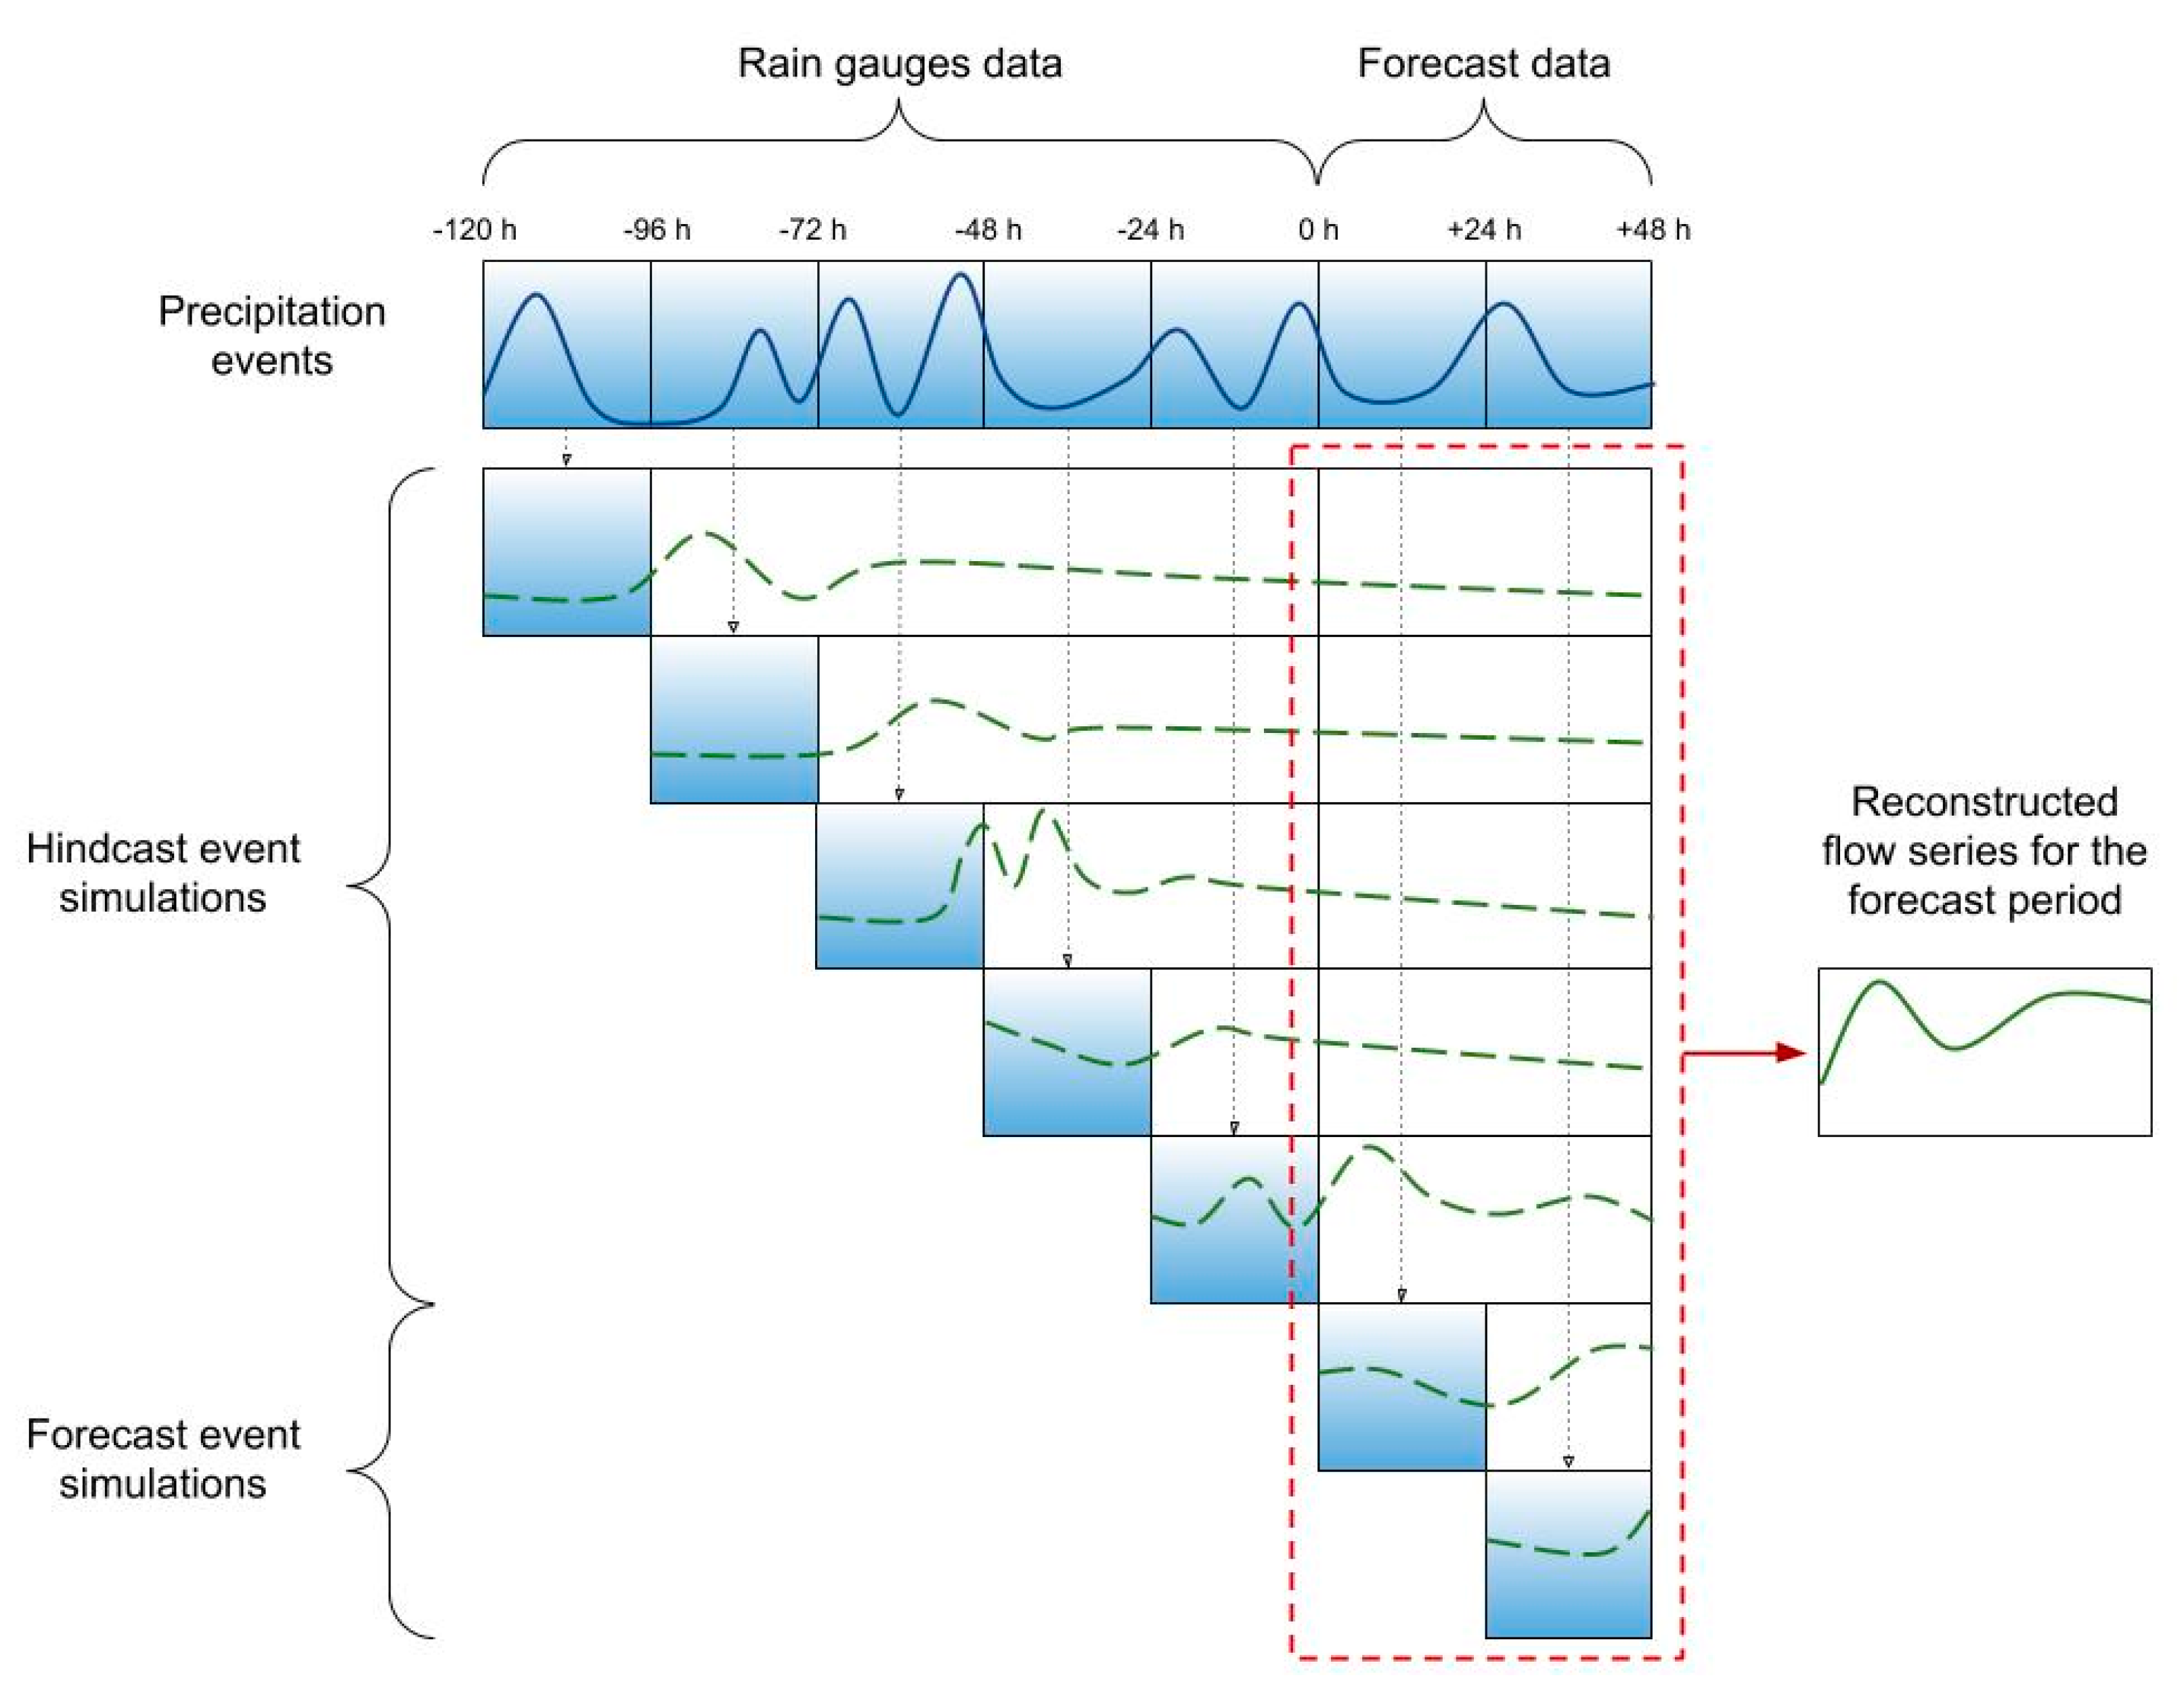
2.2.1. Hydrological Model: HEC-HMS
2.2.2. Hydraulic Model: Iber+
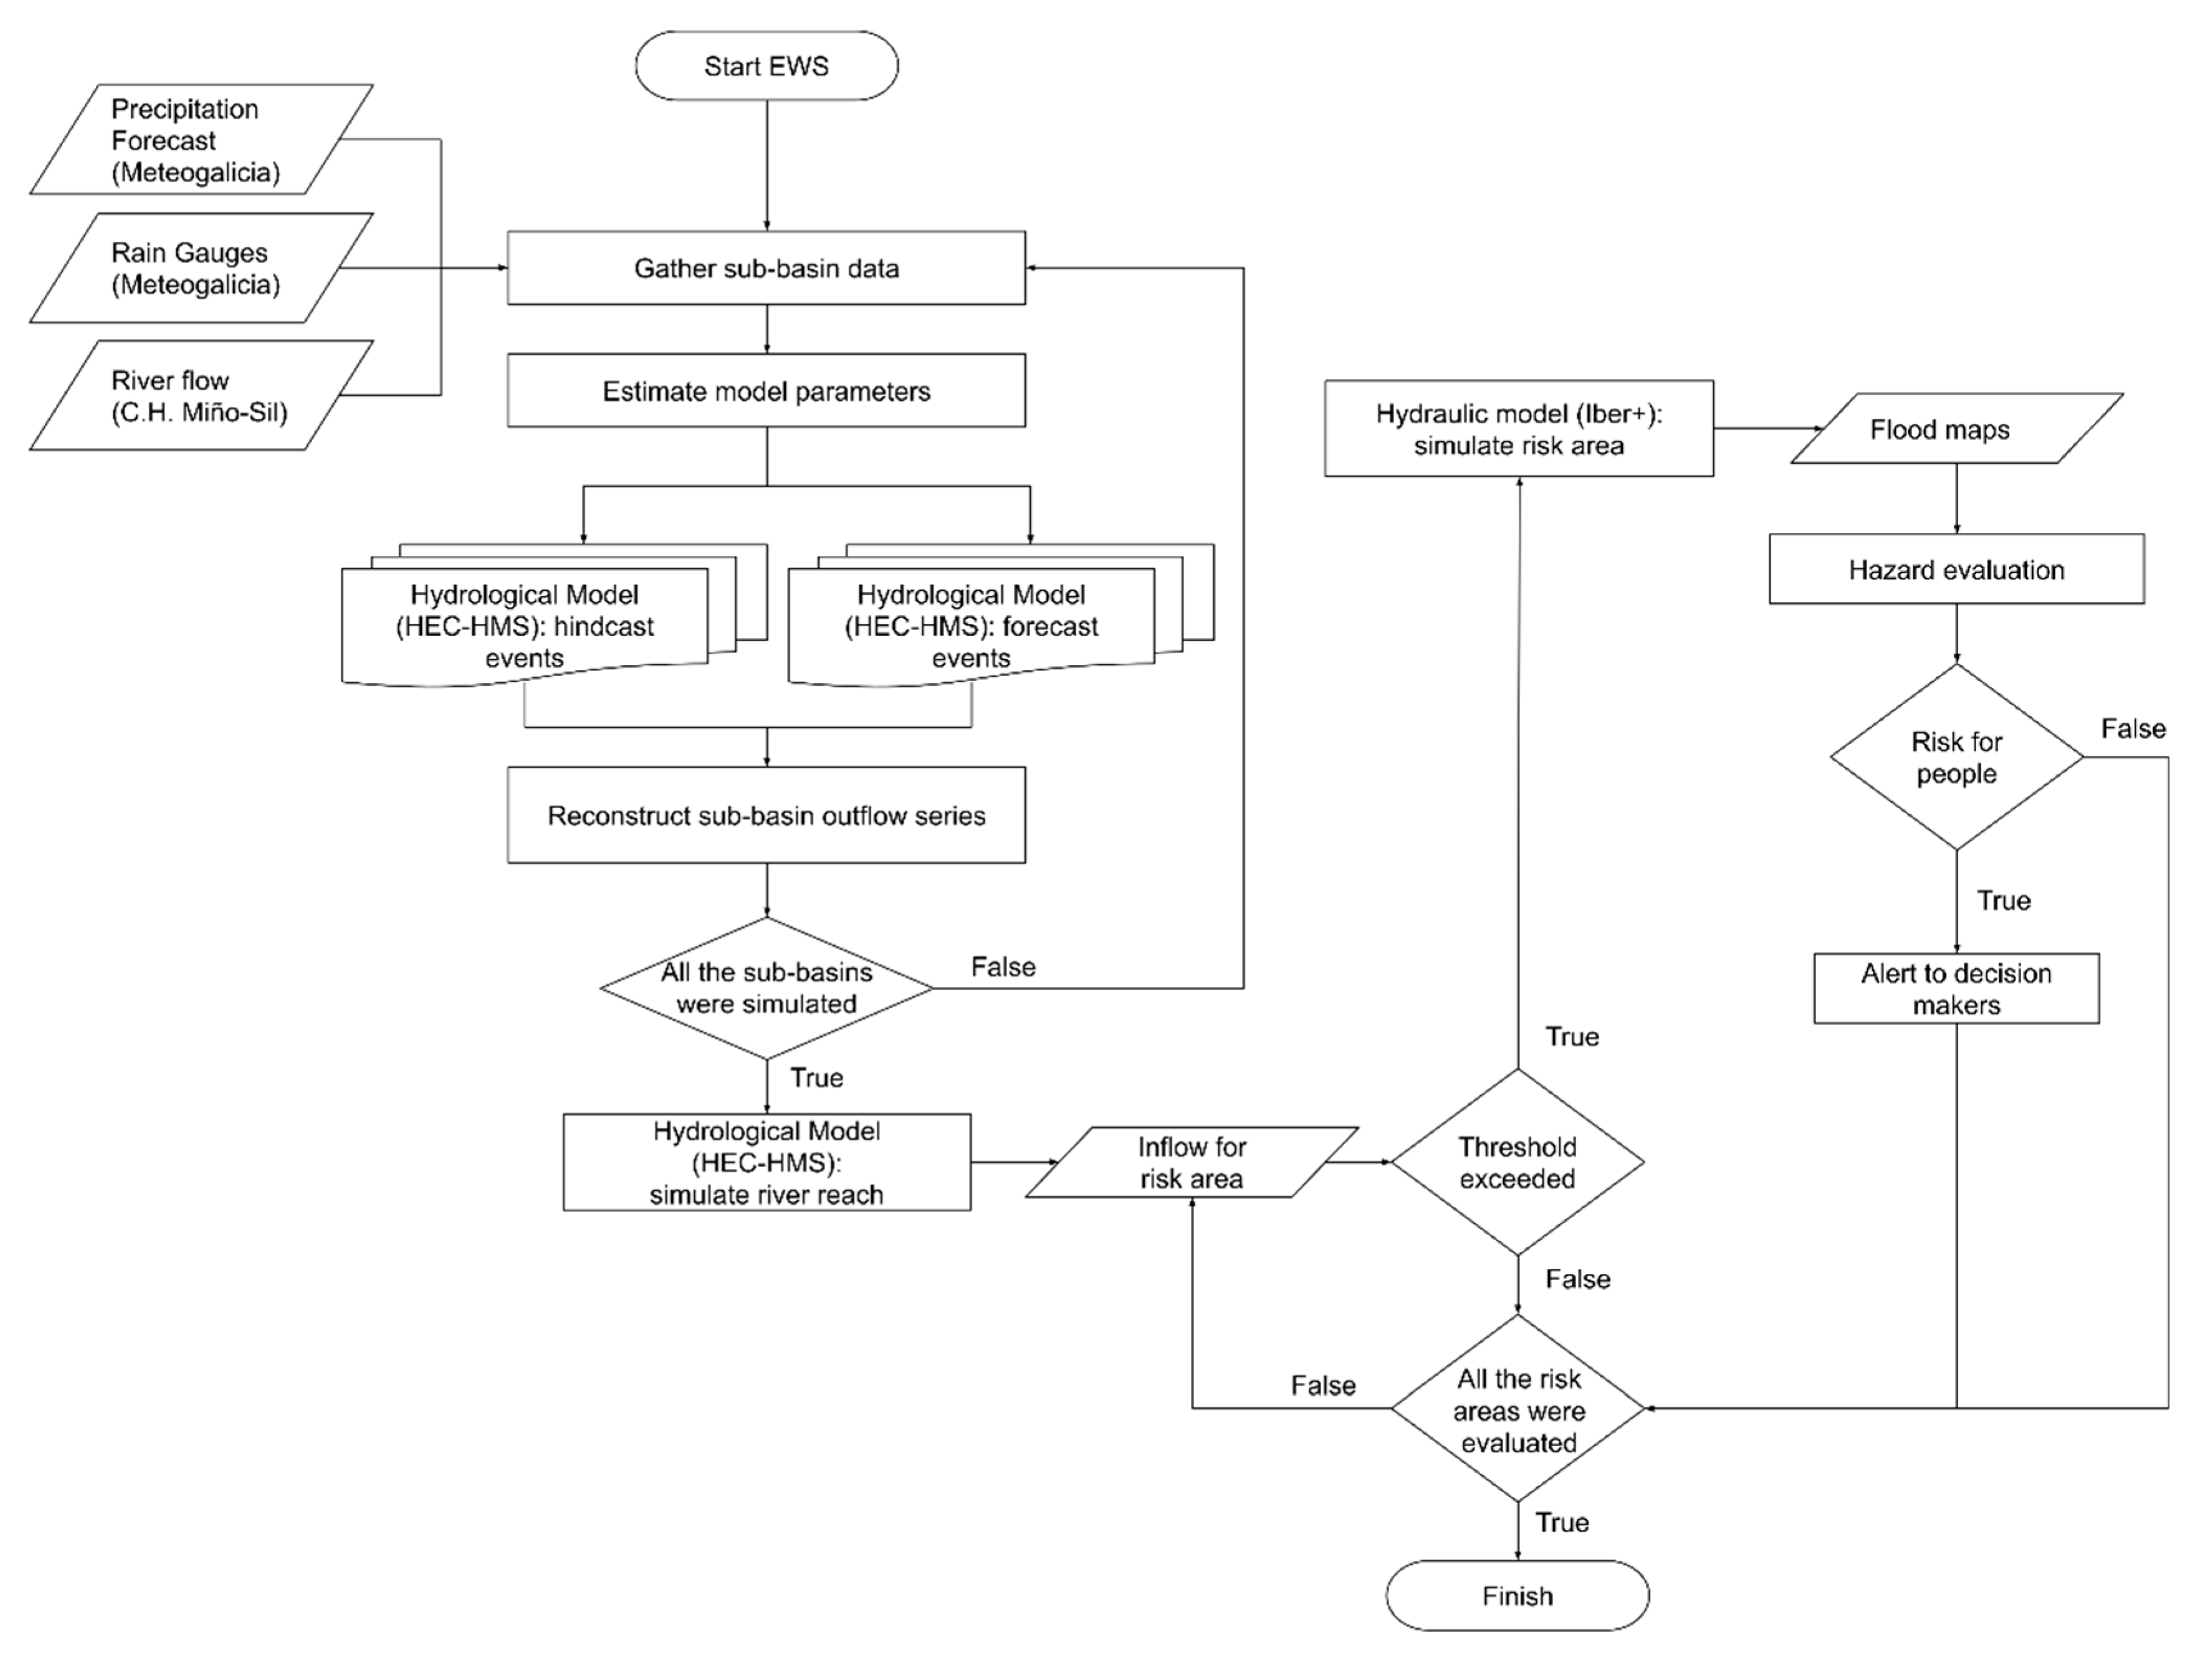
2.2.3. Automatic Early Warning System
2.3. Statistical Parameters to Analyze the Performance of the EWS
3. Results and Discussion
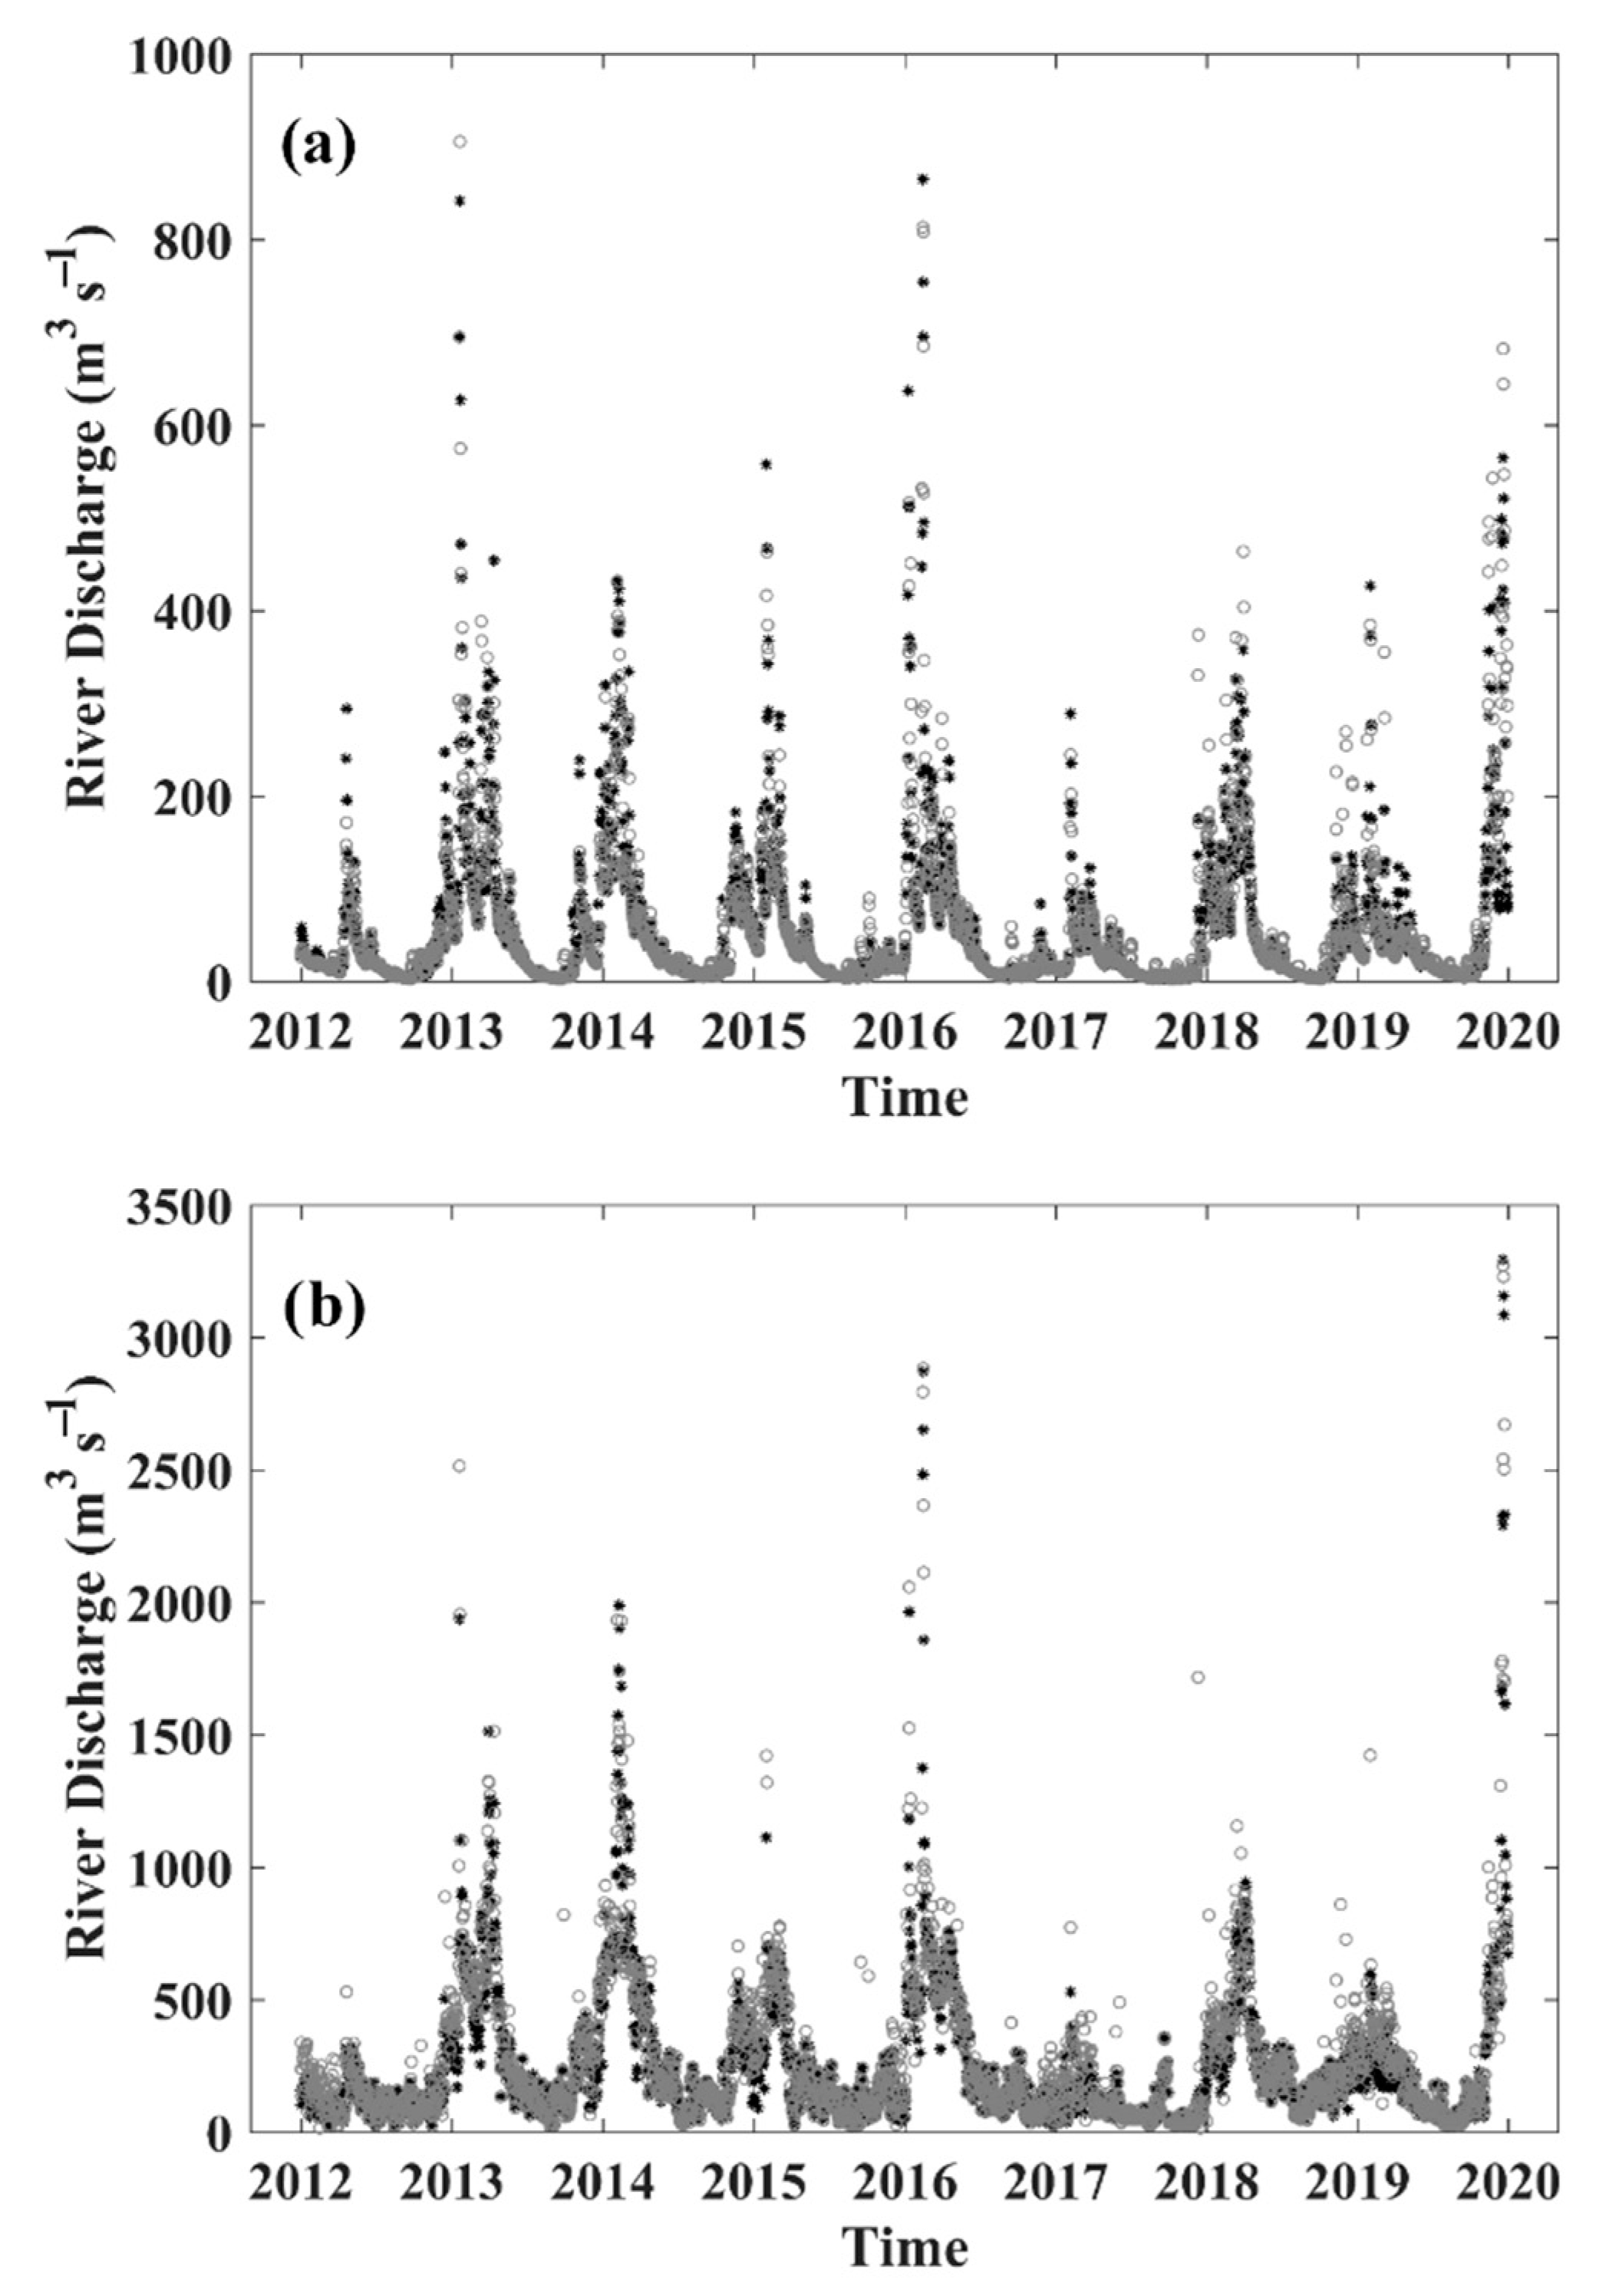
3.1. Hydrologic Module Validation
3.2. Hydraulic Module Validation
3.3. Analysis and Predictability of River Flood Risk Situations
4. Conclusions
Author Contributions
Funding
Acknowledgments
Conflicts of Interest
References
- Berghuijs, W.R.; Aalbers, E.E.; Larsen, J.R.; Trancoso, R.; Woods, R.A. Recent changes in extreme floods across multiple continents. Environ. Res. Lett. 2017, 12, 114035. [Google Scholar] [CrossRef]
- Passerotti, G.; Massazza, G.; Pezzoli, A.; Bigi, V.; Zsótér, E.; Rosso, M. Hydrological Model Application in the Sirba River: Early Warning System and GloFAS Improvements. Water 2020, 12, 620. [Google Scholar] [CrossRef]
- Rosburg, T.T.; Nelson, P.A.; Bledsoe, B.P. Effects of Urbanization on Flow Duration and Stream Flashiness: A Case Study of Puget Sound Streams, Western Washington, USA. JAWRA J. Am. Water Resour. Assoc. 2017, 53, 493–507. [Google Scholar] [CrossRef]
- Booth, D.B.; Bledsoe, B.P. Streams and urbanization. In The Water Environment of Cities; Baker, L.A., Ed.; Springer: Boston, MA, USA, 2009; pp. 93–123. ISBN 978-0-387-84891-4. [Google Scholar]
- Arnell, N.W.; Gosling, S.N. The impacts of climate change on river flood risk at the global scale. Clim. Chang. 2016, 134, 387–401. [Google Scholar] [CrossRef]
- Liu, C.; Guo, L.; Ye, L.; Zhang, S.; Zhao, Y.; Song, T. A review of advances in China’s flash flood early-warning system. Nat. Hazards 2018, 92, 619–634. [Google Scholar] [CrossRef]
- Alfieri, L.; Salamon, P.; Pappenberger, F.; Wetterhall, F.; Thielen, J. Operational early warning systems for water-related hazards in Europe. Environ. Sci. Policy 2012, 21, 35–49. [Google Scholar] [CrossRef]
- Fraga, I.; Cea, L.; Puertas, J. MERLIN: A flood hazard forecasting system for coastal river reaches. Nat. Hazards 2020, 100, 1171–1193. [Google Scholar] [CrossRef]
- Groisman, P.Y.; Knight, R.W.; Easterling, D.R.; Karl, T.R.; Hegerl, G.C.; Razuvaev, V.N. Trends in Intense Precipitation in the Climate Record. J. Clim. 2005, 18, 1326–1350. [Google Scholar] [CrossRef]
- Beniston, M. Trends in joint quantiles of temperature and precipitation in Europe since 1901 and projected for 2100. Geophys. Res. Lett. 2009, 36. [Google Scholar] [CrossRef]
- Morss, R.E.; Wilhelmi, O.V.; Meehl, G.A.; Dilling, L. Improving Societal Outcomes of Extreme Weather in a Changing Climate: An Integrated Perspective. Annu. Rev. Environ. Resour. 2011, 36, 1–25. [Google Scholar] [CrossRef]
- Wallemacq, P.; House, R.; Below, R.; McLean, D. Economic Losses, Poverty & Disasters: 1998–2017; Centre for Research on the Epidemiology of Disasters (CRED); United Nations Office for Disaster Risk Reduction (UNISDR): Brussels, Belgium, 2018. [Google Scholar]
- Han, L.; Xu, Y.; Pan, G.; Deng, X.; Hu, C.; Xu, H.; Shi, H. Changing properties of precipitation extremes in the urban areas, Yangtze River Delta, China, during 1957–2013. Nat. Hazards 2015, 79, 437–454. [Google Scholar] [CrossRef]
- Hallegatte, S. A Cost Effective Solution to Reduce Disaster Losses in Developing Countries: Hydro-Meteorological Services, Early Warning, and Evacuation; The World Bank: Washington, DC, USA, 2012. [Google Scholar]
- Cools, J.; Innocenti, D.; O’Brien, S. Lessons from flood early warning systems. Environ. Sci. Policy 2016, 58, 117–122. [Google Scholar] [CrossRef]
- Borga, M.; Anagnostou, E.N.; Blöschl, G.; Creutin, J.-D. Flash flood forecasting, warning and risk management: The HYDRATE project. Environ. Sci. Policy 2011, 14, 834–844. [Google Scholar] [CrossRef]
- Thielen, J.; Bartholmes, J.; Ramos, M.-H.; de Roo, A. The European Flood Alert System—Part 1: Concept and development. Hydrol. Earth Syst. Sci. 2009, 13, 125–140. [Google Scholar] [CrossRef]
- Pappenberger, F.; Thielen, J.; Medico, M.D. The impact of weather forecast improvements on large scale hydrology: Analysing a decade of forecasts of the European Flood Alert System. Hydrol. Process. 2011, 25, 1091–1113. [Google Scholar] [CrossRef]
- Alfieri, L.; Pappenberger, F.; Wetterhall, F.; Haiden, T.; Richardson, D.; Salamon, P. Evaluation of ensemble streamflow predictions in Europe. J. Hydrol. 2014, 517, 913–922. [Google Scholar] [CrossRef]
- Bartholmes, J.C.; Thielen, J.; Ramos, M.H.; Gentilini, S. The european flood alert system EFAS—Part 2: Statistical skill assessment of probabilistic and deterministic operational forecasts. Hydrol. Earth Syst. Sci. 2009, 13, 141–153. [Google Scholar] [CrossRef]
- Alfieri, L.; Burek, P.; Dutra, E.; Krzeminski, B.; Muraro, D.; Thielen, J.; Pappenberger, F. GloFAS—global ensemble streamflow forecasting and flood early warning. Hydrol. Earth Syst. Sci. 2013, 17, 1161–1175. [Google Scholar] [CrossRef]
- Corral, C.; Berenguer, M.; Sempere-Torres, D.; Poletti, L.; Silvestro, F.; Rebora, N. Comparison of two early warning systems for regional flash flood hazard forecasting. J. Hydrol. 2019, 572, 603–619. [Google Scholar] [CrossRef]
- Hirpa, F.A.; Hopson, T.M.; De Groeve, T.; Brakenridge, G.R.; Gebremichael, M.; Restrepo, P.J. Upstream satellite remote sensing for river discharge forecasting: Application to major rivers in South Asia. Remote Sens. Environ. 2013, 131, 140–151. [Google Scholar] [CrossRef]
- Cloke, H.L.; Pappenberger, F. Ensemble flood forecasting: A review. J. Hydrol. 2009, 375, 613–626. [Google Scholar] [CrossRef]
- De Luca, D.L.; Biondi, D.; Capparelli, G.; Galasso, L.; Versace, P. Mathematical models for early warning systems. IAHS-AISH Publ. 2010, 340, 485–495. [Google Scholar]
- Baudoin, M.-A.; Henly-Shepard, S.; Fernando, N.; Sitati, A.; Zommers, Z. Early Warning Systems and Livelihood Resilience: Exploring Opportunities for Community Participation; UNU-EHS Working Paper Series; United Nations University: Tokyo, Japan, 2014. [Google Scholar]
- Ritter, J.; Berenguer, M.; Corral, C.; Park, S.; Sempere-Torres, D. ReAFFIRM: Real-time Assessment of Flash Flood Impacts–a Regional high-resolution Method. Environ. Int. 2020, 136, 105375. [Google Scholar] [CrossRef] [PubMed]
- Collier, C.G. Flash flood forecasting: What are the limits of predictability? Q. J. R. Meteorol. Soc. 2007, 133, 3–23. [Google Scholar] [CrossRef]
- de Gonzalo, C.; Robredo, J.C.; Mintegui, J.Á. Semidistributed hydrologic model for flood risk assessment in the Pejibaye River Basin, Costa Rica. J. Hydrol. Eng. 2012, 17, 1333–1344. [Google Scholar] [CrossRef]
- De Silva, M.; Weerakoon, S.B.; Herath, S. Modeling of event and continuous flow hydrographs with HEC–HMS: Case study in the Kelani River Basin, Sri Lanka. J. Hydrol. Eng. 2014, 19, 800–806. [Google Scholar] [CrossRef]
- Cea, L.; Fraga, I. Incorporating antecedent moisture conditions and intraevent variability of rainfall on flood frequency analysis in poorly gauged basins. Water Resour. Res. 2018, 54, 8774–8791. [Google Scholar] [CrossRef]
- Wang, D. A new probability density function for spatial distribution of soil water storage capacity leads to the SCS curve number method. Hydrol. Earth Syst. Sci. 2018, 22, 6567–6578. [Google Scholar] [CrossRef]
- González-Cao, J.; García-Feal, O.; Fernández-Nóvoa, D.; Domínguez-Alonso, J.M.; Gómez-Gesteira, M. Towards an automatic early warning system of flood hazards based on precipitation forecast: The case of the Miño River (NW Spain). Nat. Hazards Earth Syst. Sci. 2019, 19. [Google Scholar] [CrossRef]
- Nguyen, P.; Thorstensen, A.; Sorooshian, S.; Hsu, K.; AghaKouchak, A.; Sanders, B.; Koren, V.; Cui, Z.; Smith, M. A high resolution coupled hydrologic–hydraulic model (HiResFlood-UCI) for flash flood modeling. J. Hydrol. 2016, 541, 401–420. [Google Scholar] [CrossRef]
- García-Feal, O.; González-Cao, J.; Gómez-Gesteira, M.; Cea, L.; Domínguez, J.M.; Formella, A. An accelerated tool for flood modelling based on Iber. Water 2018, 10, 1459. [Google Scholar] [CrossRef]
- Bladé, E.; Cea, L.; Corestein, G.; Escolano, E.; Puertas, J.; Vázquez-Cendón, E.; Dolz, J.; Coll, A. Iber: Herramienta de simulación numérica del flujo en ríos. Revista Internacional de Métodos Numéricos para Cálculo y Diseño en Ingeniería 2014, 30, 1–10. [Google Scholar] [CrossRef]
- Lorenzo, M.N.; Alvarez, I. Climate change patterns in precipitation over Spain using CORDEX projections for 2021–2050. Sci. Total Environ. 2020, 138024. [Google Scholar] [CrossRef] [PubMed]
- Fernández-Nóvoa, D.; deCastro, M.; Des, M.; Costoya, X.; Mendes, R.; Gómez-Gesteira, M. Characterization of Iberian turbid plumes by means of synoptic patterns obtained through MODIS imagery. J. Sea Res. 2017, 126, 12–25. [Google Scholar] [CrossRef]
- deCastro, M.; Lorenzo, N.; Taboada, J.J.; Sarmiento, M.; Alvarez, I.; Gomez-Gesteira, M. Influence of teleconnection patterns on precipitation variability and on river flow regimes in the Miño River basin (NW Iberian Peninsula). Clim. Res. 2006, 32, 63–73. [Google Scholar] [CrossRef][Green Version]
- Feldman, A.D. Hydrologic Modeling System HEC-HMS: Technical Reference Manual; USA Army Corps of Engineers: Washington, DC, USA; Hydrologic Engineering Center: Davis, CA, USA, 2000.
- Scharffenberg, B.; Bartles, M.; Brauer, T.; Fleming, M.; Karlovits, G. Hydrologic Modeling System (HEC-HMS). User’s Manual: Version 4.3; USA Army Corps of Engineers: Washington, DC, USA, 2018.
- USA Department of Agriculture. Soil Conservation Service (SCS) “Hydrology” National Engineering Handbook; Section 4; USA Department of Agriculture: Washington, DC, USA, 1985.
- USA Department of Agriculture. NRCS: Natural Resources Conservation Service National Engineering Handbook; Chapter 16 Hydrographs; USA Department of Agriculture: Washington, DC, USA, 2007.
- Soil Conservation Service (SCS). Technical Release 55: Urban Hydrology for Small Watersheds, 2nd ed.; USA Department of Agriculture: Washington, DC, USA, 1986.
- Stewart, D.; Canfield, E.; Hawkins, R. Curve number determination methods and uncertainty in hydrologic soil groups from semiarid watershed data. J. Hydrol. Eng. 2012, 17, 1180–1187. [Google Scholar] [CrossRef]
- Ministerio para la Transición Ecológica y el Reto Demográfico, Spain Government Modelo SIMPA 2019. Periodo de simulación: 1940/41 a 2017/18. Available online: https://www.miteco.gob.es/es/agua/temas/evaluacion-de-los-recursos-hidricos/evaluacion-recursos-hidricos-regimen-natural/ (accessed on 22 June 2020).
- Nelder, J.A.; Mead, R. A simplex method for function minimization. Comput. J. 1965, 7, 308–313. [Google Scholar] [CrossRef]
- Brocca, L.; Melone, F.; Moramarco, T. Distributed rainfall-runoff modelling for flood frequency estimation and flood forecasting. Hydrol. Process. 2011, 25, 2801–2813. [Google Scholar] [CrossRef]
- Massari, C.; Brocca, L.; Tarpanelli, A.; Moramarco, T. Data assimilation of satellite soil moisture into rainfall-runoff modelling: A complex recipe? Remote Sens. 2015, 7, 11403–11433. [Google Scholar] [CrossRef]
- USA Department of Agriculture. Soil Conservation Service (SCS) “Hydrology” National Engineering Handbook; Section 4; USA Department of Agriculture: Washington, DC, USA, 1972.
- Hope, A.S.; Schulze, R.E. Improved estimates of stormflow volume using the SCS curve number method. In Proceedings of the International Symposium on Rainfall-runoff Modeling, Mississippi State University, Starkville, MS, USA, 18–21 May 1982. [Google Scholar]
- Schulze, R.E. The Use of Soil Moisture Budgeting to Improve Stormflow Estimates by the SCS Curve Number Method; University of Natal, Department of Agricultural Engineering: Pietermaritzburg, South Africa, 1982; p. 63. [Google Scholar]
- Spain Government. Ministerio de Fomento: Norma 5.2-IC Drenaje Superficial de la Instrucción de Carreteras; Spain Government: Madrid, Spain, 2016.
- Cunge, J.A. On the subject of a flood propagation computation method (Musklngum method). J. Hydraul. Res. 1969, 7, 205–230. [Google Scholar] [CrossRef]
- NVIDIA Corporation CUDA C++ Programming Guide. Available online: https://docs.nvidia.com/cuda/pdf/CUDA_C_Programming_Guide.pdf (accessed on 22 June 2020).
- García-Feal, O.; Cea, L.; González-Cao, J.; Domínguez, J.M.; Gómez-Gesteira, M. IberWQ: A GPU Accelerated Tool for 2D Water Quality Modeling in Rivers and Estuaries. Water 2020, 12, 413. [Google Scholar] [CrossRef]
- Gonzalez-Cao, J.; García-Feal, O.; Cea, L.; Gómez-Gesteira, M. Preservation of the cultural heritage from floods using the numerical code Iber. In Proceedings of the First International Electronic Conference on the Hydrological Cycle, Ourense, Spain, 12–16 November 2017; MDPI: Basel, Switzerland, 2017; p. 4843. [Google Scholar]
- SNCZI. Guía Metodológica para el Desarrollo del Sistema Nacional de Cartografía de Zonas Inundables; Ministerio de Agricultura, Alimentación y Medio Ambiente, Centro de Publicaciones: Madrid, Spain, 2011; ISBN 978-84-491-1136-5. [Google Scholar]
- Erpicum, S.; Dewals, B.; Archambeau, P.; Detrembleur, S.; Pirotton, M. Detailed inundation modelling using high resolution DEMs. Eng. Appl. Comput. Fluid Mech. 2010, 4, 196–208. [Google Scholar] [CrossRef]
- Liu, Y.; Zhou, J.; Song, L.; Zou, Q.; Liao, L.; Wang, Y. Numerical modelling of free-surface shallow flows over irregular topography with complex geometry. Appl. Math. Model. 2013, 37, 9482–9498. [Google Scholar] [CrossRef]
- Segura-Beltrán, F.; Sanchis-Ibor, C.; Morales-Hernández, M.; González-Sanchis, M.; Bussi, G.; Ortiz, E. Using post-flood surveys and geomorphologic mapping to evaluate hydrological and hydraulic models: The flash flood of the Girona River (Spain) in 2007. J. Hydrol. 2016, 541, 310–329. [Google Scholar] [CrossRef]
- Courant, R.; Friedrichs, K.; Lewy, H. Über die partiellen Differenzengleichungen der mathematischen Physik. Math. Ann. 1928, 100, 32–74. [Google Scholar] [CrossRef]
- Eckhardt, K. How to construct recursive digital filters for baseflow separation. Hydrol. Process. 2005, 19, 507–515. [Google Scholar] [CrossRef]
- Taylor, K.E. Summarizing multiple aspects of model performance in a single diagram. J. Geophys. Res. Atmos. 2001, 106, 7183–7192. [Google Scholar] [CrossRef]
- Moriasi, D.; Arnold, J.G.; Liew, M.W.V.; Bingner, R.; Harmel, R.D.; Veith, T.L. Model Evaluation Guidelines for Systematic Quantification of Accuracy in Watershed Simulations. Trans. ASABE 2007, 50, 885–900. [Google Scholar] [CrossRef]
- Kalin, L.; Isik, S.; Schoonover, J.E.; Lockaby, B.G. Predicting Water Quality in Unmonitored Watersheds Using Artificial Neural Networks. J. Environ. Qual. 2010, 39, 1429–1440. [Google Scholar] [CrossRef]
- Yilmaz, M.U.; Onoz, B. A Comparative Study of Statistical Methods for Daily Streamflow Estimation at Ungauged Basins in Turkey. Water 2020, 12, 459. [Google Scholar] [CrossRef]
- Vieira, J.M.P.; Pinho, J.L.S.; Vieira, B.F.V.; Vieira, L.M.V. Flood forecast technological platforms: An adaptive response to extreme events. In Proceedings of the WEC2019: World Engineers Convention 2019, Melbourne, Australia, 18–22 November 2019; Engineers Australia: Melbourne, Australia, 2019; p. 1966. [Google Scholar]
- Versini, P.-A.; Berenguer, M.; Corral, C.; Sempere-Torres, D. An operational flood warning system for poorly gauged basins: Demonstration in the Guadalhorce basin (Spain). Nat. Hazards 2014, 71, 1355–1378. [Google Scholar] [CrossRef]
- Cox, R.J.; Shand, T.D.; Blacka, M.J. Australian Rainfall and Runoff Revision Project 10: Appropriate Safety Criteria for Peopl; Water Research Laboratory, The University of New South Wales: New South Wales, Australia, 2010; ISBN 978-0-85825-945-4. [Google Scholar]

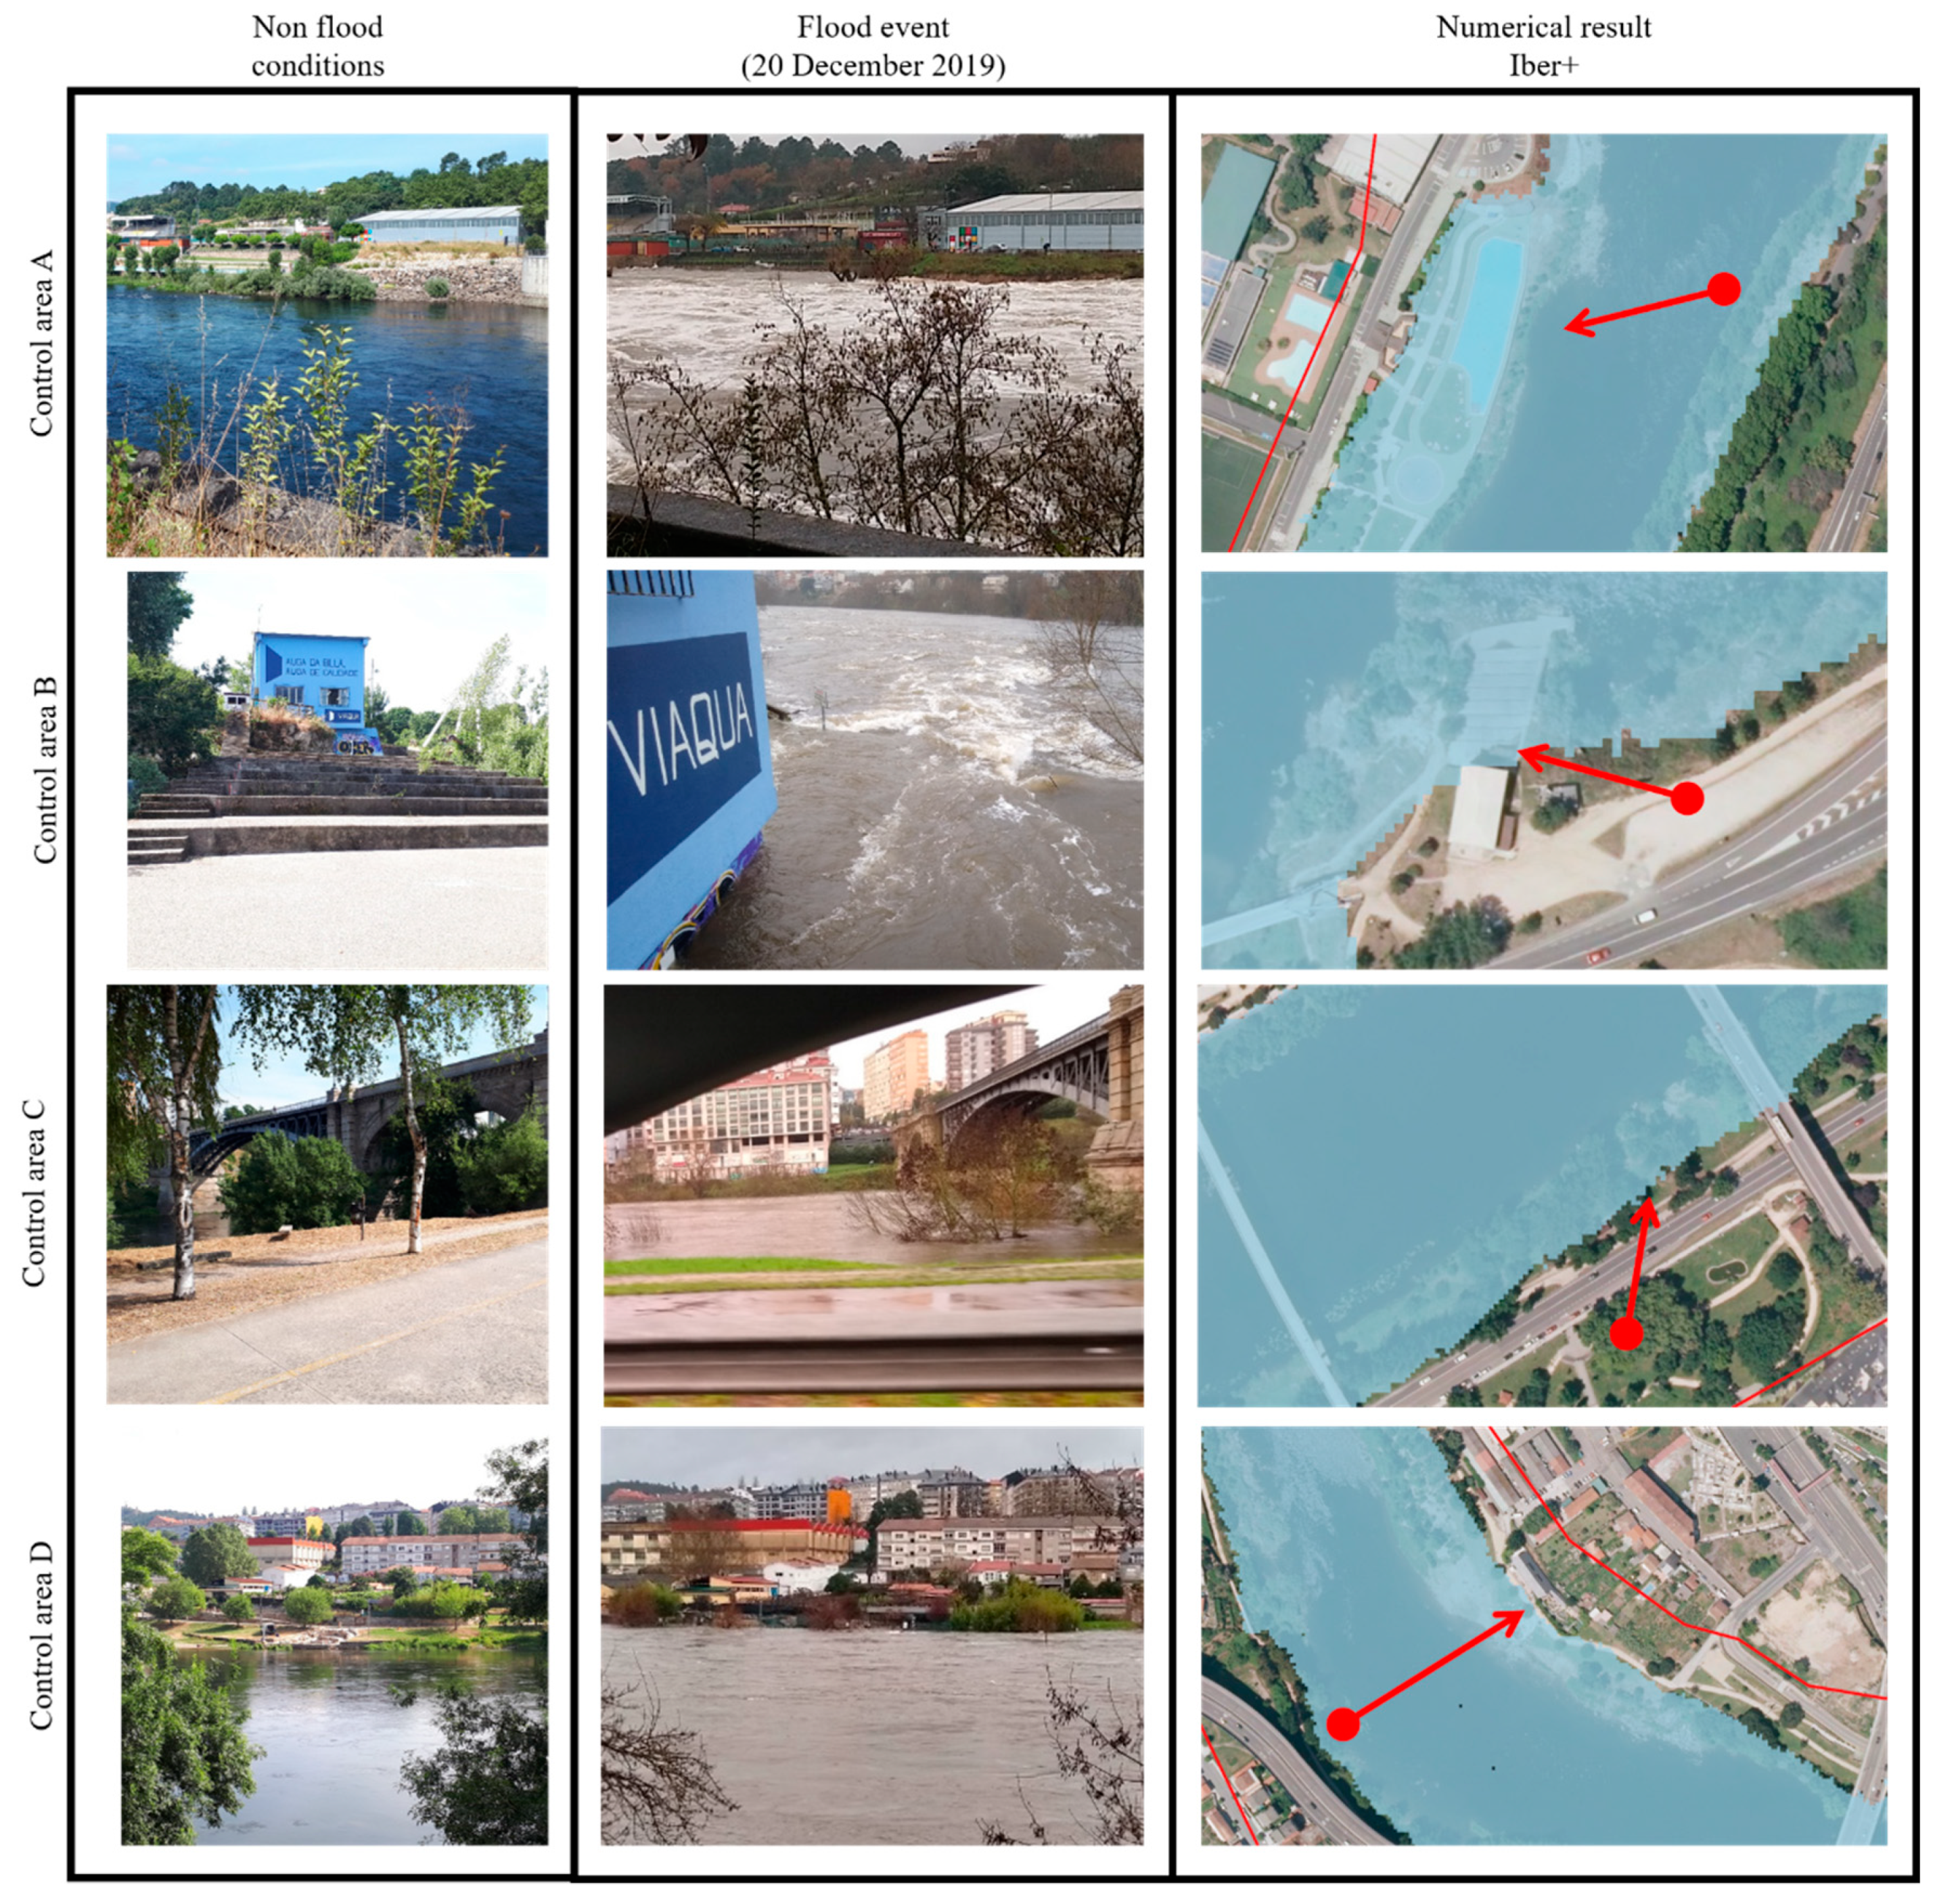
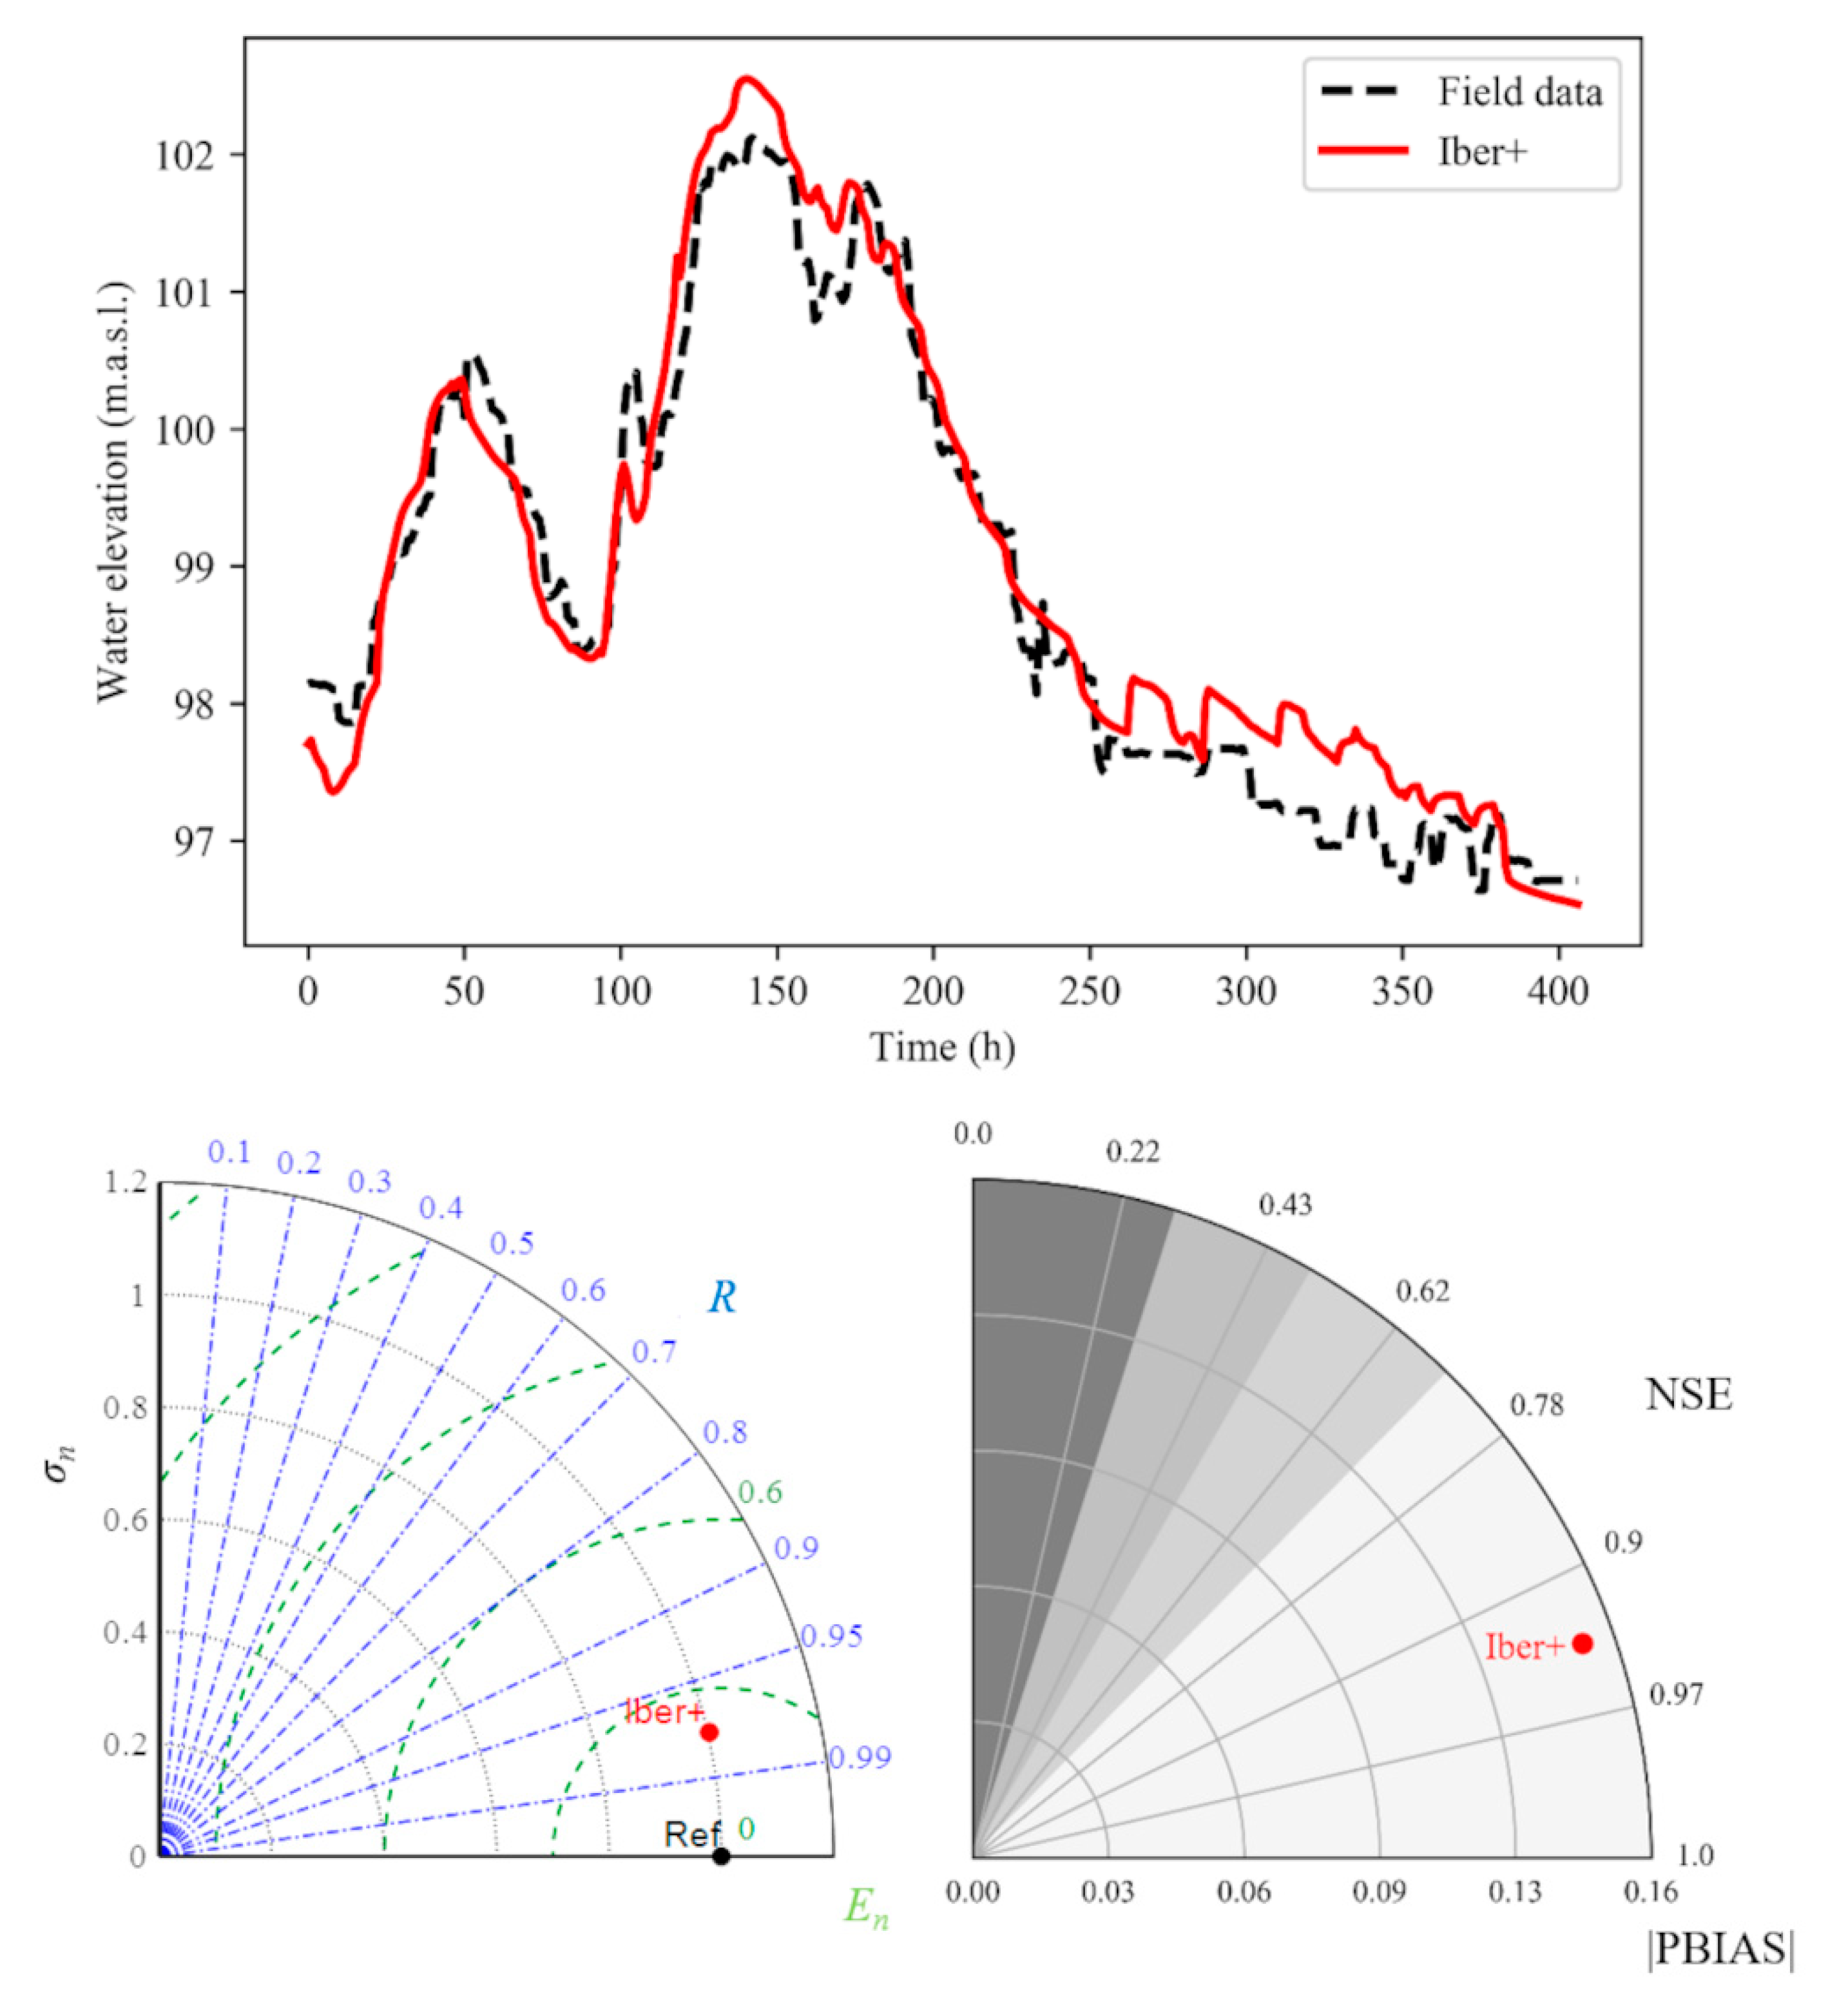
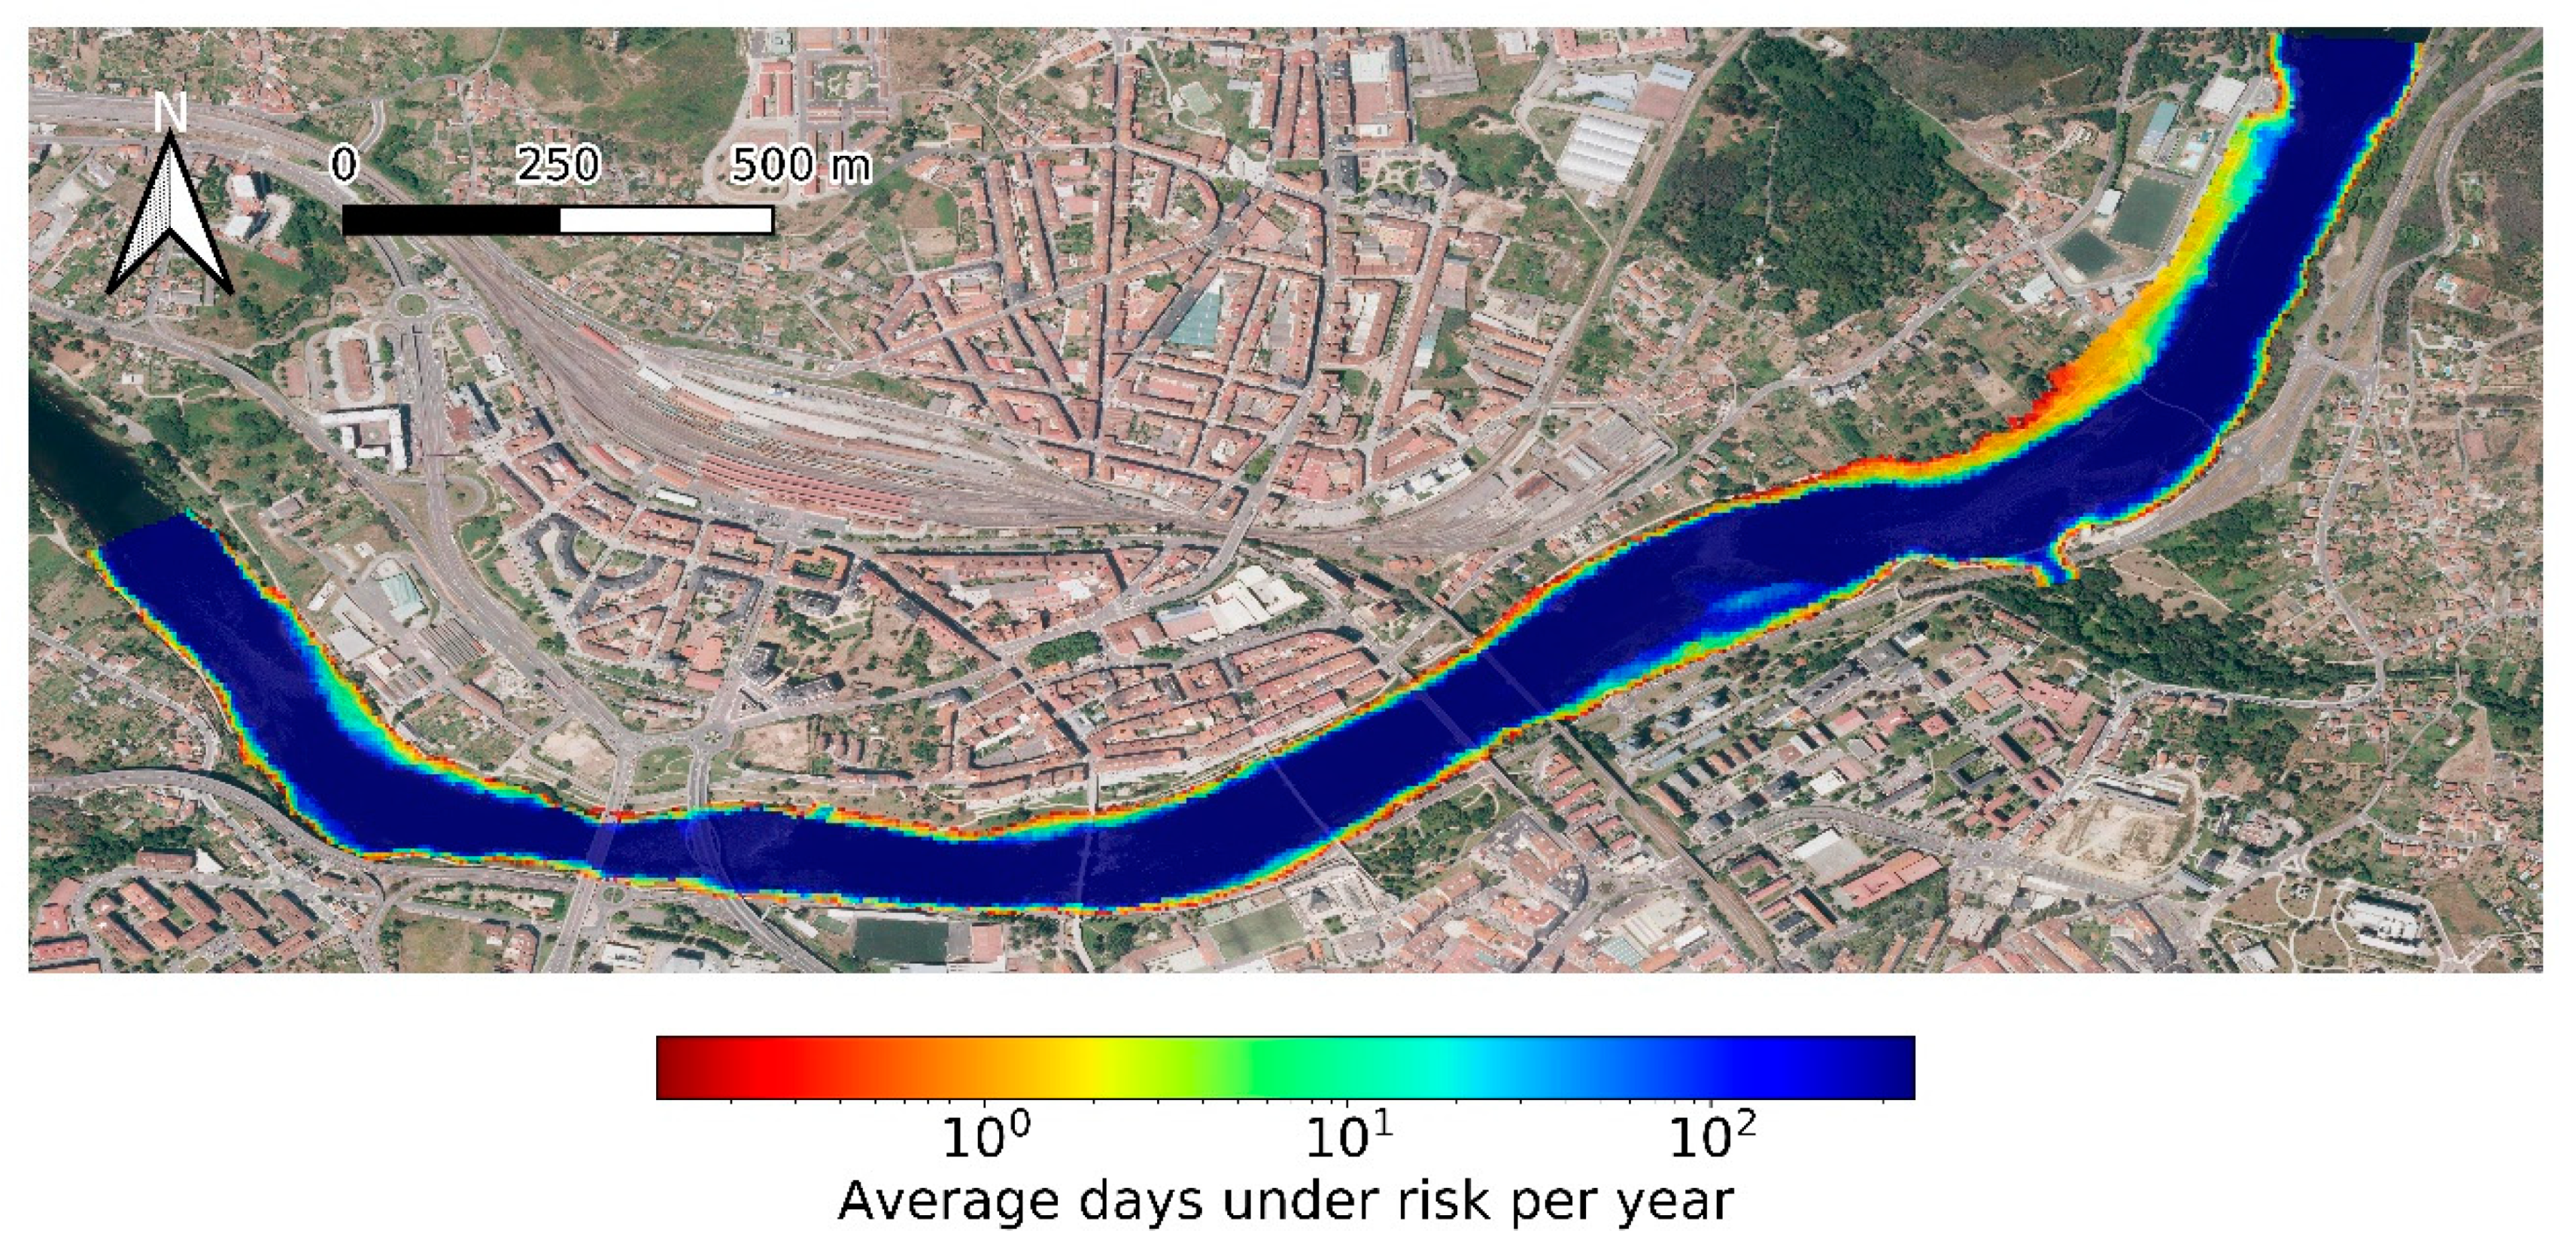
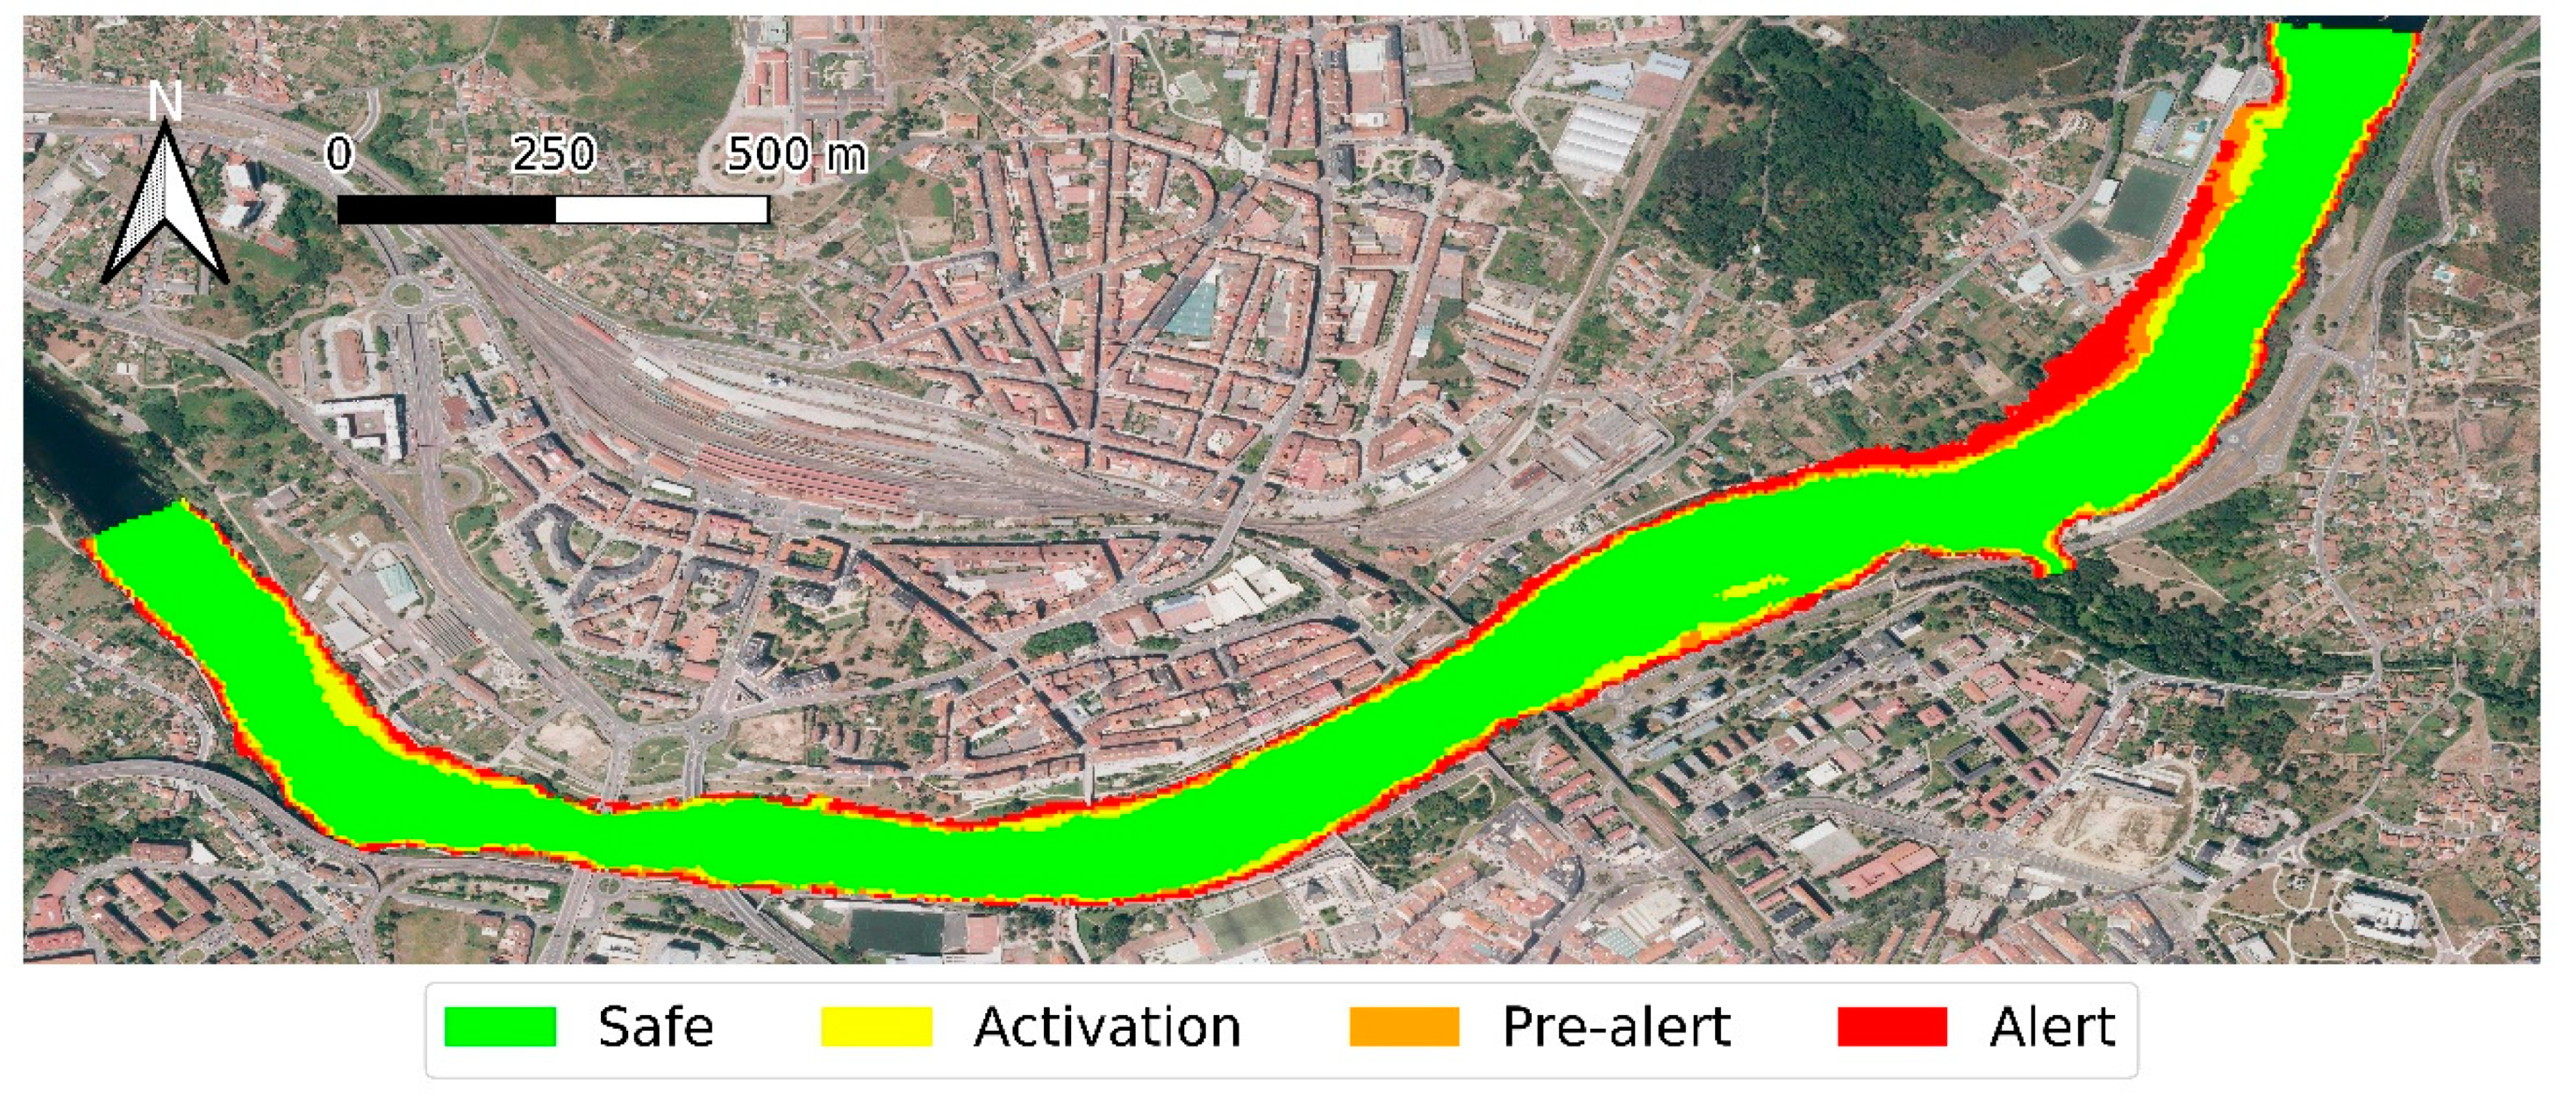
| Subbasin | Area (km2) | CNdry | CNaverage | CNmoist | Lag Time (min) |
|---|---|---|---|---|---|
| Sb1 | 2172 | 69 | 84 | 93 | 1740 |
| Sb2 | 1219 | 69 | 84 | 93 | 1500 |
| Sb3 | 897 | 72 | 86 | 94 | 1620 |
| Sb4 | 255 | 75 | 88 | 95 | 840 |
| Sb5 | 93 | 72 | 86 | 94 | 540 |
| Sb6 | 130 | 71 | 85 | 93 | 600 |
| CN Classes | Non-Humid Season (April–November) (30-day Antecedent Rainfall) (mm) | Humid Season (December–March) (5-day Antecedent Rainfall) (mm) |
|---|---|---|
| CNdry | <216 | <13 |
| CNaverage | 216–318 | 13–28 |
| CNmoist | >318 | >28 |
| Statistical Parameter | Lugo Station | Ourense Station |
|---|---|---|
| r | 0.97 | 0.90 |
| RSR | 0.30 | 0.37 |
| NSE | 0.91 | 0.86 |
| PBIAS | −5.25 | −9.89 |
| Statistical Parameter | Lugo Station | Ourense Station |
|---|---|---|
| r | 0.89 | 0.85 |
| RSR | 0.42 | 0.54 |
| NSE | 0.82 | 0.71 |
| PBIAS | −4.08 | −6.70 |
| Alert Status | Min Flow (m3/s) | Max Flow (m3/s) |
|---|---|---|
| Pre-activation | 0 | 511 |
| Activation | 511 | 1253 |
| Pre-alert | 1253 | 2000 |
| Alert | 2000 | - |
| Observed | Total | |||
|---|---|---|---|---|
| Alert | Non-Alert | |||
| Forecasted | Alert | 13 | 5 | 18 |
| Non-Alert | 4 | 2900 | 2904 | |
| Total | 17 | 2905 | 2922 | |
© 2020 by the authors. Licensee MDPI, Basel, Switzerland. This article is an open access article distributed under the terms and conditions of the Creative Commons Attribution (CC BY) license (http://creativecommons.org/licenses/by/4.0/).
Share and Cite
Fernández-Nóvoa, D.; García-Feal, O.; González-Cao, J.; de Gonzalo, C.; Rodríguez-Suárez, J.A.; Ruiz del Portal, C.; Gómez-Gesteira, M. MIDAS: A New Integrated Flood Early Warning System for the Miño River. Water 2020, 12, 2319. https://doi.org/10.3390/w12092319
Fernández-Nóvoa D, García-Feal O, González-Cao J, de Gonzalo C, Rodríguez-Suárez JA, Ruiz del Portal C, Gómez-Gesteira M. MIDAS: A New Integrated Flood Early Warning System for the Miño River. Water. 2020; 12(9):2319. https://doi.org/10.3390/w12092319
Chicago/Turabian StyleFernández-Nóvoa, Diego, Orlando García-Feal, José González-Cao, Carlos de Gonzalo, José Antonio Rodríguez-Suárez, Carlos Ruiz del Portal, and Moncho Gómez-Gesteira. 2020. "MIDAS: A New Integrated Flood Early Warning System for the Miño River" Water 12, no. 9: 2319. https://doi.org/10.3390/w12092319
APA StyleFernández-Nóvoa, D., García-Feal, O., González-Cao, J., de Gonzalo, C., Rodríguez-Suárez, J. A., Ruiz del Portal, C., & Gómez-Gesteira, M. (2020). MIDAS: A New Integrated Flood Early Warning System for the Miño River. Water, 12(9), 2319. https://doi.org/10.3390/w12092319


