A Nonparametric Stochastic Approach for Disaggregation of Daily to Hourly Rainfall Using 3-Day Rainfall Patterns


Abstract
1. Introduction
2. Disaggregation of Time-Series Data Using the KNNR Method
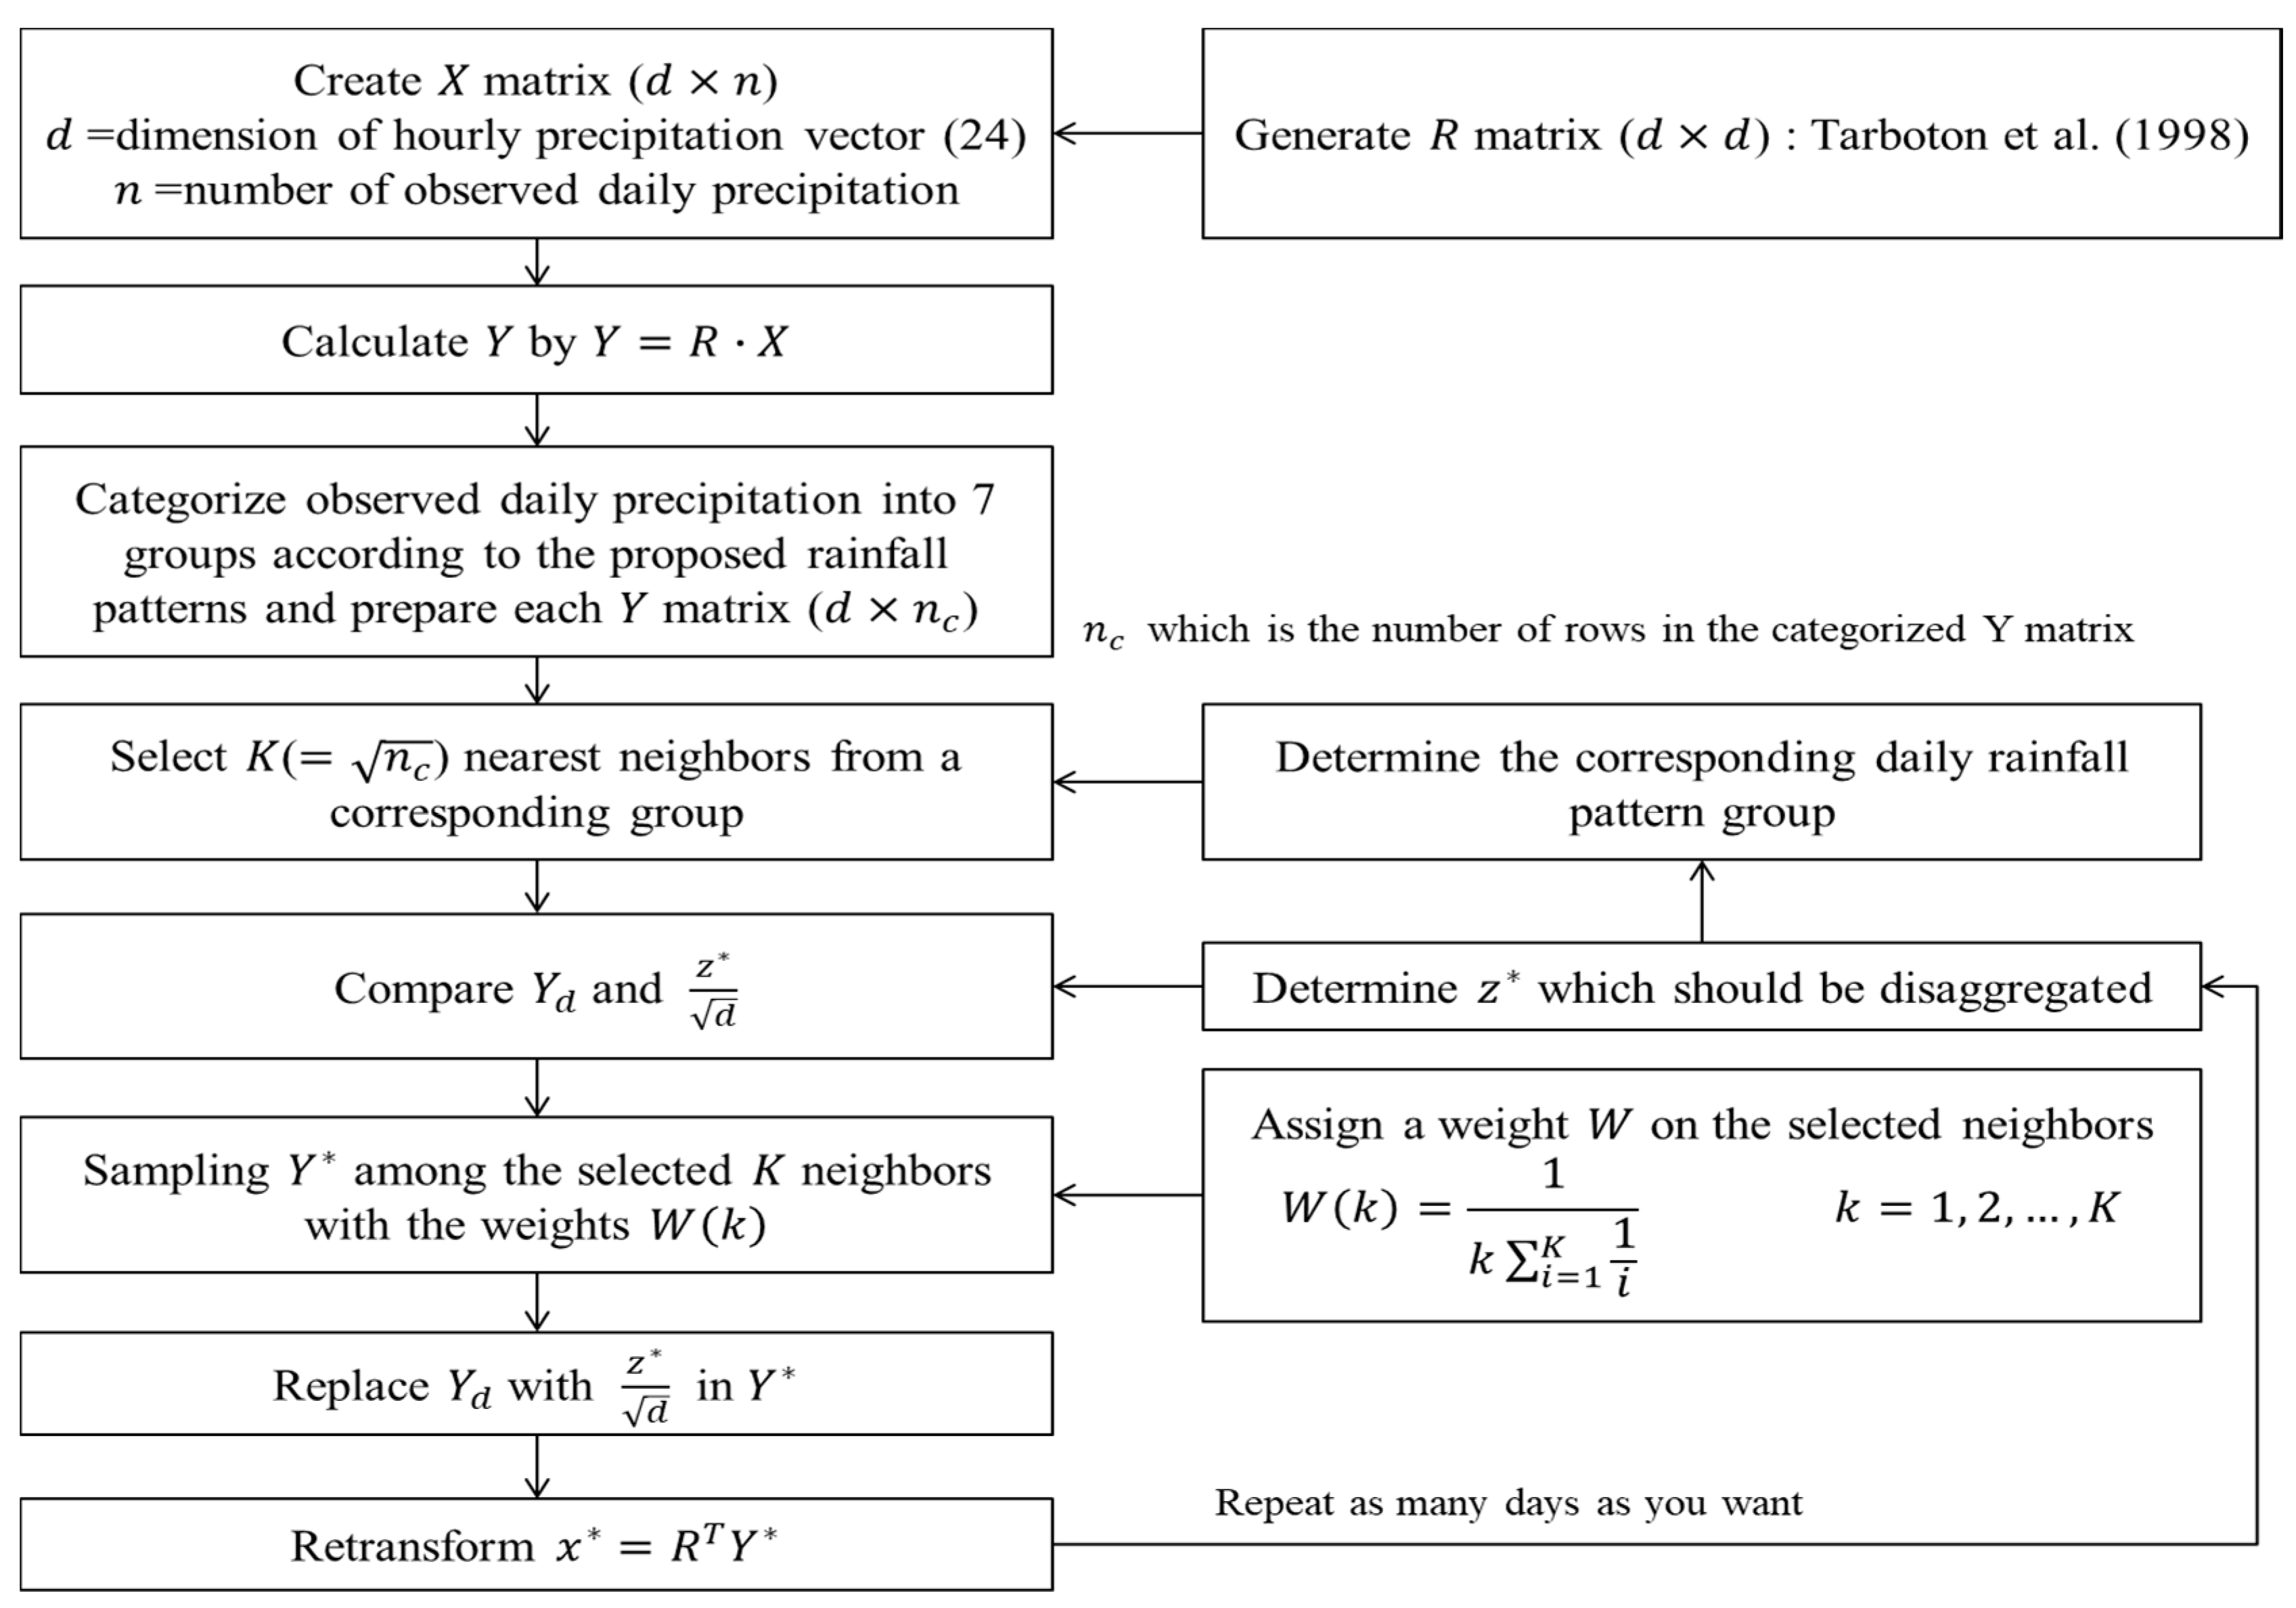
2.1. Stochastic Disaggregation Using the KNNR Method
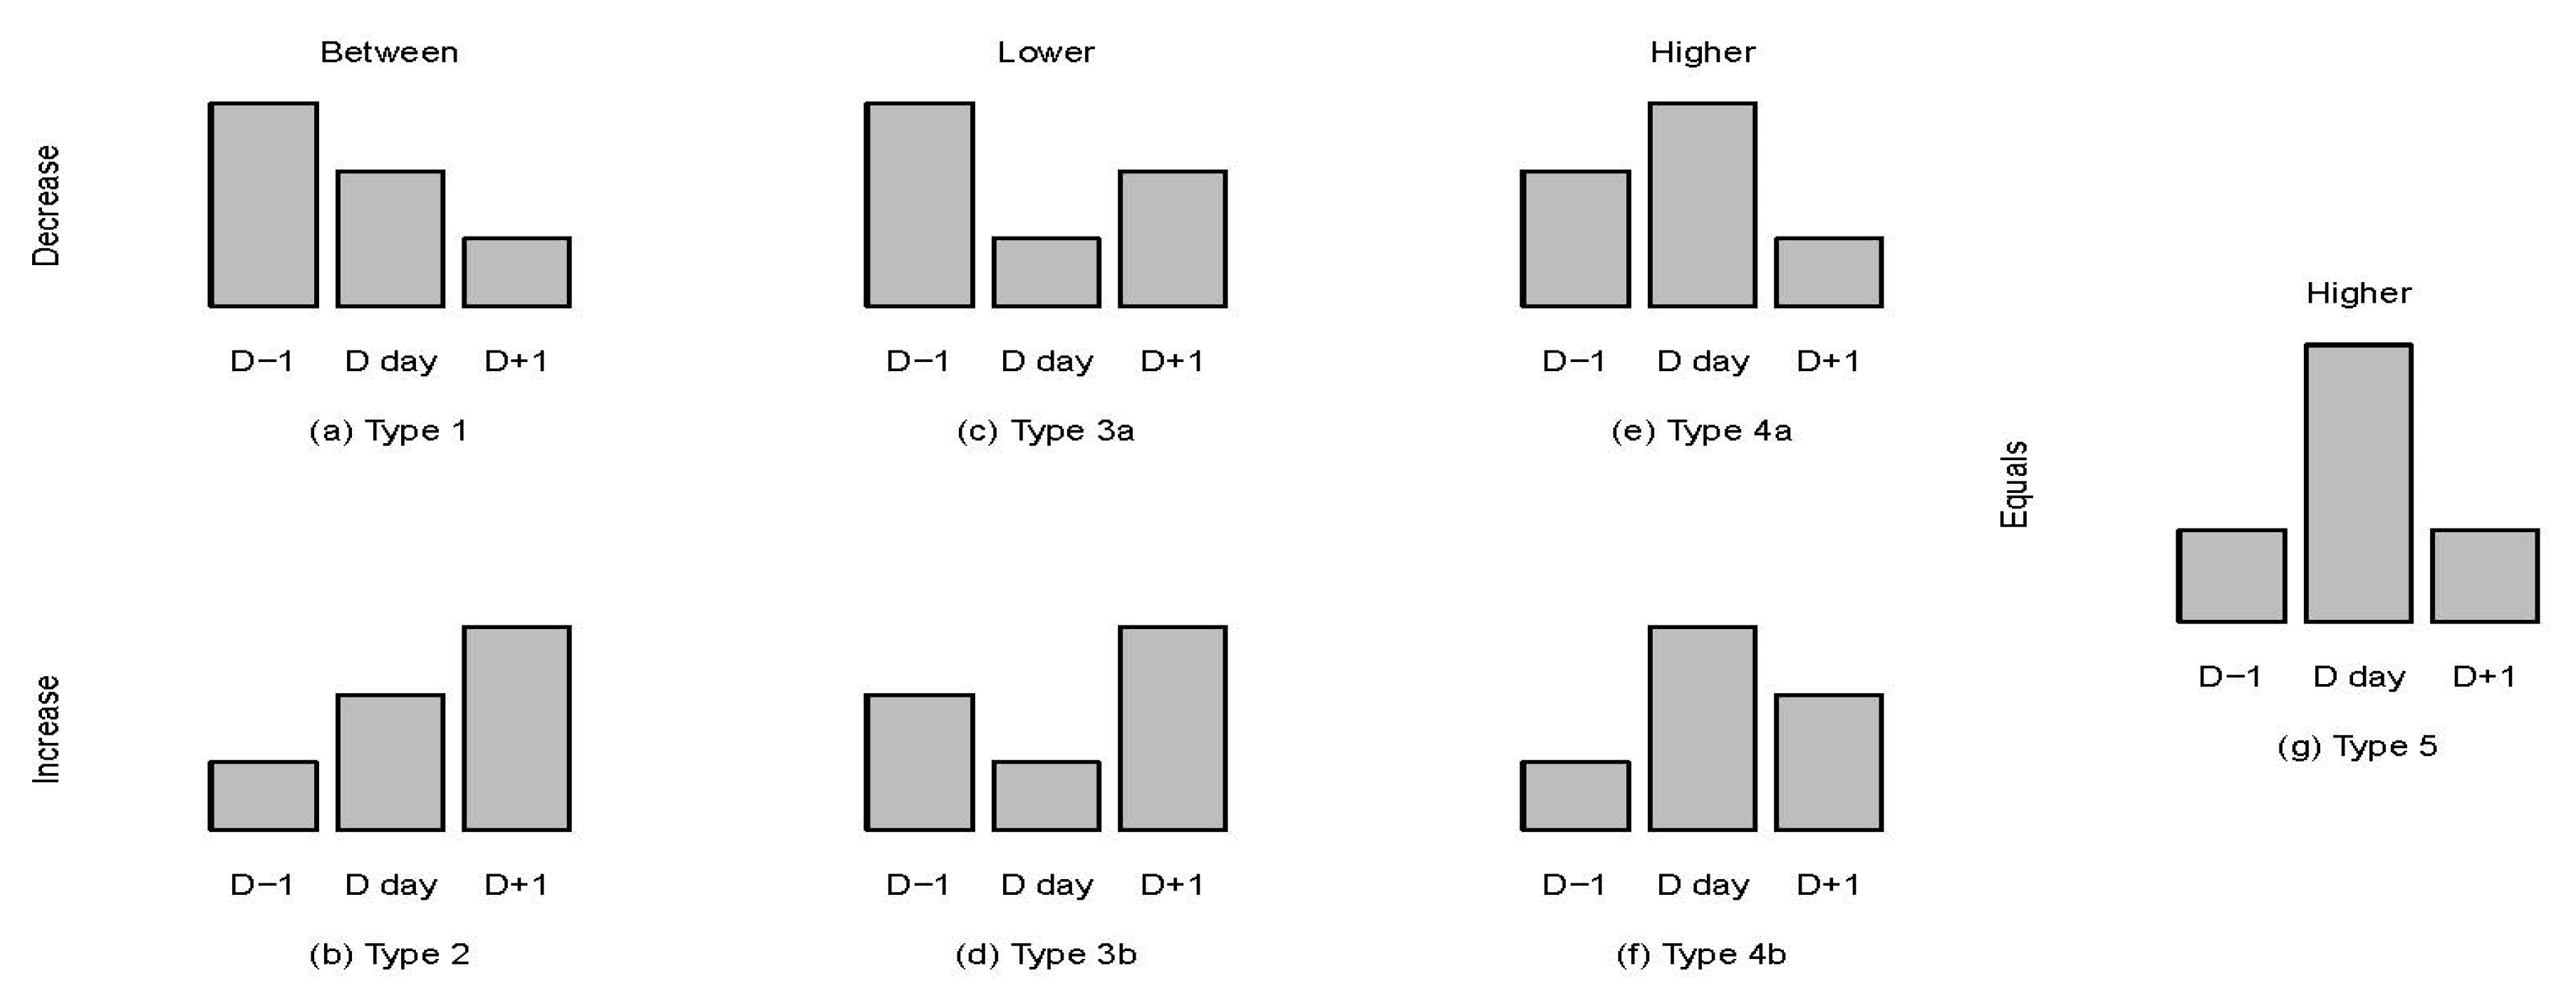
2.2. Proposed Three-day Rainfall Patterns
3. Results
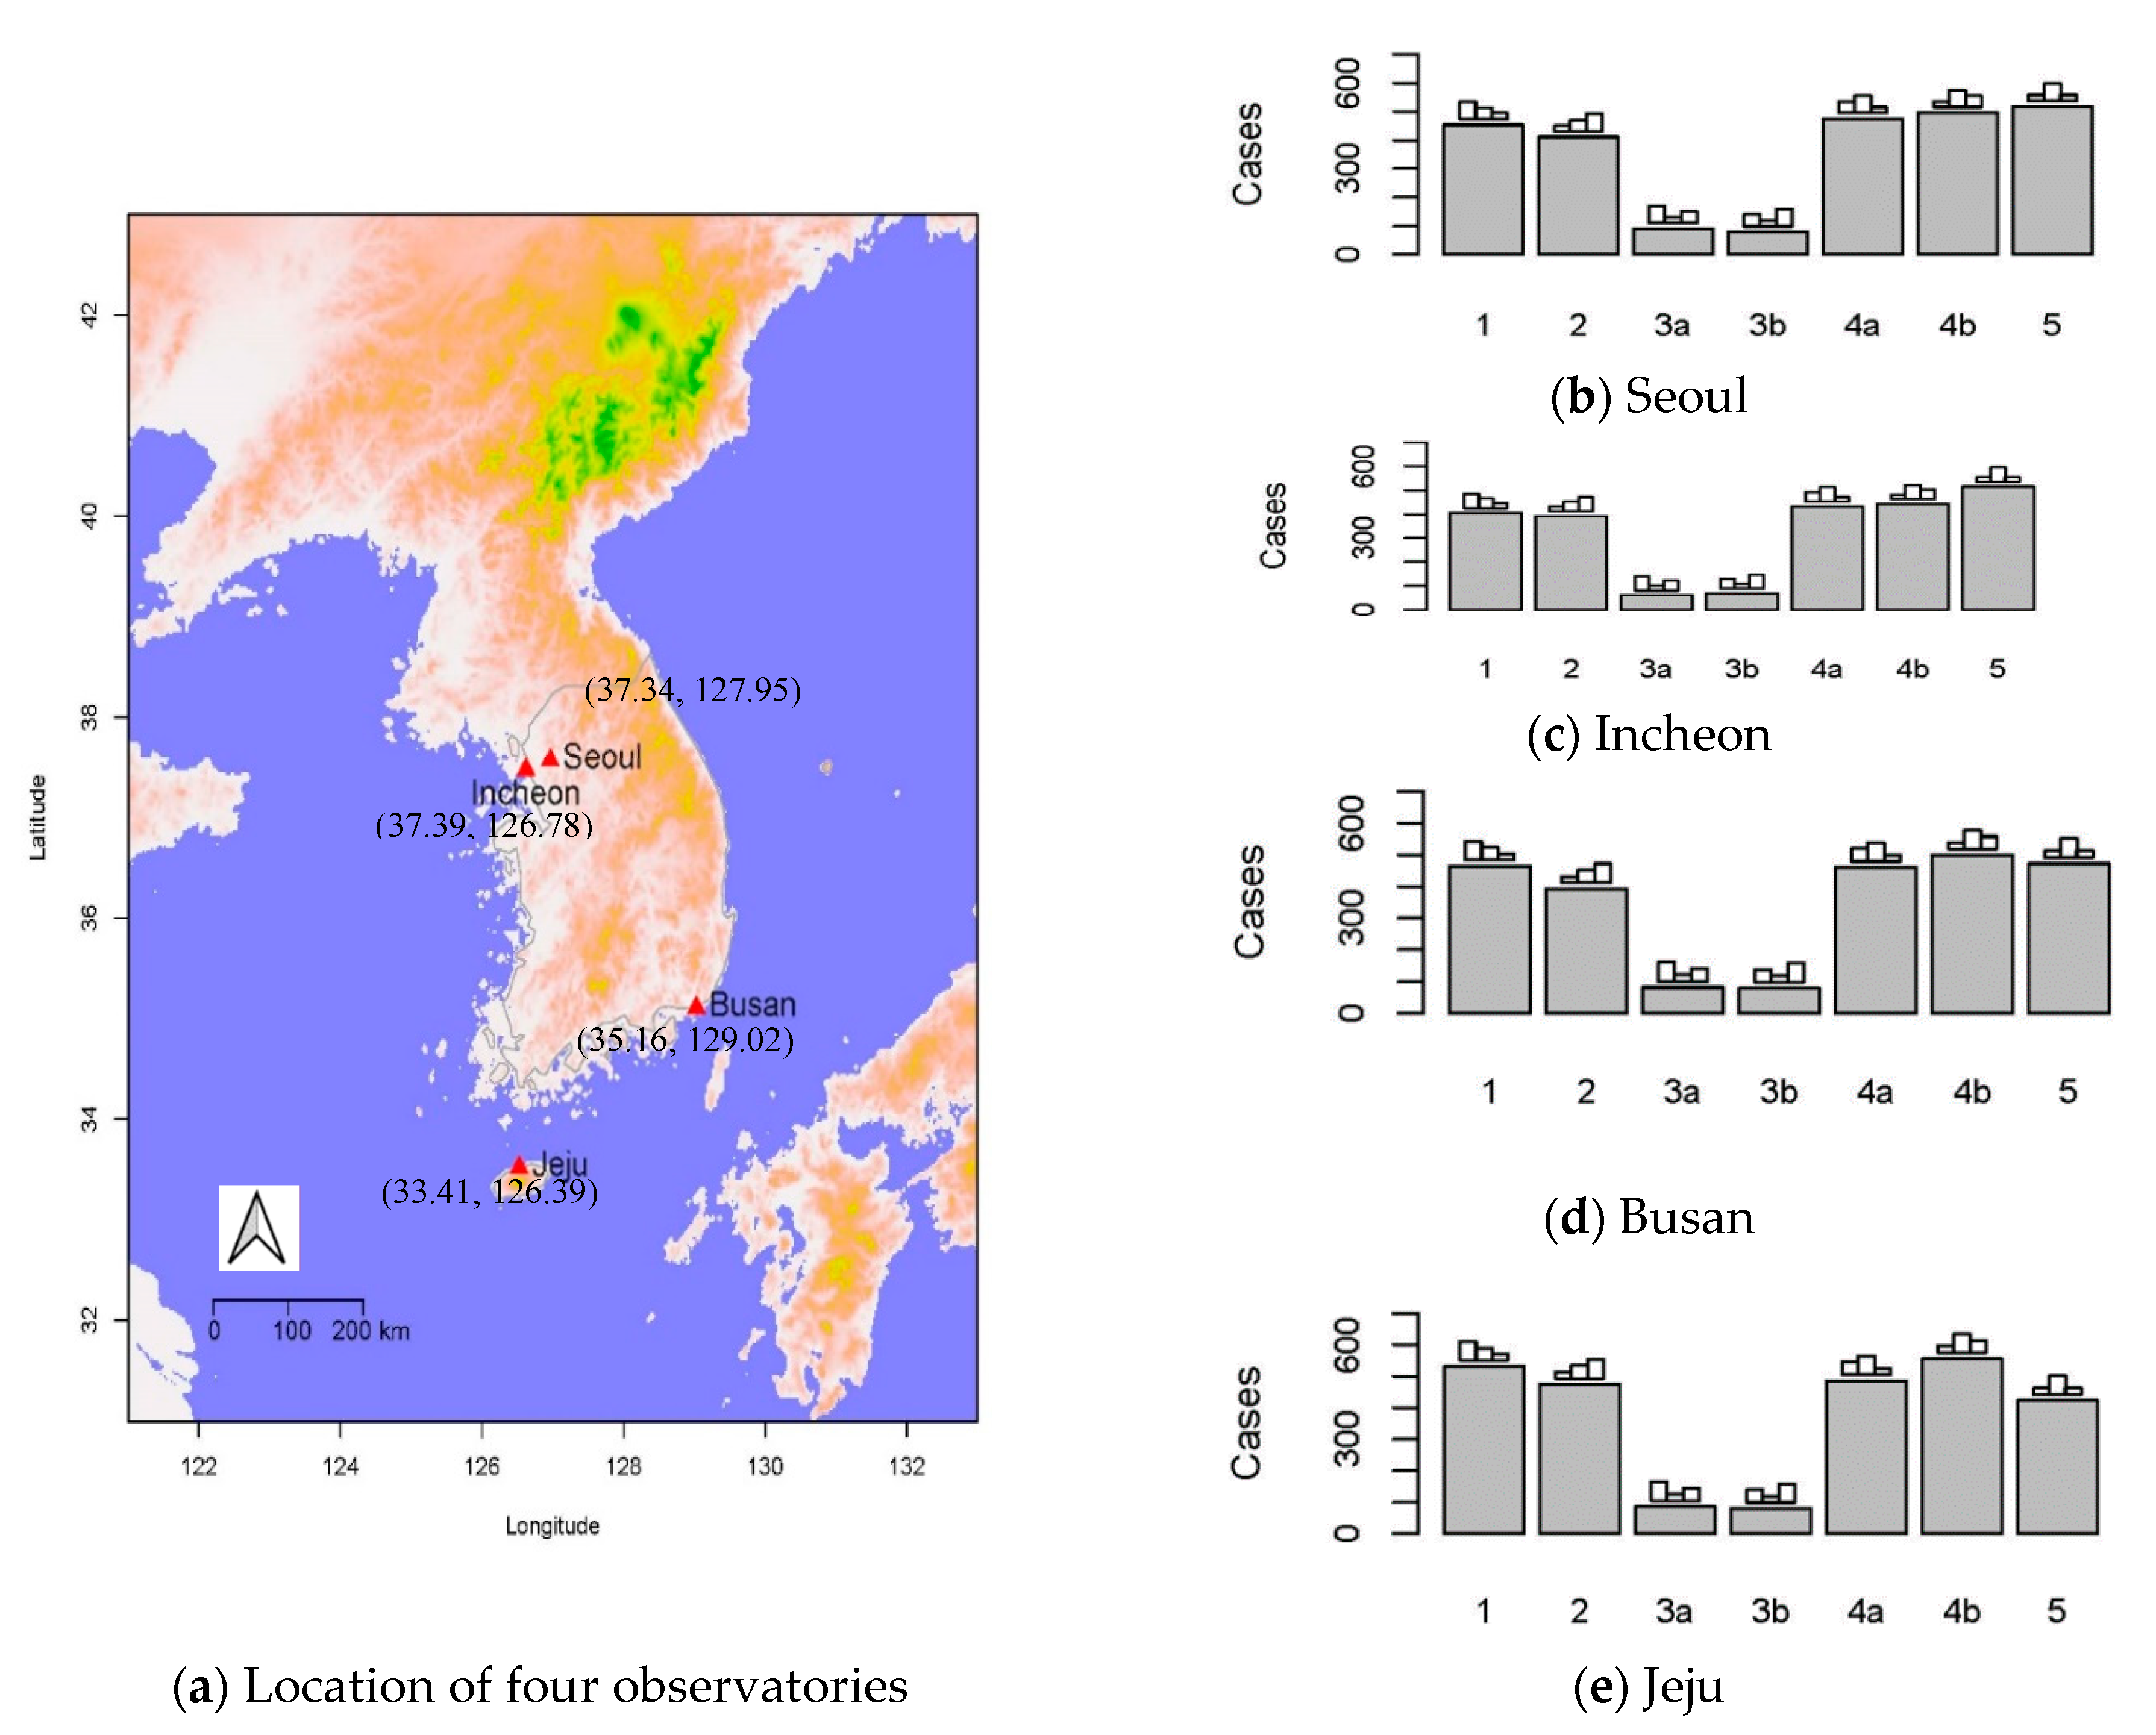
3.1. Applied Data
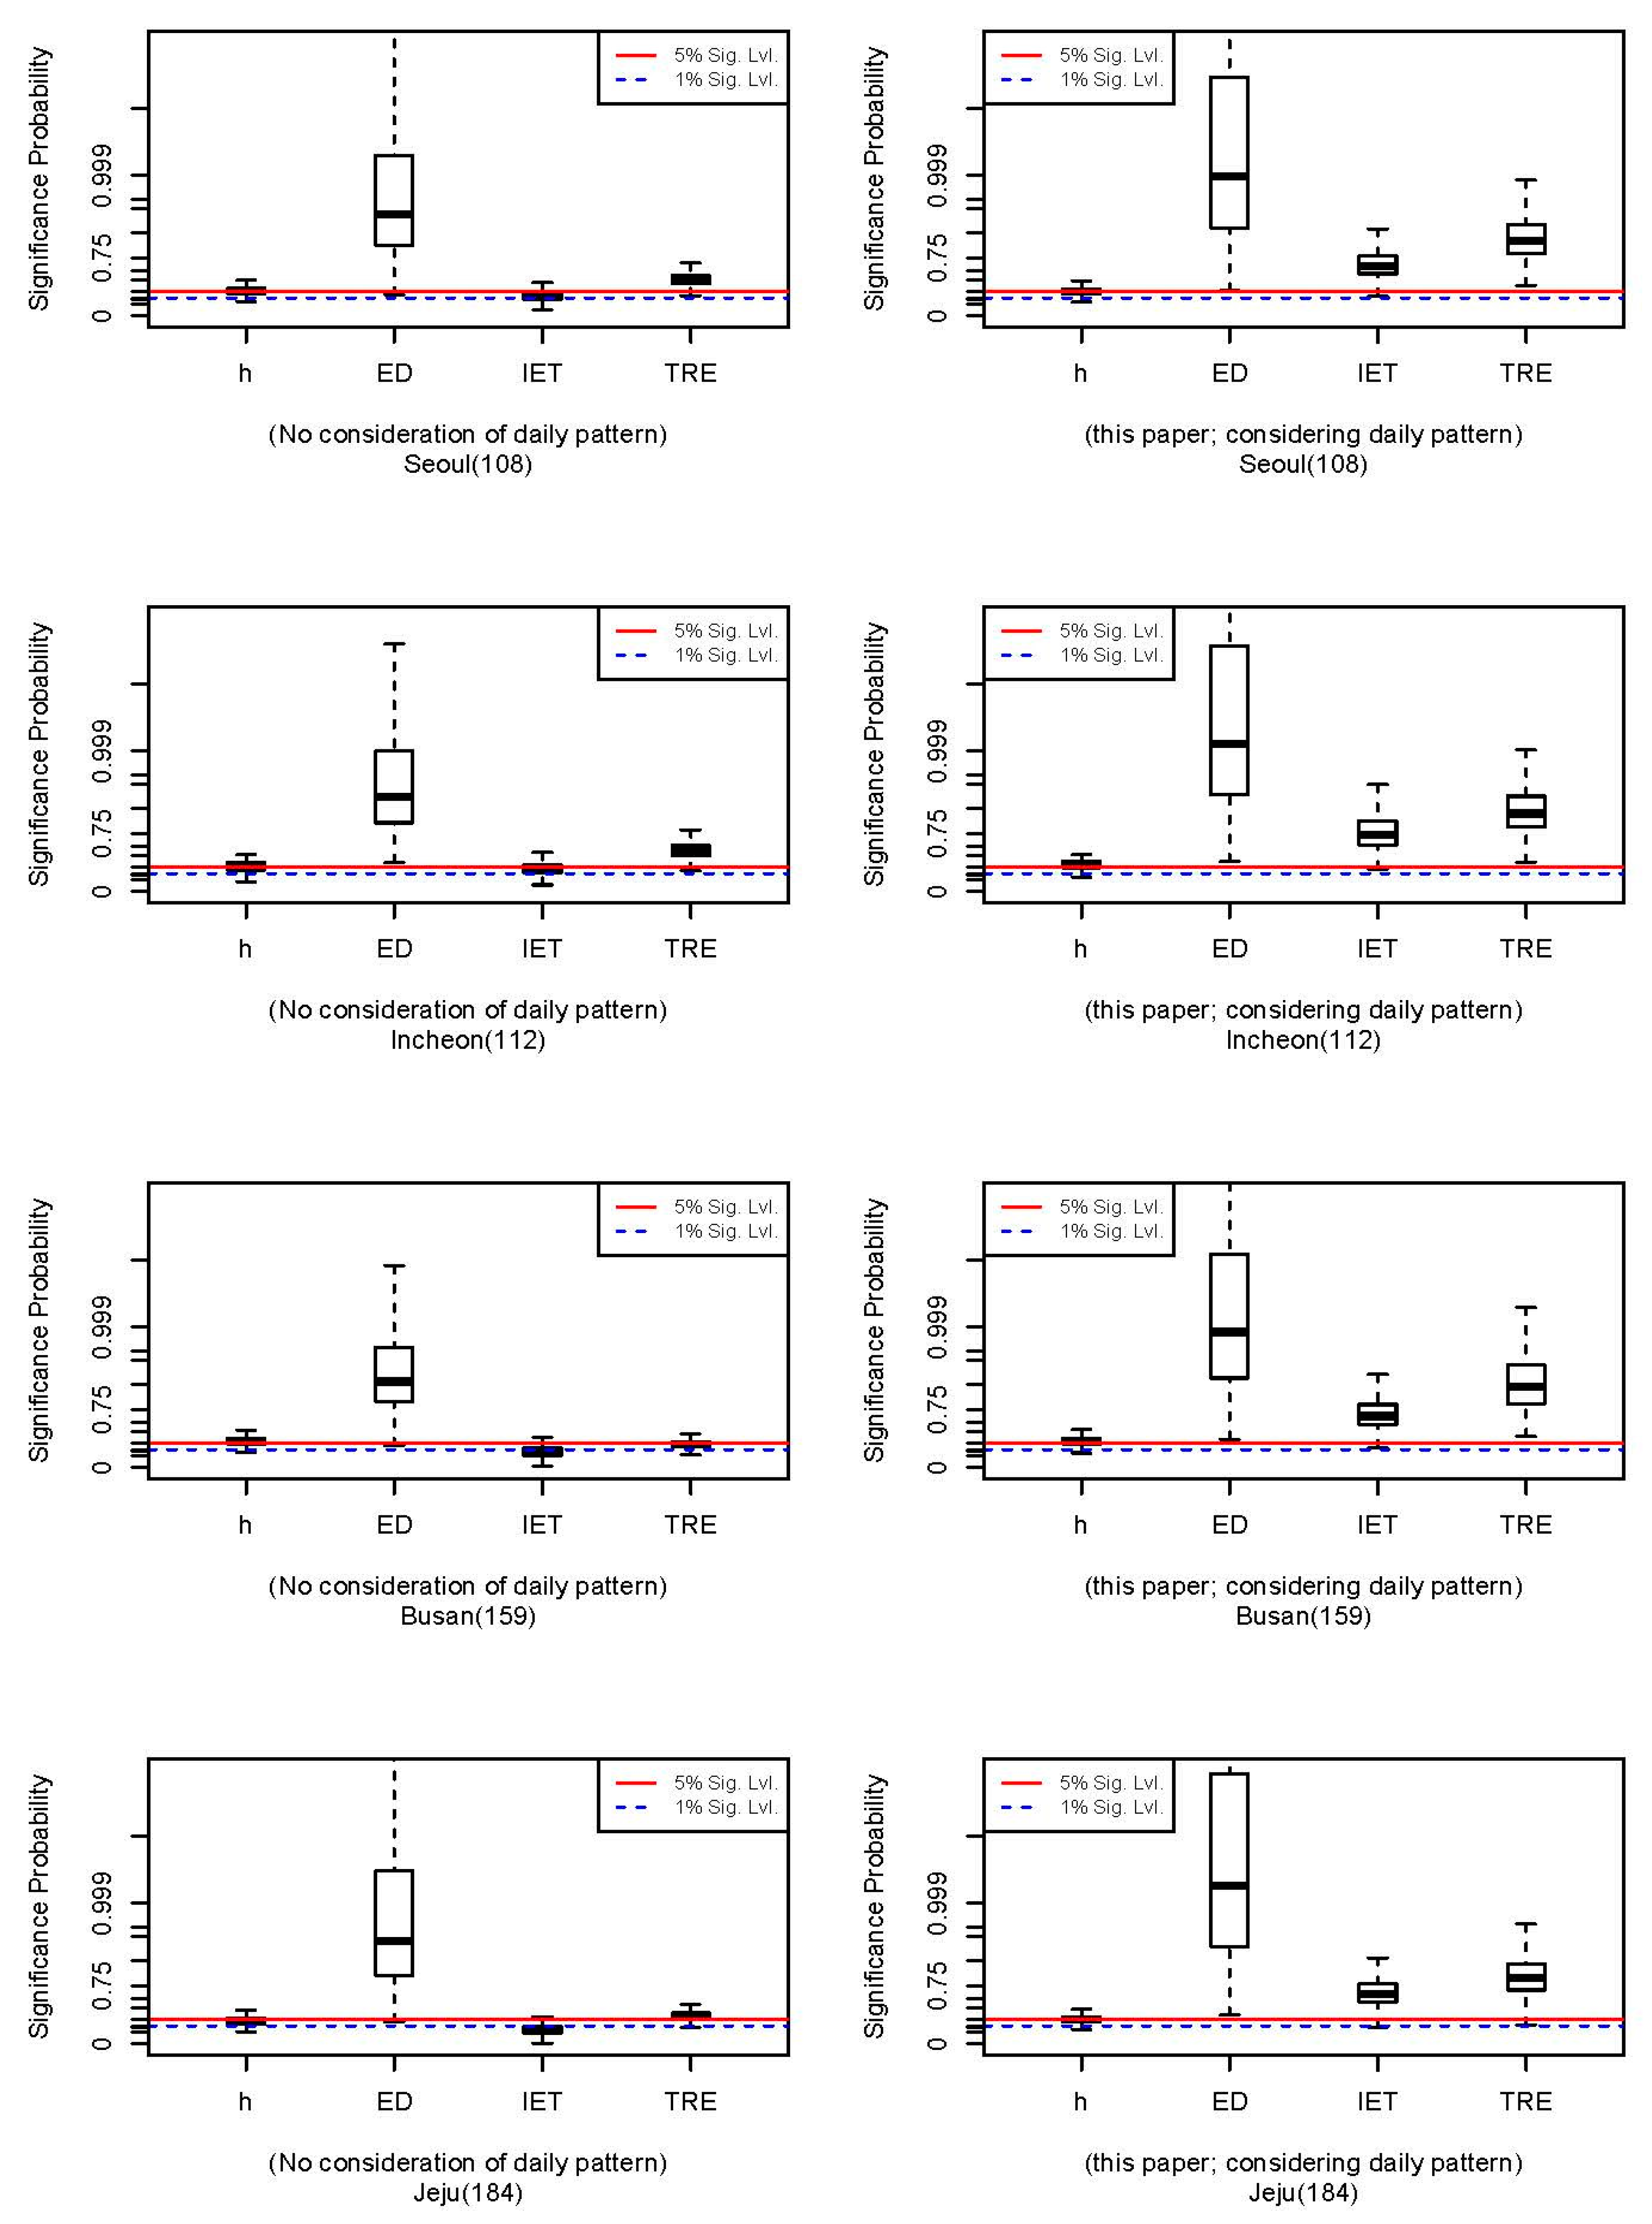
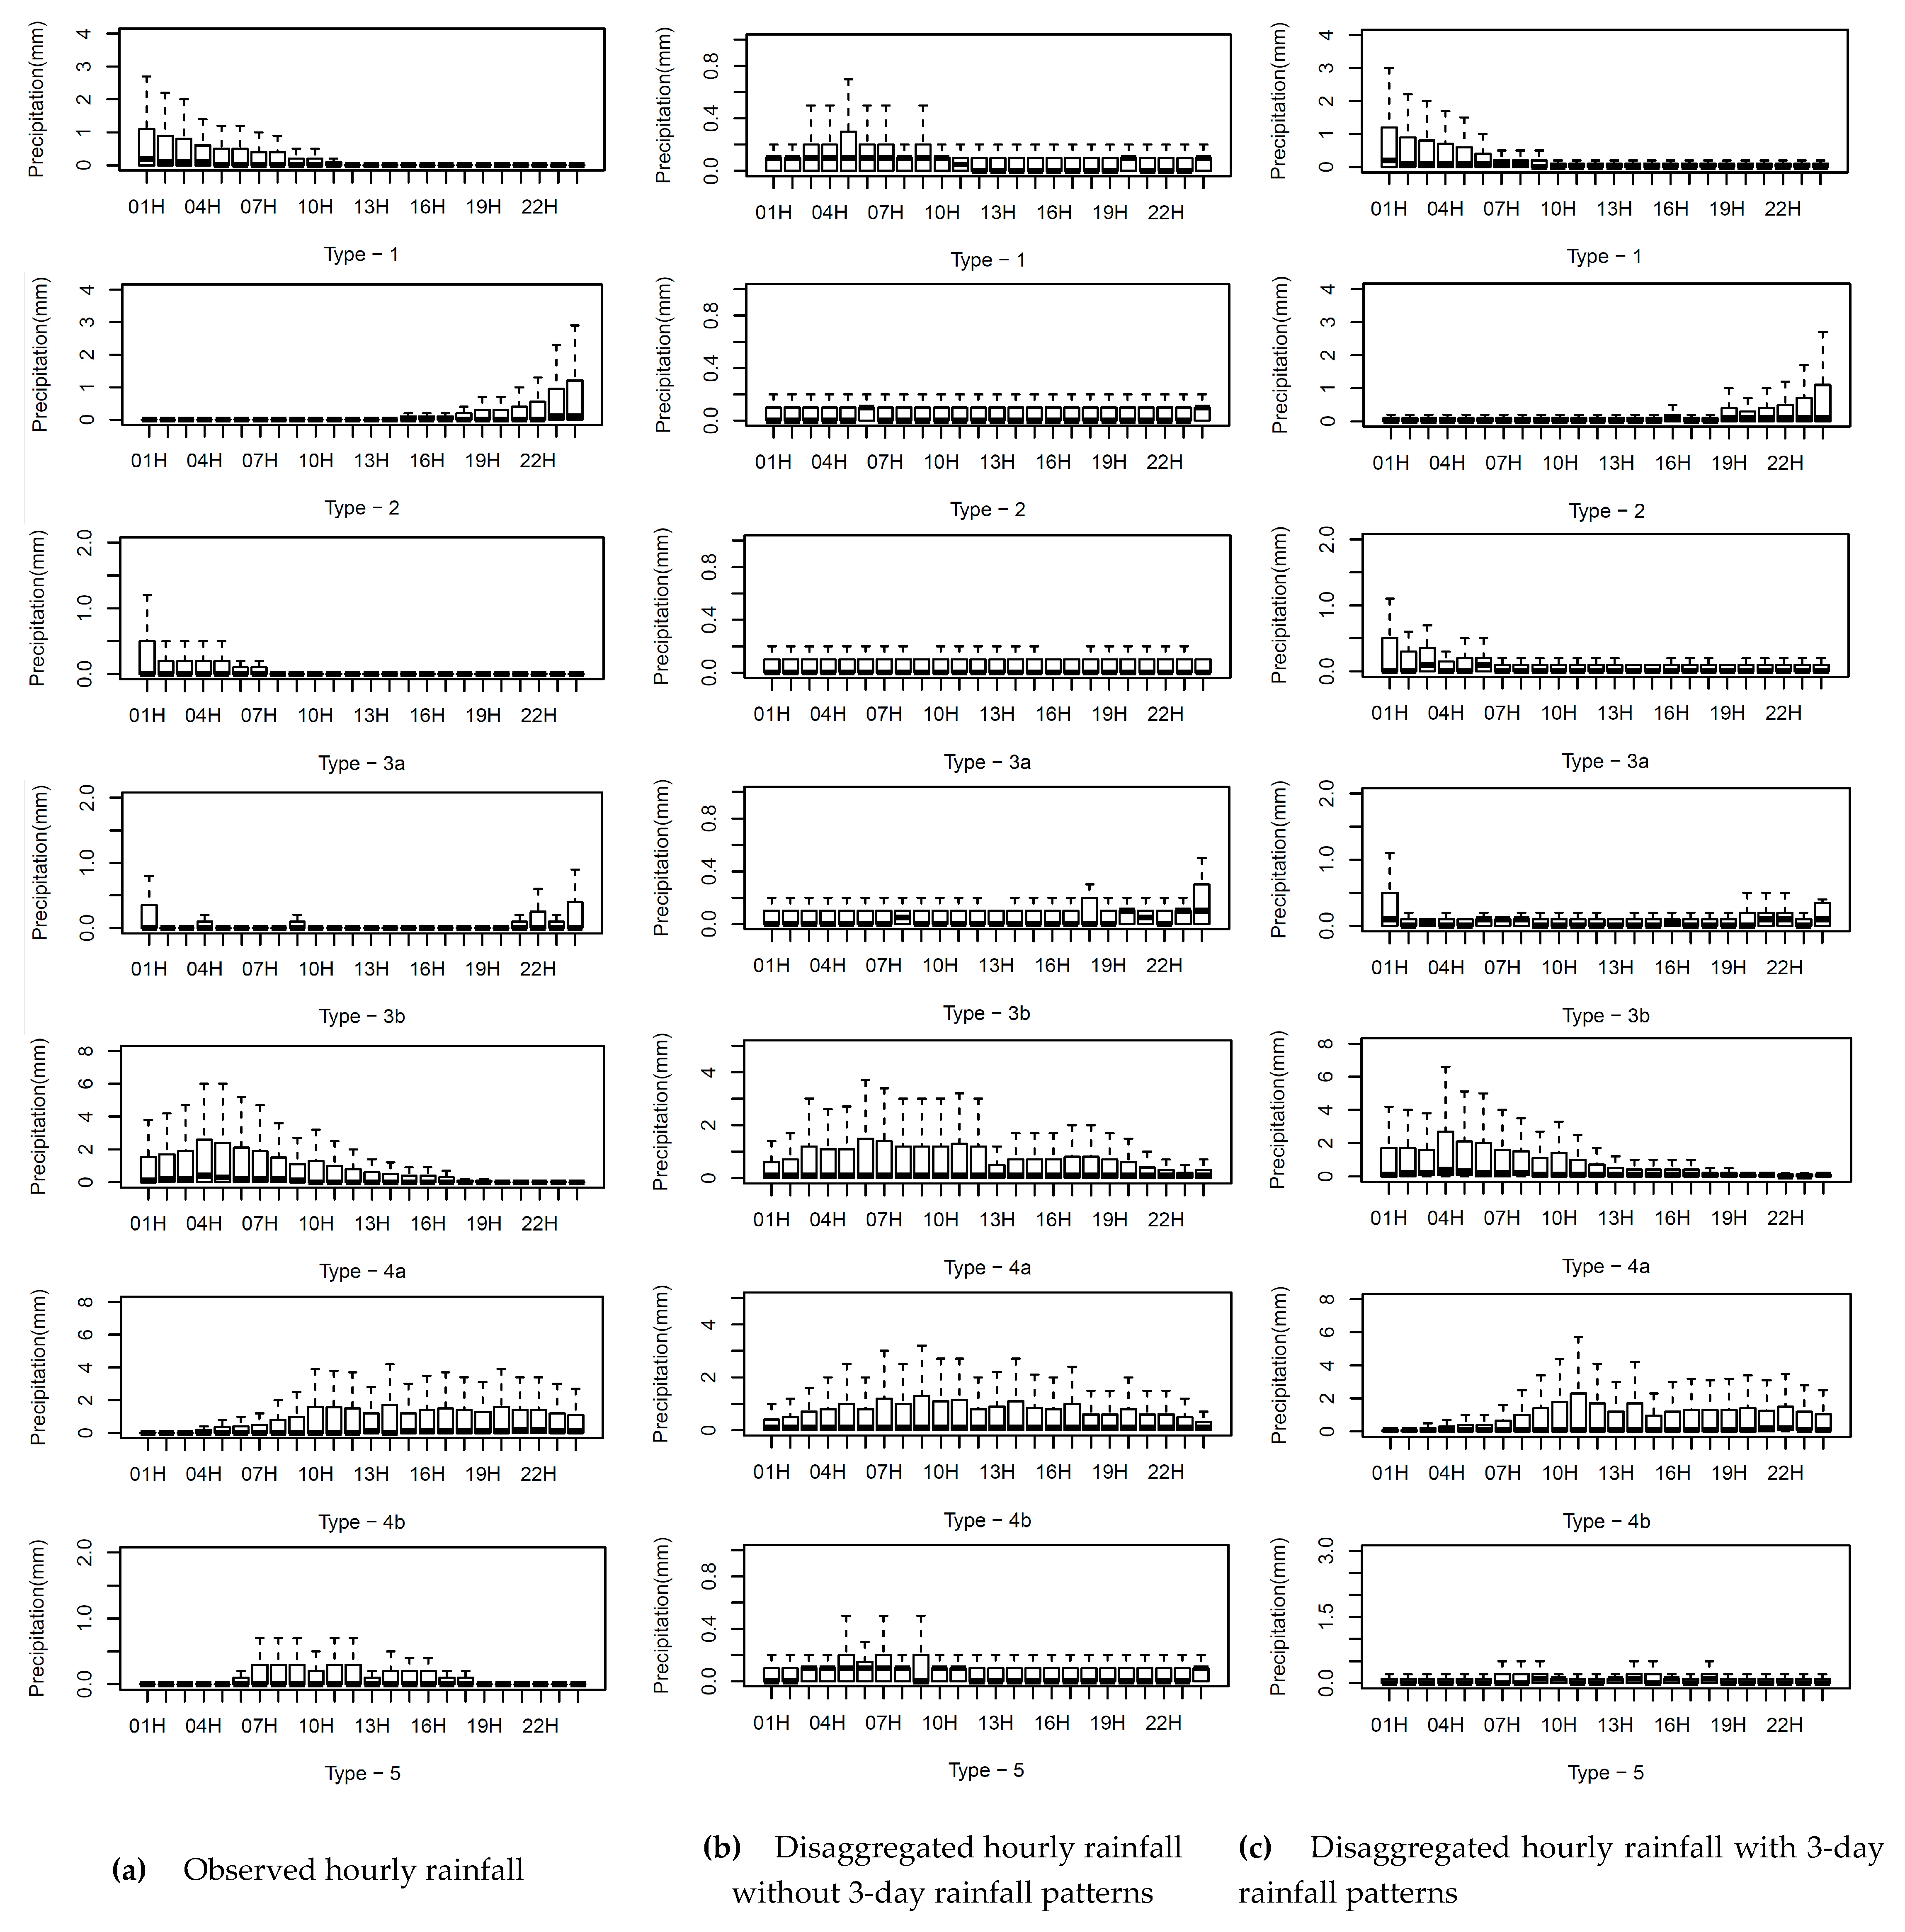
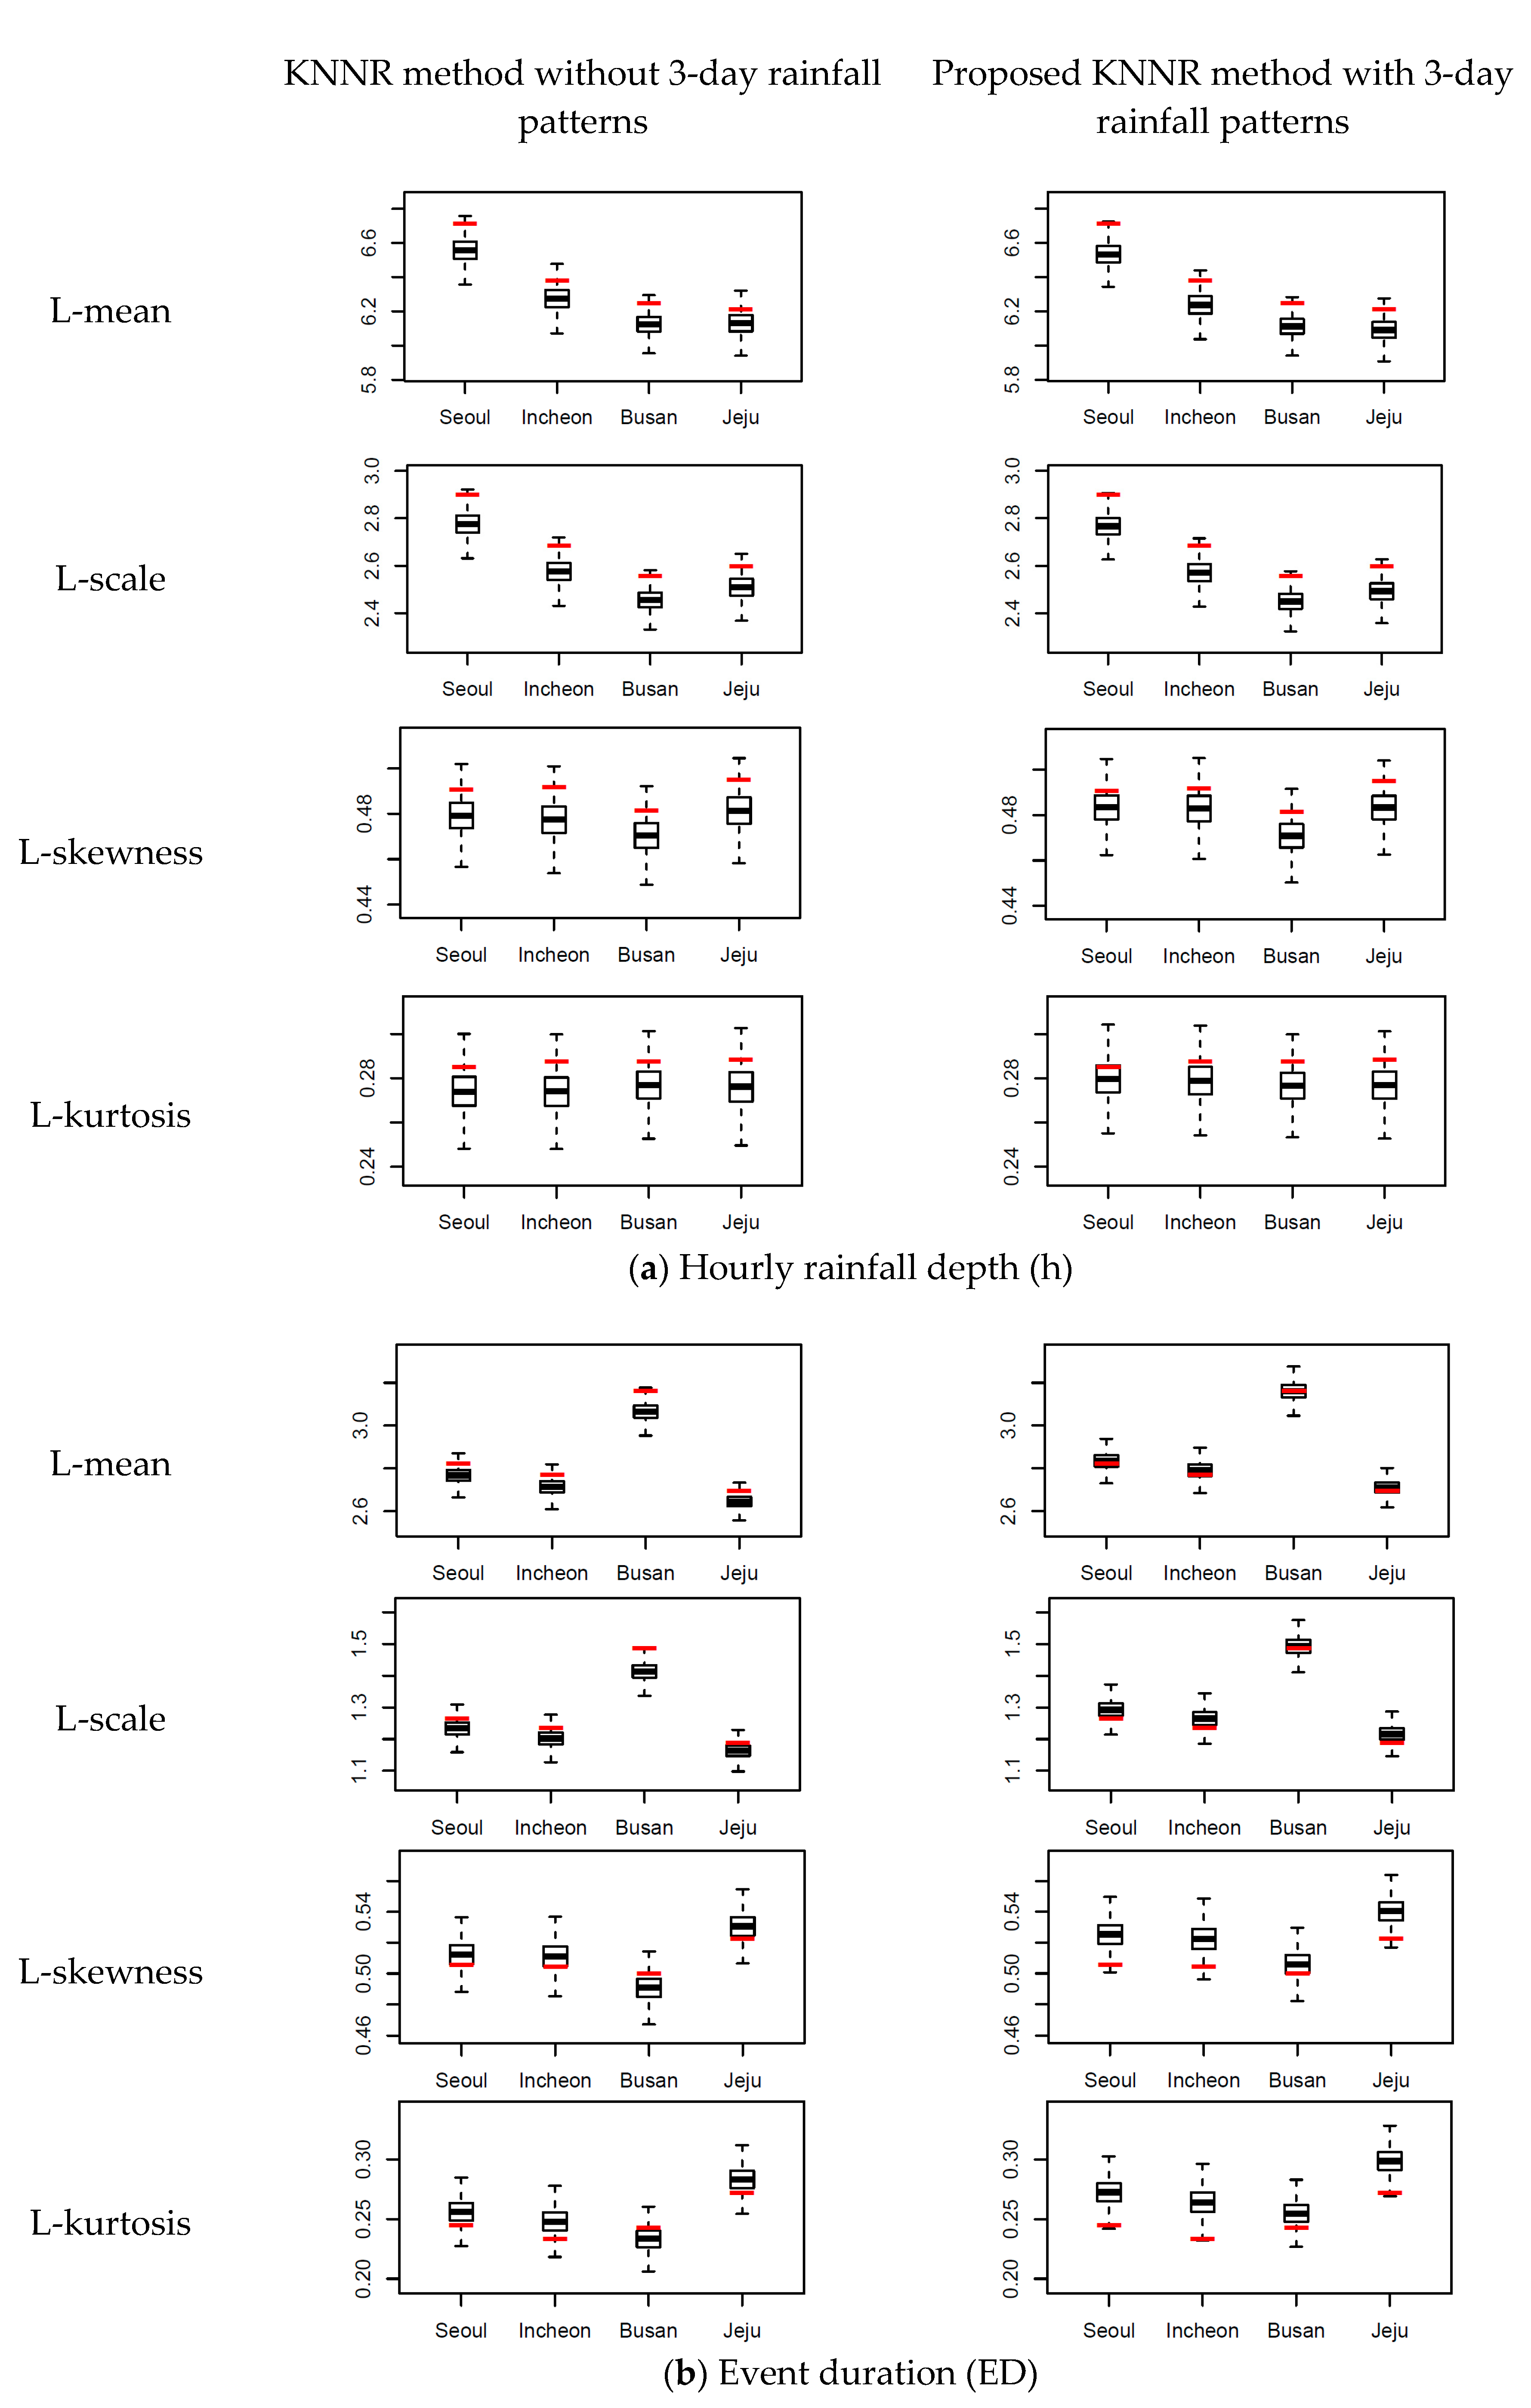
3.2. Comparison of Statistical Properties of Hourly Rainfall with/without Three-day Rainfall Patterns
4. Conclusions
Author Contributions
Funding
Conflicts of Interest
References
- Matalas, N.C. Mathematical assessment of synthetic hydrology. Water Resour. Res. 1967, 3, 937–946. [Google Scholar] [CrossRef]
- Mandelbrot, B.B.; Wallis, J.R. Noah, Josep, and operational hydrology. Water Resour. Res. 1968, 4, 909–918. [Google Scholar] [CrossRef]
- Mandelbrot, B.B.; Wallis, J.R. Computer experiments with fractional Gaussian noises, 1. Averages and variances. Water Resour. Res. 1969, 5, 228–241. [Google Scholar] [CrossRef]
- Mandelbrot, B.B.; Wallis, J.R. Computer experiments with fractional Gaussian noises, 2. Rescaled ranges and spectra. Water Resour. Res. 1969, 5, 242–259. [Google Scholar] [CrossRef]
- Mandelbrot, B.B.; Wallis, J.R. Some longrun properties of geophysical records. Water Resour. Res. 1969, 5, 321–340. [Google Scholar] [CrossRef]
- Rodriguez-Iturbe, I.; Mejia, J.M.; Dawdy, D.R. Streamflow simulation, 1, A new look at markovian models, fractional Gaussian noise and crossing theory. Water Resour. Res. 1972, 8, 921–930. [Google Scholar] [CrossRef]
- Valencia, D.R.; Schaake, J.C. Disaggregation process in stochastic hydrology. Water Resour. Res. 1973, 9, 580–585. [Google Scholar]
- Tarboton, D.G.; Sharma, A.; Lall, U. Disaggregation procedures for stochastic hydrology based on nonparametric density estimation. Water Resour. Res. 1998, 34, 107–119. [Google Scholar] [CrossRef]
- Prairie, J.R.; Rajagopalan, B.; Lall, U.; Fulp, T. A stochastic nonparametric technique for space-time disaggregation of streamflows. Water Resour. Res. 2007, 43, W03432. [Google Scholar] [CrossRef]
- Sharma, A.; O’Neill, R. A nonparametric approach for representing interannual dependence in monthly streamflow. Water Resour. Res. 2002, 38. [Google Scholar] [CrossRef]
- Nowak, K.; Prairie, J.R.; Rajagopalan, B.; Lall, U. A Non-parametric Stochastic Approach for Multisite Disaggregation of Annual to Daily Streamflow. Water Resour. Res. 2010, 46, W08529. [Google Scholar] [CrossRef]
- Lall, U.; Sharma, A. A nearest neighbor bootstrap for resampling hydrologic time series. Water Resour. Res. 1996, 32, 679–693. [Google Scholar] [CrossRef]
- Kumar, D.N.; Lall, U.; Peterson, M.R. Multisite disaggregation of monthly to daily streamflow. Water Resour. Res. 2000, 36, 1823–1833. [Google Scholar] [CrossRef]
- Lee, T.; Salas, J.D.; Prairie, J. An enhanced nonparametric streamflow disaggregation model with genetic algorithm. Water Resour. Res. 2010, 46, W08545. [Google Scholar] [CrossRef]
- Bogardi, I.; Matyasovszky, I.; Bardossy, A.; Duckstein, L. Application of a space-time stochastic model for daily precipitation using atmospheric circulation patterns. J. Geophys. Res. 1993, 98, 16653–16667. [Google Scholar] [CrossRef]
- Chang, T.J.; Kavvas, M.L.; Delleur, J.W. Daily precipitation modeling by discrete autoregressive moving average processes. Water Resour. Res. 1984, 20, 565–580. [Google Scholar] [CrossRef]
- Chin, E.H. Modeling daily precipitation occurrence process with Markov-Chain. Water Resour. Res. 1977, 13, 949–956. [Google Scholar] [CrossRef]
- Lall, U.; Rajagopalan, B.; Tarboton, D.G. A non parametric wet/dry spell model for resampling daily precipitation. Water Resour. Res. 1996, 32, 2802–2823. [Google Scholar] [CrossRef]
- Srikanthan, R.; McMahon, T.A. Stochastic generation of annual, monthly and daily climate data: A review. Hydrol. Earth Syst. Sci. 2001, 5, 653–670. [Google Scholar] [CrossRef]
- Ormsbee, L.E. Rainfall disaggregation model for continuous hydrologic modeling. J. Hydraul. Eng. 1989, 115, 507–525. [Google Scholar] [CrossRef]
- Liou, E.Y.; James, L.D. OPSET-Program for Computerized Selection of Watershed Parameter Values of the Stanford Watershed Model; Research Report No. 34; University of Kentucky Water Resources Institute: Lexington, KY, USA, 1970. [Google Scholar]
- Lee, J.; Chung, G. Estimation of InterEvent Time Definition Using in Urban Areas. J. Korean Soc. Hazard Mitig. 2017, 17, 287–294. [Google Scholar] [CrossRef]


© 2020 by the authors. Licensee MDPI, Basel, Switzerland. This article is an open access article distributed under the terms and conditions of the Creative Commons Attribution (CC BY) license (http://creativecommons.org/licenses/by/4.0/).
Share and Cite
Park, H.; Chung, G. A Nonparametric Stochastic Approach for Disaggregation of Daily to Hourly Rainfall Using 3-Day Rainfall Patterns. Water 2020, 12, 2306. https://doi.org/10.3390/w12082306
Park H, Chung G. A Nonparametric Stochastic Approach for Disaggregation of Daily to Hourly Rainfall Using 3-Day Rainfall Patterns. Water. 2020; 12(8):2306. https://doi.org/10.3390/w12082306
Chicago/Turabian StylePark, Heeseong, and Gunhui Chung. 2020. "A Nonparametric Stochastic Approach for Disaggregation of Daily to Hourly Rainfall Using 3-Day Rainfall Patterns" Water 12, no. 8: 2306. https://doi.org/10.3390/w12082306
APA StylePark, H., & Chung, G. (2020). A Nonparametric Stochastic Approach for Disaggregation of Daily to Hourly Rainfall Using 3-Day Rainfall Patterns. Water, 12(8), 2306. https://doi.org/10.3390/w12082306