Article

Characteristics of Fluorescence Spectra, UV Spectra, and Specific Growth Rates during the Outbreak of Toxic Microcystis Aeruginosa FACHB-905 and Non-Toxic FACHB-469 under Different Nutrient Conditions in a Eutrophic Microcosmic Simulation Device

1
College of Life and Environmental Science, Wenzhou University, Wenzhou 325035, China
2
National and Local Joint Engineering Research Center of Ecological Treatment Technology for Urban Water Pollution, Department of Environmental Science, Wenzhou University, Wenzhou 325035, China
*
Authors to whom correspondence should be addressed.
Water 2020, 12(8), 2305; https://doi.org/10.3390/w12082305
Submission received: 26 June 2020 / Revised: 6 August 2020 / Accepted: 14 August 2020 / Published: 17 August 2020
(This article belongs to the Special Issue Algae: Indices of Water and Ecological Quality)

Abstract

:
Microcystis aeruginosa is the dominant alga forming cyanobacteria blooms, the growth of which is limited by available nutrients. Thus, it is necessary to study cyanobacteria blooms and explore the growth of Microcystis aeruginosa under different nutrient conditions. In this paper, we take Microcystis aeruginosa, including toxic Freshwater Algae Culture of Hydrobiology Collection (FACHB)-905 and non-toxic FACHB-469 strains, into account. The strains were cultured using a simulation device under different nutrient conditions. Ultraviolet spectra, three-dimensional fluorescence spectra, and kinetic parameter indicators of the two species are studied. Compared to FACHB-469, the results show that the specific growth rate of FACHB-905 is much higher, in particular, FACHB-905 is the dominant species under low nutrient conditions. Furthermore, the UV spectral characteristics indicate that the molecular weight of dissolved organic matter in the culture tank of toxic FACHB-905 is greater than that of FACHB-469. Additionally, the humification index of toxic FACHB-905 is slightly higher as well, which suggests that it is more stable in the presence of dissolved organic matter during blooms. Therefore, the toxic Microcystis strain is more likely to become the dominant species in water blooms under lower eutrophic conditions and water blooms formed by the toxic Microcystis strain may be more difficult to recover from.

1. Introduction

Cyanobacteria blooms have been reported frequently throughout the world over the past few decades [1,2]. Several of the world’s largest lakes, such as Lake Erie in the United States and Taihu Lake in China, have experienced algal blooms [3,4]. Cyanobacteria blooms are the most common type of algae blooms in China, including Microcystis, Anabaena, Aphanizomenon, and Planktothrix algae blooms. In particular, the frequency and area of Microcystis blooms are the highest, during which algae toxins are released. These toxins can then negatively influence the surrounding ecosystems [5,6,7].
Since the 1980s, a number of major water bodies in China have experienced large-area cyanobacteria blooms (mainly Microcystis), such as Dianchi Lake, Chaohu Lake, and the Yangtze River Three Gorges Reservoir, which have had a great impact on people’s lives [8,9,10,11]. Cyanobacteria blooms reduce the dissolved oxygen in the water, affect the growth of fish and other aquatic organisms, and can even lead to imbalance of the ecosystem and pollution of domestic water, which seriously affect aquaculture, water supply, tourism, and so on [12,13,14]. In recent decades, China has taken various measures and has made considerable efforts to alleviate lake pollution, following which the degree of eutrophication in China’s lakes has declined, to some extent, and the lake water quality has been improved [15]. However, the eutrophication problems have not been eradicated, and it is still necessary to perform in-depth research, especially considering the algae blooms caused by eutrophication. In addition, it is also necessary to explore fast and accurate online methods to monitor the outbreak of algal blooms.
Ultraviolet spectroscopy can be used to trace the source, composition, and reactivity of dissolved organic matter (DOM) in natural water. Thus, the UV spectrum is usually used to characterize different types of DOM [16]. The spectral slopes and their ratios are also used to detect alterations in the molecular weights of DOM [17]. Fluorescence spectroscopy is also a focus of research on the water environment, where three-dimensional excitation–emission matrix (3DEEM) fluorescence spectroscopy presents a wide range of applications for water quality monitoring [18]. Fluorescence spectroscopy can be used to quickly and accurately analyze water quality levels, with high efficiency, high sensitivity, and low detection limits, and can be applied to small samples without damaging the sample structure [19]. Therefore, it has been widely used in applications such as assessing the water quality of rivers, lakes, groundwater, surface water, and domestic sewage [20,21].
Despite their wide use for various samples and increasing trends of application, to our knowledge, UV absorption spectroscopy and 3DEEM fluorescence spectroscopy have not previously been applied for characterizing the changes of Microcystis aeruginosa toxic and non-toxic strains. The aim of this study is to apply UV absorbance and fluorescence indices as indicators reflecting the change of DOM in water at various stages of cyanobacterial blooms under different nutrient conditions.
In this study, we simulate algae blooms in the Microcystis aeruginosa toxic strain Freshwater Algae Culture of Hydrobiology Collection (FACHB)-905 and non-toxic strain FACHB-469 [22]. Ultraviolet absorption spectroscopy and three-dimensional fluorescence spectroscopy are combined with specific growth rates, in order to analyze the characteristic indices in the outbreak of Microcystis aeruginosa under different nutrient conditions, which provides a basis for studying cyanobacterial blooms in lakes and reservoirs. Our experimental water was taken from the Wujiayuan Reservoir in Wenzhou City (Zhejiang, China), which had blooms under low nutritional conditions in 2014. Due to algal bloom pollution, the water supply had to be stopped, affecting the normal life of residents of the area. Therefore, we used water from the Wujiayuan Reservoir as our experimental water, in order to study the indicators of cyanobacteria blooms under low nutritional conditions.

2. Materials and Methods

2.1. Algae Strains

Microcystis aeruginosa FACHB-905 and Microcystis aeruginosa FACHB-469 used in this study were purchased from the Freshwater Algae Culture of Hydrobiology Collection (FACHB-collection) at the Institute of Hydrobiology, Chinese Academy of Sciences (Wuhan, China). FACHB-905 was isolated from Dian Lake of Kunming during the summer of 1998, which produces microcystin-LR at a rate of about 0.61 mg per 107 viable cells [23]. Microcystis aeruginosa FACHB-469 originated from France and is a non-toxic strain (data provided by the Institute of Hydrobiology, Chinese Academy of Sciences, Wuhan, China).

2.2. Experimental Reagents and Instruments

All reagents used in the experiments were analytical pure grade. CaCl2·2H2O, Citric acid, and Na2CO3 were purchased from Zhejiang Zhongxing Chemical Reagent Co., Ltd. (Lanxi, China). NaNO3 and EDTANa2 were obtained from Sinopharm Chemical Reagent Co., Ltd. (Shanghai, China). K2HPO4 was obtained from Shantou Jinsha Chemical Factory (Shantou, China). MgSO4·7H2O was purchased from Wuxi Minfeng Reagents Factory (Wuxi, China). Ferric ammonium citrate was purchased from Shanghai Zhan Yun Chemical Co., Ltd. (Shanghai, China). The above reagents and 1000× trace elements were used to prepare the BG11 culture solution.
All the glassware was sterilized in a vertical pressure steam sterilizer (LDZX75-KBS, Shanghai Shenan Medical Equipment Factory, Shanghai, China) and dried in a drying oven. During the process of culturing, a light incubator was necessary. An electronic balance (BSA124S, Sedorius Scientific Instruments Co., Ltd., Beijing, China), a three-dimensional fluorescence spectrometer (F-4600, Hitachi, Tokyo, Japan), and an ultraviolet spectrophotometer (TU1810PC, Beijing General Instruments Co., Ltd., Beijing, China) were also necessary. Chlorophyll-a content was determined by a phytoplankton fluorescent apparatus (PHYTO-PAM, Heinz Walz GmbH, Bavaria, Germany).

2.3. Pretreatment

Experimental water was collected from Wujiayuan Reservoir, filtered to remove large particles of impurities, plankton, and algae in water samples immediately with a 0.45 μm microporous membrane, and returned to the laboratory. The experimental water and BG11 culture medium were prepared in different proportions, including BG11, 1/5 BG11, 1/10 BG11, 1/50 BG11, and 1/100 BG11. The reservoir water was used as the main component of the experimental water, and BG11 was added as the source of nutrition to prepare the experimental water with different nutrient concentrations. The algae solution for test purposes was prepared with the Microcystis aeruginosa toxic FACHB-905 and non-toxic FACHB-469 strains in the logarithmic growth period (algae density 106 cell/mL) of laboratory pure culture. The prepared virulent strains of Microcystis aeruginosa FACHB-905 and FACHB-469 were inoculated into the media with different nutrient conditions.

2.4. Experimental Method

2.4.1. Culture Conditions

In this study, two sets of parallel micro-universe models were used to simulate lake water bloom under eutrophication. The culture device was a transparent glass jar with dimensions 50 × 50 × 45 cm (length × width × height) and a thickness of 1 cm. The simulated eutrophic water mainly used the BG11 medium as a reference, which is suitable for the growth of Microcystis aeruginosa. The simulation experiment of the Microcystis aeruginosa bloom process was carried out in a rooftop sunroom. Although the daily climate changed and environmental conditions were different, the temperature, light intensity, wind speed, and weather were basically the same for each experimental jar in the sunroom. The nutrient ratios in the culture medium for bloom simulation of Microcystis aeruginosa and simulated culture device were the same as in our previous study [24]. A total of 330 temperature data were detected, with an average of 32.0 °C and a temperature range of 26.6–36.8 °C. And the light intensity ranges from 1300–60,500 Lux, with an average of 20,044 Lux.

2.4.2. Determination of the UV Spectra of Water Samples during Microcystis Aeruginosa Blooms

The samples were filtered with a 0.45 μm water filter and their UV spectra were scanned. The ultraviolet scanning wavelength was set to 200–800 nm, a micro quartz colorimetric dish with a 1 mm slit was used, and ultrapure water was scanned for blank samples before each sample was scanned. Then, according to the definition of the indices, we calculated the absorbance ratios (E2/E3, E2/E4, and E4/E6), slopes (S275–295 and S350–400), and area ratios (A2/A1, A3/A1, and A3/A2) of the ultraviolet spectrum.

2.4.3. Determination of Three-Dimensional Fluorescence Spectra of Water Samples during Microcystis Aeruginosa Blooms

The water samples were filtered with a 0.45 μm water phase filter and three-dimensional fluorescence scanning was carried out. The parameters of the three-dimensional fluorescence spectrum were set with a xenon lamp as the excitation source, the excitation wavelength was 200–500 nm, the emission wavelength was 250–600 nm, the firing and launching slits were set to 5 and 2 nm, respectively, and the scanning speed was 12,000 nm/min. The reaction temperature control system adopted was a high-precision water bath control system, and the temperature control was 25 ± 1 °C. Ultrapure water was used as a blank sample.
By calculating the three-dimensional fluorescence characteristics of the algal water body at different stages, the change of water and the difference of fluorescence characteristics between the two kinds of algae during the bloom process can be reflected. The commonly used three-dimensional fluorescence indices include the fluorescence index (FI), the humification index (HIX), the freshness index (β:α), and the fluorescence fingerprint characteristic index (B/A). Due to the absence of terrestrial organic pollutants in the culture conditions, we mainly investigated the changes in the HIX and β:α in the process of water blooms.
The calculation of different fluorescence indices was carried out as follows: For HIX, at the excitation wavelength of 254 nm, the sum of the fluorescence peaks between 435 and 480 nm was divided by the sum of the fluorescence peaks between 300 and 345 nm and the fluorescence peaks between 435 and 480 nm (i.e., λEx = 254 nm; Fmax435~480nm/(Fmax300~345nm+Fmax435~480nm)) [25]. The freshness index was the maximum fluorescence intensity ratio in the 420–435 nm range of fluorescence intensity at the 380 nm emission wavelength and the excitation wavelength of 310 nm (i.e., λEx = 310 nm and F380nm/Fmax420~435nm) [26].

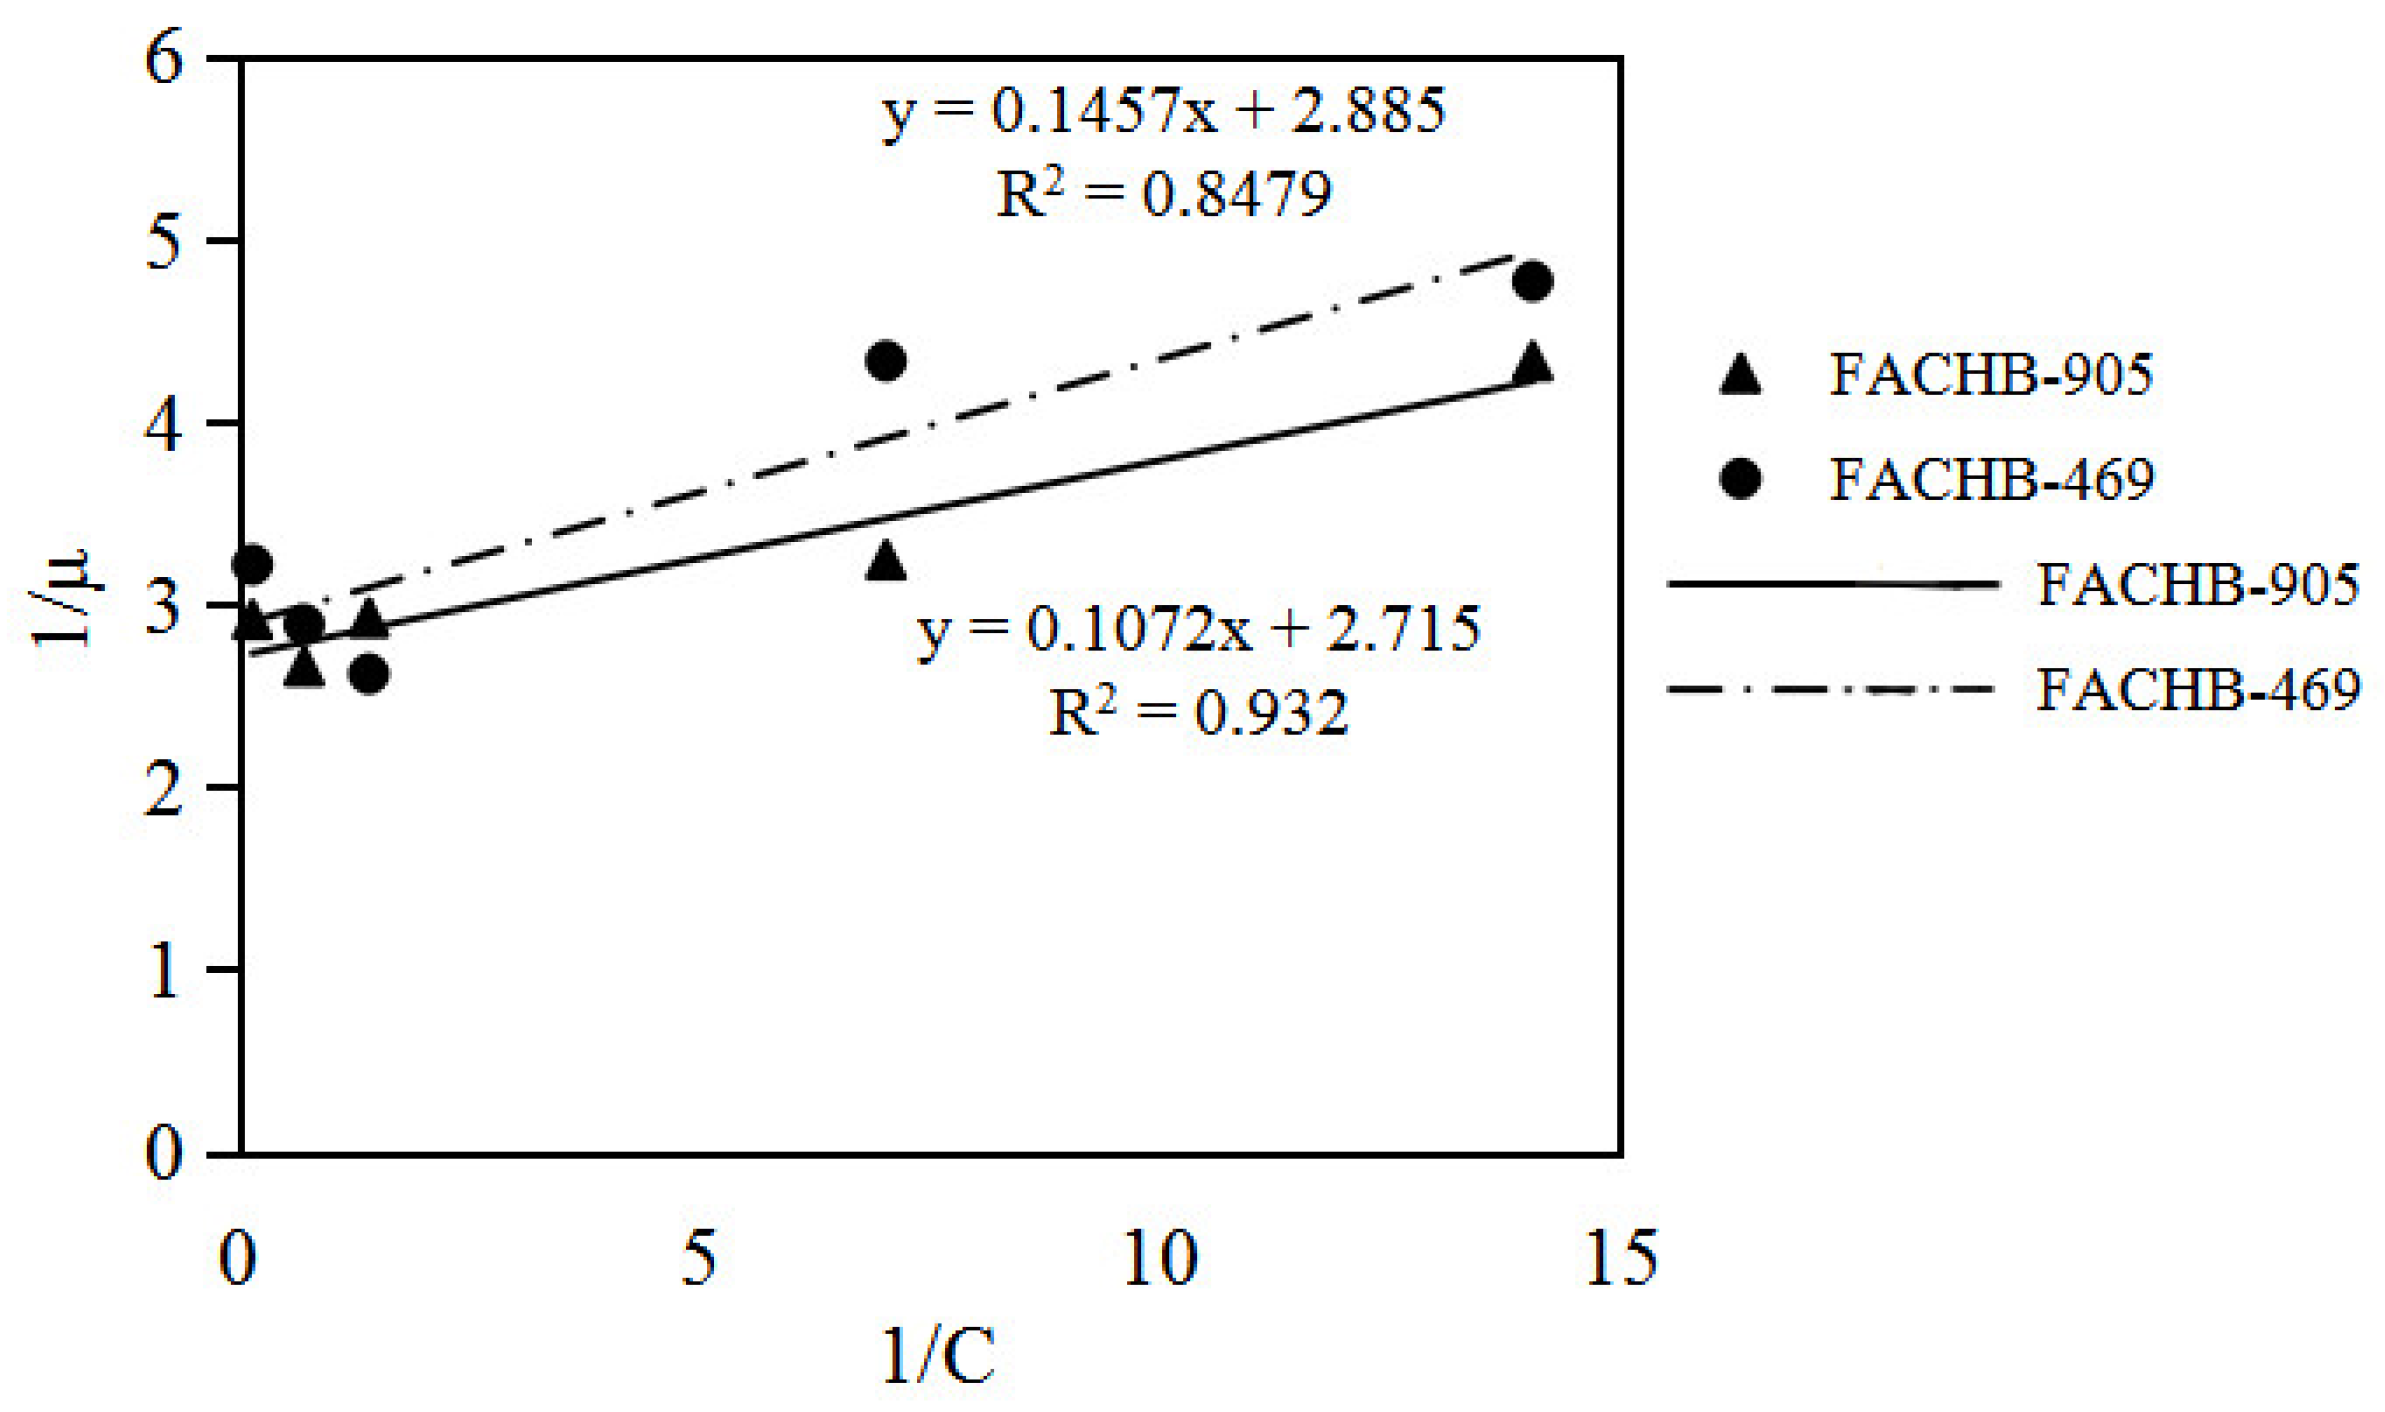
2.4.4. Calculation of Specific Growth Rate of Microcystis aeruginosa

For the specific growth rate (μ) of Microcystis aeruginosa FACHB-905 and FACHB-469 strains under different nutrient conditions, according to the concentration variation of chlorophyll-a, the formula for the growth rate is:
μ = ln x 1 ln x 2 t 2 t 1 ,
where μ(d−1) is the growth rate of Microcystis aeruginosa during the logarithmic growth period and x1 and x2 are the chlorophyll-a concentrations at times t1 and t2 [27,28].
The relationship between the growth rate of Microcystis aeruginosa and the concentration of nutrients in the medium is described using the Monod equation [29,30]. The specific formula is as follows:
1 μ = K S μ max × C + 1 μ max ,
where:
  • μ—specific growth rate of the micro-organism [d−1];
  • μmax—the maximum specific growth rate that can theoretically be achieved by the micro-organism when the concentration of the substrate is limited [d−1];
  • C—the concentration of substrate mass in a solution that restricts the proliferation of microbes [mg/L]; and
  • KS—the half-saturation constant [mg/L], whose value is the mass concentration of a substrate at μ = μ/2.
The μmax and KS values can be obtained by using the least squares method for 1/μ and 1/C.

3. Results and Discussion

3.1. Changes of Ultraviolet Indices in the Process of Algal Blooms

Ultraviolet–visible absorption spectroscopy is one of the earliest analytical methods used to characterize the spectral properties of organic matter [31,32]. It usually includes analysis of the absorbance ratios (E2/E3, E2/E4, and E4/E6), slopes (S275–295 and S350–400), and area ratios (A2/A1, A3/A1, and A3/A2) of the ultraviolet spectrum, and so on. The UV spectral characteristics of Microcystis aeruginosa FACHB-905 and FACHB-469 strains at different growth stages are shown in Table 1. According to the growth and sensory characteristics during the outbreak of Microcystis aeruginosa blooms, the first 8 days of the simulated culture comprised the lag phase, the next 11 days were the exponential growth phase, and then they entered the stationary/relapsing phase after a 7-day decay phase.

3.1.1. E2/E3

This is the ratio of absorbance between 250 and 365 nm, which can characterize the humification degree of organic matter in water and can indicate the source of the organic matter [33]. The study of Minero showed that, when E2/E3 < 3.5, the content of humic acid in organic matter is greater than that of fulvic acid [34] and when E2/E3 > 3.5, the content of fulvic acid in organic matter is greater than that of humic acid. It can be seen, from the table, that the E2/E3 value of the cultured water of Microcystis aeruginosa FACHB-905 and FACHB-469 at different growth stages was far greater than 3.5. This indicates that the content of fulvic acid in water was greater than that of humic acid in the whole cycle of water blooms of Microcystis aeruginosa, which showed a trend of decreasing first and then increasing in the process of the outbreak. As E2/E3 is inversely proportional to the molecular weight of the organic matter [35,36], it can be seen that the molecular weight of DOM in the water gradually increased during the process of water blooms, where the molecular weight in the FACHB-905 culture cylinder was greater than that for FACHB-469.

3.1.2. E2/E4

This is the ratio of absorbance between 240 and 420 nm, which can characterize the condensation degree of organic molecules, which is inversely proportional to the value of E2/E4 [37]. That is, the smaller the E2/E4 value, the greater the degree of condensation of organic molecules. It can be seen, from the table, that the E2/E4 of Microcystis aeruginosa FACHB-905 and FACHB-469 decreased gradually during the outbreak of water blooms, indicating that the condensation of water blooms led to the increase of the degree of condensation of DOM in water, where the condensation of organic matter in FACHB-469 was higher than that for FACHB-905 in the same period.

3.1.3. E4/E6

This is the ratio of absorbance between 465 and 665 nm, which can be used to characterize the degree of polymerization of the carbon skeleton of benzene rings [38]. Studies have shown that the smaller the E4/E6 value, the greater the degree of organic matter polymerization. However, Baes believed that E4/E6 cannot be used solely to reflect the information about the structure and molecular weight of organic matter [39]. Table 1 shows that the E4/E6 value increased during the whole blooms (from lag period to decline stage), indicating that the degree of polymerization of organic matter was decreasing, which opposite to that indicated by E2/E4. This indicates that the E4/E6 value cannot be used to characterize the degree of polymerization of organic matter, but only to characterize the degree of polymerization of the carbon skeleton of benzene rings.

3.1.4. S275–295, S350–400

As the ultraviolet spectra of organic matter changed obviously in the two wavelength intervals of 275–295 nm and 350–400 nm, Carder and Stedmon converted the absorbance of the ultraviolet spectrum into their natural logarithm in these intervals and calculated the slopes of the straight lines fit between 275 and 295 nm and 350 and 400 nm, which can be used to characterize the ratio of fulvic acid to humic acid [40,41]. In the process of blooming, the S275–295 and S350–400 of Microcystis aeruginosa FACHB-905 and FACHB-469 were decreasing, indicating that the ratio of fulvic acid to humic acid in the water blooms was decreasing. This indicates that algae bloom outbreaks may lead to a decrease in fulvic acid content in water and an increase in the content of humic acid.

3.1.5. A2/A1, A3/A1, and A3/A2

Albrecht divided the ultraviolet spectrum into three regions; namely, 260–280 nm, 460–480 nm, and 600–700 nm [42]. The areas given by the integral of the corresponding wavelength interval are recorded as A1, A2, and A3, respectively. In addition, Albrecht also defined the ratios of three areas: A2/A1 indicates the initial proportion of lignin and other substances in humification, A3/A1 indicates the relationship between humification substances and non-humification substances, and A3/A2 is used to characterize the aromaticity of organic matter. It can be seen, from the table, that the A2/A1, A3/A1, and A3/A2 values of Microcystis aeruginosa FACHB-905 in the process of blooming decreased, which indicates that the proportion of lignin and other substances in the initial stage of humification gradually decreases, the ratio of humic and non-humic substances decreased, and the aromaticity of DOM in water decreased gradually. The A2/A1 and A3/A1 of Microcystis aeruginosa FACHB-469 first increased and then decreased in the process of blooming, indicating that the proportion of lignin and other substances in the initial stage of humification decreased gradually, while the ratio of humification substances to non-humification substances decreased from the lag period to the logarithmic phase. From logarithmic phase to decaying phase, the proportion of lignin and other substances in the initial stage of humification increased and humic substances increased.
Therefore, a number of indices can be obtained from just one ultraviolet spectroscopic measurement, which not only can indicate the source of organic matter and the degree of humification of organic matter, but also reflect the relationship between humic matter and non-humic substances, characterize the aromaticity of the organic matter, and so on. This method is fast and can provide on-line monitoring and accurate measurement. Compared with chlorophyll-a measurement, the measuring instruments are more common and the measurement cost is lower.

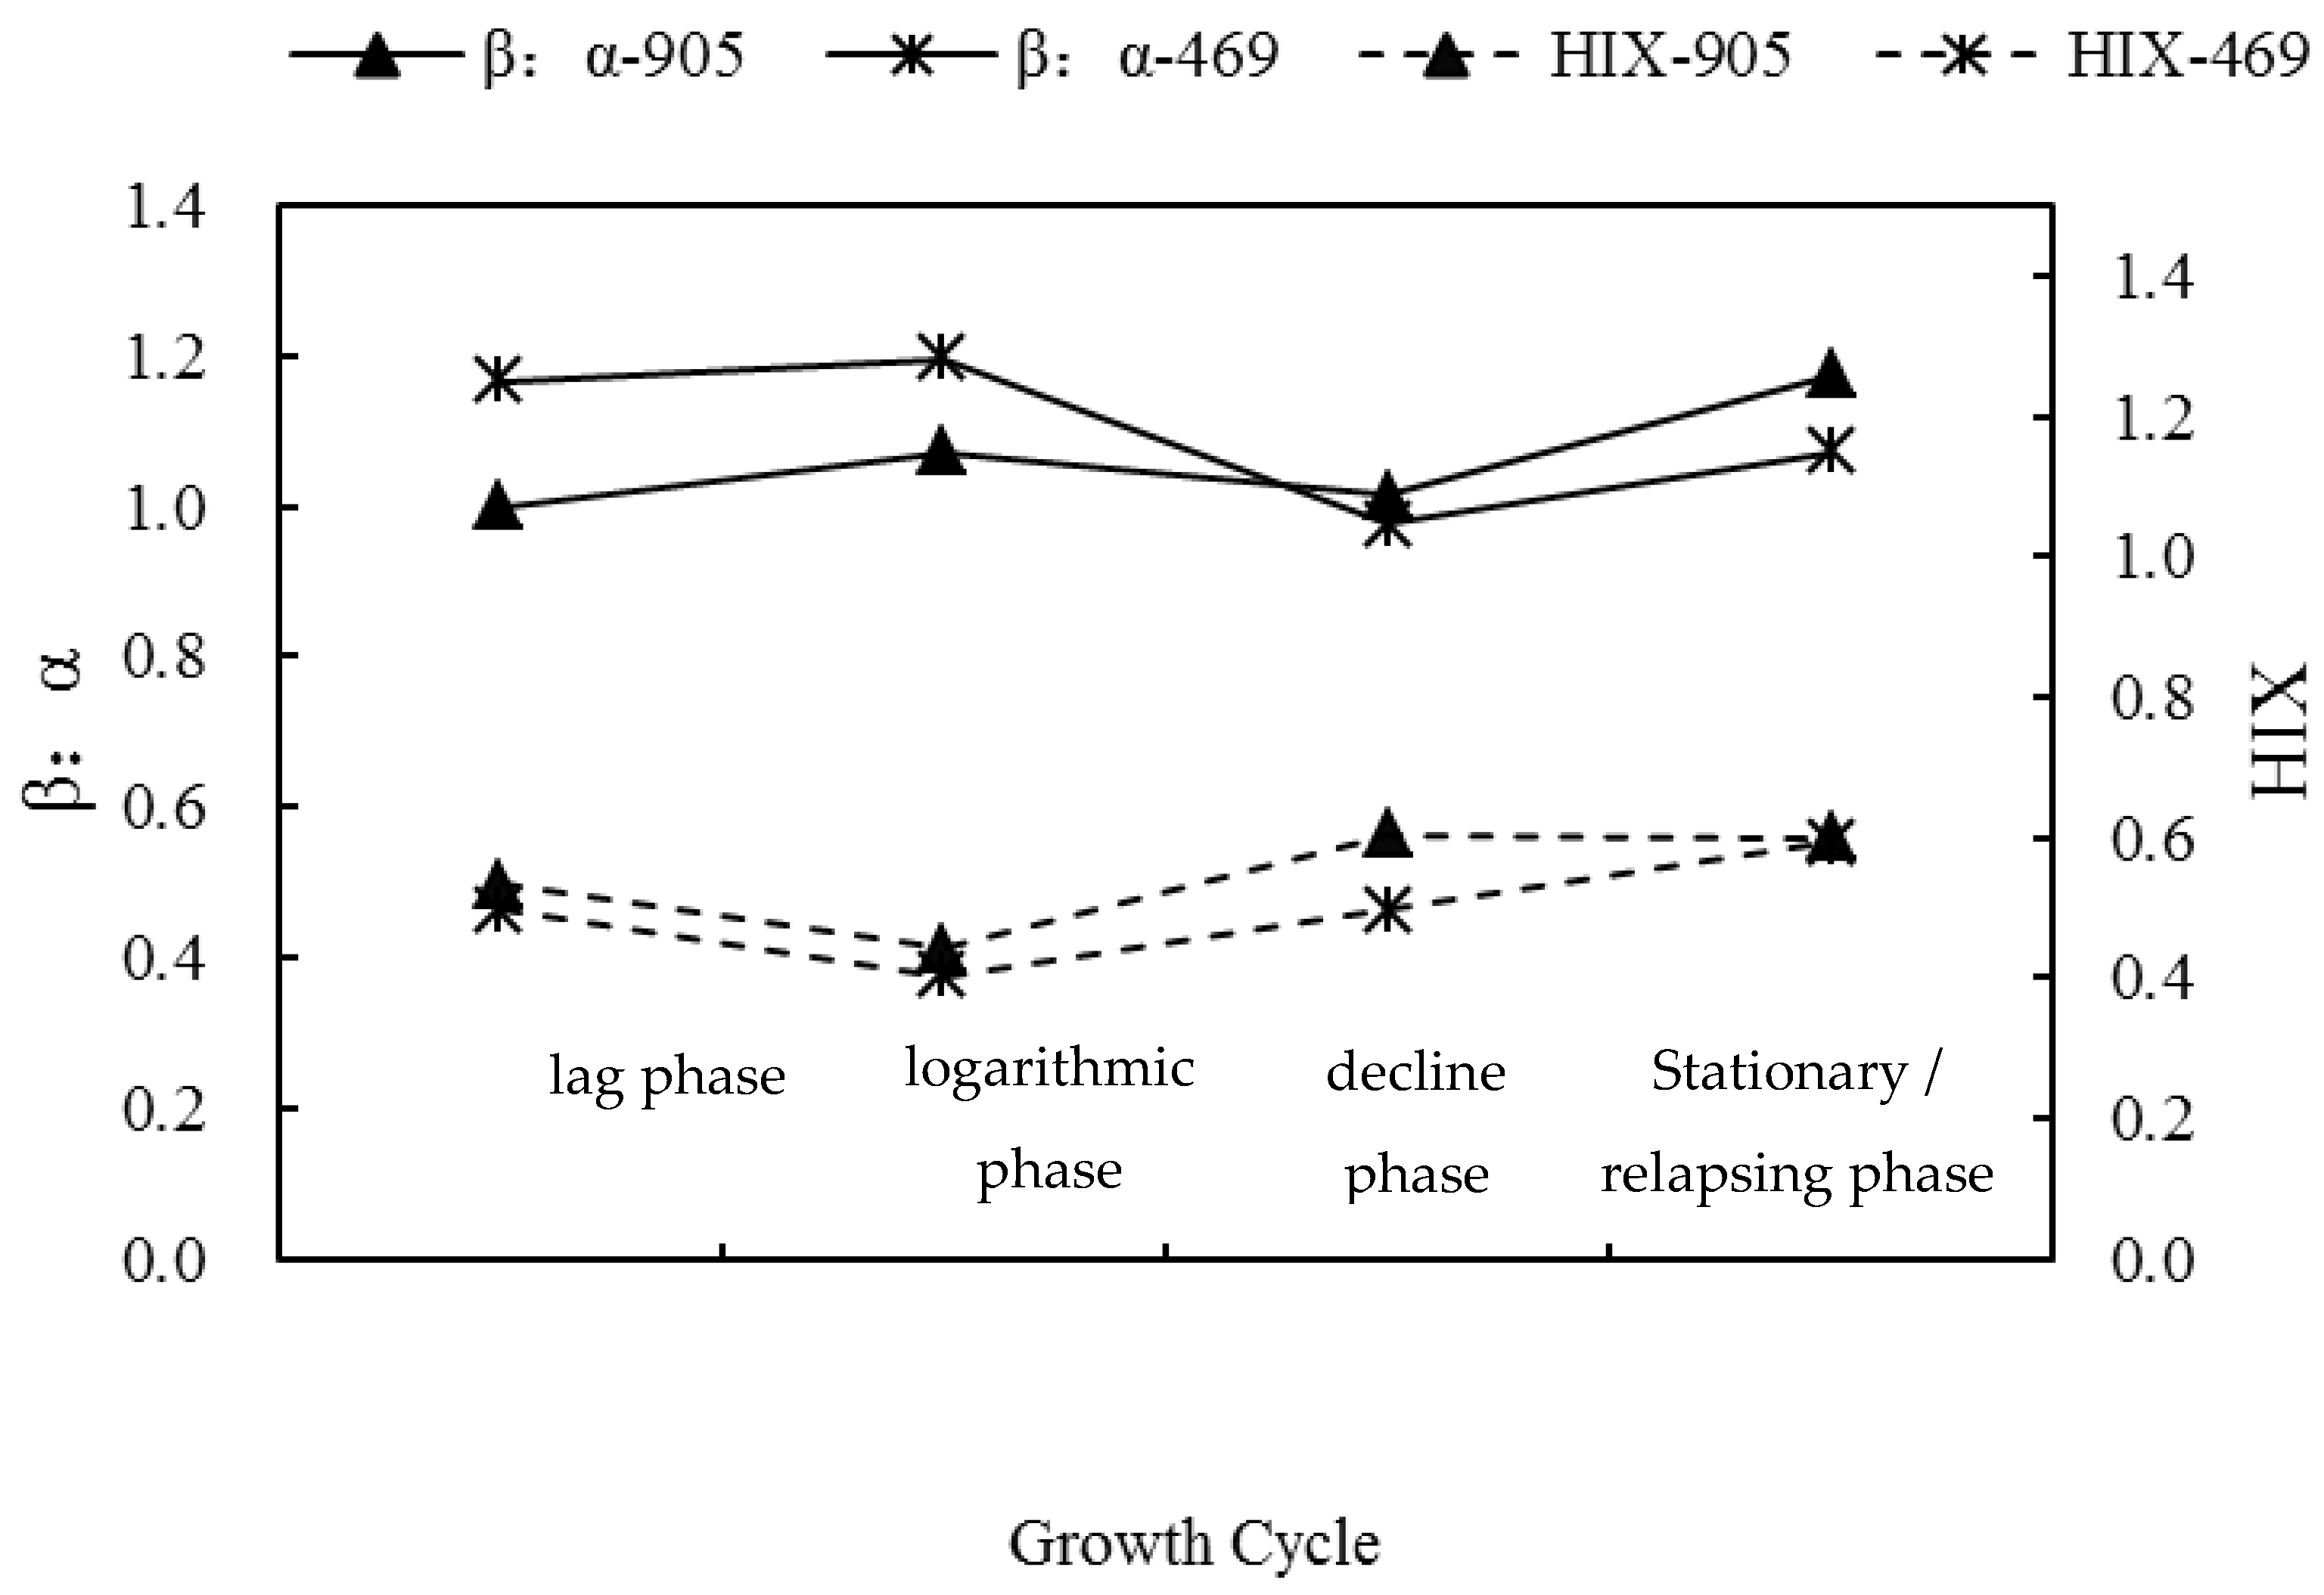
3.2. Changes of Three-Dimensional Fluorescence Indices in the Process of Algal Blooms

As shown in Figure 1, the fluorescence characteristics of Microcystis aeruginosa FACHB-905 and FACHB-469 in different growth stages were basically the same. The freshness indices of Microcystis aeruginosa FACHB-905 and FACHB-469 increased first, then decreased and then increased again from the lag period to the logarithmic phase to the decaying stage and to the stable period. The freshness index represents the proportion of newly produced dissolved organic matter in the total dissolved organic matter, which can measure the contribution of new aquatic organisms [43,44]. The increasing trend of the value of β:α was consistent with the process of outbreak and decay of water blooms, where the last rise may have been caused by the decomposition of organic matter after the death of the algae. The freshness index of FACHB-469 in the delayed and logarithmic phases of Microcystis aeruginosa was higher than that of FACHB-905, indicating that the production rate of dissolved organic matter by FACHB-469 was higher than that of FACHB-905. In the decline period to the stable period (recurrence period), the higher freshness index of FACHB-905 may have been due to its death. The death was more thorough, and more organic matter was released.
HIX can be used to characterize the degree of humification of dissolved organic matter. It can be seen, from the diagram, that the humification degree of Microcystis aeruginosa FACHB-905 and FACHB-469 in the logarithmic growth phase was the lowest, where the trend of first declining and then rising over the whole bloom process was opposite to the trend of the freshness index. The greater the HIX value is, the higher the degree of humification of DOM is and, so, it is more stable in the environment. The HIX of Microcystis aeruginosa FACHB-905 was slightly higher than FACHB-469, which indicates that the DOM produced in the bloom outbreak was more stable. Hence, the algae blooms of Microcystis aeruginosa toxic strain in natural waters may be more difficult to recover from and more harmful than non-toxic Microcystis aeruginosa blooms.
Like ultraviolet spectroscopy, three-dimensional fluorescence spectroscopy can also obtain many indices at once. In addition to the humification index (HIX) and the freshness index (β:α) mentioned above, the excitation–emission matrix (EEM) contours and fluorescence intensity scores can also be obtained [24]. These two spectral analysis methods have high testing rates, can be set up for multi-channel instantaneous multi-point acquisition, and can provide output in real-time. Their analysis speed is fast and, so, they are more suitable for on-site analysis, in order to achieve the purpose of rapid detection.

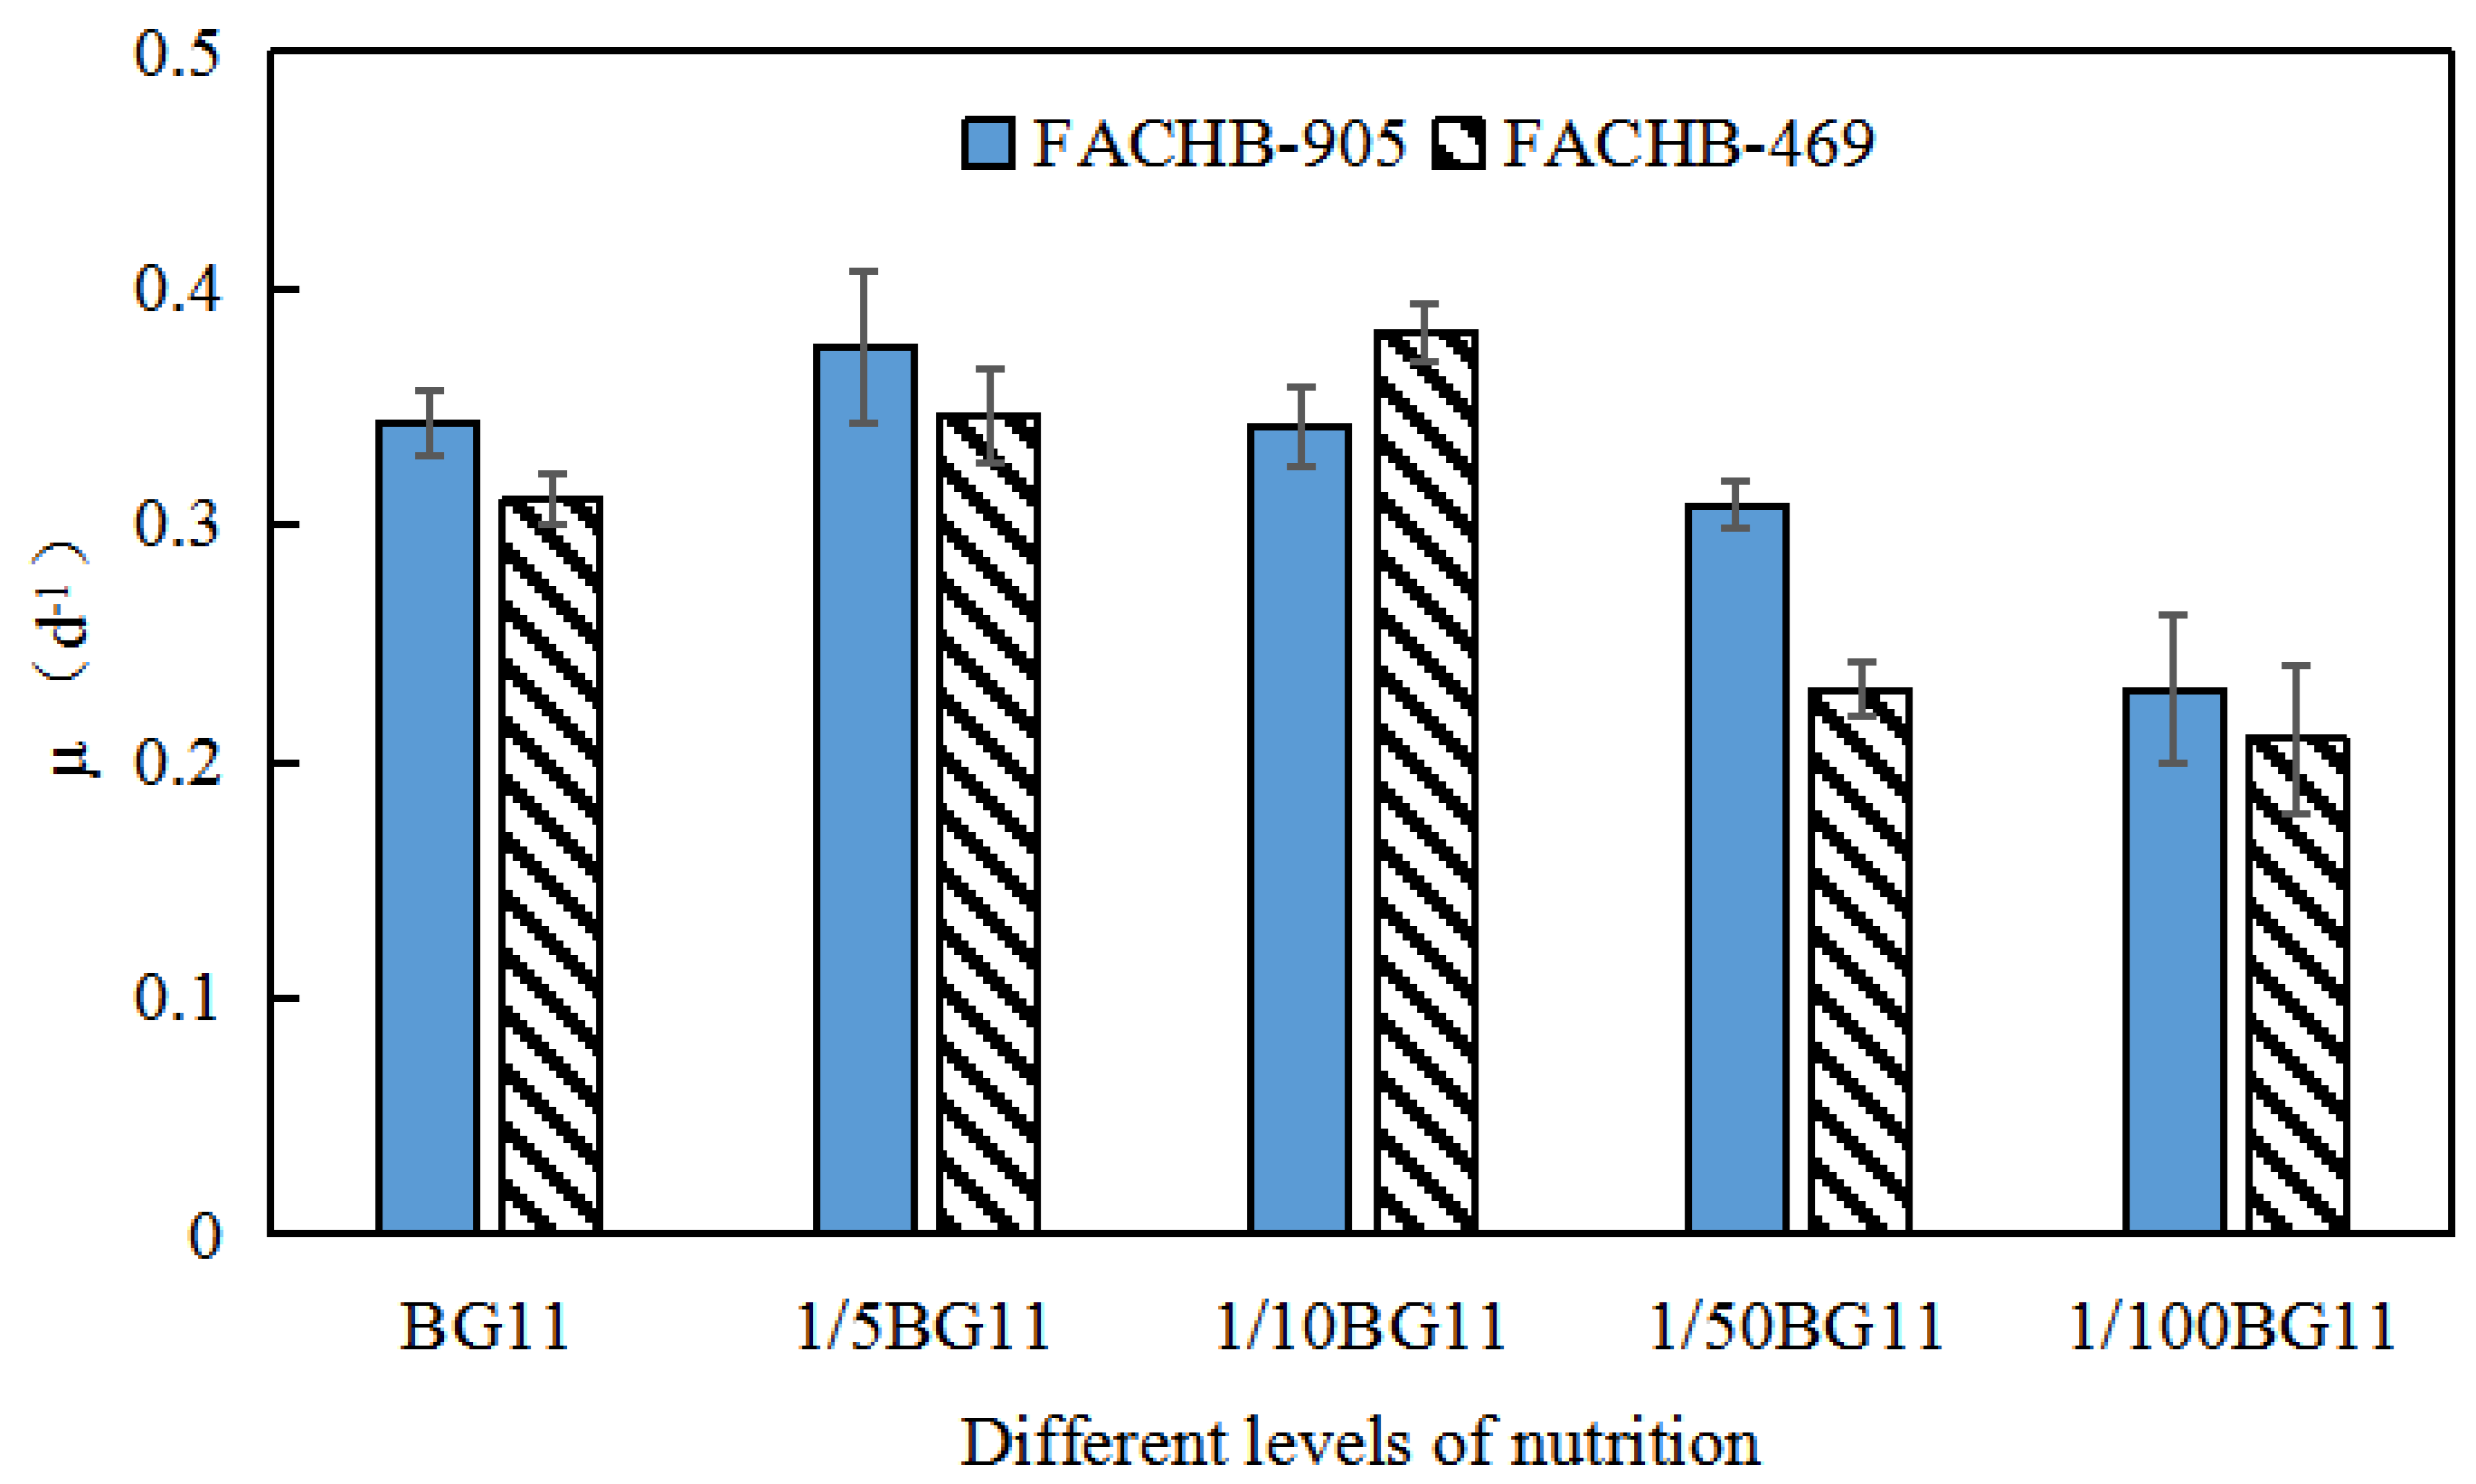
3.3. Specific Growth Rate Analyses of Microcystis Aeruginosa

In order to further understand the abnormal proliferation of FACHB-905 and FACHB-469 strains of Microcystis aeruginosa at different trophic levels during bloom outbreaks, the specific growth rates of both species in logarithmic growth periods under different trophic levels were analyzed, as shown in Figure 2.
According to Figure 2, the specific growth rate of Microcystis aeruginosa FACHB-469 was higher than that of FACHB-905, except under 1/10 BG11 nutrition. At other trophic levels, the specific growth rate of FACHB-905 in logarithmic growth phase was higher than that of FACHB-469. This indicates that Microcystis aeruginosa FACHB-905 was more tolerant of different nutritional levels. The specific growth rates of Microcystis aeruginosa FACHB-905 and FACHB-469 were also different under different trophic levels. According to the logarithmic growth period, the growth rate of Microcystis aeruginosa FACHB-905 was more favorable in the order of 1/5 BG11 > BG11 > 1/10 BG11 > 1/50 BG11 > 1/100 BG11; while that of Microcystis aeruginosa FACHB-469 was 1/10 BG11 > 1/5 BG11 > BG11 > 1/50 BG11 > 1/100 BG11.
In the study of the relationship between the growth rate of the FACHB-905 and FACHB-469 strains of Microcystis aeruginosa and the concentration of nutrients in the medium, the Monod equation can be used [27]. Linear regression of the experimental results (1/C and 1/μ) was performed using Equation (2), and the nutrient kinetic regression equations of FACHB-905 and FACHB-469 of Microcystis aeruginosa were obtained, respectively, as: 1/μ = 0.1072/C + 2.715, R2 = 0.932; 1/μ = 0.1457/C + 2.885, and R2 = 0.8479. The reciprocal of the intercept is the maximum growth rate of Microcystis aeruginosa FACHB-905 and FACHB-469 under phosphorus saturation (μmax,P). The maximum growth rate of FACHB-905 was 0.368/d, while the maximum growth rate of FACHB-469 was 0.347/d. The product with the slope is the phosphorus half-saturation constant (KS,P) of Microcystis aeruginosa growth which, for the toxin-producing FACHB-905, was 0.039 mg/L; while the phosphorus half-saturation constant for the non-toxic FACHB-469 was 0.051 mg/L.
KS,P represents the affinity of Microcystis aeruginosa to phosphorus. For different species that use certain resources (only phosphorus is considered here), the smaller the KS,P value is, the lower the requirement of the species for this resource. In this resource environment, Microcystis aeruginosa, which has a low KS,P value, can usually become a dominant species under inter-species competition. The μmax,P value refers to the innate rate of increase of Microcystis aeruginosa, which is the saturation growth rate when nutrients are not restricted. It can be seen, from Figure 3, that higher phosphorus concentrations accelerate the growth of Microcystis aeruginosa but inhibit its growth when the concentration is too high. Therefore, in this experiment, it can be seen that the requirement for phosphorus nutrition of Microcystis aeruginosa FACHB-905 is lower than that of the non-toxic line FACHB-469, which is more advantageous for inter-species competition, such that it can more easily become the dominant species of the water bloom than the non-toxin producing strain of Microcystis aeruginosa considered in this study.

4. Conclusions

Fluorescence indices, UV absorbance, and kinetic analyses were used to characterize the changes during toxic and non-toxic cyanobacteria blooms under different nutrient conditions. These three methods are suitable for quickly monitoring bloom outbreaks. The content of fulvic acid in the whole outbreak period of Microcystis aeruginosa was higher than that of humic acid. The algal blooms led to an increase in the condensation degree of organic matter in water bodies, where the condensation level of organic matter in FACHB-469 was higher than that of FACHB-905 in the same period. The DOM produced by FACHB-905 could be more stable in the bloom process, and the algal blooms of FACHB-905 might be more difficult to recover from than non-toxic Microcystis aeruginosa blooms. When these two kinds of algae were cultured in the same environment, the toxic strain FACHB-905 had a lower requirement for phosphorus nutrition than the non-toxic strain FACHB-469, making it more dominant in inter-species competition and, thus, in cyanobacteria blooms. Therefore, the harm it may cause is greater.

Author Contributions

Conceptualization, Q.W., C.D., and J.L.; methodology, S.G., J.L., and X.H.; software, C.D.; validation, H.Y., X.H., and M.Z.; formal analysis, Q.W., W.P., and C.D.; data curation, S.G. and X.H.; writing—original draft preparation, S.G. and W.P.; writing—review and editing, W.P., Q.W., and H.Y.; supervision, Q.W.; project administration, M.Z.; funding acquisition, M.Z., H.Y., J.L., W.P., and Q.W. All authors have read and agreed to the published version of the manuscript.

Funding

This research was supported by the National Key Research and Development Program of China (Grant No. 2018YFE0103700), by Zhejiang Provincial Natural Science Foundation of China under Grant No. LQ18C030002, by the National Natural Science Foundation of China (Nos. 31570364 and 61871293), by Science and Technology Program of Cangnan, China (Grant No: 2018ZG29), by Science and Technology Major Program of Wenzhou, China (Grant No: 2018ZG002), by Science and Technology Program of Wenzhou, China (Grant No: S20160003), by the Graduate Scientific Research Foundation of Wenzhou University(Grant No: 39), by the Provincial Department of Education Scientific Research Foundation of Zhejiang, China (Grant No: Y201941030)

Acknowledgments

The authors also greatly appreciate the anonymous reviewers and editors for their careful comments and valuable suggestions to improve the manuscript. And the authors also greatly appreciate the MDPI Author Services for English editing service.

Conflicts of Interest

The authors declare no conflict of interest.

References

  1. O’Neil, J.M.; Davis, T.W.; Burford, M.A.; Gobler, C.J. The rise of harmful cyanobacteria blooms: The potential roles of eutrophication and climate change. Harmful Algae 2012, 14, 313–334. [Google Scholar] [CrossRef]
  2. Lefebvre, K.A.; Quakenbush, L.; Frame, E.; Huntington, K.B.; Sheffield, G.; Stimmelmayr, R.; Bryan, A.; Kendrick, P.; Ziel, H.; Goldstein, T.; et al. Prevalence of algal toxins in Alaskan marine mammals foraging in a changing arctic and subarctic environment. Harmful Algae 2016, 55, 13–24. [Google Scholar] [CrossRef] [Green Version]
  3. Paerl, H.W.; Gardner, W.S.; Havens, K.E.; Joyner, A.R.; McCarthy, M.J.; Newell, S.E.; Qin, B.Q.; Scott, J.T. Mitigating cyanobacterial harmful algal blooms in aquatic ecosystems impacted by climate change and anthropogenic nutrients. Harmful Algae 2016, 54, 213–222. [Google Scholar] [CrossRef] [PubMed] [Green Version]
  4. International Joint Commission. A balanced diet for lake erie: Reducing phosphorus loadings and harmful algal blooms. In Proceedings of the Report of the Lake Erie Ecosystem Priority, International Joint Commission, Washington, DC, USA, 27 February 2014. [Google Scholar]
  5. Tang, C.Y.; Sun, B.; Yu, K.F.; Shi, J.T.; Liu, M.M.; Jiang, T.; Huo, Y.Z.; He, P.M. Environmental triggers of a Microcystis (Cyanophyceae) blooms in an artificial lagoon of Hangzhou Bay, China. Mar. Pollut. Bull. 2018, 135, 776–782. [Google Scholar] [CrossRef]
  6. Wang, B.L.; Song, Q.Y.; Long, J.J.; Song, G.F.; Mi, W.J.; Bi, Y.H. Optimization method for Microcystis blooms mitigation by hydrogen peroxide and its stimulative effects on growth of chlorophytes. Chemosphere 2019, 228, 503–512. [Google Scholar] [CrossRef] [PubMed]
  7. Bortoli, S.; Oliveira-Silva, D.; Krüger, T.; Dörr, F.A.; Colepicolo, P.; Volmer, D.A.; Pinto, E. Growth and microcystin production of a Brazilian Microcystis aeruginosa strain (LTPNA 02) under different nutrient conditions. Rev. Bras. Farm. 2014, 24, 389–398. [Google Scholar] [CrossRef] [Green Version]
  8. Wu, Y.L.; Li, L.; Gan, N.Q.; Zheng, L.L.; Ma, H.Y.; Shan, K.; Liu, J.; Xiao, B.D.; Song, L.R. Seasonal dynamics of water blooms-forming Microcystis morphospecies and the associated extracellular microcystin concentrations in large, shallow, eutrophic Dianchi Lake. J. Environ. Sci. 2014, 26, 1921–1929. [Google Scholar] [CrossRef] [PubMed]
  9. Huang, J.C.; Zhang, Y.J.; Huang, Q.; Gao, J.F. When and where to reduce nutrient for controlling harmful algal blooms in large eutrophic lake Chaohu, China? Ecol. Indic. 2018, 89, 808–817. [Google Scholar] [CrossRef]
  10. Zhang, R.; Qi, F.; Liu, C.; Zhang, Y.P.; Wang, Y.T.; Song, Z.L.; Kumirska, J.; Sun, D.Z. Cyanobacteria derived taste and odor characteristics in various lakes in China: Songhua Lake, Chaohu Lake and Taihu Lake. Ecotox. Environ. Safe 2019, 181, 499–507. [Google Scholar] [CrossRef] [PubMed]
  11. Mao, J.; Jiang, D.; Dai, H. Spatial-temporal hydrodynamic and algal blooms modelling analysis of a reservoir tributary embayment. J. Hydro-Environ. Res. 2015, 9, 200–215. [Google Scholar] [CrossRef]
  12. O’Boyle, S.; McDermott, G.; Silke, J.; Cusack, C. Potential impact of an exceptional blooms of Karenia Mikimotoi on dissolved oxygen levels in waters off western Ireland. Harmful Algae 2016, 53, 77–85. [Google Scholar] [CrossRef]
  13. Carmichael, W.W.; Boyer, G.L. Health impacts from cyanobacteria harmful algae blooms: Implications for the North American Great Lakes. Harmful Algae 2016, 54, 194–212. [Google Scholar] [CrossRef] [PubMed]
  14. Wolf, D.; Georgic, W.; Klaiber, H.A. Reeling in the damages: Harmful algal blooms’ impact on Lake Erie’s recreational fishing industry. J. Environ. Manag. 2017, 199, 148–157. [Google Scholar] [CrossRef] [PubMed] [Green Version]
  15. Huang, J.C.; Zhang, Y.J.; Arhonditsis, G.B.; Gao, J.F.; Chen, Q.W.; Wu, N.C.; Dong, F.F.; Shi, W.Q. How successful are the restoration efforts of China’s lakes and reservoirs? Environ. Int. 2019, 123, 96–103. [Google Scholar] [CrossRef] [PubMed]
  16. Kulkarni, H.; Mladenov, N.; Datta, S. Effects of acidification on the optical properties of dissolved organic matter from high and low arsenic groundwater and surface water. Sci. Total Environ. 2018, 653, 1326–1332. [Google Scholar] [CrossRef]
  17. Helms, J.R.; Stubbins, A.; Ritchie, J.D.; Minor, E.C.; Kieber, D.J.; Mopper, K. Absorption spectral slopes and slope ratios as indicators of molecular weight, source, and photobleaching of chromophoric dissolved organic matter. Limnol. Oceanogr. 2008, 53, 955–969. [Google Scholar] [CrossRef] [Green Version]
  18. Zhang, H.W.; Zhang, F.; Song, J. Analysis of Hydrochemical Characteristics and Three-Dimensional Fluorescence Spectra in the Semi-Arid Ebinur Lake Watershed, Xinjiang, China. Water 2018, 10, 426. [Google Scholar] [CrossRef] [Green Version]
  19. Baker, A.; Inverarity, R.; Charlton, M.; Richmond, S. Detecting river pollution using fluorescence spectrophotometry: Case studies from the Ouseburn, NE England. Environ. Pollut. 2003, 124, 57–70. [Google Scholar] [CrossRef]
  20. Goldman, J.H.; Rounds, S.A.; Needoba, J.A. Applications of Fluorescence Spectroscopy for Predicting Percent Wastewater in an Urban Stream. Environ. Sci. Technol. 2012, 46, 4374–4381. [Google Scholar] [CrossRef]
  21. Yu, H.; Song, Y.; Tu, X.; Du, E.; Liu, R.; Peng, J. Assessing removal efficiency of dissolved organic matter in wastewater treatment using fluorescence excitation emission matrices with parallel factor analysis and second derivative synchronous fluorescence. Bioresour. Technol. 2013, 144, 595–601. [Google Scholar] [CrossRef]
  22. Qu, J.Q.; Shen, L.P.; Zhao, M.; Li, W.T.; Jia, C.X.; Zhu, H.; Zhang, Q.J. Determination of the Role of Microcystis aeruginosa in Toxin Generation Based on Phosphoproteomic Profiles. Toxins 2018, 10, 304. [Google Scholar] [CrossRef] [PubMed] [Green Version]
  23. Ma, Z.; Fang, T.; Thring, R.W.; Li, Y.; Yu, H.; Zhou, Q.; Zhao, M. Toxic and non-toxic strains of Microcystis aeruginosa induce temperature dependent allelopathy toward growth and photosynthesis of Chlorella vulgaris. Harmful Algae 2015, 48, 21–29. [Google Scholar] [CrossRef] [PubMed]
  24. Wang, Q.; Pang, W.J.; Mao, Y.D.; Ge, S.J.; Yu, H.G.; Dai, C.J.; Zhao, M. Changes of Extracellular Polymeric Substance (EPS) during Microcystis aeruginosa blooms at Different Levels of Nutrients in a Eutrophic Microcosmic Simulation Device. Pol. J. Environ. Stud. 2020, 29, 349–360. [Google Scholar] [CrossRef]
  25. Derrien, M.; Yang, L.; Hur, J. Lipid biomarkers and spectroscopic indices for identifying organic matter sources in aquatic environments: A review. Water Res. 2017, 112, 58–71. [Google Scholar] [CrossRef] [PubMed]
  26. Moyo, W.; Chaukura, N.; Msagati, T.A.M.; Mamba, B.B.; Heijman, S.G.J.; Nkambule, T.T.I. The properties and removal efficacies of natural organic matter fractions by South African drinking water treatment plants. J. Environ. Chem. Eng. 2019, 7, 103101. [Google Scholar] [CrossRef]
  27. Zhou, Y.P.; Zhang, X.F.; Li, X.; Jia, P.L.; Dai, R.H. Evaluation of changes in Microcystis aeruginosa growth and microcystin production by urea via transcriptomic surveys. Sci. Total Environ. 2019, 655, 181–187. [Google Scholar] [CrossRef]
  28. Stein, E.J.R.; Stein Janet, R. Handbook of Phycological Methods, Culture Methods and Growth Measurements; Cambridge University Press: Cambridge, UK, 1973. [Google Scholar]
  29. Caperon, J.; Meyer, J. Nitrogen-limited growth of marine phytoplankton-I. Changes in population characteristics with steady-state growth rate. Deep Sea Res. Oceanogr. Abstr. 1972, 19, 601–618. [Google Scholar] [CrossRef]
  30. Caperon, J.; Meyer, J. Nitrogen-limited growth of marine phytoplankton-II. Uptake kinetics and their role in nutrient limited growth of phytoplankton*. Deep Sea Res. Oceanogr. Abstr. 1972, 19, 619–632. [Google Scholar] [CrossRef]
  31. Artinger, R.; Buckau, G.; Geyer, S.; Fritz, P.; Wolf, M.; Kim, J.I. Characterization of groundwater humic substances: Influence of sedimentary organic carbon. Appl. Geochem. 2000, 15, 97–116. [Google Scholar] [CrossRef]
  32. Chin, Y.P.; Aiken, G.; O’Loughlin, E. Molecular weight, polydispersity and spect roscopic properties of aquatic humic substances. Environ. Sci. Technol. 1994, 28, 1853–1858. [Google Scholar] [CrossRef]
  33. Giancoli Barreto, S.R.; Nozaki, J.; Barreto, W.J. Origin of dissolved organic carbon studied by UV-Vis spectroscopy. Acta. Hydroch. Hydrob. 2003, 31, 513–518. [Google Scholar] [CrossRef]
  34. Minero, C.; Lauri, V.; Falletti, G.; Maurino, V.; Pelizzetti, E.; Vione, D. Spectrophotometric characterization of surface lakewater samples: Implications for the quantification of nitrate and the properties of dissolved organic matter. Ann. Di Chem. 2007, 97, 1007–1116. [Google Scholar] [CrossRef]
  35. Peuravuori, J.; Pihlaja, K. Molecular size distribution and spectroscopic properties of aquatic humic substances. Anal. Chim. Acta. 1997, 337, 133–149. [Google Scholar] [CrossRef]
  36. Zhang, X.Q.; Li, Z.W.; Nie, X.D.; Huang, M.; Wang, D.Y.; Xiao, H.B.; Liu, C.; Peng, H.; Jiang, J.Y.; Zeng, G.M. The role of dissolved organic matter in soil organic carbon stability under water erosion. Ecol. Indic. 2019, 102, 724–733. [Google Scholar] [CrossRef]
  37. Strobel, B.W.; Hansen, H.C.B.; Borggaard, O.K.; Andersen, M.K.; Raulund-Rasmussen, K. Composition and reactivity of DOC in forest floor soil solutions in relation to tree species and soil type. Biogeochemistry 2001, 56, 1–26. [Google Scholar] [CrossRef]
  38. Guo, C.X.; Zhang, C.J.; Sun, Z.Y.; Zhao, X.Y.; Zhou, Q.; Hoffmann, M.R. Synergistic impact of humic acid on the photo-reductive decomposition of perfluorooctanoic acid. Chem. Eng. J. 2019, 360, 1101–1110. [Google Scholar] [CrossRef]
  39. Baes, A.U.; Blooms, P.R. Fulvic acid ultraviolet-visible spectra: Influence of solvent and pH. Soil. Sci. Soc. Am. J. 1990, 54, 1248–1254. [Google Scholar] [CrossRef]
  40. Stedmon, C.A.; Markager, S.; Kaas, H. Optical Properties and Signatures of Chromophoric Dissolved Organic Matter (CDOM) in Danish Coastal Waters. Estuar. Coast. Shelf Sci. 2000, 51, 267–278. [Google Scholar] [CrossRef]
  41. Carder, K.L.; Steward, R.G.; Harvey, G.R.; Ortner, P.B. Marine humic and fulvic acids: Their effects on remote sensing of ocean chlorophyll. Limnol. Oceanogr. 1989, 34, 68–81. [Google Scholar] [CrossRef]
  42. Albrecht, R.; Le Petit, J.; Terrom, G.; Périssol, C. Comparison between UV spectroscopy and Nirs to assess humification process during sewage sludge and green wastes co-composting. Bioresour. Technol. 2011, 102, 4495. [Google Scholar] [CrossRef]
  43. Porcal, P.; Kopáček, J. Photochemical degradation of dissolved organic matter reduces the availability of phosphorus for aquatic primary producers. Chemosphere 2018, 193, 1018–1026. [Google Scholar] [CrossRef] [PubMed]
  44. Wilson, H.F.; Xenopoulos, M.A. Effects of agricultural land use on the composition of fluvial dissolved organic matter. Nat. Geosci. 2008, 2, 37–41. [Google Scholar] [CrossRef]
Figure 1. Fluorescence characteristics of FACHB-905 and FACHB-469 at different stages of growth.
Water 12 02305 g001
Figure 2. Changes of μ of FACHB-905 and FACHB-469 under different nutrition levels.
Water 12 02305 g002
Figure 3. Regression curve between 1/μ and 1/C of FACHB-905 and FACHB-469.
Water 12 02305 g003
Table 1. Changes in UV spectral characteristics of Freshwater Algae Culture of Hydrobiology Collection (FACHB)-905 and FACHB-469 in different stages of growth.
Microcystis AeruginosaUV Spectral IndexLag PhaseLogarithmic PhaseDecline PhaseStationary/Relapsing Phase
FACHB-905E2/E315.999 ± 2.2028.478 ± 1.2917.041 ± 1.19210.176 ± 1.17
E2/E4119.343 ± 8.17582.975 ± 9.92747.556 ± 3.64873.339 ± 8.486
E4/E60.9 ± 0.1022.004 ± 0.6262.065 ± 0.5631.555 ± 0.585
S275–2950.025 ± 0.0060.007 ± 0.003−0.004 ± 0.001−0.007 ± 0.001
S350–4000.005 ± 0.002−0.012 ± 0.004−0.014 ± 0.003−0.015 ± 0.003
A2/A10.284 ± 0.0930.124 ± 0.0270.071 ± 0.0310.062 ± 0.027
A3/A11.449 ± 0.1780.477 ± 0.1070.203 ± 0.050.256 ± 0.042
A3/A25.099 ± 0.3072.982 ± 1.0312.538 ± 0.8683.63 ± 1.255
FACHB-469E2/E311.473 ± 1.1596.955 ± 1.9653.972 ± 0.0736.384 ± 1.035
E2/E488.93 ± 5.71549.857 ± 4.82317.997 ± 3.9532.087 ± 4.323
E4/E60.963 ± 0.1491.411 ± 0.3941.897 ± 0.0721.486 ± 0.292
S275–2950.012 ± 0.005−0.002 ± 0.002−0.006 ± 0.001−0.01 ± 0.001
S350–400−0.003 ± 0.001−0.01 ± 0.002−0.011 ±0.002−0.016 ± 0.003
A2/A10.305 ± 0.120.14 ± 0.0290.194 ± 0.0430.074 ± 0.035
A3/A11.567 ± 0.0060.565 ± 0.280.784 ± 0.3680.282 ± 0.072
A3/A25.24 ± 0.1523.685 ± 0.6843.462 ± 1.3823.632 ± 0.663

