Article

Long-Term Effectiveness of Tree Removal to Re-Establish Sagebrush Steppe Vegetation and Associated Spatial Patterns in Surface Conditions and Soil Hydrologic Properties

by
C. Jason Williams
1,*,
Justin C. Johnson
1,2,
Frederick B. Pierson
3,
Cameron S. Burleson
2,
Viktor O. Polyakov
1,
Patrick R. Kormos
4 and
S. Kossi Nouwakpo
5,6
1
Southwest Watershed Research Center, Agricultural Research Service, US Department of Agriculture, Tucson, AZ 85719, USA
2
School of Natural Resources and the Environment, University of Arizona, Tucson, AZ 85721, USA
3
Northwest Watershed Research Center, Agricultural Research Service, US Department of Agriculture, Boise, ID 83702, USA
4
Colorado Basin River Forecast Center, National Oceanic and Atmospheric Administration—National Weather Service, US Department of Commerce, Salt Lake City, UT 84116, USA
5
Northwest Irrigation and Soils Research Laboratory, Agricultural Research Service, US Department of Agriculture, Kimberly, ID 83341, USA
6
Formerly with Department of Natural Resources and Environmental Science, University of Nevada-Reno, Reno, NV 89557, USA
*
Author to whom correspondence should be addressed.
Water 2020, 12(8), 2213; https://doi.org/10.3390/w12082213
Submission received: 15 May 2020 / Revised: 22 July 2020 / Accepted: 23 July 2020 / Published: 6 August 2020
(This article belongs to the Special Issue Ecohydrologic Feedbacks between Vegetation, Soil, and Climate)

Abstract

:
Pinyon (Pinus spp.) and juniper (Juniperus spp.) woodland encroachment into sagebrush (Artemisia spp.) steppe communities throughout western North America has substantially altered the vegetation structure and hydrologic function of one of the most ecologically important rangeland ecosystems in the world. Various pinyon and juniper tree removal practices are employed to re-establish sagebrush steppe vegetation and an associated resource-conserving ecohydrologic function. The effectiveness of these practices is highly variable owing to the vast domain in which woodland encroachment occurs, climate fluctuations, differences in treatment applications, and myriads of pre-treatment conditions and post-treatment land uses. This study evaluated the long-term (13 years post-treatment) effectiveness of prescribed fire and mechanical tree removal to re-establish sagebrush steppe vegetation and associated spatial patterns in ground surface conditions and soil hydrologic properties of two woodland-encroached sites. Specifically, we assessed the effects of tree removal on: (1) vegetation and ground cover at the hillslope scale (990 m2 plots) and (2) associated spatial patterns in point-scale ground surface conditions and soil hydrologic properties along transects extending from tree bases and into the intercanopy areas between trees. Both sites were in mid to late stages of woodland encroachment with extensive bare conditions (~60–80% bare ground) throughout a degraded intercanopy area (~75% of the domain) surrounding tree islands (~25% of domain, subcanopy areas). All treatments effectively removed mature tree cover and increased hillslope vegetation. Enhanced herbaceous cover (4–15-fold increases) in burned areas reduced bare interspace (bare area between plants) by at least 4-fold and improved intercanopy hydraulic conductivity (> than 2-fold) and overall ecohydrologic function. Mechanical treatments retained or increased sagebrush and generally increased the intercanopy herbaceous vegetation. Intercanopy ground surface conditions and soil hydrologic properties in mechanical treatments were generally similar to those in burned areas but were also statistically similar to the same measures in untreated areas in most cases. This suggests that vegetation and ground surface conditions in mechanical treatments are trending toward a significantly improved hydrologic function over time. Treatments had limited impact on soil hydrologic properties within subcanopy areas; however, burning did reduce the soil water repellency strength and the occurrence of strong soil water repellency underneath trees by three- to four-fold. Overall, the treatments over a 13-year period enhanced the vegetation, ground surface conditions, and soil hydrologic properties that promote infiltration and limit runoff generation for intercanopy areas representing ~75% of the area at the sites. However, ecological tradeoffs in treatment alternatives were evident. The variations in woodland responses across sites, treatments, and measurement scales in this long-term study illustrate the complexity in predicting vegetation and hydrologic responses to tree removal on woodland-encroached sagebrush sites and underpin the need and value of multi-scale long-term studies.

1. Introduction

1.1. Woodland Encroachment into Sagebrush Steppe

The sagebrush (Artemisia spp.) steppe vegetation type represents one of the most extensive, ecologically important, and imperiled rangeland ecosystems in the world [1,2,3]. Sagebrush shrublands historically occupied more than 620,000 km2 throughout western North America and currently inhabit less than 60% of that previous range [3,4]. Where intact, sagebrush shrublands provide critical plant and wildlife habitats, cultural resources, forage for wild and domestic ungulates, recreation opportunities, and the retention of water and soil resources [3]. The widespread encroachment of native pinyon (Pinus spp.) and juniper (Juniperus spp.) conifers (woodland encroachment) at upper elevations (moist and cool sites) have transitioned more than 170,000 km2 of sagebrush shrublands to wooded shrublands and pinyon–juniper woodlands [5,6]. Pinyon and juniper encroachment on sagebrush shrublands is attributed to multiple factors including intensive grazing, reduced fire frequencies, climate variability, and atmospheric CO2 enrichment [5,7,8], which is consistent with the drivers of woody plant encroachment on other water-limited lands around the world [9,10,11]. The conversion of sagebrush steppe to a wooded shrubland or woodland commonly results in reduced understory vegetation and forage [12,13,14], loss of critical wildlife habitats [15], and increased bare ground, runoff, and soil erosion [16,17,18,19,20,21]. At warmer and drier elevations, the exotic annual cheatgrass (Bromus tectorum L.) readily invades bare patches on degraded sites and homogenizes the spatial fuel structure [4,22,23,24,25]. Cheatgrass is highly flammable, increases the frequency of wildfire, and readily re-occupies and dominates burned sites [4,24,25,26,27]. The frequent re-burning of cheatgrass-invaded sites thereby promotes a recurring grass–fire cycle that perpetuates cheatgrass dominance [23,25] and potentially increases long-term soil loss associated with repeated burning [28,29,30]. Mid-elevation warm and dry sagebrush sites are susceptible to woodland encroachment and subsequent invasion by fire-prone cheatgrass, with cheatgrass commonly increasing over time with ensuing amplified fire activity [8,31,32,33,34]. The risks of severe wildfire and post-fire cheatgrass dominance are particularly high for mid-elevation woodlands with dense woody fuels and for wooded shrublands with well-connected horizontal and vertical fuel layers [5,8,35].

1.2. Phases of Woodland Encroachment and Associated Effects

The impacts of woodland encroachment on ecological processes in sagebrush steppe vary with the degree of tree dominance [14,36]. Woodland encroachment has been characterized into three successive phases based on the dominant cover type and site resource use [6,12,37,38]. In Phase 1, pinyon and juniper trees are present and increase in cover, but sagebrush shrubs, perennial bunchgrasses, and forbs (sagebrush steppe vegetation) exert the dominant control on site resources (e.g., soil water and nutrients). In Phase 2, pinyon and juniper trees influence resource availability and site-level ecological processes through competition with other vegetation. Sagebrush shrubs and understory vegetation decline in Phase 2 due to the limited soil and water resources. In Phase 3, trees are the dominant overstory vegetation and exert the primary control on site-level ecological processes. Phase 3 typically includes extensive well-connected bare ground in the intercanopy area between trees, limited perennial bunchgrass cover, and a more than 75% mortality of the shrub layer (Figure 1a). Intact sagebrush steppe commonly consists of well-distributed litter-covered sagebrush shrub microsites surrounded by an interspace area with varying amounts of perennial bunchgrasses, annual and perennial forbs, and isolated bare soil patches [39,40,41]. Shrubs in this vegetation structure utilize the deep soil water resources and compete with the herbaceous understory for shallow soil water and nutrients [42,43]. Infiltration rates are typically higher on litter-covered shrub microsites and in the well-vegetated interspaces between shrubs and are commonly low for isolated bare interspaces [40,44,45,46,47,48,49,50]. Runoff and sediment detachment by raindrops and shallow overland flow (splash-sheet erosion) occur in bare patches on sagebrush shrublands, but the overall resource-conserving vegetated structure limits downslope losses of water and sediment [40,48,49,50,51,52]. With woodland encroachment, trees outcompete shrub and herbaceous cover for water and soil nutrients throughout the soil profile [36,53], and, over time, the bare area increases. By late Phase 2, bare patches are well-connected throughout intercanopy areas and concentrated overland flow becomes the dominate runoff and erosion mechanism [16,18,19,20]. Vegetation degradation, amplified bare ground, and accelerated runoff and soil erosion rates, with further transition to late Phase 3, can potentially push a site beyond an irreversible site conservation/restoration threshold through the loss of critical surface soil and near complete removal of sagebrush and bunchgrass cover [19,54,55].

1.3. Tree Removal Practices to Conserve Sagebrush Steppe

Various methods of tree removal are commonly implemented to re-establish the sagebrush steppe vegetation structure on woodland-encroached sites [13,14,34,56,57,58,59,60,61]. The effectiveness of tree removal practices varies widely with site attributes (e.g., soil properties, climate), pre-treatment conditions (e.g., the encroachment phase, cheatgrass presence), treatment type and application, pre- and post-treatment weather trends, and post-treatment land use [13,31,33,58,59,60,62,63,64,65]. Conceptual models based on recent longer-term data suggest a greater likelihood of re-establishing sagebrush steppe vegetation and associated ecological function where tree removal is applied in the early phases of tree encroachment at higher elevation, cooler and wetter sites [6,14,31,32,33,57,66]. Cooler and wetter soil temperature–moisture regimes at higher elevations are more resistant to cheatgrass invasion and favor an enhanced production of desired perennial bunchgrasses [13,31,33,63,66,67,68]. Sites treated early (Phase 1 to early Phase 2) in the woodland encroachment gradient typically have more residual sagebrush and perennial bunchgrasses and an intact seed bank, increasing the likelihood of an enhanced production and recruitment of desired vegetation [14,57,59,62,64]. Phase 3 sites with limited sagebrush and perennial bunchgrass cover and ample bare ground are highly susceptible to cheatgrass invasion after tree removal, particularly at warmer and drier locations [62,63,69]. The re-establishment of sagebrush and perennial bunchgrass cover after tree removal in Phase 3 at higher elevations is often prolonged due to the limited residual cover of these plants, and competition with re-establishing tree cover may hinder long-term results [58,60]. Some of the variability in treatment effectiveness is related to the soil depth. The competition between woody and herbaceous plants is potentially greater on sites with shallow soils, and tree removal on these sites may elicit a rapid response in understory vegetation [12]. The type and timing of treatment can greatly influence tree removal effectiveness. Mechanical treatments (e.g., cutting, mastication, and chaining) effectively remove mature trees and can facilitate increases in the cover of sagebrush and perennial bunchgrasses [13,14,57,58,61,64]. However, these treatments commonly leave numerous tree seedlings that dominate the respective site over time [58,70,71]. Prescribed fire treatments are often more effective at removing mature and young trees but also kill sagebrush [13,14,31,62,71]. Sagebrush does not re-sprout following burning and takes two to four decades or more to re-establish from neighboring seed sources [72,73]. High fire temperatures can kill perennial bunchgrasses and thereby favor cheatgrass invasion post-treatment [62,74]. In general, cheatgrass increasing following tree removal is more common and greater with fire, as opposed to mechanical treatments [13,14,31,34,61]. However, ample cheatgrass after mechanical treatments has also been reported [14,57,64,70]. Burning during the winter season or on snow cover can protect perennial bunchgrasses, but can also be challenging to implement [75,76]. Seeding is commonly incorporated into treatment plans to re-establish desired species, but its success also varies with weather conditions in the year following treatment [57,63,68,69,77].

1.4. Knowledge on the Ecohydrologic Impacts of Woodland Encroachment and Tree Removal

Current knowledge regarding the impacts of woodland encroachment and tree removal on hillslope hydrology and erosion for sagebrush steppe sites is based on point-scale infiltrometer and plot scale (0.5 m2 to more than 10 m2) rainfall simulation, overland flow, and natural runoff field experiments [65]. Woodland encroachment primarily affects hillslope runoff and erosion processes by restructuring the continuity of microsites and associated surface and subsurface conditions that control the spatial patterns in infiltration, runoff generation, and erosion [18,19,20,78]. By mid- to late-Phase 2, the intercanopy area is primarily bare interspace (Figure 1a,e) with low infiltration and high splash-sheet erosion rates [16,17,18,19]. Runoff sources from spatially connected bare interspaces combine to form concentrated overland flow [16,18,19,20,34,78]. This concentrated runoff has a high sediment detachment and transport capacity and efficiently moves splash-sheet and flow-detached sediment downslope through bare intercanopy patches [18,19,20,78,79], contributing to high hillslope erosion rates during rain events [21]. Runoff and erosion rates are generally low from areas underneath trees and shrubs and in vegetated interspaces (Figure 1b–d, respectively) [18,19,34,61,78,80]. Therefore, the degree to which woodland encroachment affects runoff and erosion rates depends on its influence on the spatial connectivity of bare interspace and bare intercanopy area [16,19,20,21,34,65,81]. Tree removal treatments commonly aim to increase intercanopy shrub and vegetated interspace microsites and to reduce bare interspace area below 50–60% [19,78,81]. Where successful, such treatments disrupt the spatial connectivity of runoff and sediment sources from bare interspaces and reduce the delivery of downslope sediment through the intercanopy [16,19,20,21,34,81,82].
Field studies have reported varied effects of tree removal methods on surface hydrology and erosion processes. Short-term studies have demonstrated tree removal by fire can temporarily increase runoff and soil loss from tree microsites through fire removal of litter above naturally occurring water repellent soils [19,20,78,80,81,83]. In unburned conditions, the first order effect of live tree cover on buffering runoff is the interception of rainfall by the tree canopy [65,84]. Beneath live pinyon and juniper canopies, thick litter layers capture and store effective rainfall and runon, delay runoff generation, and allow time for infiltration through the water repellent layer by by-pass and macropore flow [18,19,78,80]. A number of infiltrometer studies on pinyon and juniper woodlands have emphasized the effectiveness of macropores to transfer water through the water repellent layer deeper into the soil profile [85,86,87]. These studies postulate that preferential routing of water along tree stems and fine root hairs through the water repellent layer provides trees with sustained water availability and buffers surface evaporative losses. Fire removal of the protective litter layer above repellent soils reduces surface water retention, increases runoff, and greatly amplifies the detachment and transport of readily available sediment [19,20,34,81,83]. Fire, therefore, temporarily homogenizes hydrologic and erosion vulnerability across bare tree canopy areas and the bare intercanopy [19,28,30]. Over time, fire treatments that effectively recruit and re-establish sagebrush steppe vegetation structure disrupt the spatial connectivity of runoff and erosion processes and limit losses of water and soil resources [81,82]. In contrast to fire treatments, mechanical tree removal generally retains surface cover of hydrologically stable tree and shrub microsites and has varying effects on interspaces. The short-term effectiveness of mechanical treatments depends strongly on the degree to which treatment distributes tree debris into the intercanopy and disrupts the spatial continuity of bare interspace microsites [61,78,83,88]. Longer-term studies (5–13 years) of mechanical treatments have reported mixed impacts, including limited to no reductions in runoff and erosion rates [61] to substantial improvements in hydrologic function and reduced sediment yield [16,21].

1.5. Knowledge Gaps and Research Need

Researchers and practitioners have made great advances in the understanding of woodland encroachment and the ecohydrologic impacts of tree removal. Knowledge gaps remain, however, due in part to the vast domain in which pinyon and juniper encroachment occurs [5,6,65]. Many new conceptual models are available to forecast ecological trajectories and predict treatment outcomes, but the variability in treatment effects across the extensive literature is not trivial [6,31,66]. The ecological forecasting of woodland encroachment trajectories and tree removal outcomes at warm and dry mid-elevations is particularly challenging. Further, much of what is known regarding the effects of tree removal is based on short-term studies (0–5 years post-treatment) and longer-term follow up experiments in some cases have found substantial temporal variability in post-treatment trends [58]. Hydrology and erosion experiments in sagebrush steppe and woodlands are challenging given the numerous controls on hillslope hydrologic function (e.g., vegetation, ground cover, soils, and topographic attributes), the scale-dependence and within-event dynamic connectivity of processes, and the need to understand how processes change over time with plant community transitions [40,41,65]. For example, natural or simulated rainfall experiments provide insight and quantitative data on infiltration and rainfall–runoff relationships at the scale of measurement, but typically do not explicitly separate above ground, near surface, and below ground effects on infiltration and runoff generation. The enhancement of current conceptual and quantitative models of woodland encroachment and the ecohydrologic impacts of tree removal requires additional data sources across wide ranging conditions. In short, the impacts of woodland encroachment and tree removal treatment effectiveness are highly variable and more information is needed across varying site conditions and treatment applications to build both short- and long-term science-based knowledge and improve predictive technologies [6,31,58,65,70].
The goal of this study was to evaluate the long-term effectiveness of pinyon and juniper tree removal practices to re-establish sagebrush steppe vegetation and the associated spatial patterns in ground surface conditions and soil hydrologic properties at two mid-elevation woodland-encroached sagebrush rangelands. The woodlands in this study were the subject of previous experiments by the authors evaluating the ecohydrologic impacts of woodland encroachment on sagebrush rangelands [18] and the short-term (1 to 2 years post-treatment) [20,80,83] and mid-term (9 years post-treatment) [34,61,81,82] impacts of tree removal on the plant community dynamics and vegetation, ground cover, hydrology, and erosion processes over fine (0.5 m2) to coarse (~9–13 m2) spatial scales. The current study expands on findings from these earlier experiments through the quantification of longer-term vegetation, ground cover, and soil hydrologic responses to prescribed fire and mechanical tree removal practices. Both woodlands historically were vegetated with a sagebrush-steppe cover type and received prescribed fire and mechanical (mastication and/or cutting) tree removal treatments in 2006. The specific objectives of this study were to quantify the long-term (13 years) effects of tree removal treatments on: (1) the vegetation and ground cover conditions at the hillslope-scale (990 m2 plots) and (2) associated spatial patterns in point-scale ground surface and subsurface conditions (litter accumulation, ground cover, and soil total organic carbon) and specific soil hydrologic properties (soil water repellency, unsaturated hydraulic conductivity) driven by tree canopy, shrub canopy, and interspace microsite distributions. This research is part of a larger regional study, the Sagebrush Steppe Treatment Evaluation Project (SageSTEP), investigating the ecological impacts of invasive species and woodland encroachment into sagebrush steppe ecosystems and the effects of various sagebrush steppe restoration practices [89,90].

2. Study Area

2.1. Site Descriptions

This study was conducted at two woodland sites in the SageSTEP experimental network (www.sagestep.org) within the Great Basin Region of the United States (Table 1). The Marking Corral site (Figure 2; 39°27′17″ N latitude, 115°06′51″ W longitude) is a single-leaf pinyon—Utah juniper woodland (P. monophylla Torr. and Frém.—J. osteosperma (Torr.) Little.) in the Egan Range, about 27 km northwest of Ely, Nevada, USA. The Onaqui site (Figure 3; 40°12′42″ N latitude, 112°28′24″ W longitude) is a Utah juniper woodland within the Onaqui Mountains about 76 km southwest of Salt Lake City, Utah, USA. Both sites are public lands under the management of the US Department of the Interior, Bureau of Land Management (BLM). The sites were fenced in autumn 2005 to exclude grazing as part of the greater SageSTEP study and remained cattle-free through this study. Both sites average about 300 mm of precipitation annually. The estimated annual precipitation each year of the study period (2006–2019) was near the long-term average, with only 2 to 3 years of more than 15% below normal precipitation [91].
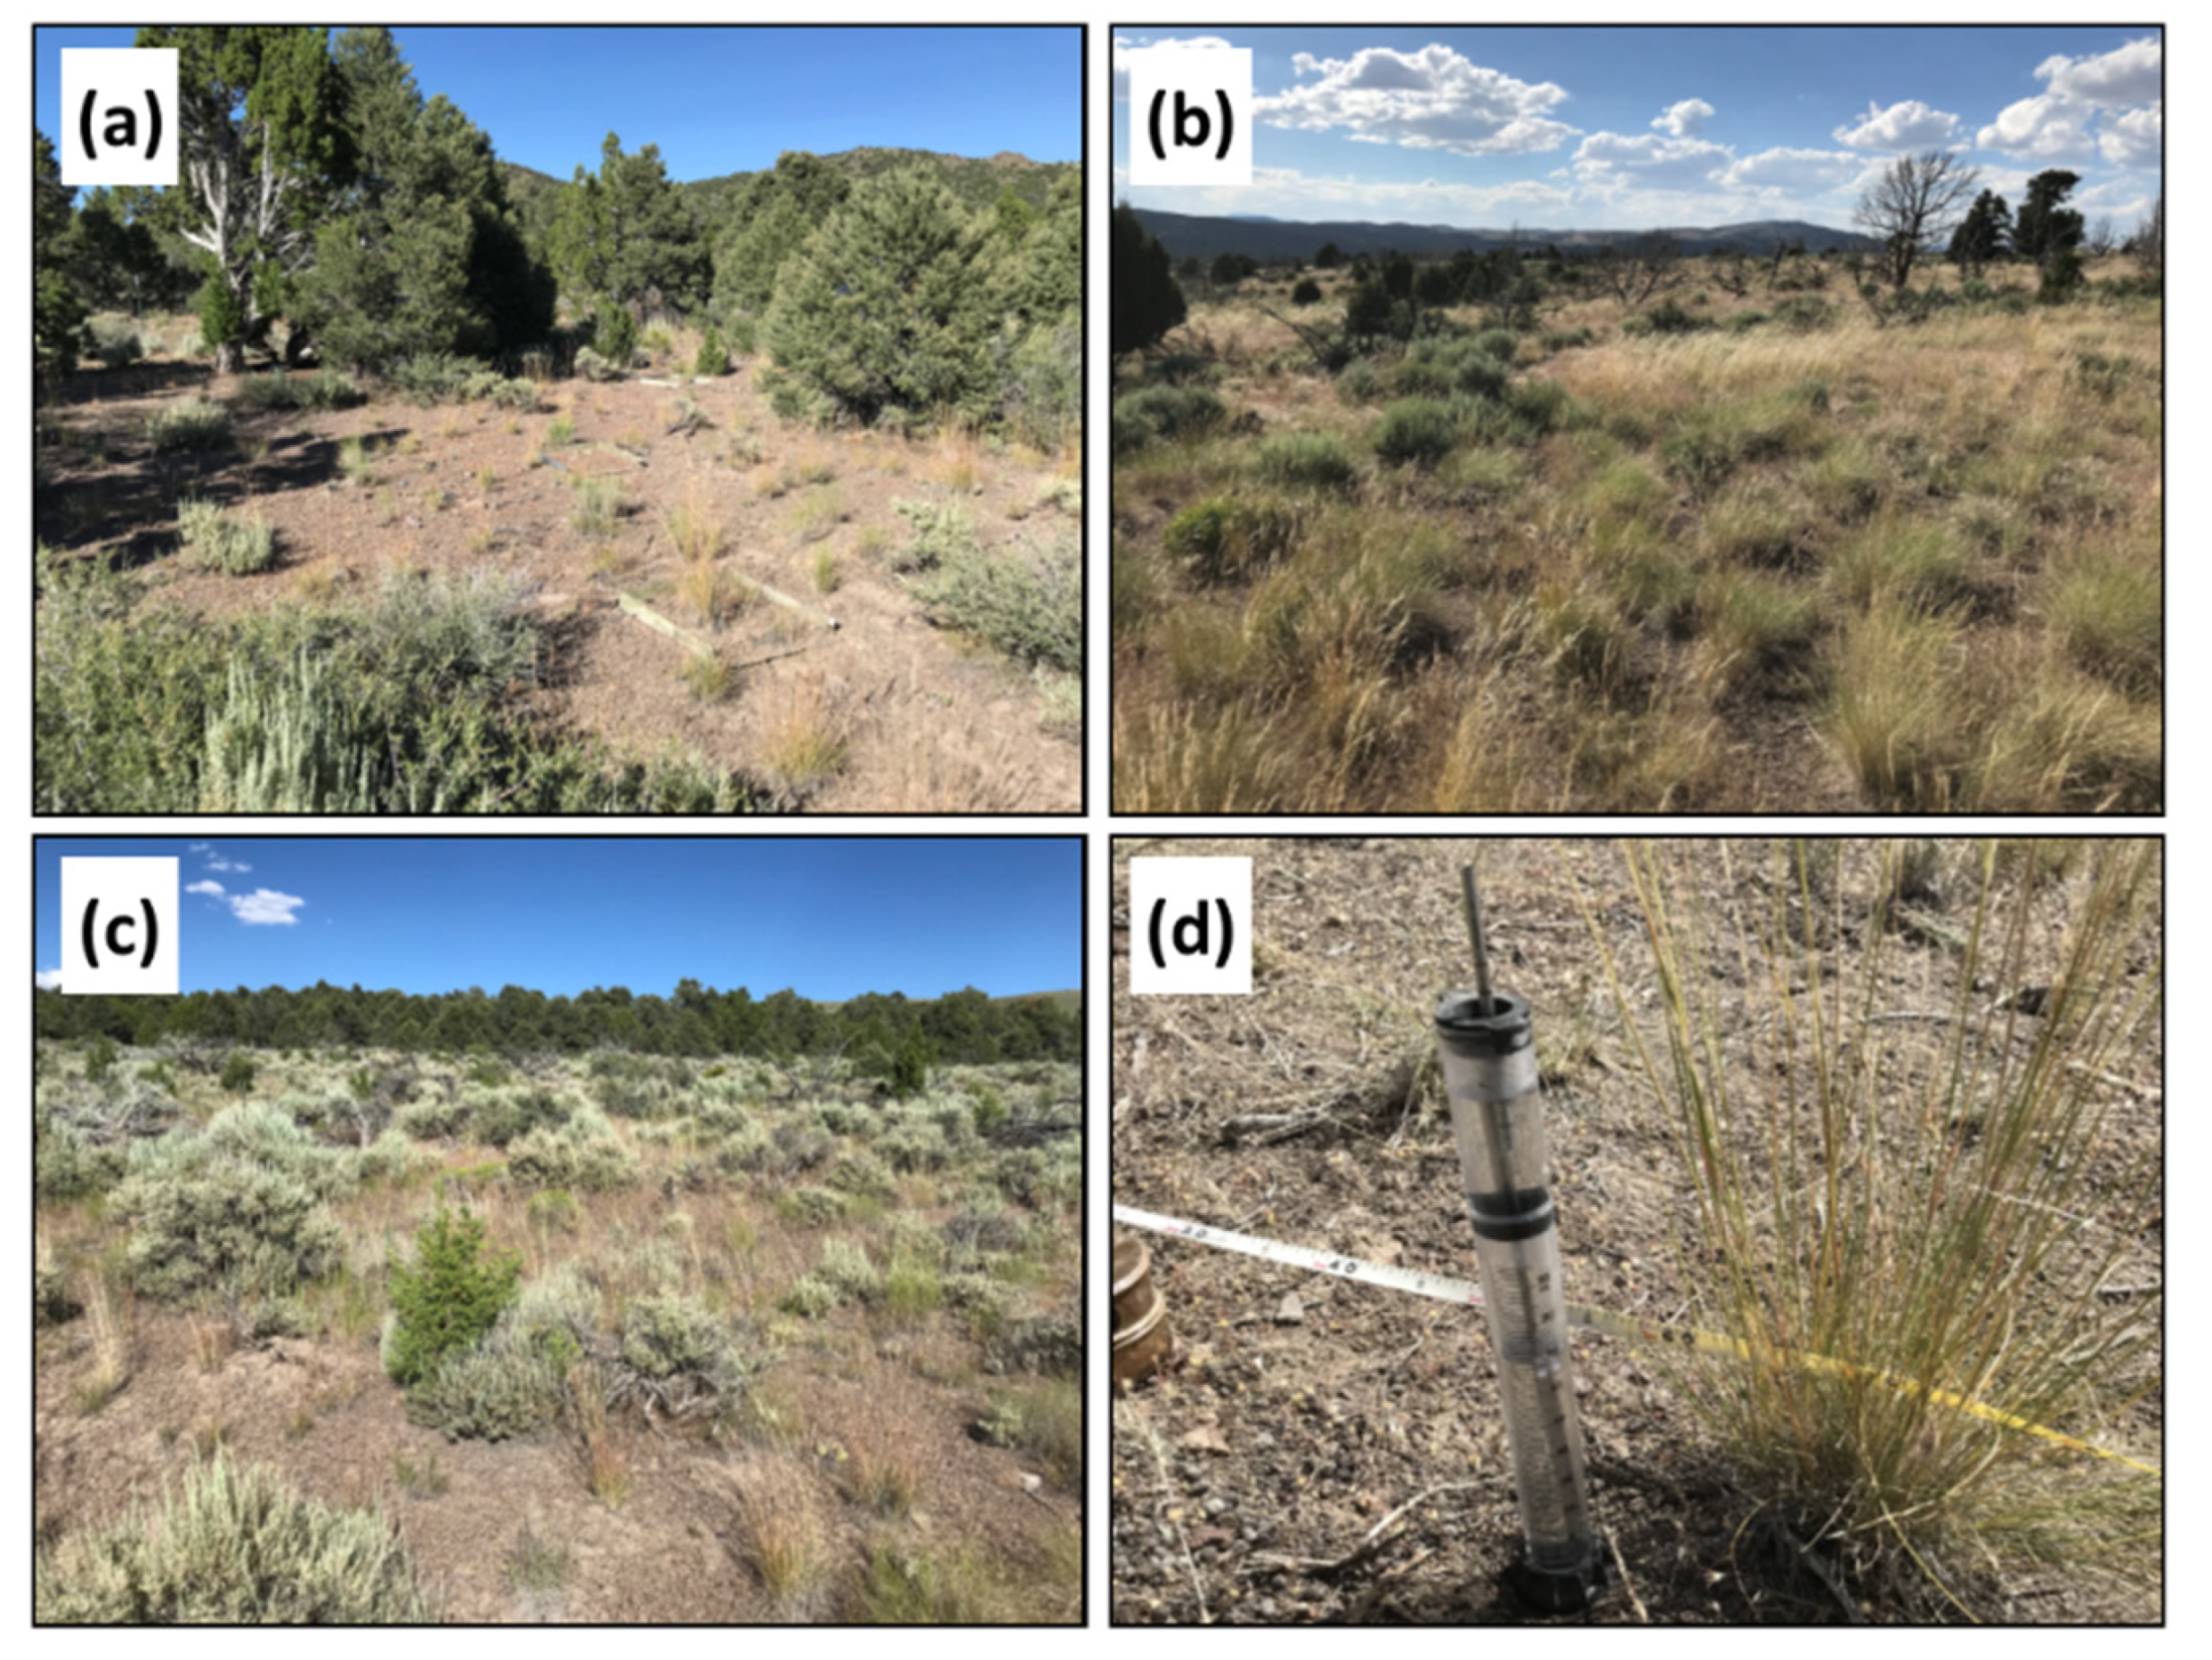
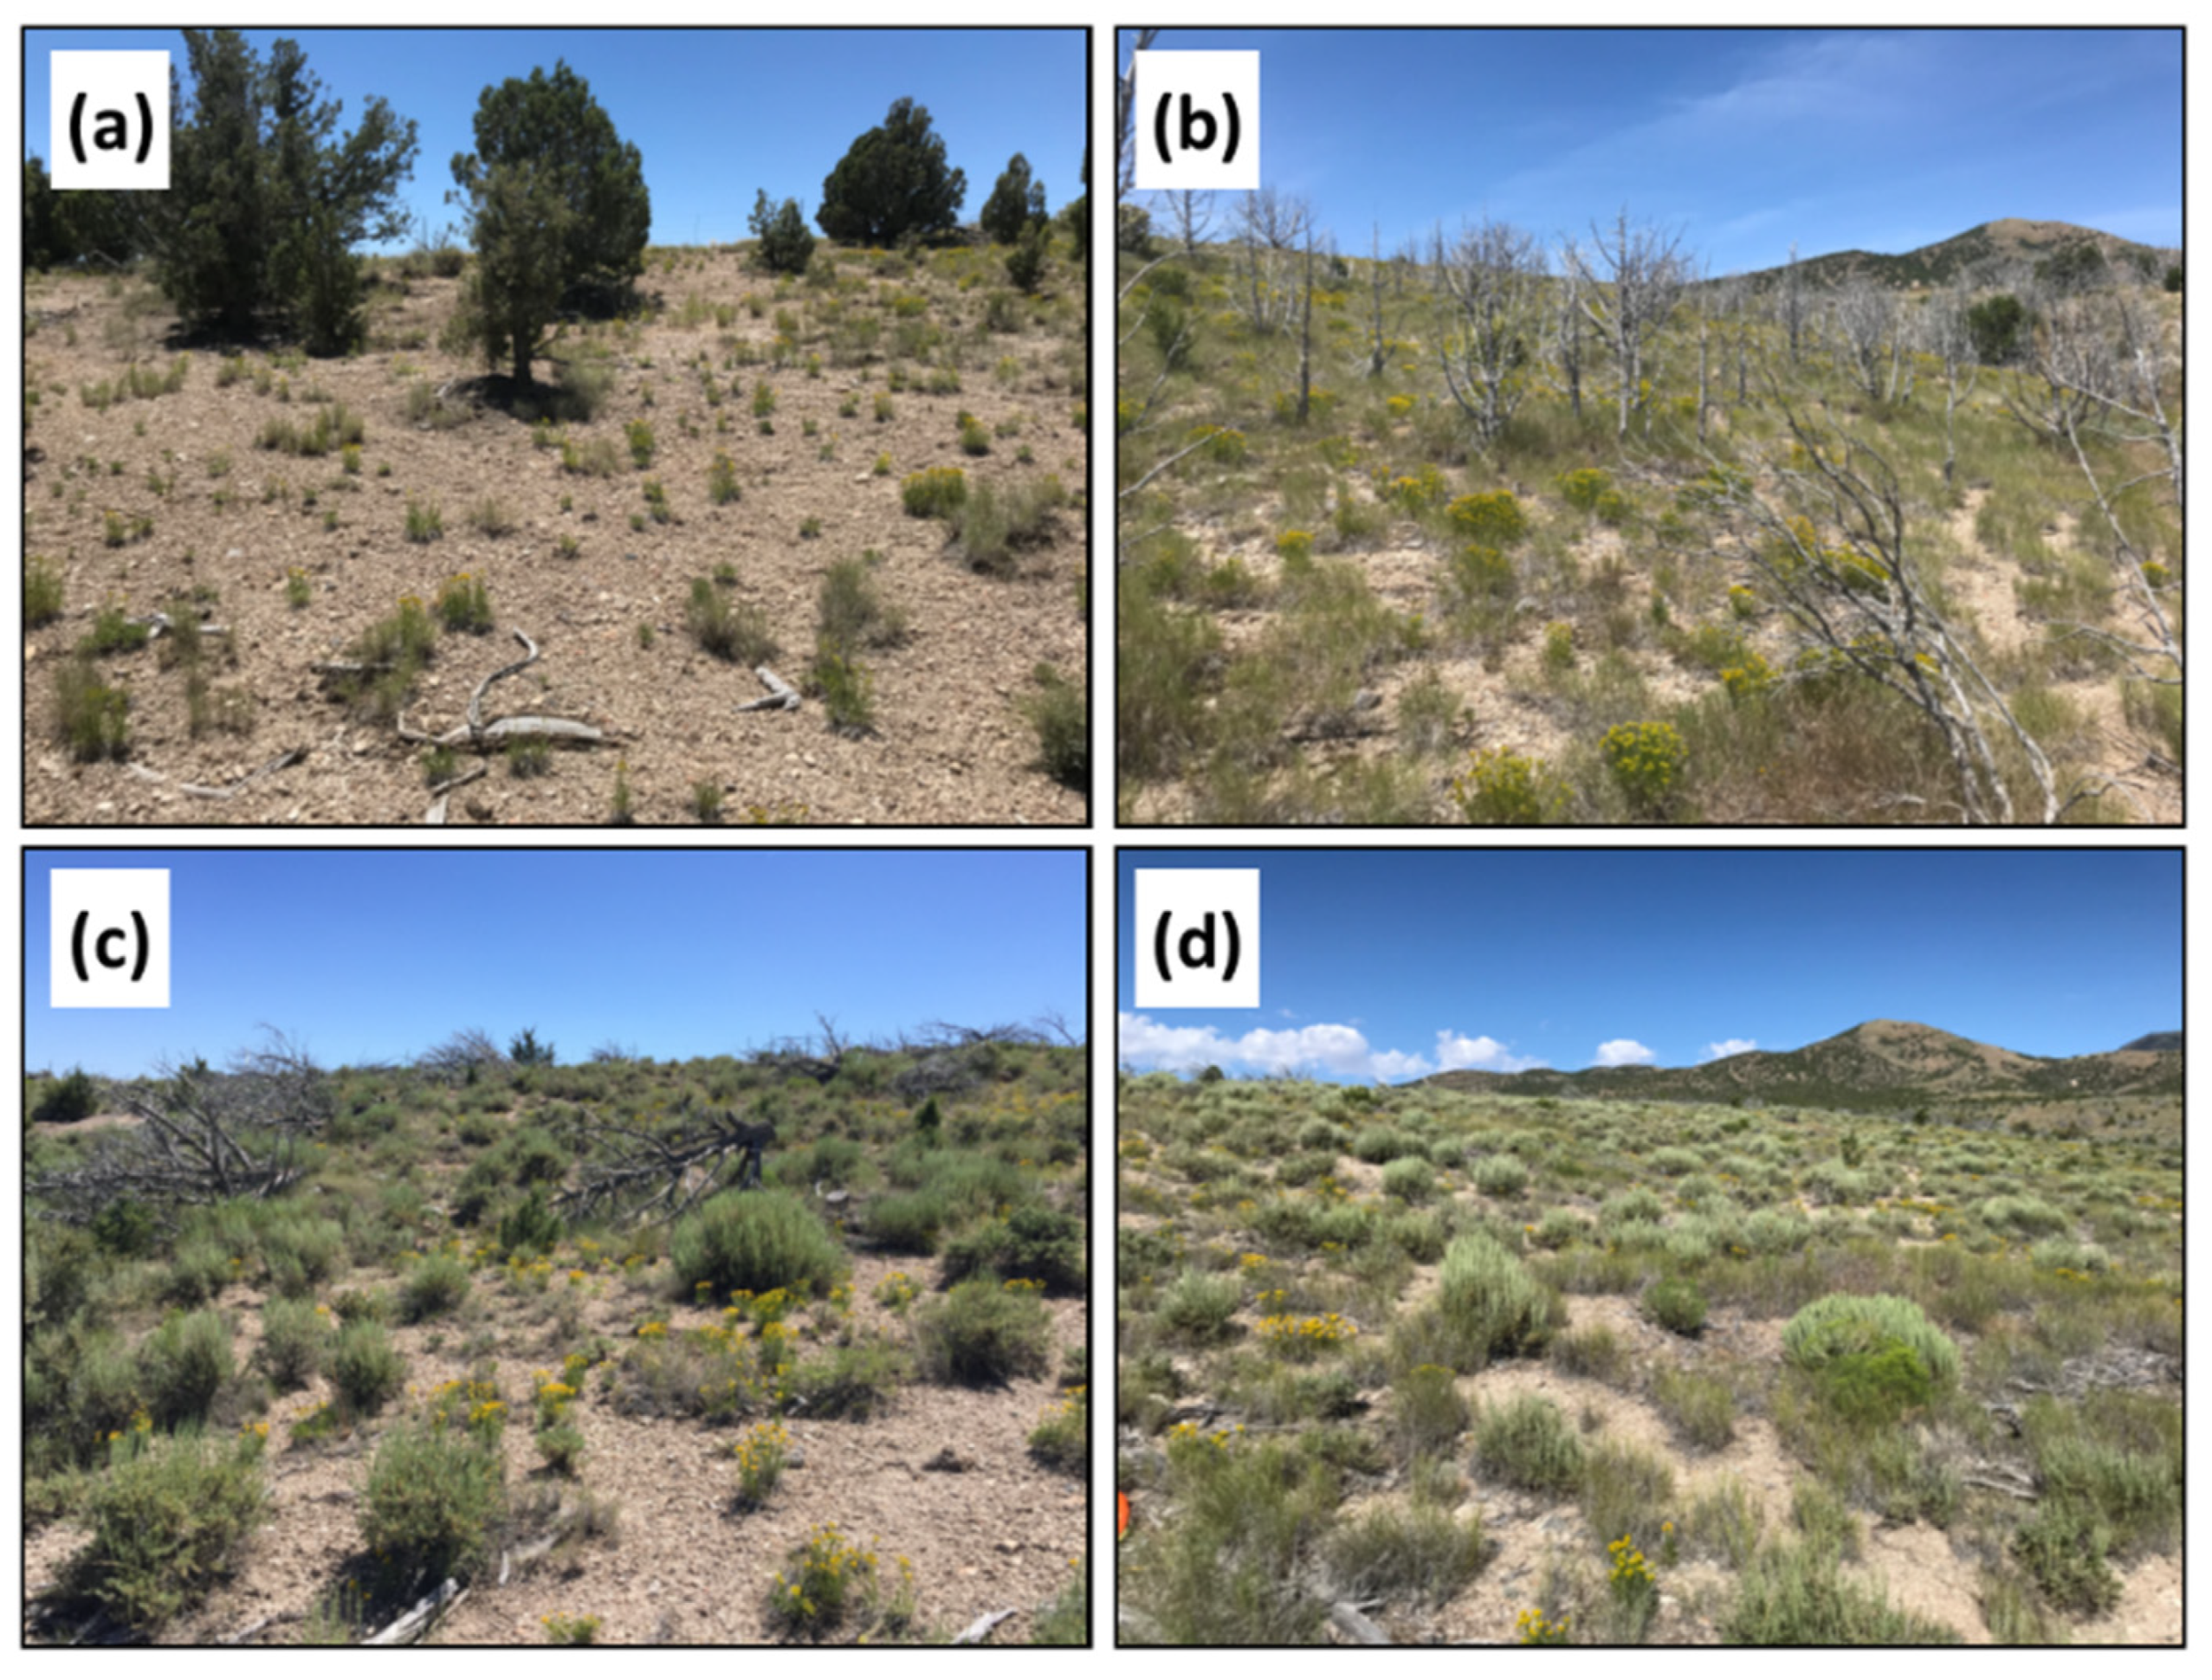
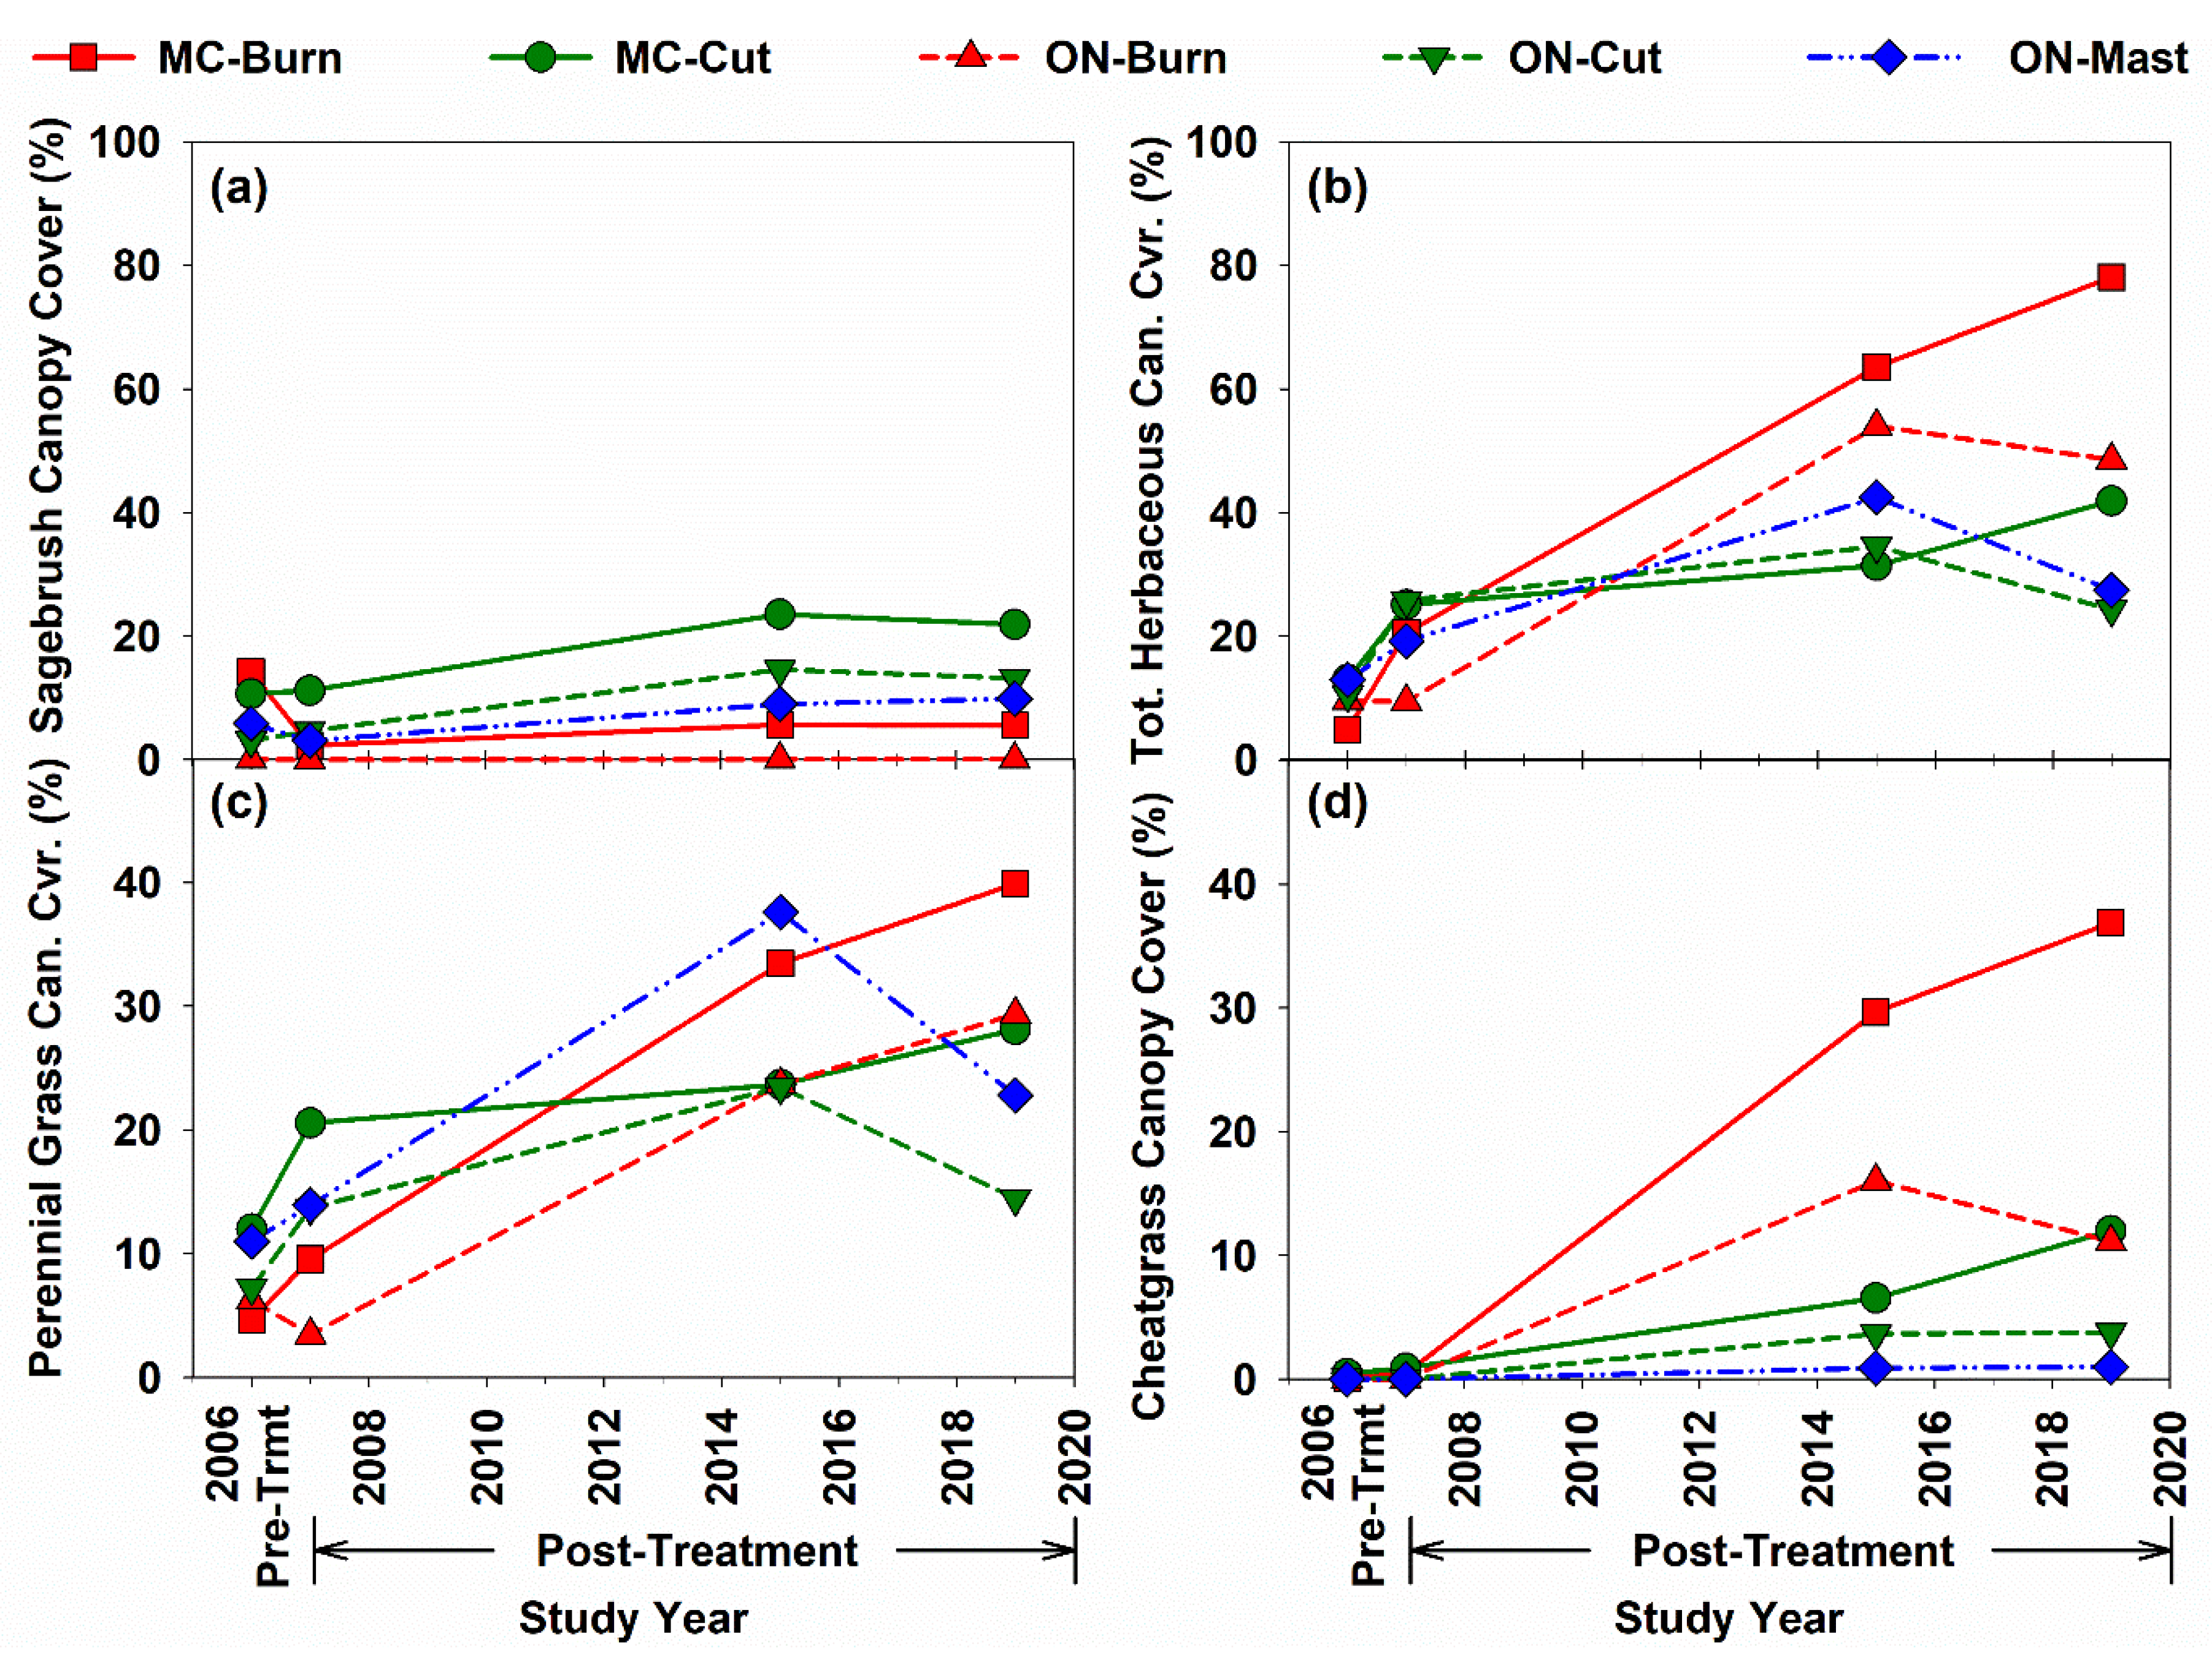
The plant community structure at the sites prior to the tree removal in 2006 was typical of degraded sagebrush steppe in the later stages of pinyon and juniper woodland encroachment (late Phase 2 to early Phase 3, Figure 1a, Figure 2a and Figure 3a) [18]. The vegetation structure at both sites pre-treatment consisted of isolated tree islands (~25% of area, ~480 trees per ha) surrounded by extensive bare (>60% bare soil and rock) and degraded intercanopy (~75% of area (Figure 2a and Figure 3a; Table 1)). The hillslope-scale cover of sagebrush prior to the tree removal treatments averaged 12% at Marking Corral and <5% at Onaqui (Figure 4a) [34,61], and both sites exhibited extensive shrub mortality (Table 1) [18]. The perennial grass cover averaged <10% (Figure 4c) and the cheatgrass cover averaged <1% (Figure 4d) across the sites pre-treatment [34,61]. The total canopy cover within intercanopy patches at Marking Corral prior to tree removal was near 40% and consisted of 21% shrub cover and 13% herbaceous cover (grasses and forbs). The total canopy cover in intercanopy patches at Onaqui pre-treatment averaged near 20% and was primarily herbaceous vegetation (11% cover) with minor shrub cover (5%). The canopy cover directly underneath trees (subcanopy) prior to the treatments averaged 8–13% across sites and was mainly herbaceous vegetation [18]. The ground surface underneath trees was nearly 100% covered by a ~5–9-cm deep layer of tree needles and debris. Soils underneath this thick litter layer were strongly water repellent at the mineral soil surface and slightly water repellent to 1–5 cm of soil depth [18]. Soils throughout the intercanopy patches at both sites were wettable. The soil bulk densities at Marking Corral averaged 1.35 g·cm−3 in interspaces between the shrubs and trees, 1.14 g·cm−3 under shrub canopies, and 1.08 g·cm−3 underneath tree canopies [18]. The same measures at Onaqui averaged 1.07 g·cm−3 in interspaces, 1.02 g·cm−3 under shrubs, and 0.82 g·cm−3 under tree canopies [18]. At each site, the tree cover, understory vegetation, ground cover, hillslope angle, and surface soil properties were generally similar (p > 0.05) across all treatment areas prior to tree removal [18].

2.2. Tree Removal Treatments

Tree removal treatments were applied by the BLM in late-summer and early autumn of 2006 as described by Pierson et al. [83]. The resulting control, burn, and cut areas were 1.3 ha, 2.7 ha, and 2.2 ha, respectively, at Marking Corral. The control, burn, cut, and mastication treatment areas at Onaqui were 1.0 ha, 2.0 ha, 2.4 ha and 1.6 ha, respectively. The prescribed fires were effective at removing live mature trees and reduced the density of juvenile trees and live shrubs by 80% each at Marking Corral and by 65% and 70% at Onaqui (Figure 5) [83]. The burn severity was not directly measured after the fires, but the presence of residual live and scorched tree needles, shrub skeletons, blackened litter, and woody debris immediately post-fire at both sites is indicative of low to moderate burn severities. Bare ground (bare soil and rock cover) across both sites was near 70% 1 year after the fires (Table 2 and Table 3) [83]. Burning had no effect on soil water repellency as measured 1 year post-fire [80]. Tree cutting by chainsaw removed all trees ≥1 m height in cut treatments at both sites. The cut trees were allowed to fall naturally and remain in-place (cut-and-drop treatment). The cutting treatment left a residual of 56 and 167 juvenile (<1 m height) trees per hectare in the cut treatment areas at Marking Corral and Onaqui, respectively (Figure 5b) [83]. Tree cutting had a limited immediate impact on the hillslope-scale understory vegetation at both sites and resulted in an immediate increase in the litter ground cover at Onaqui solely (Table 3) [83]. A rubber-tired Tigercat M726E Mulcher [88] was used to masticate (shred) trees at Onaqui. The mastication treatment uniformly removed all trees ≥ 1 m in height, but left a density of 56 juvenile trees per hectare (Figure 5b) [83]. Trees were masticated in-place and the shredded tree debris (mulch) was allowed to naturally fall to the ground surface. Tree mulch contributed to a nearly two-fold initial increase in the hillslope-scale litter cover and a reduction in bare ground (Table 3) [83]. Mulch primarily accumulated immediately adjacent to tree bases. The mulch depth averaged near 20 mm where it occurred in isolated areas within intercanopy patches and was about 90 mm in areas previously covered by tree canopy [80]. Treatment areas were not seeded prior to or after tree removal.

3. Materials and Methods

3.1. Experimental Design

Hillslope vegetation and ground cover in all treatment areas at each site were sampled on 30 m × 33 m site characterization plots installed by Pierson et al. [18] prior to treatments. Pierson et al. [18] randomly located and established three site characterization plots in each treatment area in 2006 for sampling pre- and post-tree removal. Each plot was sampled for tree cover, understory vegetation, and ground cover prior to treatment (summer 2006) [18] and for the understory vegetation and ground cover 1 year (summer 2007) and 9 years (summer 2015) after tree removal [20,34,61,81]. In summer 2019, this study re-sampled all of the previously established site characterization plots in all the treatment areas at each site to quantify the hillslope-scale changes in vegetation and ground cover 13 growing seasons after tree removal.
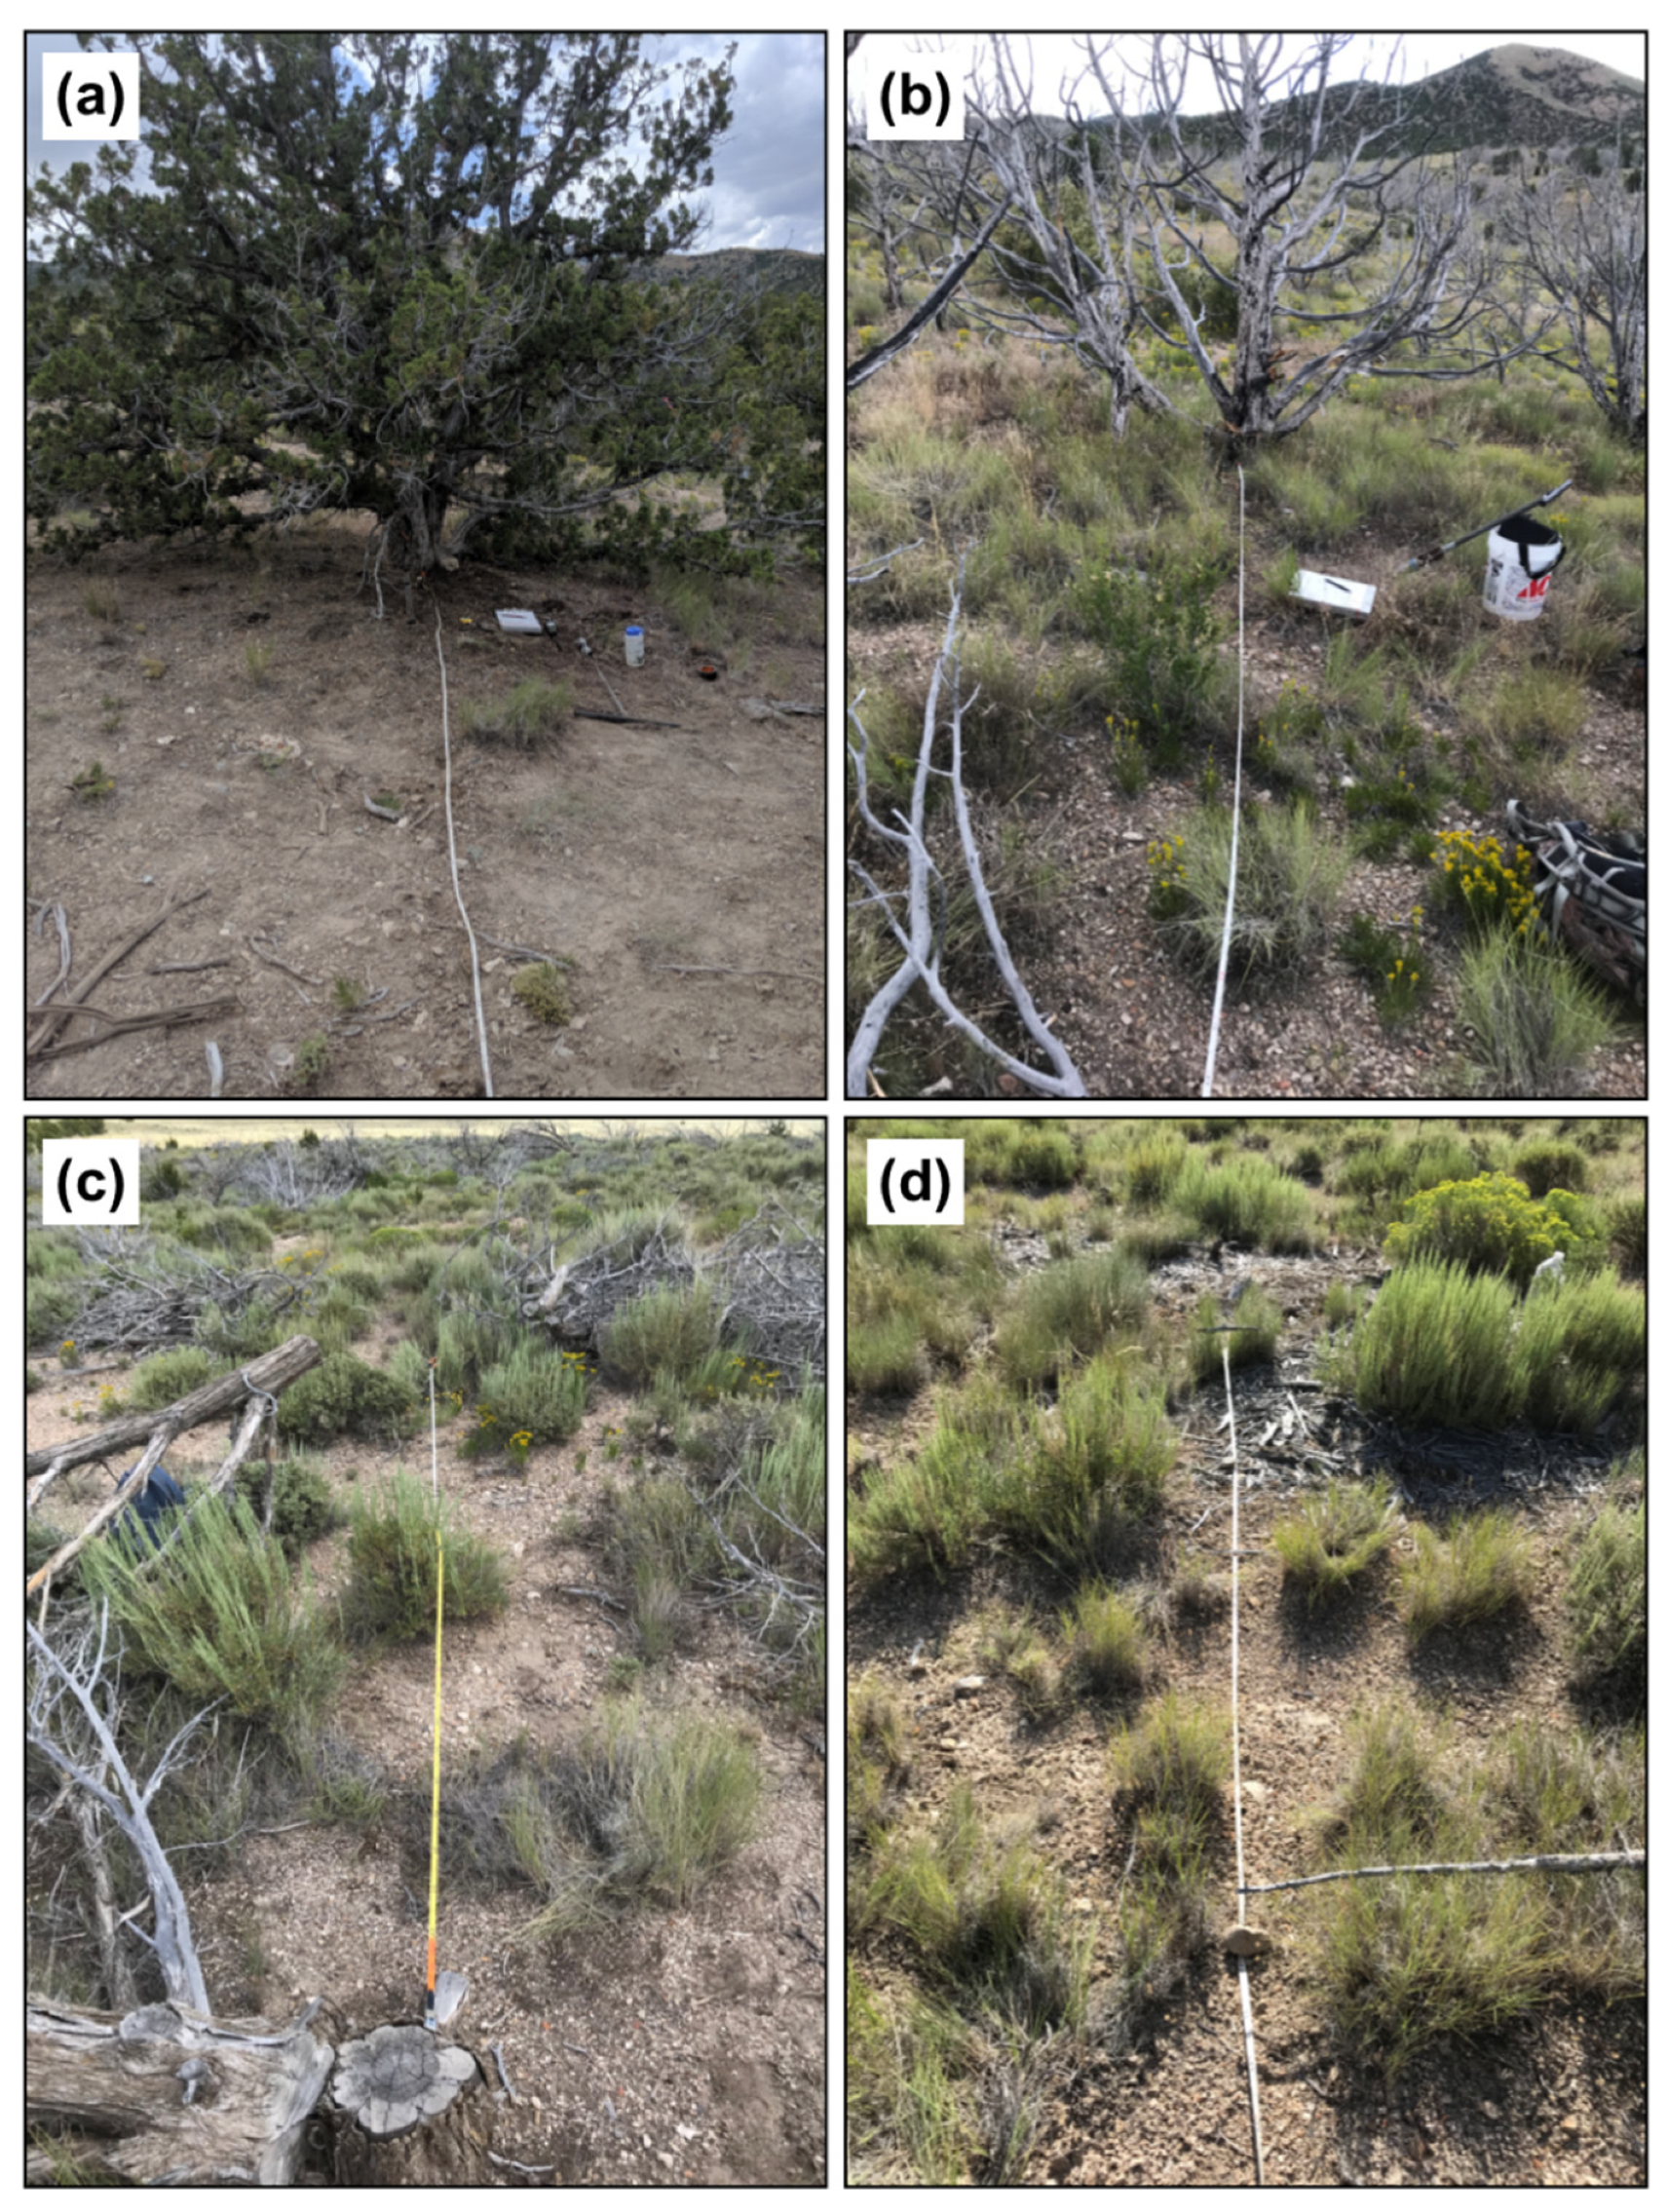
The long-term impacts of tree removal treatments on spatial patterns in point-scale ground surface conditions and soil hydrologic properties were assessed along transects (tree transects) extending from tree bases through the subcanopy, a transitional zone between the subcanopy and intercanopy, and into the intercanopy (Figure 6) [86]. Four trees (2 single-leaf pinyon, 2 Utah juniper) were randomly located and sampled in the control and all the tree removal treatment areas at Marking Corral in summer 2019. Likewise, five Utah juniper trees were randomly selected and sampled in the control and all the treatment areas at Onaqui in summer 2019. Across the two sites, a total of 32 trees were sampled. All of the tree transects at Marking Corral were sampled for litter depth, ground cover, volumetric moisture content, soil total organic carbon (TOC), soil water repellency (SWR), unsaturated hydraulic conductivity (K(h)), and a relative infiltration rate [94]. All of the tree transects at Onaqui were sampled for litter depth, ground cover, soil moisture, TOC, and SWR. Three of the five trees selected for study in each experimental area at that site were sampled for TOC, K(h), and relative infiltration. A more intensive sampling of the TOC, K(h), and infiltration at Marking Corral was employed to equally sample the multiple tree species present at that site. The total number of trees sampled was determined based on site logistics and time required to conduct the required number of experimental measurements.

3.2. Hillslope-Scale Vegetation and Ground Cover

Hillslope-scale understory vegetation and ground cover were measured on each 990 m2 site characterization plot using line-point intercept methods along five 30-m transects oriented perpendicular to the hillslope contour and spaced 5–8 m apart [18]. The canopy (foliar) and ground cover on each plot were recorded at 60 points spaced 50-cm apart along each of the five transects, for a total of 300 sample points per plot. The percentage cover for each of the cover types sampled was derived for each plot as the frequency of the respective cover type hits divided by the total number of sample points. The number of live trees >0.5-m in height was quantified for each plot and tree height and the maximum and minimum crown diameters were measured for each counted tree. The crown radius for each tree was derived as one-half of the average of the measured minimum and maximum crown diameters. Individual tree crown area was calculated as equivalent to the area of a circle with the respective crown radius. The total tree cover for each plot was quantified as the sum of the measured tree cover values (crown areas) on the respective plot. The numbers of shrubs greater than 5-cm in height and tree seedlings (≤0.5-m height) were recorded along three evenly spaced (6 m apart) belt transects (2 m wide × 30 m long) within each plot. The shrub and tree seedling densities for each plot were derived as the sums of the respective measures counted along each of the respective three belt transects divided by the total belt transect area (180 m2).

3.3. Tree Transects—Ground Surface Conditions and Soil Hydrologic Properties

Tree transects at each site were oriented in a due east compass direction from the tree bases unless obstructed by neighboring tree canopies or other natural obstacles (e.g., bedrock). Transects in the control areas (Figure 6) at each site extended to the intercanopy mid-point between the nearest tree neighbor along the due east compass direction. In cases of overlapping canopy areas or obstacles in the eastward direction, the respective transect was oriented in a due west compass direction. In the case of an obstacle or canopy overlap in both the east and west directions, a new tree was randomly selected and the above transect establishment methods were repeated. East and west orientations were selected to avoid contrasting micro-climates typical of north- and south-facing canopy aspects for pinyon and juniper conifers [95]. Transects in the treated areas were selected and designed to be consistent with those in the control areas, but the total transect length in the treated areas in which the subcanopy areas were indistinguishable was determined as the average of the transect lengths from the respective site control transects. The average distances from a tree base to the subcanopy edge across all the experimental areas ranged from 1.4 m to 2.0 m at Marking Corral and 1.4 m to 1.7 m at Onaqui. The average total transect distances across all the experimental areas ranged 2.3–2.6 m at Marking Corral and 3.4–3.7 m at Onaqui.
For each tree transect, the respective tree was assigned a number, the species was identified and recorded, and, at points with intervals of 30 cm along the transect, the microsite was identified and the litter depth, ground cover, SWR, and volumetric water content were quantified/recorded. The microsite at each sample point along tree transects was classified as a tree, shrub, vegetated interspace (≥30% herbaceous cover), or bare interspace (<30% herbaceous cover) (Figure 1b–e) based on a 900 cm2 area centered on the respective sample point. The ground cover at each sample point was recorded as either bare soil, basal plant, cryptogam, litter, woody dead, or rock cover. The depth of litter accumulated above the mineral soil surface at each sample point was measured to the nearest 1 mm using a steel ruler. After recording the microsite, ground cover, and litter measures, the SWR was assessed on each sample point using the water drop penetration time (WDPT) test [96]. All the litter and duff were carefully removed on each sample point, and three water drops, spaced approximately 3 cm apart, were placed on the mineral soil surface. The time required for each water drop to fully infiltrate was recorded, up to a maximum of 300 s, and the median WDPT for the three drops was used to classify the SWR at the respective point. Soils were classified as wettable when the WDPT < 5 s, slight water repellent when the WDPT ranged from 5 to 60 s, and strongly water repellent when the WDPT > 60 s [97]. The volumetric water content for 0–5 cm soil depth was measured to the nearest 0.01 m3 m−3 at each sample point using a Stevens HydraProbe (Stevens Water Monitoring Systems, Inc., Portland, OR, USA, www.stevenswater.com/products/hydraprobe/).
The SWR at 1–3 cm depths, TOC, infiltration, and unsaturated hydraulic conductivity (K(h)) were assessed at three sample locations (subcanopy, transition, and intercanopy zones) on all the tree transects at Marking Corral and on a subset (3 per treatment) of tree transects at Onaqui. The sample points for the subcanopy, transition, and intercanopy zone measures on each transect at both sites were set at approximately 0.5, 1.3, and 2.3 times the subcanopy radius to normalize the sampling locations across treatments and sites [86]. The mean subcanopy radius for the tree transects in the control areas was used as an estimate of the subcanopy radius within treatments when the subcanopy edge was not clearly discernable. SWR was assessed in each zone type using the WDPT test at 1 cm, 2 cm, and 3 cm soil depths, consistent with the methods described for the SWR measures at the mineral soil surface (0-cm soil depth). The TOC in each zone type was obtained from soil cores extracted by hand auger to a depth of 15 cm. Soil cores were immediately sealed in air-tight bags and subsequently transported to and processed in a laboratory using the dry combustion method (Motzz Laboratory, Inc., Phoenix, AZ, USA, www.motzzlaboratory.com). The K(h) and relative infiltration rate in each zone type were determined by cumulative infiltration tests with a minidisk infiltrometer (MDI; METER Group, Inc., Pullman, WA, USA, www.metergroup.com) at a suction head of −2 cm, consistent with similar woodland studies [85,86,98]. The MDI sample locations were oriented immediately adjacent to the SWR and TOC sample locations so as to avoid a wetted or disturbed surface. At each sample point, the MDI was filled with water, placed on a thin pad (~2 mm thick) of 2-mm sieved soil collected adjacent to the sampling point, and allowed to completely drain (up to maximum of 2 h). The incremental infiltration during each test was recorded in mL·min−1 and the cumulative infiltration was recorded as the total water infiltrated over the full length of the respective test. For each infiltration test, the K(h) was derived from a set of equations established by Zhang [99]:
I = C1t0.5 + C2t
K(h) = C2/A2
where I is the cumulative infiltration, and constant A2 is a function of the van Genuchten retention parameters [100], suction head, and the radius of the infiltrometer disk (2.25 cm). C1 and C2 were determined via the differentiated linearization method [101]. The soil texture was obtained from previous experiments at the sites [18]. A relative infiltration rate (mL·min−1) for each cumulative infiltration test was derived as the cumulative infiltration (mL) measured over the first 1 min of the respective test [94]. The relative infiltration is considered to be an indicator of soil water repellency given the effects of soil water repellency on infiltration generally decline with prolonged water input and wetting [46,94]. The averages for all measures along each tree transect were derived by the patch type (subcanopy and intercanopy) and zone type (subcanopy, transition, and intercanopy) for each site × treatment combination. The total numbers of tree transects sampled by site × treatment combinations are shown in Table 4.

3.4. Statistical Analyses

SAS Software version 9.4 was used for statistical analyses [102]. The hillslope-scale vegetation and ground cover data collected on the 990 m2 site characterization plots at Marking Corral were analyzed using a repeated-measures mixed model with multiple treatment levels (pre-burn, year-1 burned, year-9 burned, year-13 burned, pre-cut, year-1 cut, year-9 cut, and year-13 cut) and sample year (2006, 2007, 2015, and 2019) as the repeated measure. The site characterization data for the Onaqui site were analyzed consistent with those at Marking Corral, but with the addition of the mastication treatment levels (pre-mastication, year-1 mastication, year-9 mastication, and year-13 mastication). The covariance structure in all the analyses of site characterization data was evaluated using fit statistics suggested by Littell et al. [103] and the best fit model was applied. Site-specific analyses of the tree transect data at the patch scale were conducted using a mixed model with multiple treatment levels (control, burned, cut, and mastication (Onaqui only)) and two patch levels (subcanopy and intercanopy). Site-specific analyses of the tree transect data across zone types were conducted using a mixed model with multiple treatment levels (control, burned, cut, and mastication (Onaqui only)) and three zone levels (subcanopy, transition, and intercanopy). The zone level analyses found that, with few exceptions, the means for the variables in transition zones were statistically similar with those from intercanopy zones. Therefore, all the data spanning transition and intercanopy zones on a transect were combined to represent the intercanopy patch scale for the respective transect. Only the total transect and patch-scale analyses/results are reported. The plot location was considered a random effect, and the site, treatment, patch type and zone type were considered fixed effects in all respective analyses. Normality and homogeneity of variance were tested prior to ANOVA and deviances were addressed through standard data transformations (e.g., arcsine-square root, logarithmic, square root) where possible. Back transformed means are reported. Mean separation for normal data was determined using the LSMEANS procedure and the Tukey–Kramer adjustment. Mean separation was determined using the Kruskal Wallis method with the Dwass, Steel, Critchlow–Fligner (DSCF) post-hoc test in cases in which normality was not achieved through data transformation. Simple linear and non-linear regressions were applied to explore the explanatory relationships between variable pairs (e.g., the litter depth and WDPT). All reported significant effects were tested at the p < 0.05 level.

4. Result

4.1. Hillslope-Scale Vegetation and Ground Cover

All treatments effectively reduced the density and cover of mature pinyon and juniper trees (Figure 5a), and the treatment effects on sagebrush and other shrubs varied with treatment type (Table 2 and Table 3; Figure 4a and Figure 5c). Tree canopy cover across all treatment areas declined from initial values near 25% at both sites in 2006 to <5% at Marking Corral and <1% at Onaqui in 2015, 9 years post-treatment. The tree canopy cover across all treatments in 2019 (13th year post-treatment) was similar to the same measures in 2015, even though the juvenile tree density increased slightly in the cut treatments at both sites from 2015 to 2019 (Figure 5b). By the 13th year post-treatment, the juvenile tree density was generally greater in the mechanical, as opposed to the burn, treatments at a site (Figure 5b), and for mechanical treatments it was near to or slightly greater than the pre-treatment levels. The shrub cover (mainly sagebrush) remained low or was reduced by burning initially and was unaffected by the mechanical treatments in the first year (Table 2 and Table 3; Figure 4a and Figure 5c). With few exceptions, the treatments increased shrub cover over the 13 growing seasons (~5–30% cover in 2019). The exceptions include burning at Marking Corral (Table 2), which had the highest initial shrub cover (18%), and mastication at Onaqui (Table 3). In 2019, approximately 50–90% of the total shrub cover (Table 2 and Table 3) across sites and treatments was sagebrush with exception of the burned area at Onaqui (<5% shrub cover), which had <1% initial sagebrush canopy cover (Figure 4a).
The greatest understory changes across all treatments and sites over the 13 year study were the 2- to 16-fold increases in the grass canopy cover and associated increases in the basal plant cover (Table 2 and Table 3; Figure 4c,d). The total grass canopy cover initially averaged 5–12% across sites and treatments, increased to 27–63% across sites and treatments 9 years post-treatment, and was 40–77% at Marking Corral and 18–40% at Onaqui across all treatments the 13th year after tree removal. Although the grass cover increased across all treatments, the grass canopy cover was significantly greater in the burned, as opposed to the mechanical treatments, at both sites by the 13th year. In that year, approximately 50–75% of the grass canopy cover in the burned treatments was of perennial grasses, whereas approximately 70–96% of the grass canopy cover in the mechanical treatments was of perennial grasses (Figure 4c; Table 2 and Table 3). The lesser relative perennial grass cover in the burned, as opposed to the mechanical treatments was associated with a dense canopy cover of cheatgrass (Figure 4d) immediately adjacent to and surrounding burned trees. The forb canopy cover increased in some treatments in the first and ninth year post-treatment but was similar to the pre-treatment conditions in all the treatment areas at the sites by the 13th year after tree removal (Table 2 and Table 3). The primary ground cover change following tree removal was an increase in the basal plant cover in all treatments at both sites (Table 2 and Table 3). Across all the treatments at both sites, the basal plant cover increased 15- to nearly 30-fold by the ninth year after tree removal and was 25-fold and six-fold greater, on average, 13 years post-treatment relative to the pre-treatment levels at Marking Corral and Onaqui, respectively.

4.2. Spatial Patterns in Ground Cover and Soil Hydrologic Properties along Tree Transects

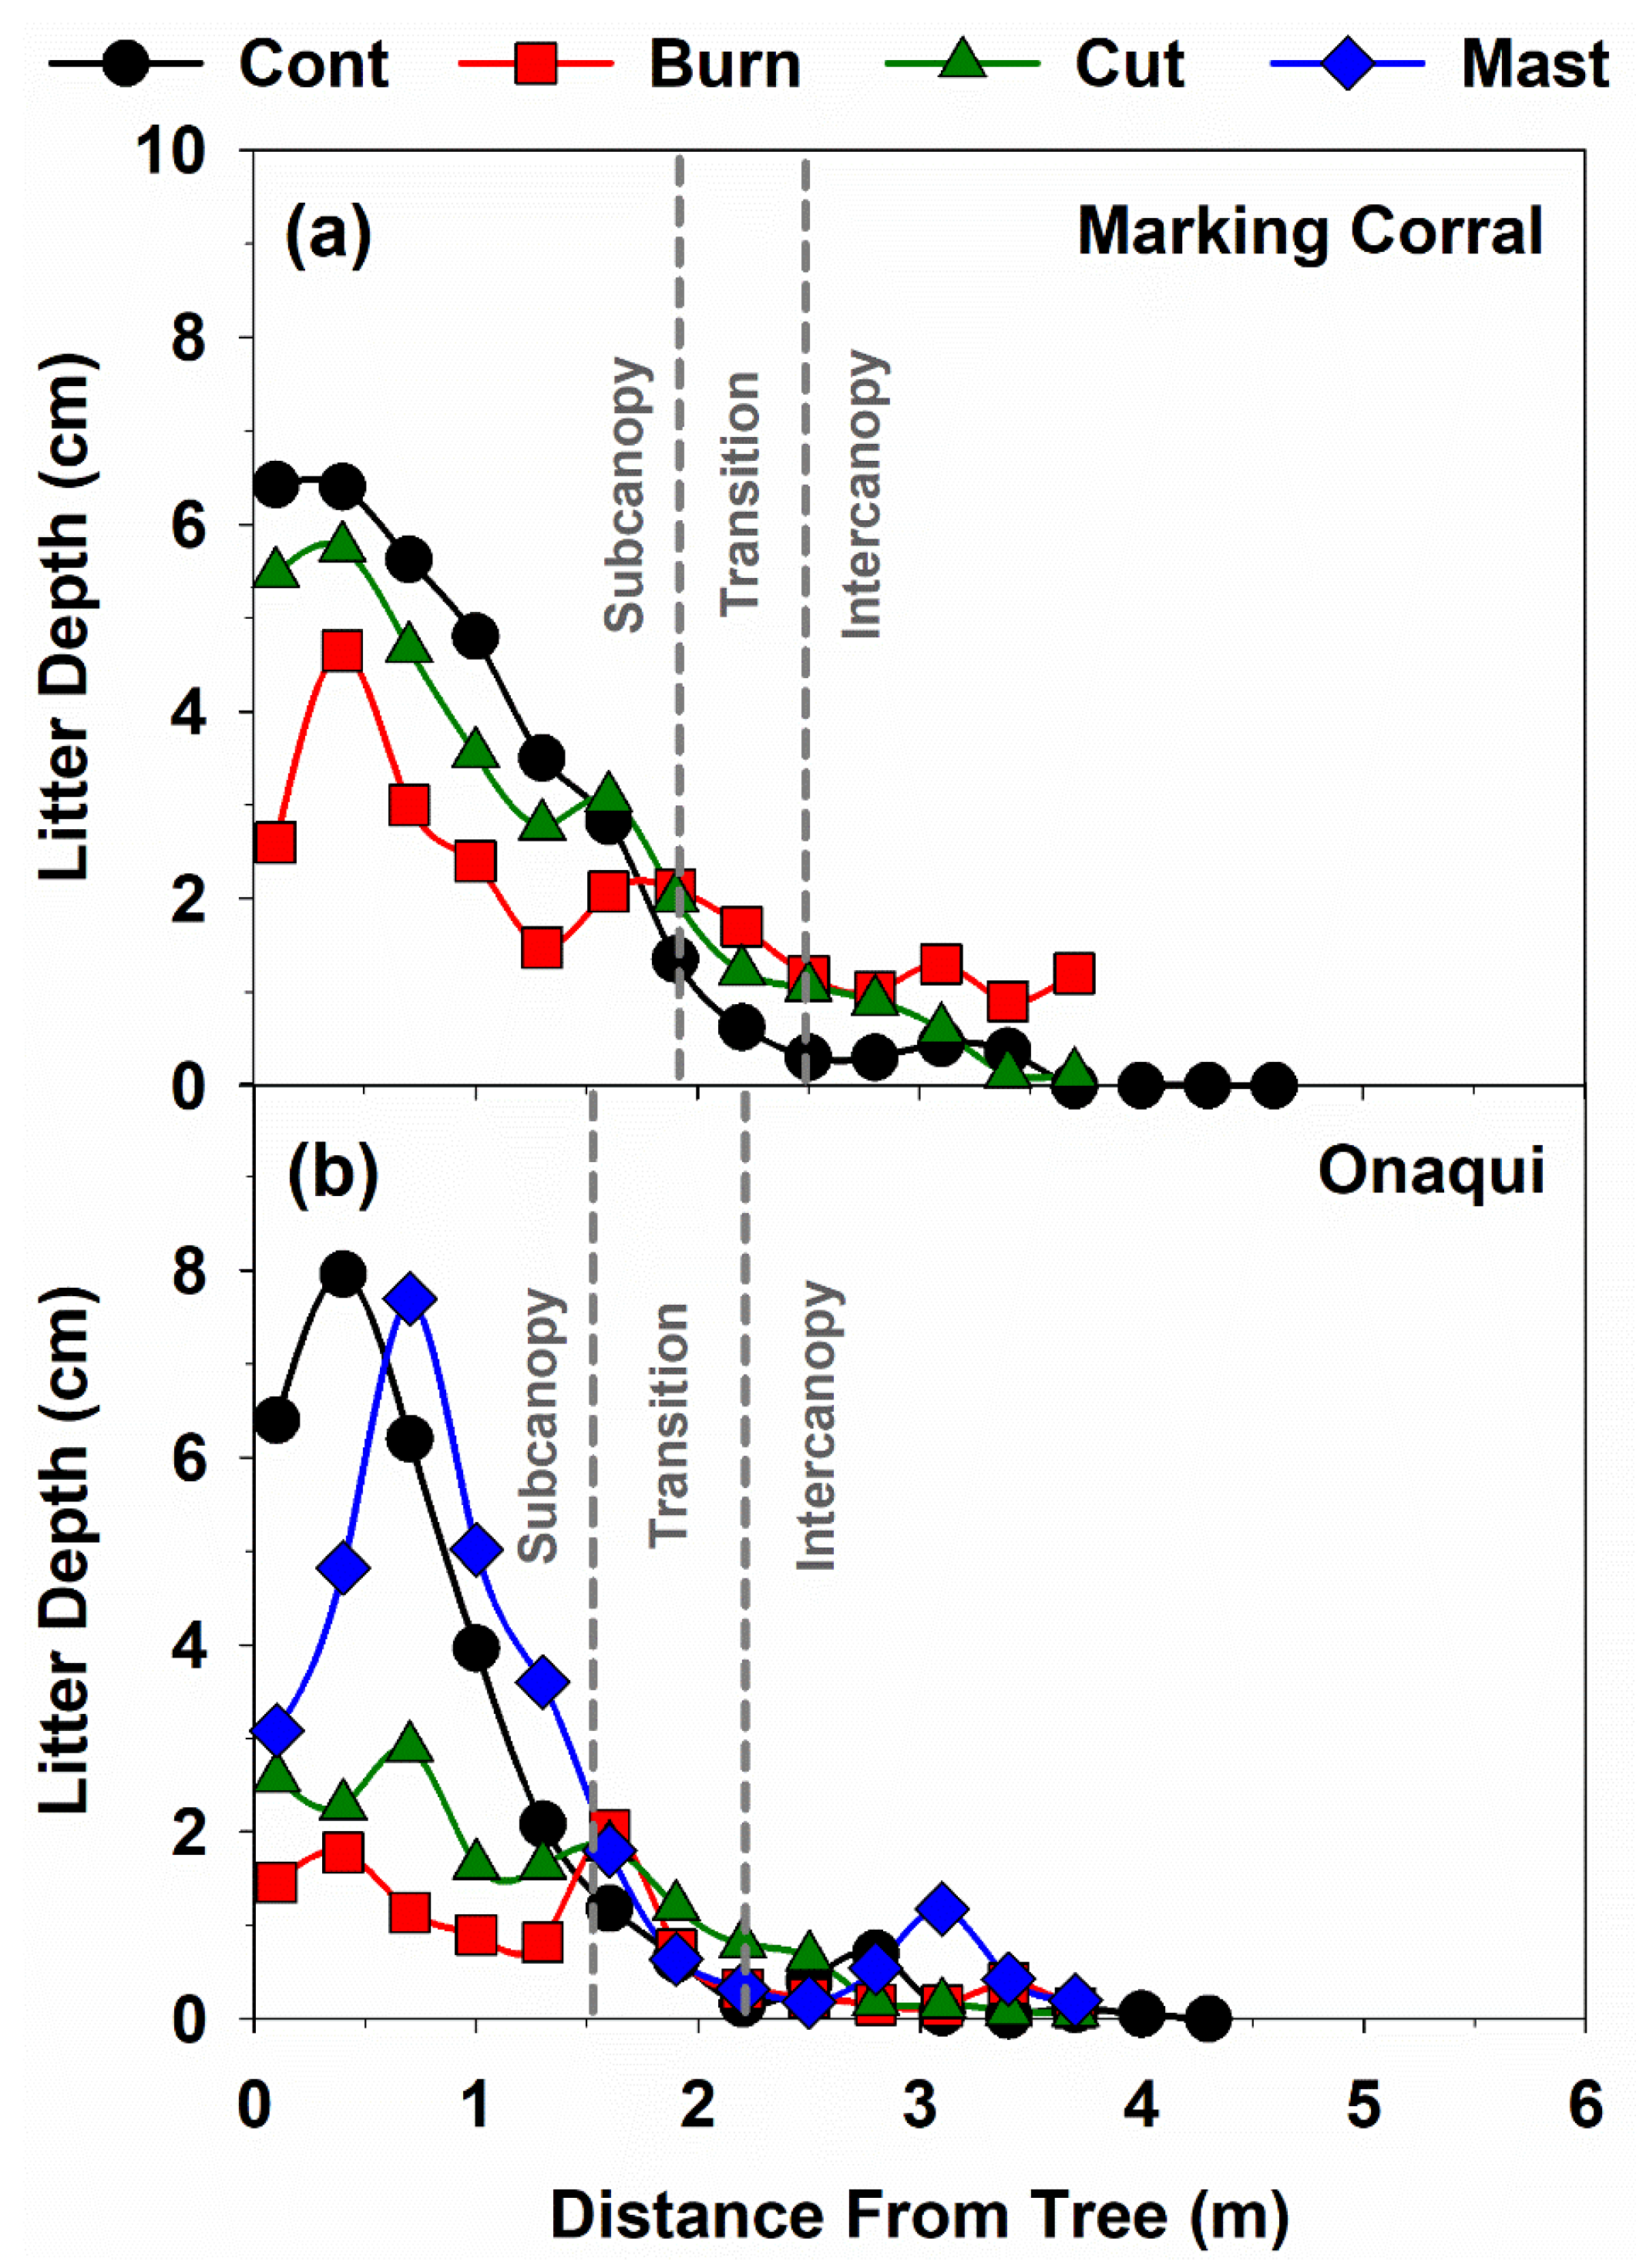
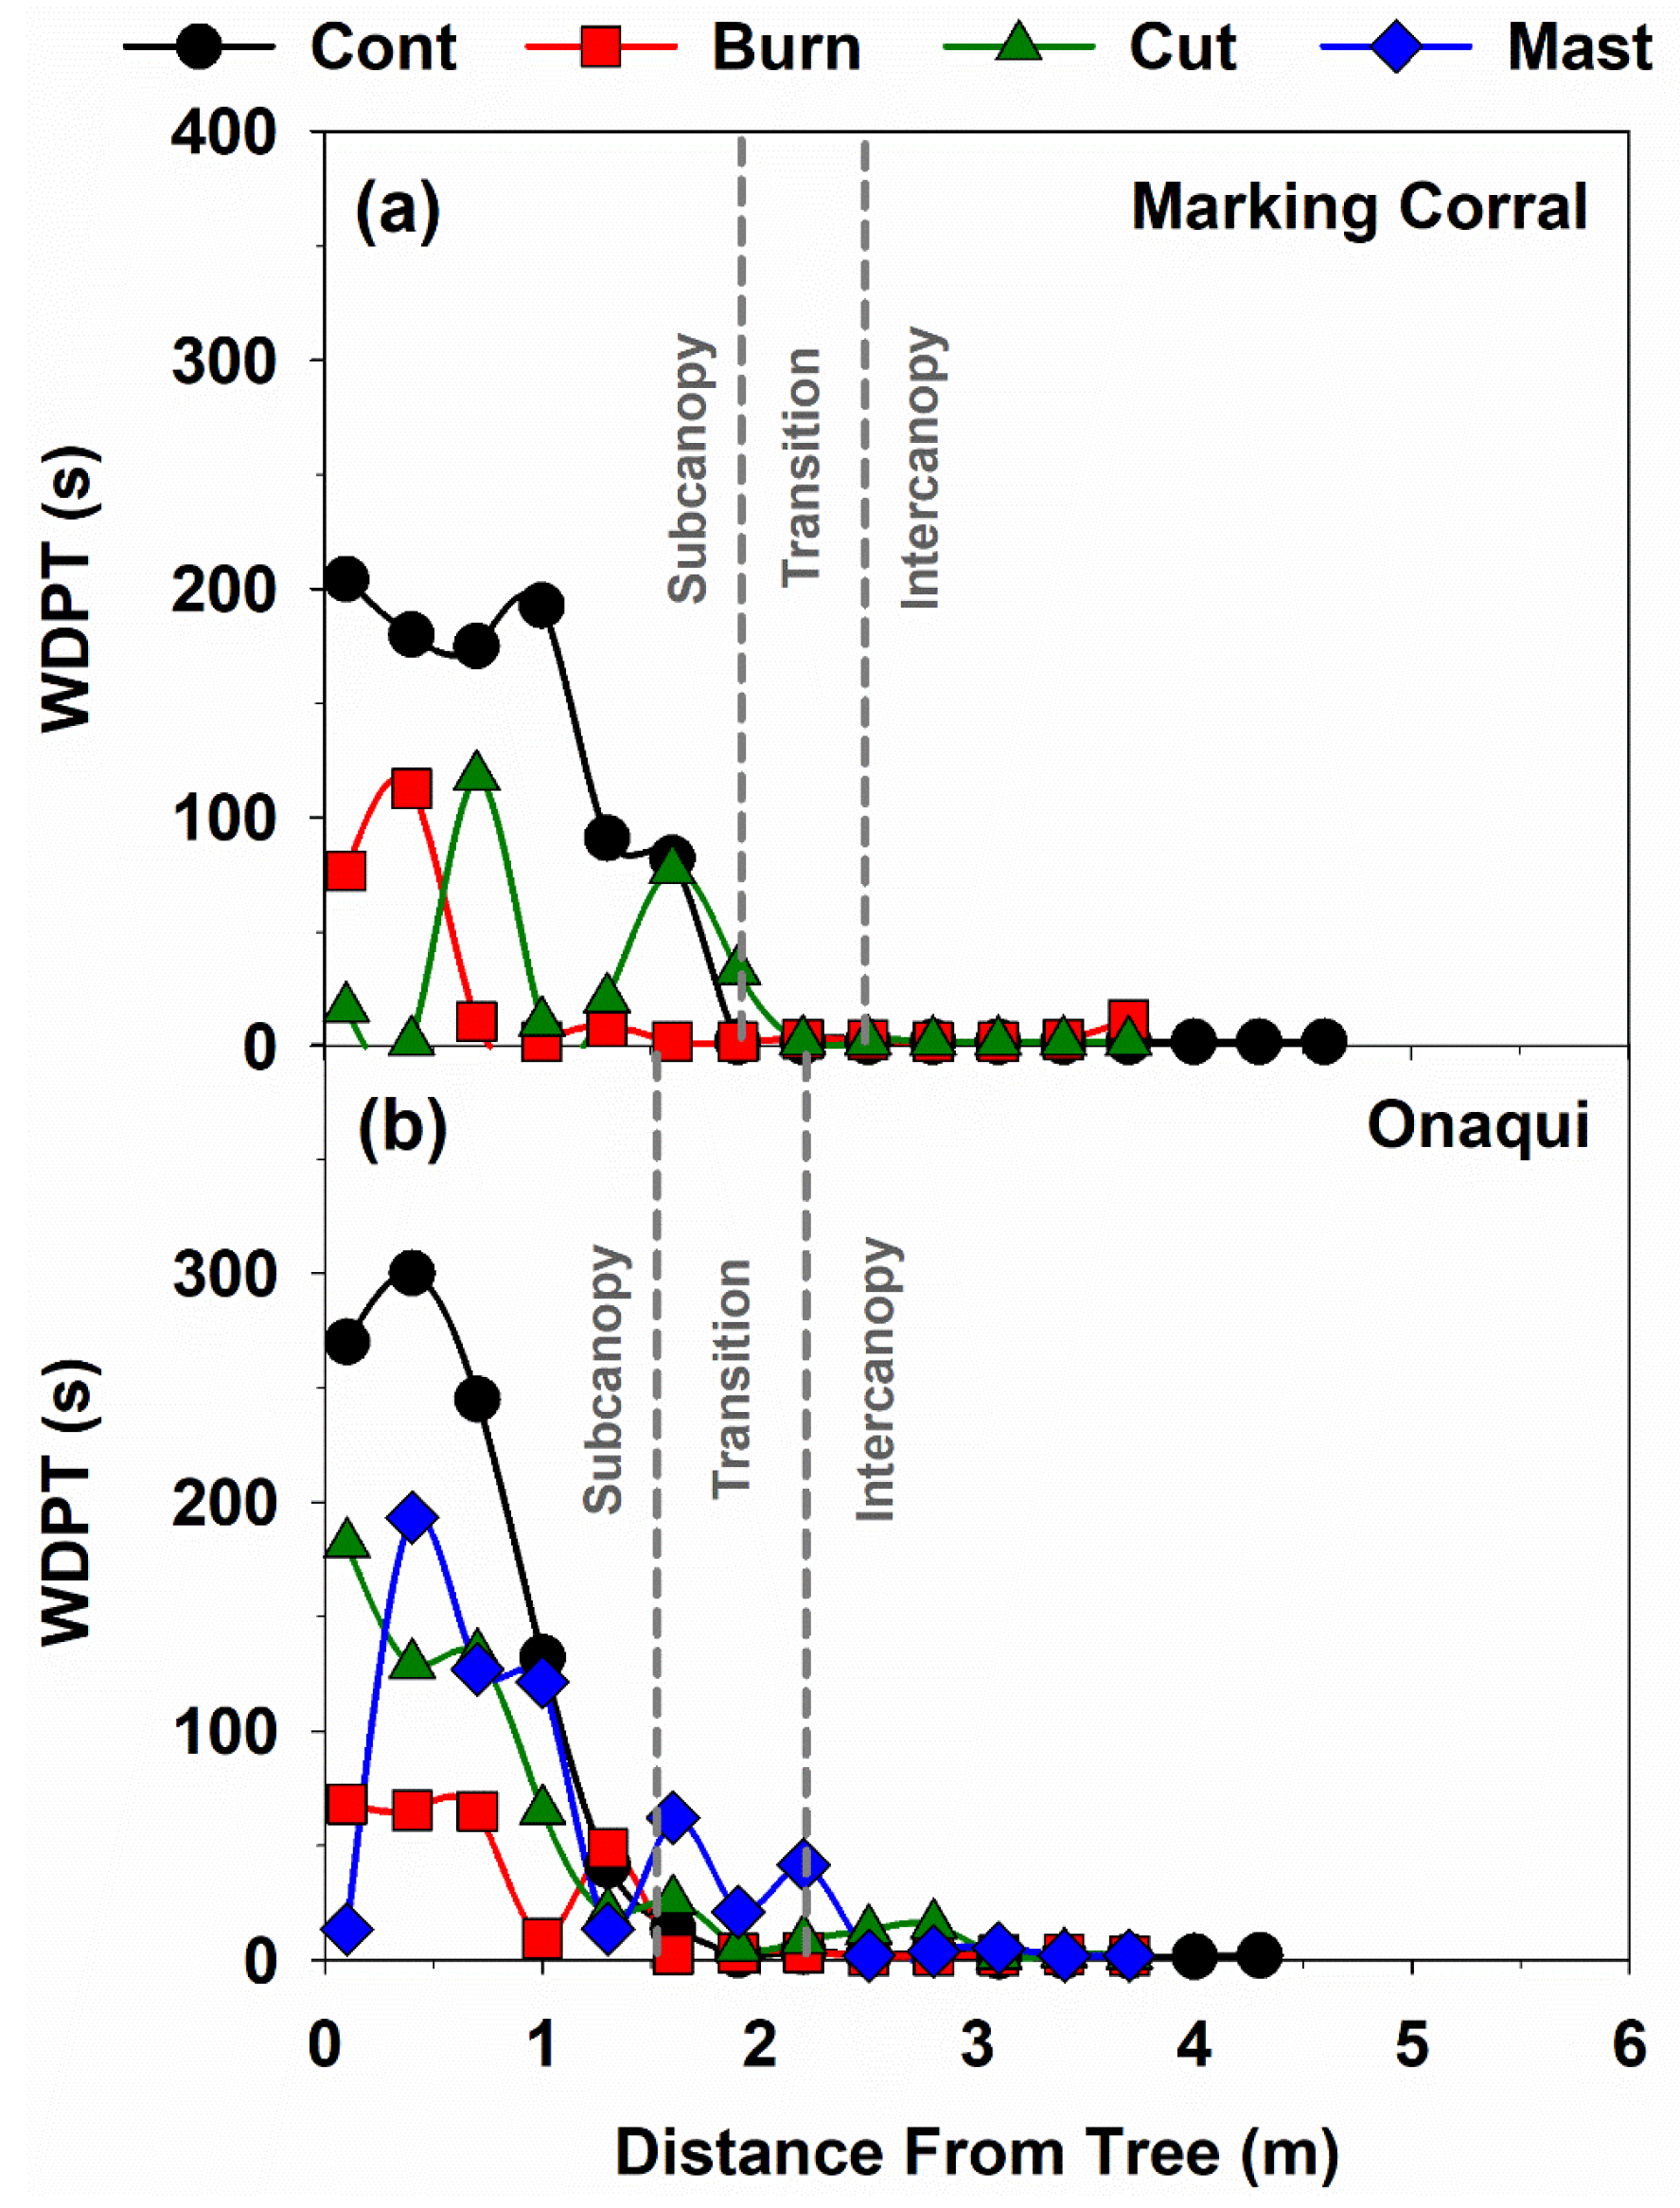
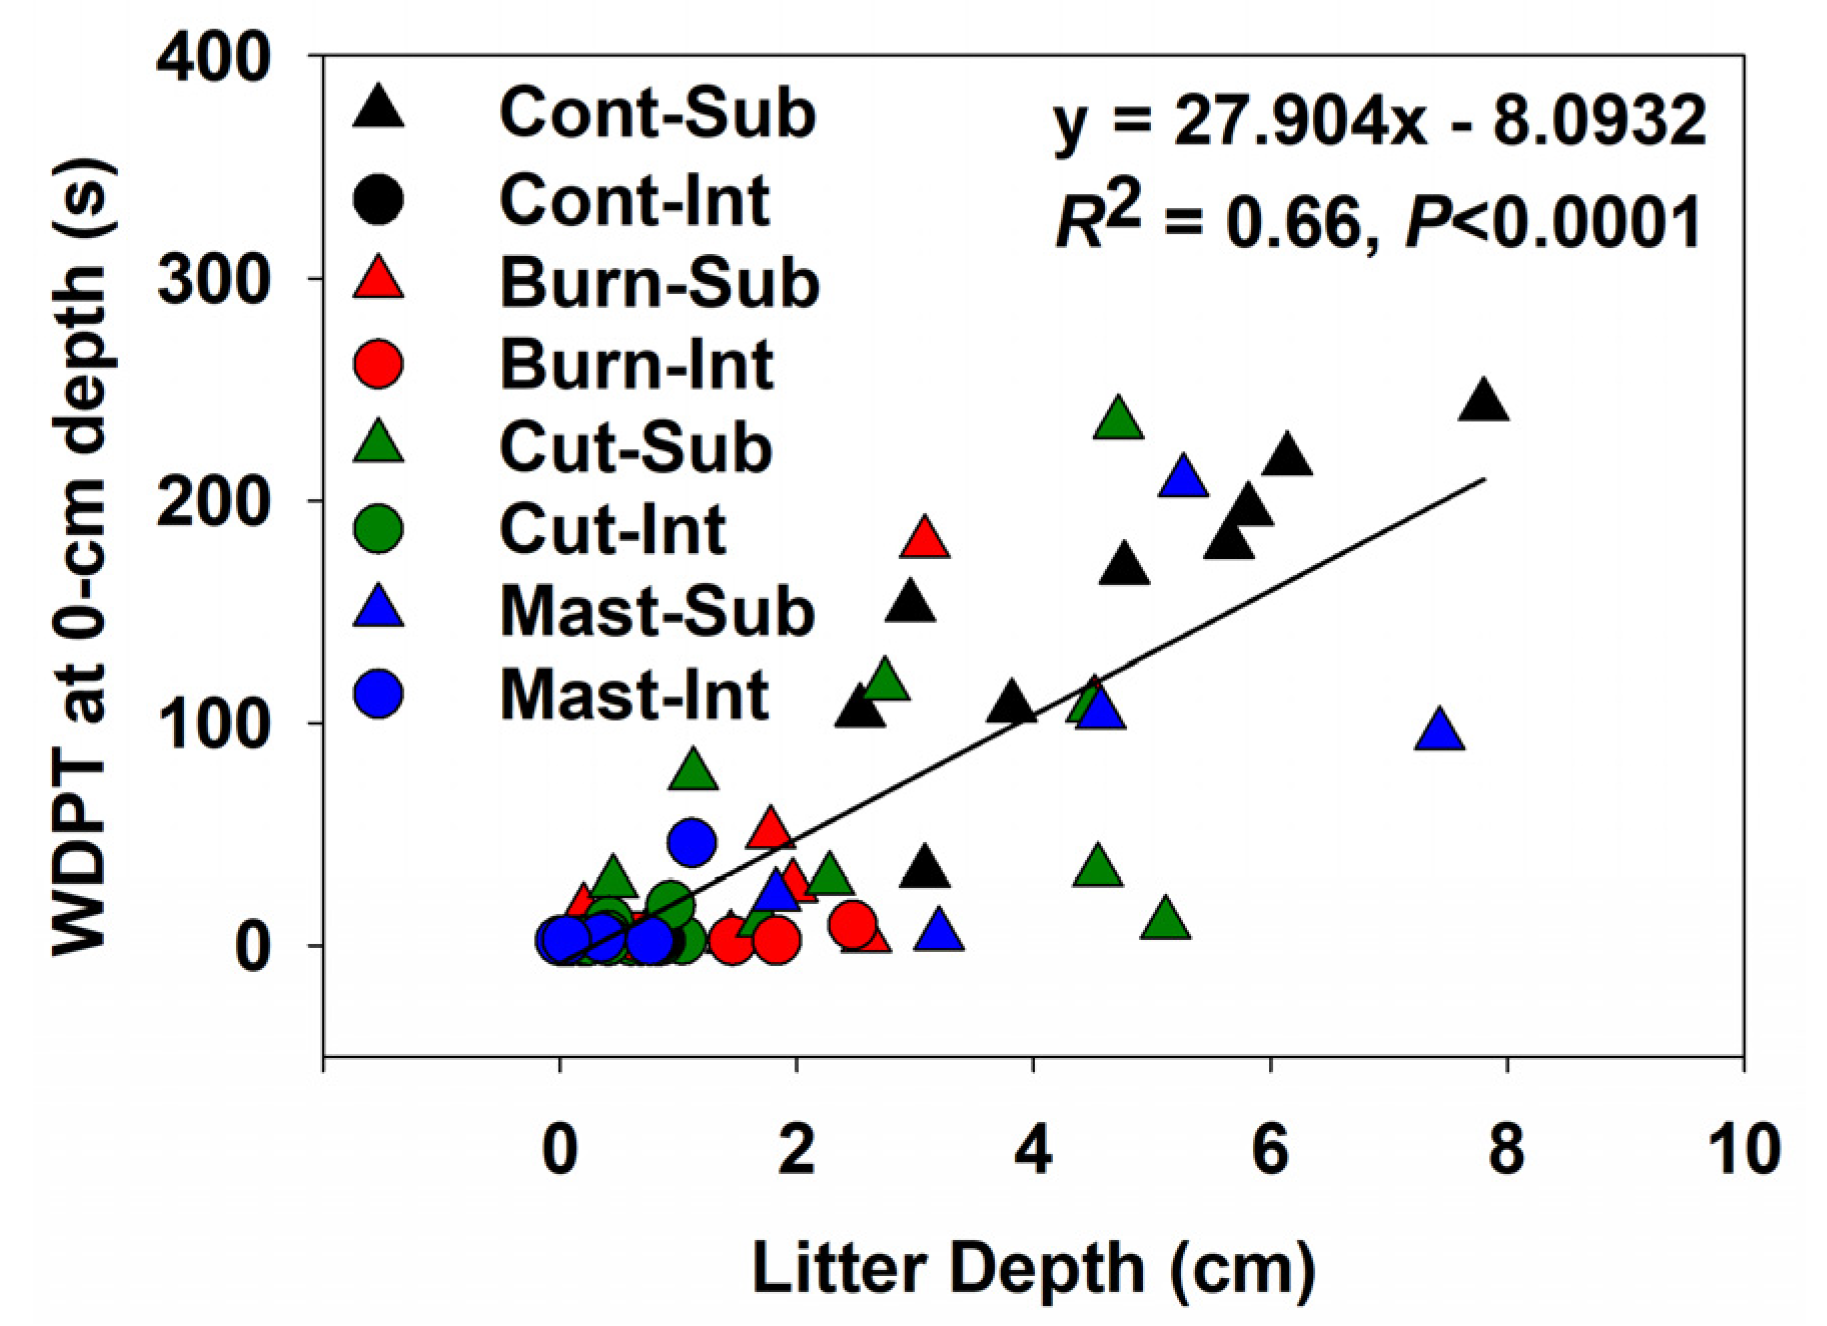
The primary effects of tree removal on the ground surface conditions and soil hydrologic properties at the total transect level were reductions in the bare interspace and strong SWR occurrence within the burned areas. The substantial increases in the grass canopy cover within the burned areas facilitated reduced bare interspace and increased vegetated interspace occurrences at both sites (Table 4). However, with few exceptions, measures of ground cover were statistically similar across the treatments at a site (Table 4). Total transect litter depth was different for untreated and treated areas solely for the burn at Onaqui. The litter depths in all the treatment areas at both sites were greatest over the first 0.5–1.0 m distance from trees, then declined through the subcanopy and into the transition zone, and reached a minimum within the intercanopy (Figure 7). The WDPTs for 0-cm depth followed similar trends as the litter depths, generally declining with the distance from the tree bases across all treatments at both sites (Figure 8). Soils were wettable at 1-, 2-, and 3-cm depths for nearly all the sample points along transects in all treatments and therefore only the WDPTs for 0-cm depth are presented (Table 4, Table 5 and Table 6). The total transect WDPTs and the occurrence of strong SWR for 0-cm depth were less in the burn treatments relative to the untreated areas at both sites, whereas the same measures in mechanical treatments were generally similar to the untreated and burned areas at a site (Table 4). The declines in strong SWR in the burned treatments had no significant impact on the total transect K(h) and relative infiltration (Table 4). Although the treatment effects on the SWR were limited, WDPT increased with increasing litter depth (Figure 9), and the litter depths within the subcanopies generally were greatest in the controls and higher in the mechanical, as opposed to the burn, treatments (Figure 7 and Figure 9). The significant relationship between the WDPT and litter depth along transects was largely driven by strong WDPT occurrence in the subcanopy where litter depth was also greatest. There were no significant relationships in the SWR with soil water content and TOC at the total transect level. TOC was generally greater at Onaqui than Marking Corral across all treatment areas (Table 4), but there were no significant differences in the total transect TOC across treatments at a site. The soil water content was uniformly low (<0.04 m3·m−3) across all the sample points along all transects at both sites.

4.3. Spatial Patterns in the Ground Cover and Soil Hydrologic Properties at the Patch Scale

The patch scale patterns in the ground surface conditions and soil hydrologic properties in untreated areas were characteristic of pinyon and juniper woodlands with an extensive depauperate intercanopy and isolated litter-covered tree patches (Figure 1a). The intercanopy patches within the untreated areas were mostly (~80–95%) comprised of interspace microsites, the majority of which was bare interspace (Table 5 and Table 6). The intercanopy bare ground in untreated areas averaged 52% at Marking Corral and 76% at Onaqui and these areas had thin litter layers (Table 5 and Table 6). Nearly 100% of the intercanopy sample points within the control areas had wettable soil, yet untreated intercanopy patches exhibited the lowest K(h) values, typical of degraded bare patches. In contrast to intercanopies, the subcanopy patches in the control areas at both sites were nearly 100% covered with a 2- to 8-cm thick litter layer underlain by strongly water repellent soils (Figure 9) and yielded K(h) values consistent with some of the highest measured across all treatments (Table 5 and Table 6). The effect of the SWR on the infiltration into mineral soil in the untreated subcanopy patches is evident in the low relative infiltration values for these sample locations (Table 5 and Table 6).
The effects of tree removal on the patch scale ground surface conditions and soil hydrologic properties were most evident on transects within the burned treatments at both sites. The prescribed fire treatments yielded generally similar ground surface conditions and soil hydrologic properties across intercanopy and subcanopy patches (Table 5 and Table 6). Burning increased the occurrence of vegetated interspace and the amount of litter and woody debris within intercanopies (Table 5 and Table 6). The two-fold increases in the litter and woody debris within intercanopies resulted in a similar total ground cover for the burned intercanopy and subcanopy patches at both sites (Table 5 and Table 6). The improved ground surface conditions within the burned intercanopy patches did not increase the relative infiltration but did increase the intercanopy K(h) at both sites (Table 5 and Table 6). For subcanopy patches, burning appeared to reduce WDPTs (Figure 8 and Figure 9), but differences in burned versus control WDPT measures in subcanopy patches were only statistically different at Marking Corral (Table 5). The occurrence of strong SWR was less in the burned, as opposed to the control, subcanopy patches at both sites, yielding greater occurrences of wettable surface soils within the burned treatments (Table 5 and Table 6). However, the burned treatment had no significant impact on the subcanopy K(h) and relative infiltration, owing perhaps to the persistence of slight and some strong SWR occurrences (Table 5 and Table 6). Regardless, burning improved the overall patch-scale ground surface conditions and soil hydrologic properties through increases in the wettable soil occurrence and improved intercanopy K(h).
In contrast to the prescribed burning, mechanical treatments had a more limited impact on the inherent differences in the ground surface conditions and soil hydrologic properties for the intercanopy and subcanopy patches. Mechanical treatments were effective at reducing the bare interspace occurrence within intercanopy patches at Onaqui (Table 6). Cutting at Marking Corral increased the basal cover in intercanopy patches, but the ground cover measures by the patch type in all other cases were similar for the untreated areas and mechanical treatments across both sites (Table 5 and Table 6). Cutting at Marking Corral yielded lower WDPTs and reduced the occurrence of strong SWR within the subcanopy patches (Table 5), but mechanical treatments at Onaqui had no significant effect on patch-scale WDPTs or strong SWR occurrence (Table 6). The K(h) was generally greater for subcanopy patches in the mechanical treatments, as opposed to the control, at both sites, but the values were not statistically different across the treatments (Table 5 and Table 6). Likewise, the relative infiltration by patch type was statistically similar for untreated and mechanical treatment areas at both sites (Table 5 and Table 6).

5. Discussion

5.1. Treatment Effects on Hillslope-Scale Vegetation and Ground Cover

The hillslope cover responses in this long-term study demonstrate the challenges of re-establishing sagebrush steppe vegetation in late-succession mid-elevation woodlands through tree removal treatments [58,62]. As expected, prescribed fire reduced the already limited sagebrush cover and density at the sites (Figure 4a and Figure 5c). Although the sagebrush cover and/or density slightly improved with time in the burn treatments, the cover and densities 13 years post-treatment were less than the pre-fire values at Marking Corral and remained low at Onaqui. We anticipate sagebrush to re-establish at and possibly above pre-treatment levels over time in the burn treatment at Marking Corral given the initial levels and a general upward trajectory since treatment (Figure 5c) [31,72,73]. The persistent low levels of sagebrush in the burn at Onaqui (Figure 4a and Figure 5c) suggest the re-establishment of sagebrush as the dominant vegetation at that site is likely prolonged. The literature suggests that sagebrush recovery on burned intact sagebrush communities can take as long 35–50 years [31,72,73,104], so follow up measures are required to make any conclusions for Onaqui. Overall, the shrub cover in mechanical treatments exhibited an upward trend over the course of this study (Table 2 and Table 3). The sagebrush cover in the mechanical treatments at both sites was fairly stable across the 9th and 13th years post-treatment (Figure 4a), but the sagebrush density showed an increasing trend over this period in all mechanical treatments except at Marking Corral (Figure 5c). That site had the highest pre-treatment sagebrush density across all treatments. The stable to increasing trends in sagebrush densities in the mechanical treatments demonstrate the effectiveness of mechanical tree removal to maintain and gradually recruit sagebrush over time [58]. Further increases in sagebrush cover are expected in the mechanical treatments in coming years based on the density trajectories. Overall, the trends in sagebrush cover and density in this study are similar with those in other studies, showing the influence of low initial sagebrush levels on post-treatment responses and a greater retention and/or recruitment in mechanical, as opposed to fire, treatments through 3 to 10 plus years [58,64]. Follow up tree removal after mechanical treatments is typically necessary after 30–50 years to prevent tree re-colonization [58,105]. Estimates in the literature indicate that the re-establishment of tree dominance following mechanical and fire treatments occurs in about 50 years and 100 years, respectively [71]. The juvenile tree densities in our study trend upwards for mechanical treatments and are stable to slightly increasing for burn treatments (Figure 5b). More time is required to compare the longer-term effects of treatments to limit tree re-colonization and the influence of tree recruitment on sagebrush and herbaceous vegetation [58,60,71].
Our results also reflect the complexities of herbaceous cover dynamics in response to tree removal in sagebrush steppe and the difficulty in determining point-in-time treatment success or failure [14,31,58,64,68]. The herbaceous canopy cover, mainly grasses, showed an increasing trend across all treatments over the first 9 years of this study, and, with few exceptions, was greater 13 years post-treatment relative to the pre-treatment levels (Figure 4b). The enhanced grass cover contributed to substantial increases in the basal plant ground cover across all treatments at both sites and reduced bare ground in burn and mechanical areas at Marking Corral. The bare ground remained near 60% in the 13th year post-treatment in all treatments at the initially more degraded Onaqui site. Perennial bunchgrasses were a substantial component of herbaceous cover increases in the 9th and 13th years post-treatment at both sites (Figure 4b,c). Perennial grass cover is an indicator of treatment success [31,32,33], and plays a vital role in limiting cheatgrass cover [57,62,68,106], buffering runoff and erosion rates [19,81,82,83], and provisioning forage for wildlife and domestic herbivores [3]. In our study, perennial bunchgrasses were the dominant herbaceous cover in the intercanopy areas between trees by the 9th and 13th years post-treatment. In contrast, subcanopy areas within burned areas at both sites were dominated by cheatgrass cover in the 9th [34] and 13th years after treatment. Similar observations were reported by Fernelius et al. [107]. That study attributed the cheatgrass dominance in burned subcanopy areas to the SWR effects on soil resources and invasibility. Similar trends in the post-fire SWR and/or cheatgrass responses under the canopies of pinyon and juniper trees were also reported by Madsen et al. [98], O’Connor et al. [108], and Davies et al. [109]. We attribute the cheatgrass dominance in subcanopy areas post-fire in this study to the increased bare area [83], ample nutrient availability on these fertile islands, and the effects of the SWR on post-fire vegetation establishment, as described by Fernelius et al. [107]. Incidentally, cheatgrass cover was observed in subcanopy areas within the mechanical treatments in the 13 years post-treatment but was minor relative to levels in the burned treatments (Figure 4d). The thick litter layer and existing perennial grasses in subcanopy areas within the mechanical treatments buffered SWR effects on infiltration [61] and, in addition to limiting the bare invasible area [110,111], potentially reduced the effects of the SWR on the cheatgrass invasibility relative to burned areas [61,98,107].
Overall, all treatments were effective at tree removal and re-establishing ample perennial bunchgrass cover, but burning also created the islands of cheatgrass in previously tree-covered patches at least by the ninth year post-treatment [34]. These islands remained in the 13th year post-treatment and the likelihood of their further persistence is unknown. Perennial bunchgrasses, once established, can effectively compete with cheatgrass for soil water and resources [112,113], but predicting the long-term outcomes of competition and varying environmental conditions under such a patchwork structure of dominance is difficult [14,31,58,68]. The within treatment herbaceous cover responses at the sites in this study are generally consistent with others evaluating the short- and long-term impacts of tree removal at mid-elevations, including a rapid increase in the perennial bunchgrass cover post-fire, a slower re-establishment of perennial bunchgrasses in mechanical treatments, and more cheatgrass in burned, as opposed to mechanical treatments [13,14,31,32,33,58,62,64,108].

5.2. Treatment Effects on Patterns in Surface Conditions and Soil Hydrologic Properties

Thirteen years after treatment, the spatial patterns in surface conditions and the soil hydrologic properties were transitioning, but the tree transects still reflected the relict microsite effects from pre-treatment conditions (Table 4). That is, conditions in the subcanopy and intercanopy areas clearly reflect legacy pre-treatment conditions [61,109], but changes in the fine scale microsite distributions and associated soil hydrologic properties were evident at the patch scale (Table 5 and Table 6). Greater increases in grass cover in the burn versus mechanical treatments at both sites were substantial enough to reduce the bare interspace area at the total transect level for burned treatments relative to their respective controls (Table 4). The bare interspace area in mechanical treatments was not statistically different from that in untreated areas, but it was statistically similar to the same measure in burned treatments in most cases (Table 4). This suggests that the bare conditions in areas treated mechanically are declining, albeit more slowly than those in the burn treatments. The delay may be partially due to competition for resources between residual shrubs and new and established grasses in the mechanical treatment [36,58]. The shrub cover was two- to three-fold less in the burn relative to the mechanical treatments in the 13th year after tree removal (Table 2 and Table 3). The treatment effects on the SWR at the total transect level were likewise mainly limited to the burn treatments (Table 4), perhaps owing to generally less litter on subcanopy microsites in burned areas (Figure 9). The SWR occurrence and persistence are highly variable spatially and temporally for the unburned and burned conditions [30,46,49,114,115,116,117,118,119,120]. Although spatially restricted to the areas under tree canopies (subcanopy) at our study sites, the surface SWR persistence as measured by the WDPT exhibited some temporal decline in the burns, particularly at Marking Corral [34,81]. The SWR on semi-arid landscapes is strongest under thick litter layers [18,46,47,48,49,85,86,87] and is often transposed downward in the soil profile during burning [120,121,122]. A subsequent decline in the transitory behavior of the SWR at the soil surface and at depth over time post-fire have been reported in numerous field studies [46,48,114,118,120,123]. Repellency at 1–3 cm soil depth in the current study was negligible. However, Pierson et al. [18] previously reported the SWR occurrence over a 0–5 cm depth for pre-treatment conditions in all treatment areas at our study sites. The more limited SWR in the 13th year for both untreated and treated areas suggests that the treatment effects on repellency may have been partially masked by an inherent naturally occurring temporary decline in the repellency strength, common in sagebrush steppe [46,48,49]. Nevertheless, burning appears to have reduced the surface SWR strength and the distribution of strong soil repellency at the total transect level at both sites in this study (Table 4). The SWR strength and percentage area of strong repellency in most cases were similar for the burned and mechanical treatment areas at the total transect level for both sites (Table 4). This suggests that, as with the bare interspace area, the SWR strength is generally declining in the mechanical treatments, but differences in the SWR measures for mechanical and untreated areas were not statistically different due to a high variability (Table 4).
The tree transect data at the patch scale suggest that the tree removal treatments improved surface conditions and increased K(h) within intercanopy areas representing about 75% of the domain at each site. The strongest evidence for this transition is demonstrated for the burn treatments. The aforementioned fire-induced shifts from woodland to herbaceous-dominated vegetation effectively reduced the bare interspace area and increased vegetated interspace area at both sites (Table 5 and Table 6). Likewise, the ground cover generally increased in intercanopy areas following burning. These shifts in the dominant vegetation type and surface conditions enhanced hydrologic function assessed as K(h), as seen in Table 5 and Table 6. Such changes in hydrologic function are typical with increases in herbaceous cover following tree removal practices on woodlands [16,19,21,78]. Mechanical treatments generally reduced the bare interspace microsite area within intercanopies, but the effects were only significant at Onaqui (Table 5 and Table 6). The bare interspace in the mechanical treatment at Marking Corral was within 5% of that measured at Onaqui however. Although, the mechanical treatments did not definitively improve the intercanopy K(h), it is worth noting that these areas contained more shrub cover and shrub microsite area than burn treatments (Table 2 and Table 3, Table 5 and Table 6). The infiltration rates are higher on shrub microsites than in bare interspaces on sagebrush rangelands due to lower bulk densities and macropores in soils under shrub canopies [40,47,48,49,50]. Pierson et al. [18] found that the infiltration rates during rainfall simulations were 1.3- to 1.9-fold greater for untreated shrub versus untreated interspace microsites at Marking Corral and Onaqui. The K(h) measures in the intercanopy areas in this study were mainly located in vegetated and bare interspaces, and, therefore, may not fully represent the full suite of conditions within intercanopies. Given the increased shrub cover and/or reductions in the bare interspaces at a site, mechanical treatments induced the intercanopy surface conditions that facilitate enhanced hydrologic function [16,19,20,21,78,82]. The K(h) measured in intercanopy areas within mechanical treatments was similar to that of burned intercanopy areas and was generally greater, although not statically different from, the untreated intercanopy areas (Table 5 and Table 6). As discussed above for the total transect data, this suggests that intercanopies within mechanical treatments are improving in terms of surface conditions and hydrologic function, but these transformations are lagging relative to changes in the burned treatments.
Limited improvements in surface conditions and hydrologic function as measured in subcanopy areas likely masks the overall hydrological improvements. There were no differences in microsite distributions and few differences in the ground cover for treated versus untreated subcanopy areas. However, litter cover was generally less for the burned subcanopy areas than in untreated and mechanical treatment areas (Figure 9). The occurrence of strong SWR in subcanopy areas was reduced by the burned treatment at both sites but was unaffected by the mechanical treatments except at Marking Corral (Table 5 and Table 6). None of the treatment-induced changes in the surface cover and SWR in subcanopy areas improved relative infiltration. It is likely that infiltration experiments over a larger spatial scale within subcanopies would activate macropores and may yield different results [85,87,98]. However, these microsites only represent about 25% of the study area and are perhaps less of a concern than the more extensive intercanopy domain (Table 1). Improvements in the ground surface conditions and/or hydrologic soil properties across the remaining 75% of the area (intercanopies) in each treatment suggest both burning and mechanical tree removal effectively improved the site surface hydrology and facilitated a trajectory toward improved hydrologic function given more time.

5.3. Implications for Cross-Scale Ecohydrologic Impacts of Tree Removal

Our soil hydrologic measurements in context with companion studies [34,81,82] demonstrate prescribed fire tree removal practices can improve hydrologic function on mid- to late-succession woodland-encroached sites over time. We found that increases in the herbaceous cover over a 13 year period improved point-scale measured K(h) within intercanopy areas that make up about 75% of the total area at both our sites (Table 5 and Table 6). These areas are the primary source for runoff generation on woodland-encroached sagebrush sites [16,17,18,19,55,78]. Extensive bare intercanopy area structurally connects sources of runoff and sediment along woodland hillslopes and facilitates downslope losses of water and ecologically important surface soil [16,19,20,78]. Therefore, limiting the runoff generation and connectivity of runoff sources within intercanopies is paramount to improving hydrologic function and reducing soil erosion in woodland Phases 2 and 3 [19,20,21]. Earlier studies (9 years post-treatment) of our sites by Williams et al. [34,81] and Nouwakpo et al. [34] found that increased herbaceous cover following burning improved infiltration of artificially applied rainfall in interspaces and throughout intercanopy areas. These studies determined that reduced runoff from interspaces [34] limited the downslope connectivity of runoff and sediment sources [82] and thereby improved hydrologic function and reduced soil erosion rates across fine to coarse scales [81]. The experimental methods in these studies aggregated the effects of the above ground (interception), ground surface (interception and storage), and below ground (soil properties/K(h)) factors on hydrologic responses. The current study more specifically evaluates the treatment effects on K(h) within intercanopies, although above ground factors (e.g., herbaceous cover) likely influenced our infiltrometer experiments indirectly. Regardless, the collective studies demonstrate that burning can effectively improve hydrologic function on mid-elevation Phase 2 to Phase 3 woodlands over the first 9 years to 13 years post-treatment through the recruitment of intercanopy herbaceous cover, reduction of bare ground, and enhanced infiltration. To our knowledge, there are no comparable collective long-term studies of hydrologic and erosion responses to tree removal by fire on woodland-encroached sagebrush steppe.
Results from the mechanical treatments contrast with the few similar longer-term studies [16,21] and indicate that the valuation of hydrologic improvements with cutting and mastication may require patience. Substantial enhancements of the herbaceous cover in mechanical treatments had minor impacts on the ground surface conditions and soil hydrologic properties assessed in this study (Table 4, Table 5 and Table 6). Similarities in the ground surface conditions and soil hydrologic properties between the mechanical treatment areas and hydrologically enhanced burned treatment areas at our sites suggest that cutting and mastication are having a delayed effect on hydrologic function. A companion study of our sites 9 years post-treatment found that mechanical treatments increased herbaceous cover but had a limited impact on the bare ground, infiltration, and soil loss [61]. The lone exception was that downed trees tended to trap overland flow and reduce downslope runoff and sediment transport. Experiments in that study did not isolate treatment effects on the K(h), as done in the current study. Our results are however consistent and indicate that improved vegetation, ground cover, and associated hydrologic function can take more than 10–13 years following mechanical tree removal. The fine scale of our measurements, however, does not take into account the full potential source and sink arrangements along a hillslope [124,125,126,127], and, on that basis, a broad interpretation of our results across scales is not suggested. Regardless, the delayed hydrological improvements at our sites contrast with those from the studies by Pierson et al. [16] and Roundy et al. [21]. Pierson et al. [16] found that an enhanced herbaceous cover 10 years after juniper cutting significantly reduced intercanopy runoff and soil erosion during artificially applied rainfall experiments. That study found that cover increases in intercanopy areas limited runoff generation and concentration of overland flow, resulting in negligible soil erosion. In contrast, bare areas in an adjacent untreated woodland generated ample runoff that formed rills with erosion rates 15-fold greater than those measured in the treated woodland. Roundy et al. [21] found that tree removal by chaining paired with a seeding treatment increased intercanopy vegetation cover from 5% to more than 40% over 3 years. That study reported litter cover of approximately 15% in untreated areas and near 50% in treated areas within 3 years post-treatment. The intercanopy runoff and sediment delivery during natural rainfall at the patch scale were five-fold and 10-fold less the fifth year after treatment relative to the 5 year averages for untreated conditions. Collectively, our studies across sites and treatments and the others cited here clearly demonstrate that mechanical tree removal in sagebrush steppe can have favorable effects on hydrologic function, but that desired responses can take from 3 to more than 13 years. We suggest that evaluation of treatment effectiveness be tempered with an understanding of the measurement scale applied and the fundamental system regulating ecohydrologic processes [65].

6. Summary and Conclusions

Our long-term research of two mid-elevation Phase 2–3 woodlands demonstrates tree removal by prescribed fire and mechanical methods can effectively increase sagebrush steppe vegetation and thereby re-establish or set forth a trajectory toward associated spatial patterns in surface conditions and soil hydrologic properties. All tree removal treatments effectively removed mature tree cover and enhanced the understory vegetation attributes typical of sagebrush steppe. Burning reduced sagebrush cover but was effective in re-establishing ecologically important perennial bunchgrass cover. Sagebrush cover is slowly increasing in burned treatments but is particularly lagging at the initially more degraded Onaqui site. The enhanced herbaceous cover in burned intercanopies reduced bare interspace and improved K(h), indicating burning improved hydrologic function for conditions representing much of the total area at each site. Much of the subcanopy area was converted to patches of cheatgrass and exhibited similar infiltration rates as pre-treatment. However, burning tree islands either reduced SWR strength or the percent area of strongly water repellent soil, indicating potentially more wettable soil conditions throughout subcanopy areas. Our tension infiltrometer experiments may not fully capture this effect on infiltration given the footprint of the measurement and that the methodology limits macropore flow. Mechanical treatments retained or increased intercanopy sagebrush and enhanced herbaceous cover. The intercanopy ground surface conditions and soil hydrologic properties in mechanical treatments were generally similar to those in burned treatments but were also not statistically different from untreated areas in most cases. This suggests that the vegetation and ground surface conditions in mechanical treatments are on a trajectory toward significantly improved hydrologic function given more time. The ground surface conditions and soil hydrologic properties on tree islands in mechanical treatments were similar to those in burned and untreated areas, likewise suggesting that more time is needed for substantial changes in the surface hydrology on subcanopy microsites. Overall, the treatments over the 13-year period effectively enhanced the vegetation, ground surface conditions, and attributes that promote infiltration and limit the runoff generation for intercanopy areas, representing approximately 75% of total area at the sites.
We anticipate that cover and hydrologic function will continue to change in all treatments on both sites with time. Follow up experiments are required to make any conclusions regarding the mechanical treatments. Likewise, the persistence of cheatgrass in the burned areas at both sites increases the risk of wildfire and potential conversion of those areas to an annual grassland. The likelihood of such a transition is difficult to predict given the extensive cover of perennial grasses in the adjacent intercanopies, and, as with the mechanical treatment areas, requires continued monitoring. Lastly, the nuances in treatment effects across sites, treatment types, and measurement scales in this long-term research demonstrate the complexity in predicting the ecohydrologic responses to tree removal in mid-elevation late-succession woodlands and highlight the need and value of multi-scale long-term studies and monitoring across the vast domain in which woodland encroachment occurs.

Author Contributions

Conceptualization and Experimental Design, C.J.W., J.C.J., F.B.P., C.S.B., P.R.K.; Data Collection and Analyses, C.J.W., J.C.J., C.S.B., V.O.P., P.R.K.; Writing—Original Draft Preparation, C.J.W., J.C.J., F.B.P., C.S.B., V.O.P., P.R.K., S.K.N.; Writing—Review and Editing, C.J.W., J.C.J., F.B.P., C.S.B., V.O.P., P.R.K., S.K.N. All authors have read and agreed to the published version of the manuscript.

Funding

This paper is Contribution Number 137 of the Sagebrush Steppe Treatment Evaluation Project (SageSTEP, www.sagestep.org), funded by the US Joint Fire Science Program; the US Department of Interior, Bureau of Land Management; and the US National Interagency Fire Center. Additional funding was provided by the US Department of Agriculture, Agricultural Research Service. This research was a contribution from the Long-Term Agroecosystem Research (LTAR) network. LTAR is supported by the US Department of Agriculture.

Acknowledgments

The authors thank the US Department of Interior, Bureau of Land Management for the implementation of the land management treatments and site access in collaboration with the SageSTEP study. The authors thank Katia Sanchez for contributions to the field data collection. USDA is an equal opportunity provider and employer. Mention of a proprietary product does not constitute endorsement by USDA and does not imply its approval to the exclusion of the other products that may also be suitable.

Conflicts of Interest

The authors declare no conflicts of interest.

References

  1. Noss, R.F.; LaRoe, E.T.; Scott, A.C. Endangered Ecosystems of the United States: A Preliminary Assessment of Loss and Degradation; National Biological Service Report 28; US Department of the Interior, National Biological Service: Washington, DC, USA, 1995.
  2. Suring, L.H.; Rowland, M.M.; Wisdom, M.J. Identifying species of conservation concern. In Habitat Threats in the Sagebrush Ecosystem: Methods of Regional Assessment and Applications in the Great Basin; Wisdom, J.J., Rowland, M.M., Suring, L.H., Eds.; Alliance Communications Group: Lawrence, KS, USA, 2005; pp. 150–162. [Google Scholar]
  3. Davies, K.W.; Boyd, C.S.; Beck, J.L.; Bates, J.D.; Svejcar, T.J.; Gregg, M.A. Saving the sagebrush sea: An ecosystem conservation plan for big sagebrush plant communities. Biol. Conserv. 2011, 144, 2573–2584. [Google Scholar] [CrossRef] [Green Version]
  4. Miller, R.F.; Knick, S.T.; Pyke, D.A.; Meinke, C.W.; Hanser, S.E.; Wisdom, M.J.; Hild, A.L. Characteristics of sagebrush habitats and limitations to long-term conservation. In Greater Sage-Grouse, Ecology and Conservation of a Landscape Species and Its Habitats (Studies in Avian Biology, Book 38); Knick, S.T., Connelly, J.W., Eds.; University of California Press: Berkeley, CA, USA, 2011; pp. 145–184. [Google Scholar]
  5. Romme, W.H.; Allen, C.D.; Bailey, J.D.; Baker, W.L.; Bestelmeyer, B.T.; Brown, P.M.; Eisenhart, K.S.; Floyd, M.L.; Huffman, D.W.; Jacobs, B.F.; et al. Historical and modern disturbance regimes, stand structures, and landscape dynamics in pinon-juniper vegetation of the western United States. Rangel. Ecol. Manag. 2009, 62, 203–222. [Google Scholar] [CrossRef] [Green Version]
  6. Miller, R.F.; Chambers, J.C.; Evers, L.B.; Williams, C.J.; Snyder, K.A.; Roundy, B.A.; Pierson, F.B. The Ecology, History, Ecohydrology, and Management of Pinyon and Juniper Woodlands in the Great Basin and Northern Colorado Plateau of the Western United States; General Technical Report RMRS-GTR-403; US Department of Agriculture, Forest Service, Rocky Mountain Research Station: Fort Collins, CO, USA, 2019; p. 284.
  7. Miller, R.F.; Wigand, P.E. Holocene changes in semiarid pinyon-juniper woodlands. Response to climate, fire, and human activities in the US Great Basin. BioScience 1994, 44, 465–474. [Google Scholar] [CrossRef]
  8. Miller, R.F.; Tausch, R.J. The role of fire in juniper and pinyon woodlands: A descriptive analysis. In Proceedings of the Invasive Species Workshop: The Role of Fire in the Control and Spread of Invasive Species, Fire Conference 2000: The First National Congress on Fire Ecology, Prevention, and Management, Tallahassee, FL, USA, 27 November–1 December 2000; Galley, K.E.M., Wilson, T.P., Eds.; Tall Timbers Research Station: Tallahassee, FL, USA, 2001; pp. 15–30. [Google Scholar]
  9. Van Auken, O.W. Causes and consequences of woody plant encroachment into western North American grasslands. J. Environ. Manag. 2009, 90, 2931–2942. [Google Scholar] [CrossRef] [PubMed]
  10. Eldridge, D.J.; Bowker, M.A.; Maestre, F.T.; Roger, E.; Reynolds, J.F.; Whitford, W.G. Impacts of shrub encroachment on ecosystem structure and functioning: Towards a global synthesis. Ecol. Lett. 2011, 14, 709–722. [Google Scholar] [CrossRef]
  11. Archer, S.R.; Andersen, E.M.; Predick, K.I.; Schwinning, S.; Steidl, R.J.; Woods, S.R. Woody plant encroachment: Causes and consequences. In Rangeland Systems: Processes, Management, and Challenges; Briske, D.D., Ed.; Springer Nature: Cham, Switzerland, 2017; pp. 25–84. [Google Scholar]
  12. Miller, R.F.; Svejcar, T.J.; Rose, J.A. Impacts of western juniper on plant community composition and structure. J. Range Manag. 2000, 53, 574–585. [Google Scholar] [CrossRef]
  13. Miller, R.F.; Ratchford, J.; Roundy, B.A.; Tausch, R.J.; Hulet, A.; Chambers, J. Response of conifer-encroached shrublands in the Great Basin to prescribed fire and mechanical treatments. Rangel. Ecol. Manag. 2014, 67, 468–481. [Google Scholar] [CrossRef] [Green Version]
  14. Roundy, B.A.; Miller, R.F.; Tausch, R.J.; Young, K.; Hulet, A.; Rau, B.; Jessop, B.; Chambers, J.C.; Eggett, D. Understory cover responses to piñon-juniper treatments across tree dominance gradients in the Great Basin. Rangel. Ecol. Manag. 2014, 67, 482–494. [Google Scholar] [CrossRef] [Green Version]
  15. Knick, S.T.; Connelly, J.W. Greater Sage-Grouse, Ecology and Conservation of a Landscape Species and Its Habitats (Studies in Avian Biology, Book 38); University of California Press: Berkeley, CA, USA, 2011; p. 664. [Google Scholar]
  16. Pierson, F.B.; Bates, J.D.; Svejcar, T.J.; Hardegree, S.P. Runoff and erosion after cutting western juniper. Rangel. Ecol. Manag. 2007, 60, 285–292. [Google Scholar] [CrossRef]
  17. Petersen, S.L.; Stringham, T.K. Infiltration, runoff, and sediment yield in response to western juniper encroachment in southeast Oregon. Rangel. Ecol. Manag. 2008, 61, 74–81. [Google Scholar] [CrossRef]
  18. Pierson, F.B.; Williams, C.J.; Kormos, P.R.; Hardegree, S.P.; Clark, P.E.; Rau, B.M. Hydrologic vulnerability of sagebrush steppe following pinyon and juniper encroachment. Rangel. Ecol. Manag. 2010, 63, 614–629. [Google Scholar] [CrossRef]
  19. Williams, C.J.; Pierson, F.B.; Al-Hamdan, O.Z.; Kormos, P.R.; Hardegree, S.P.; Clark, P.E. Can wildfire serve as an ecohydrologic threshold-reversal mechanism on juniper-encroached shrublands? Ecohydrology 2014, 7, 453–477. [Google Scholar] [CrossRef]
  20. Williams, C.J.; Pierson, F.B.; Robichaud, P.R.; Al-Hamdan, O.Z.; Boll, J.; Strand, E.K. Structural and functional connectivity as a driver of hillslope erosion following disturbance. Int. J. Wildland Fire 2016, 25, 306–321. [Google Scholar] [CrossRef] [Green Version]
  21. Roundy, B.A.; Farmer, M.; Olson, J.; Petersen, S.; Nelson, D.R.; Davis, J.; Vernon, J. Runoff and sediment response to tree control and seeding on a high soil erosion potential site in Utah: Evidence for reversal of an abiotic threshold. Ecohydrology 2017, 10, e1775. [Google Scholar] [CrossRef]
  22. Bradley, B.A.; Mustard, J.F. Comparison of phenology trends by land cover class: A case study in the Great Basin, USA. Glob. Chang. Biol. 2008, 14, 334–346. [Google Scholar] [CrossRef] [Green Version]
  23. Balch, J.K.; Bradley, B.A.; D’Antonio, C.M.; Gómez-Dans, J. Introduced annual grass increases regional fire activity across the arid western USA (1980–2009). Glob. Chang. Biol. 2013, 19, 173–183. [Google Scholar] [CrossRef]
  24. Knapp, P.A. Cheatgrass (Bromus tectorum L) dominance in the Great Basin desert. History, persistence, and influences to human activities. Glob. Environ. Chang. 1996, 6, 37–52. [Google Scholar] [CrossRef]
  25. Brooks, M.L.; D’Antonio, C.M.; Richardson, D.M.; Grace, J.B.; Keeley, J.E.; DiTomaso, J.M.; Hobbs, R.J.; Pellant, M.; Pyke, D. Effects of invasive alien plants on fire regimes. BioScience 2004, 54, 677–688. [Google Scholar] [CrossRef] [Green Version]
  26. Link, S.O.; Keeler, C.W.; Hill, R.W.; Hagen, E. Bromus tectorum cover mapping and fire risk. Int. J. Wildland Fire 2006, 15, 113–119. [Google Scholar] [CrossRef]
  27. Bradley, B.A.; Curtis, C.A.; Fusco, E.J.; Abatzoglou, J.T.; Balch, J.K.; Dadashi, S.; Tuanmu, M.N. Cheatgrass (Bromus tectorum) distribution in the intermountain western United States and its relationship to fire frequency, seasonality, and ignitions. Biol. Invasions 2018, 20, 1493–1506. [Google Scholar] [CrossRef] [Green Version]
  28. Pierson, F.B.; Williams, C.J.; Hardegree, S.P.; Weltz, M.A.; Stone, J.J.; Clark, P.E. Fire, plant invasions, and erosion events on western rangelands. Rangel. Ecol. Manag. 2011, 64, 439–449. [Google Scholar] [CrossRef]
  29. Wilcox, B.P.; Turnbull, L.; Young, M.H.; Williams, C.J.; Ravi, S.; Seyfried, M.S.; Bowling, D.R.; Scott, R.L.; Germino, M.J.; Caldwell, T.G.; et al. Invasion of shrublands by exotic grasses: Ecohydrological consequences in cold versus warm deserts. Ecohydrology 2012, 5, 160–173. [Google Scholar] [CrossRef]
  30. Williams, C.J.; Pierson, F.B.; Robichaud, P.R.; Boll, J. Hydrologic and erosion responses to wildfire along the rangeland-xeric forest continuum in the western US: A review and model of hydrologic vulnerability. Int. J. Wildland Fire 2014, 23, 155–172. [Google Scholar] [CrossRef]
  31. Miller, R.F.; Chambers, J.C.; Pyke, D.A.; Pierson, F.B.; Williams, C.J. A Review of Fire Effects on Vegetation and Soils in the Great Basin Region: Response and Ecological Site Characteristics; General Technical Report RMRS-GTR-308; US Department of Agriculture, Forest Service, Rocky Mountain Research Station: Fort Collins, CO, USA, 2013; p. 126.
  32. Chambers, J.C.; Miller, R.F.; Board, D.I.; Pyke, D.A.; Roundy, B.A.; Grace, J.B.; Schupp, E.W.; Tausch, R.J. Resilience and resistance of sagebrush ecosystems: Implications for state and transition models and management treatments. Rangel. Ecol. Manag. 2014, 67, 440–454. [Google Scholar] [CrossRef] [Green Version]
  33. Chambers, J.C.; Bradley, B.A.; Brown, C.S.; D’Antonio, C.; Germino, M.J.; Grace, J.B.; Hardegree, S.P.; Miller, R.F.; Pyke, D.A. Resilience to stress and disturbance, and resistance to Bromus tectorum L. invasion in cold desert shrublands of western North America. Ecosystems 2014, 17, 360–375. [Google Scholar] [CrossRef]
  34. Williams, C.J.; Pierson, F.B.; Nouwakpo, S.K.; Al-Hamdan, O.Z.; Kormos, P.R.; Weltz, M.A. Effectiveness of prescribed fire to re-establish sagebrush steppe vegetation and ecohydrologic function on woodland-encroached sagebrush rangelands, Great Basin, USA: Part I: Vegetation, hydrology, and erosion responses. Catena 2020, 185, 103477. [Google Scholar] [CrossRef]
  35. Keane, R.E.; Agee, J.K.; Fuĺ, P.; Keeley, J.E.; Key, C.; Kitchen, S.G.; Miller, R.; Schulte, L.A. Ecological effects of large fires on US landscapes: Benefit or catastrophe? Int. J. Wildland Fire 2008, 17, 696–712. [Google Scholar] [CrossRef]
  36. Roundy, B.A.; Young, K.; Cline, N.; Hulet, A.; Miller, R.F.; Tausch, R.J.; Chambers, J.C.; Rau, B. Piñon-juniper reduction increases soil water availability of the resource growth pool. Rangel. Ecol. Manag. 2014, 67, 495–505. [Google Scholar] [CrossRef] [Green Version]
  37. Miller, R.F.; Bates, J.D.; Svejcar, T.J.; Pierson, F.B.; Eddleman, L.E. Biology, Ecology, and Management of Western Juniper, Oregon State University Agricultural Experiment Station Technical Bulletin 152; Oregon State University, Oregon State University Agricultural Experiment Station: Corvallis, OR, USA, 2005; p. 82. [Google Scholar]
  38. Miller, R.F.; Tausch, R.J.; McArthur, E.D.; Johnson, D.D.; Sanderson, S.C. Age Structure and Expansion of Piñon-Juniper Woodlands: A Regional Perspective in the Intermountain West; Research Paper Report RMRS-RP-69; US Department of Agriculture, Forest Service: Fort Collins, CO, USA, 2008; p. 15.
  39. Eckert, R.E.; Peterson, F.F.; Meurisse, M.S.; Stephens, J.L. Effects of soil-surface morphology on emergence and survival of seedlings in big sagebrush communities. J. Range Manag. 1986, 39, 414–420. [Google Scholar] [CrossRef] [Green Version]
  40. Pierson, F.B., Jr.; Van Vactor, S.S.; Blackburn, W.H.; Wood, J.C. Incorporating small scale spatial variability into predictions of hydrologic response on sagebrush rangelands. In Variability in Rangeland Water Erosion Processes, Soil Science Soceity of America Special Publication 38; Blackburn, W.H., Pierson, F.B., Schuman, G.E., Zartman, R., Eds.; Soil Science Society of America: Madison, WI, USA, 1994; pp. 23–34. [Google Scholar]
  41. Seyfried, M.S.; Wilcox, B.P. Scale and the nature of spatial variability: Field examples having implications for hydrologic modeling. Water Resour. Res. 1995, 31, 173–184. [Google Scholar] [CrossRef]
  42. Seyfried, M.S.; Wilcox, B.P. Soil water storage and rooting depth: Key factors controlling recharge on rangelands. Hydrol. Process. 2006, 20, 3261–3275. [Google Scholar] [CrossRef]
  43. Ryel, R.J.; Leffler, A.J.; Ivans, C.; Peek, M.S.; Caldwell, M.M. Functional differences in water-use patterns of contrasting life forms in Great Basin steppelands. Vadose Zone J. 2010, 9, 548–560. [Google Scholar] [CrossRef] [Green Version]
  44. Blackburn, W.H. Factors influencing infiltration and sediment production of semiarid rangelands in Nevada. Water Resour. Res. 1975, 11, 929–937. [Google Scholar] [CrossRef] [Green Version]
  45. Johnson, C.W.; Gordon, N.D. Runoff and erosion from rainfall simulator plots on sagebrush rangeland. Trans. Am. Soc. Agric. Eng. 1988, 31, 421–427. [Google Scholar] [CrossRef]
  46. Pierson, F.B.; Robichaud, P.R.; Moffet, C.A.; Spaeth, K.E.; Williams, C.J.; Hardegree, S.P.; Clark, P.E. Soil water repellency and infiltration in coarse-textured soils of burned and unburned sagebrush ecosystems. Catena 2008, 74, 98–108. [Google Scholar] [CrossRef]
  47. Pierson, F.B.; Robichaud, P.R.; Moffet, C.A.; Spaeth, K.E.; Hardegree, S.P.; Clark, P.E.; Williams, C.J. Fire effects on rangeland hydrology and erosion in a steep sagebrush-dominated landscape. Hydrol. Process. 2008, 22, 2916–2929. [Google Scholar] [CrossRef]
  48. Pierson, F.B.; Moffet, C.A.; Williams, C.J.; Hardegree, S.P.; Clark, P.E. Prescribed-fire effects on rill and interrill runoff and erosion in a mountainous sagebrush landscape. Earth Surf. Process. Landf. 2009, 34, 193–203. [Google Scholar] [CrossRef]
  49. Williams, C.J.; Pierson, F.B.; Kormos, P.R.; Al-Hamdan, O.Z.; Hardegree, S.P.; Clark, P.E. Ecohydrologic response and recovery of a semi-arid shrubland over a five year period following burning. Catena 2016, 144, 163–176. [Google Scholar] [CrossRef] [Green Version]
  50. Pierson, F.B.; Williams, C.J. Ecohydrologic Impacts of Rangeland Fire on Runoff and Erosion: A literature Synthesis; General Technical Report RMRS-GTR-351; US Department of Agriculture, Forest Service, Rocky Mountain Research Station: Fort Collins, CO, USA, 2016; p. 110.
  51. Johnson, C.W.; Blackburn, W.H. Factors contributing to sagebrush rangeland soil loss. Trans. Am. Soc. Agric. Eng. 1989, 32, 155–160. [Google Scholar] [CrossRef]
  52. Seyfried, M.S. Infiltration patterns from simulated rainfall on a semiarid rangeland soil. Soil Sci. Soc. Am. J. 1991, 55, 1726–1734. [Google Scholar] [CrossRef]
  53. Mollnau, C.; Newton, M.; Stringham, T. Soil water dynamics and water use in a western juniper (Juniperus occidentalis) woodland. J. Arid Environ. 2014, 102, 117–126. [Google Scholar] [CrossRef]
  54. Davenport, D.W.; Breshears, D.D.; Wilcox, B.P.; Allen, C.D. Viewpoint: Sustainability of pinon-juniper ecosystems—A unifying perspective of soil erosion thresholds. J. Range Manag. 1998, 51, 231–240. [Google Scholar] [CrossRef]
  55. Petersen, S.L.; Stringham, T.K.; Roundy, B.A. A process-based application of state-and-transition models: A case study of western juniper (Juniperus occidentalis) encroachment. Rangel. Ecol. Manag. 2009, 62, 186–192. [Google Scholar] [CrossRef]
  56. Bates, J.D.; Svejcar, T.J. Herbaceous succession after burning of cut western juniper trees. West. North. Am. Nat. 2009, 69, 9–25. [Google Scholar] [CrossRef] [Green Version]
  57. Bybee, J.; Roundy, B.A.; Young, K.R.; Hulet, A.; Roundy, D.B.; Crook, L.; Aanderud, Z.; Eggett, D.L.; Cline, N.L. Vegetation response to piñon and juniper tree shredding. Rangel. Ecol. Manag. 2016, 69, 224–234. [Google Scholar] [CrossRef] [Green Version]
  58. Bates, J.D.; Svejcar, T.; Miller, R.; Davies, K.W. Plant community dynamics 25 years after juniper control. Rangel. Ecol. Manag. 2017, 70, 356–362. [Google Scholar] [CrossRef]
  59. Bates, J.D.; Davies, K.W.; Hulet, A.; Miller, R.F.; Roundy, B. Sage grouse groceries: Forb response to piñon-juniper treatments. Rangel. Ecol. Manag. 2017, 70, 106–115. [Google Scholar] [CrossRef] [Green Version]
  60. Davies, K.W.; Rios, R.C.; Bates, J.D.; Johnson, D.D.; Kerby, J.; Boyd, C.S. To burn or not to burn: Comparing reintroducing fire with cutting an encroaching conifer for conservation of an imperiled shrub-steppe. Ecol. Evol. 2019, 9, 9137–9148. [Google Scholar] [CrossRef] [Green Version]
  61. Williams, C.J.; Pierson, F.B.; Kormos, P.R.; Al-Hamdan, O.Z.; Nouwakpo, S.K.; Weltz, M.A. Vegetation, hydrologic, and erosion responses of sagebrush steppe 9 yr following mechanical tree removal. Rangel. Ecol. Manag. 2019, 72, 47–68. [Google Scholar] [CrossRef]
  62. Bates, J.D.; Sharp, R.N.; Davies, K.W. Sagebrush steppe recovery after fire varies by development phase of Juniperus occidentalis woodland. Int. J. Wildland Fire 2014, 23, 117–130. [Google Scholar] [CrossRef] [Green Version]
  63. Davies, K.W.; Bates, J.D. Restoring big sagebrush after controlling encroaching western juniper with fire: Aspect and subspecies effects. Restor. Ecol. 2017, 25, 33–41. [Google Scholar] [CrossRef]
  64. Williams, R.E.; Roundy, B.A.; Hulet, A.; Miller, R.F.; Tausch, R.J.; Chambers, J.C.; Matthews, J.; Schooley, R.; Eggett, D. Pretreatment tree dominance and conifer removal treatments affect plant succession in sagebrush communities. Rangel. Ecol. Manag. 2017, 70, 759–773. [Google Scholar] [CrossRef]
  65. Williams, C.J.; Snyder, K.A.; Pierson, F.B. Spatial and temporal variability of the impacts of pinyon and juniper reduction on hydrologic and erosion processes across climatic gradients in the western US: A regional synthesis. Water 2018, 10, 1607. [Google Scholar] [CrossRef] [Green Version]
  66. Chambers, J.C.; Maestas, J.D.; Pyke, D.A.; Boyd, C.S.; Pellant, M.; Wuenschel, A. Using resilience and resistance concepts to manage persistent threats to sagebrush ecosystems and greater sage-grouse. Rangel. Ecol. Manag. 2017, 70, 149–164. [Google Scholar] [CrossRef]
  67. Urza, A.K.; Weisberg, P.J.; Chambers, J.C.; Dhaemers, J.M.; Board, D. Post-fire vegetation response at the woodland–shrubland interface is mediated by the pre-fire community. Ecosphere 2017, 8, e01851. [Google Scholar] [CrossRef]
  68. Urza, A.K.; Weisberg, P.J.; Chambers, J.C.; Board, D.; Flake, S.W. Seeding native species increases resistance to annual grass invasion following prescribed burning of semiarid woodlands. Biol. Invasions 2019, 21, 1993–2007. [Google Scholar] [CrossRef]
  69. Davies, K.W.; Bates, J.D.; Boyd, C.S. Postwildfire seeding to restore native vegetation and limit exotic annuals: An evaluation in juniper-dominated sagebrush steppe. Restor. Ecol. 2019, 27, 120–127. [Google Scholar] [CrossRef]
  70. Ernst-Brock, C.; Turner, L.; Tausch, R.J.; Leger, E.A. Long-term vegetation responses to pinyon-juniper woodland reduction treatments in Nevada, USA. J. Environ. Manag. 2019, 242, 315–326. [Google Scholar] [CrossRef]
  71. Boyd, C.S.; Kerby, J.D.; Svejcar, T.J.; Bates, J.D.; Johnson, D.D.; Davies, K.W. The sage-grouse habitat mortgage: Effective conifer management in space and time. Rangel. Ecol. Manag. 2017, 70, 141–148. [Google Scholar] [CrossRef] [Green Version]
  72. Harniss, R.O.; Murray, R.B. 30 Years of Vegetal Change Following Burning of sagebrush-grass range. J. Range Manag. 1973, 26, 322–325. [Google Scholar] [CrossRef]
  73. Ziegenhagen, L.L.; Miller, R.F. Postfire recovery of two shrubs in the interiors of large burns in the intermountain West USA. West. North. Am. Nat. 2009, 69, 195–205. [Google Scholar] [CrossRef] [Green Version]
  74. Bates, J.D.; Davies, K.W.; Sharp, R.N. Shrub-steppe early succession following juniper cutting and prescribed fire. Environ. Manag. 2011, 47, 468–481. [Google Scholar] [CrossRef] [PubMed]
  75. Bates, J.D.; Davies, K.W. Seasonal burning of juniper woodlands and spatial recovery of herbaceous vegetation. For. Ecol. Manag. 2016, 361, 117–130. [Google Scholar] [CrossRef]
  76. Bates, J.D.; Davies, K.W. Effects of conifer treatments on soil nutrient availability and plant composition in sagebrush steppe. For. Ecol. Manag. 2017, 400, 631–644. [Google Scholar] [CrossRef]
  77. Davies, K.W.; Bates, J.D. Longer-term evaluation of sagebrush restoration after juniper control and herbaceous vegetation trade-offs. Rangel. Ecol. Manag. 2019, 72, 260–265. [Google Scholar] [CrossRef]
  78. Pierson, F.B.; Williams, C.J.; Hardegree, S.P.; Clark, P.E.; Kormos, P.R.; Al-Hamdan, O.Z. Hydrologic and erosion responses of sagebrush steppe following juniper encroachment, wildfire, and tree cutting. Rangel. Ecol. Manag. 2013, 66, 274–289. [Google Scholar] [CrossRef] [Green Version]
  79. Nouwakpo, S.K.; Williams, C.J.; Al-Hamdan, O.Z.; Weltz, M.A.; Pierson, F.; Nearing, M. A review of concentrated flow erosion processes on rangelands: Fundamental understanding and knowledge gaps. Int. Soil Water Conserv. Res. 2016, 4, 75–86. [Google Scholar] [CrossRef] [Green Version]
  80. Pierson, F.B.; Williams, C.J.; Kormos, P.R.; Al-Hamdan, O.Z. Short-term effects of tree removal on infiltration, runoff, and erosion in woodland-encroached sagebrush steppe. Rangel. Ecol. Manag. 2014, 67, 522–538. [Google Scholar] [CrossRef] [Green Version]
  81. Williams, C.J.; Pierson, F.B.; Nouwakpo, S.K.; Kormos, P.R.; Al-Hamdan, O.Z.; Weltz, M.A. Long-term evidence for fire as an ecohydrologic threshold-reversal mechanism on woodland-encroached sagebrush shrublands. Ecohydrology 2019, 12, e2086. [Google Scholar] [CrossRef] [Green Version]
  82. Nouwakpo, S.K.; Williams, C.J.; Pierson, F.B.; Weltz, M.A.; Kormos, P.R.; Arslan, A.; Al-Hamdan, O.Z. Effectiveness of prescribed fire to re-establish sagebrush steppe vegetation and ecohydrologic function on woodlandencroached sagebrush rangelands, Great Basin, USA: Part II: Runoff and sediment transport at the patch scale. Catena 2020, 185, 104301. [Google Scholar] [CrossRef]
  83. Pierson, F.B.; Williams, C.J.; Kormos, P.R.; Al-Hamdan, O.Z.; Hardegree, S.P.; Clark, P.E. Short-term impacts of tree removal on runoff and erosion from pinyon- and juniper-dominated sagebrush hillslopes. Rangel. Ecol. Manag. 2015, 68, 408–422. [Google Scholar] [CrossRef]
  84. Stringham, T.K.; Snyder, K.A.; Snyder, D.K.; Lossing, S.S.; Carr, C.A.; Stringham, B.J. Rainfall interception by singleleaf piñon and utah juniper: Implications for stand-level effective precipitation. Rangel. Ecol. Manag. 2018, 71, 327–335. [Google Scholar] [CrossRef]
  85. Lebron, I.; Madsen, M.D.; Chandler, D.G.; Robinson, D.A.; Wendroth, O.; Belnap, J. Ecohydrological controls on soil moisture and hydraulic conductivity within a pinyon-juniper woodland. Water Resour. Res. 2007, 43, W08422. [Google Scholar] [CrossRef] [Green Version]
  86. Madsen, M.D.; Chandler, D.G.; Belnap, J. Spatial gradients in ecohydrologic properties within a pinyon-juniper ecosystem. Ecohydrology 2008, 1, 349–360. [Google Scholar] [CrossRef]
  87. Robinson, D.A.; Lebron, I.; Ryel, R.J.; Jones, S.B. Soil water repellency: A method of soil moisture sequestration in pinyon-juniper woodland. Soil Sci. Soc. Am. J. 2010, 74, 624–634. [Google Scholar] [CrossRef]
  88. Cline, N.L.; Roundy, B.A.; Pierson, F.B.; Kormos, P.; Williams, C.J. Hydrologic response to mechanical shredding in a juniper woodland. Rangel. Ecol. Manag. 2010, 63, 467–477. [Google Scholar] [CrossRef]
  89. McIver, J.; Brunson, M. Multidisciplinary, multisite evaluation of alternative sagebrush steppe restoration treatments: The SageSTEP project. Rangel. Ecol. Manag. 2014, 67, 435–439. [Google Scholar] [CrossRef] [Green Version]
  90. McIver, J.; Brunson, M.; Bunting, S.; Chambers, J.; Doescher, P.; Grace, J.; Hulet, A.; Johnson, D.; Knick, S.; Miller, R.; et al. A synopsis of short-term response to alternative restoration treatments in Sagebrush-Steppe: The SageSTEP Project. Rangel. Ecol. Manag. 2014, 67, 584–598. [Google Scholar] [CrossRef] [Green Version]
  91. Prism Climate Group, Oregon State University. Available online: http://prism.oregonstate.edu/ (accessed on 23 January 2020).
  92. Natural Resources Conservation Service (NRCS). Soil Survey Geographic (SSURGO) Database for Western White Pine County Area, Nevada, Parts of White Pine and Eureka Counties; US Department of Agriculture, Natural Resources Conservation Service: Fort Worth, TX, USA, 2007.
  93. Natural Resources Conservation Service (NRCS). Soil Survey Geographic (SSURGO) Database for Tooele Area, Utah-Tooele County and Parts of Box Elder, Davis, and Juab Counties, Utah, White Pine and Elko Counties, Nevada; US Department of Agriculture, Natural Resources Conservation Service: Fort Worth, TX, USA, 2006; p. 611.
  94. Robichaud, P.R.; Lewis, S.A.; Ashmun, L.E. New Procedure for Sampling Infiltration to Assess Post-Fire Soil Water Repellency; Research Note RMRS-RN-33; US Department of Agriculture, Forest Service, Rocky Mountain Research Station: Fort Collins, CO, USA, 2008; p. 14.
  95. Breshears, D.D.; Nyhan, J.W.; Heil, C.E.; Wilcox, B.P. Effects of woody plants on microclimate in a semiarid woodland: Soil temperature and evaporation in canopy and intercanopy patches. Int. J. Plant. Sci. 1998, 159, 1010–1017. [Google Scholar] [CrossRef]
  96. DeBano, L.F. Water Repellent Soils: A State-of-the-Art; General Technical Report PSW-46; US Department of Agriculture, Forest Service, Pacific Southwest Forest and Range Experiment Station: Berkeley, CA, USA, 1981; p. 21.
  97. Bisdom, E.B.A.; Dekker, L.W.; Schoute, J.F.T. Water repellency of sieve fractions from sandy soils and relationships with organic material and soil structure. Geoderma 1993, 56, 105–118. [Google Scholar] [CrossRef]
  98. Madsen, M.D.; Zvirzdin, D.L.; Petersen, S.L.; Hopkins, B.G.; Roundy, B.A.; Chandler, D.G. Soil water repellency within a burned piñon-juniper woodland: Spatial distribution, severity, and ecohydrologic implications. Soil Sci. Soc. Am. J. 2011, 75, 1543–1553. [Google Scholar] [CrossRef] [Green Version]
  99. Zhang, R. Determination of soil sorptivity and hydraulic conductivity from the disk infiltrometer. Soil Sci. Soc. Am. J. 1997, 61, 1024–1030. [Google Scholar] [CrossRef]
  100. Van Genuchten, M.T. A closed-form equation for predicting the hydraulic conductivity of unsaturated soils. Soil Sci. Soc. Am. J. 1980, 44, 892–898. [Google Scholar] [CrossRef] [Green Version]
  101. Vandervaere, J.P.; Vauclin, M.; Elrick, D.E. Transient flow from tension infiltrometers: I. The two-parameter equation. Soil Sci. Soc. Am. J. 2000, 64, 1263–1272. [Google Scholar] [CrossRef] [Green Version]
  102. SAS Institute, Inc. SAS Software Version 9.4; SAS Institute, Inc.: Cary, NC, USA, 2013. [Google Scholar]
  103. Littell, R.C. SAS for Mixed Models, 2nd ed.; SAS Institute, Inc.: Cary, NC, USA, 2006; p. 829. [Google Scholar]
  104. Moffet, C.A.; Taylor, J.; Booth, D. Postfire shrub cover dynamics: A 70-year fire chronosequence in mountain big sagebrush communities. J. Arid Environ. 2015, 114, 116–123. [Google Scholar] [CrossRef] [Green Version]
  105. Tausch, R.J.; Tueller, P.T. Plant succession following chaining of pinyon-juniper woodlands in eastern Nevada. J. Range Manag. 1977, 30, 44–49. [Google Scholar] [CrossRef]
  106. Condon, L.; Weisberg, P.J.; Chambers, J.C. Abiotic and biotic influences on Bromus tectorum invasion and Artemisia tridentata recovery after fire. Int. J. Wildland Fire 2011, 20, 597–604. [Google Scholar] [CrossRef]
  107. Fernelius, K.J.; Madsen, M.D.; Hopkins, B.G.; Bansal, S.; Anderson, V.J.; Eggett, D.L.; Roundy, B.A. Post-fire interactions between soil water repellency, soil fertility and plant growth in soil collected from a burned piñon-juniper woodland. J. Arid Environ. 2017, 144, 98–109. [Google Scholar] [CrossRef]
  108. O’Connor, C.; Miller, R.; Bates, J.D. Vegetation response to western juniper slash treatments. Environ. Manag. 2013, 52, 553–566. [Google Scholar] [CrossRef] [PubMed]
  109. Davies, K.W.; Boyd, C.S.; Bates, J.D.; Gearhart, A. Legacy microsite effect on the survival of bitterbrush outplantings after prescribed fire: Capitalizing on spatial variability to improve restoration. Restor. Ecol. 2017, 25, 723–730. [Google Scholar] [CrossRef]
  110. Reisner, M.D.; Grace, J.B.; Pyke, D.A.; Doescher, P.S. Conditions favouring Bromus tectorum dominance of endangered sagebrush steppe ecosystems. J. Appl. Ecol. 2013, 50, 1039–1049. [Google Scholar] [CrossRef] [Green Version]
  111. Rau, B.M.; Chambers, J.C.; Pyke, D.A.; Roundy, B.A.; Schupp, E.W.; Doescher, P.; Caldwell, T.G. Soil resources influence vegetation and response to fire and fire-surrogate treatments in sagebrush-steppe ecosystems. Rangel. Ecol. Manag. 2014, 67, 506–521. [Google Scholar] [CrossRef] [Green Version]
  112. Chambers, J.C.; Roundy, B.A.; Blank, R.R.; Meyer, S.E.; Whittaker, A. What makes Great Basin sagebrush ecosystems invasible by Bromus tectorum? Ecol. Monogr. 2007, 77, 117–145. [Google Scholar] [CrossRef] [Green Version]
  113. Davies, K.W.; Johnson, D.D. Established perennial vegetation provides high resistance to reinvasion by exotic annual grasses. Rangel. Ecol. Manag. 2017, 70, 748–754. [Google Scholar] [CrossRef]
  114. Doerr, S.H.; Shakesby, R.A.; MacDonald, L.H. Soil water repellency: A key factor in post-fire erosion. In Fire Effects on Soils and Restoration Strategies; Cerdà, A., Robichaud, P.R., Eds.; Land Reconstruction and Management Series; Science Publishers: Enfield, NH, USA, 2009; Volume 5, pp. 197–224. [Google Scholar]
  115. Doerr, S.H.; Shakesby, R.A.; Walsh, R.P.D. Soil water repellency: Its causes, characteristics and hydro-geomorphological significance. Earth Sci. Rev. 2000, 51, 33–65. [Google Scholar] [CrossRef]
  116. Shakesby, R.A.; Doerr, S.H.; Walsh, R.P.D. The erosional impact of soil hydrophobicity: Current problems and future research directions. J. Hydrol. 2000, 231–232, 178–191. [Google Scholar] [CrossRef]
  117. Dekker, L.W.; Doerr, S.H.; Oostindie, K.; Ziogas, A.K.; Ritsema, C.J. Water repellency and critical soil water content in a dune sand. Soil Sci. Soc. Am. J. 2001, 65, 1667–1674. [Google Scholar] [CrossRef]
  118. MacDonald, L.H.; Huffman, E.L. Post-fire soil water repellency: Persistence and soil moisture thresholds. Soil Sci. Soc. Am. J. 2004, 68, 1729–1734. [Google Scholar] [CrossRef]
  119. Woods, S.W.; Birkas, A.; Ahl, R. Spatial variability of soil hydrophobicity after wildfires in Montana and Colorado. Geomorphology 2007, 86, 465–479. [Google Scholar] [CrossRef]
  120. Robichaud, P.R.; Wagenbrenner, J.W.; Pierson, F.B.; Spaeth, K.E.; Ashmun, L.E.; Moffet, C.A. Infiltration and interrill erosion rates after a wildfire in western Montana, USA. Catena 2016, 142, 77–88. [Google Scholar] [CrossRef] [Green Version]
  121. DeBano, L.F.; Savage, S.M.; Hamilton, D.A. The transfer of heat and hydrophobic substances during burning. Soil Sci. Soc. Am. J. 1976, 40, 779–782. [Google Scholar] [CrossRef]
  122. Robichaud, P.R.; Hungerford, R.D. Water repellency by laboratory burning of four northern Rocky Mountain forest soils. J. Hydrol. 2000, 231–232, 207–219. [Google Scholar] [CrossRef] [Green Version]
  123. Huffman, E.L.; MacDonald, L.H.; Stednick, J.D. Strength and persistence of fire-induced soil hydrophobicity under ponderosa and lodgepole pine, Colorado Front Range. Hydrol. Process. 2001, 15, 2877–2892. [Google Scholar] [CrossRef]
  124. Reid, K.D.; Wilcox, B.P.; Breshears, D.D.; MacDonald, L. Runoff and erosion in a pinon-juniper woodland: Influence of vegetation patches. Soil Sci. Soc. Am. J. 1999, 63, 1869–1879. [Google Scholar] [CrossRef] [Green Version]
  125. Wilcox, B.P.; Breshears, D.D.; Allen, C.D. Ecohydrology of a resource-conserving semiarid woodland: Effects of scale and disturbance. Ecol. Monogr. 2003, 73, 223–239. [Google Scholar] [CrossRef] [Green Version]
  126. Ludwig, J.A.; Wilcox, B.P.; Breshears, D.D.; Tongway, D.J.; Imeson, A.C. Vegetation patches and runoff-erosion as interacting ecohydrological processes in semiarid landscapes. Ecology 2005, 86, 288–297. [Google Scholar] [CrossRef] [Green Version]
  127. Puigdefábregas, J. The role of vegetation patterns in structuring runoff and sediment fluxes in drylands. Earth Surf. Process. Landf. 2005, 30, 133–147. [Google Scholar] [CrossRef]
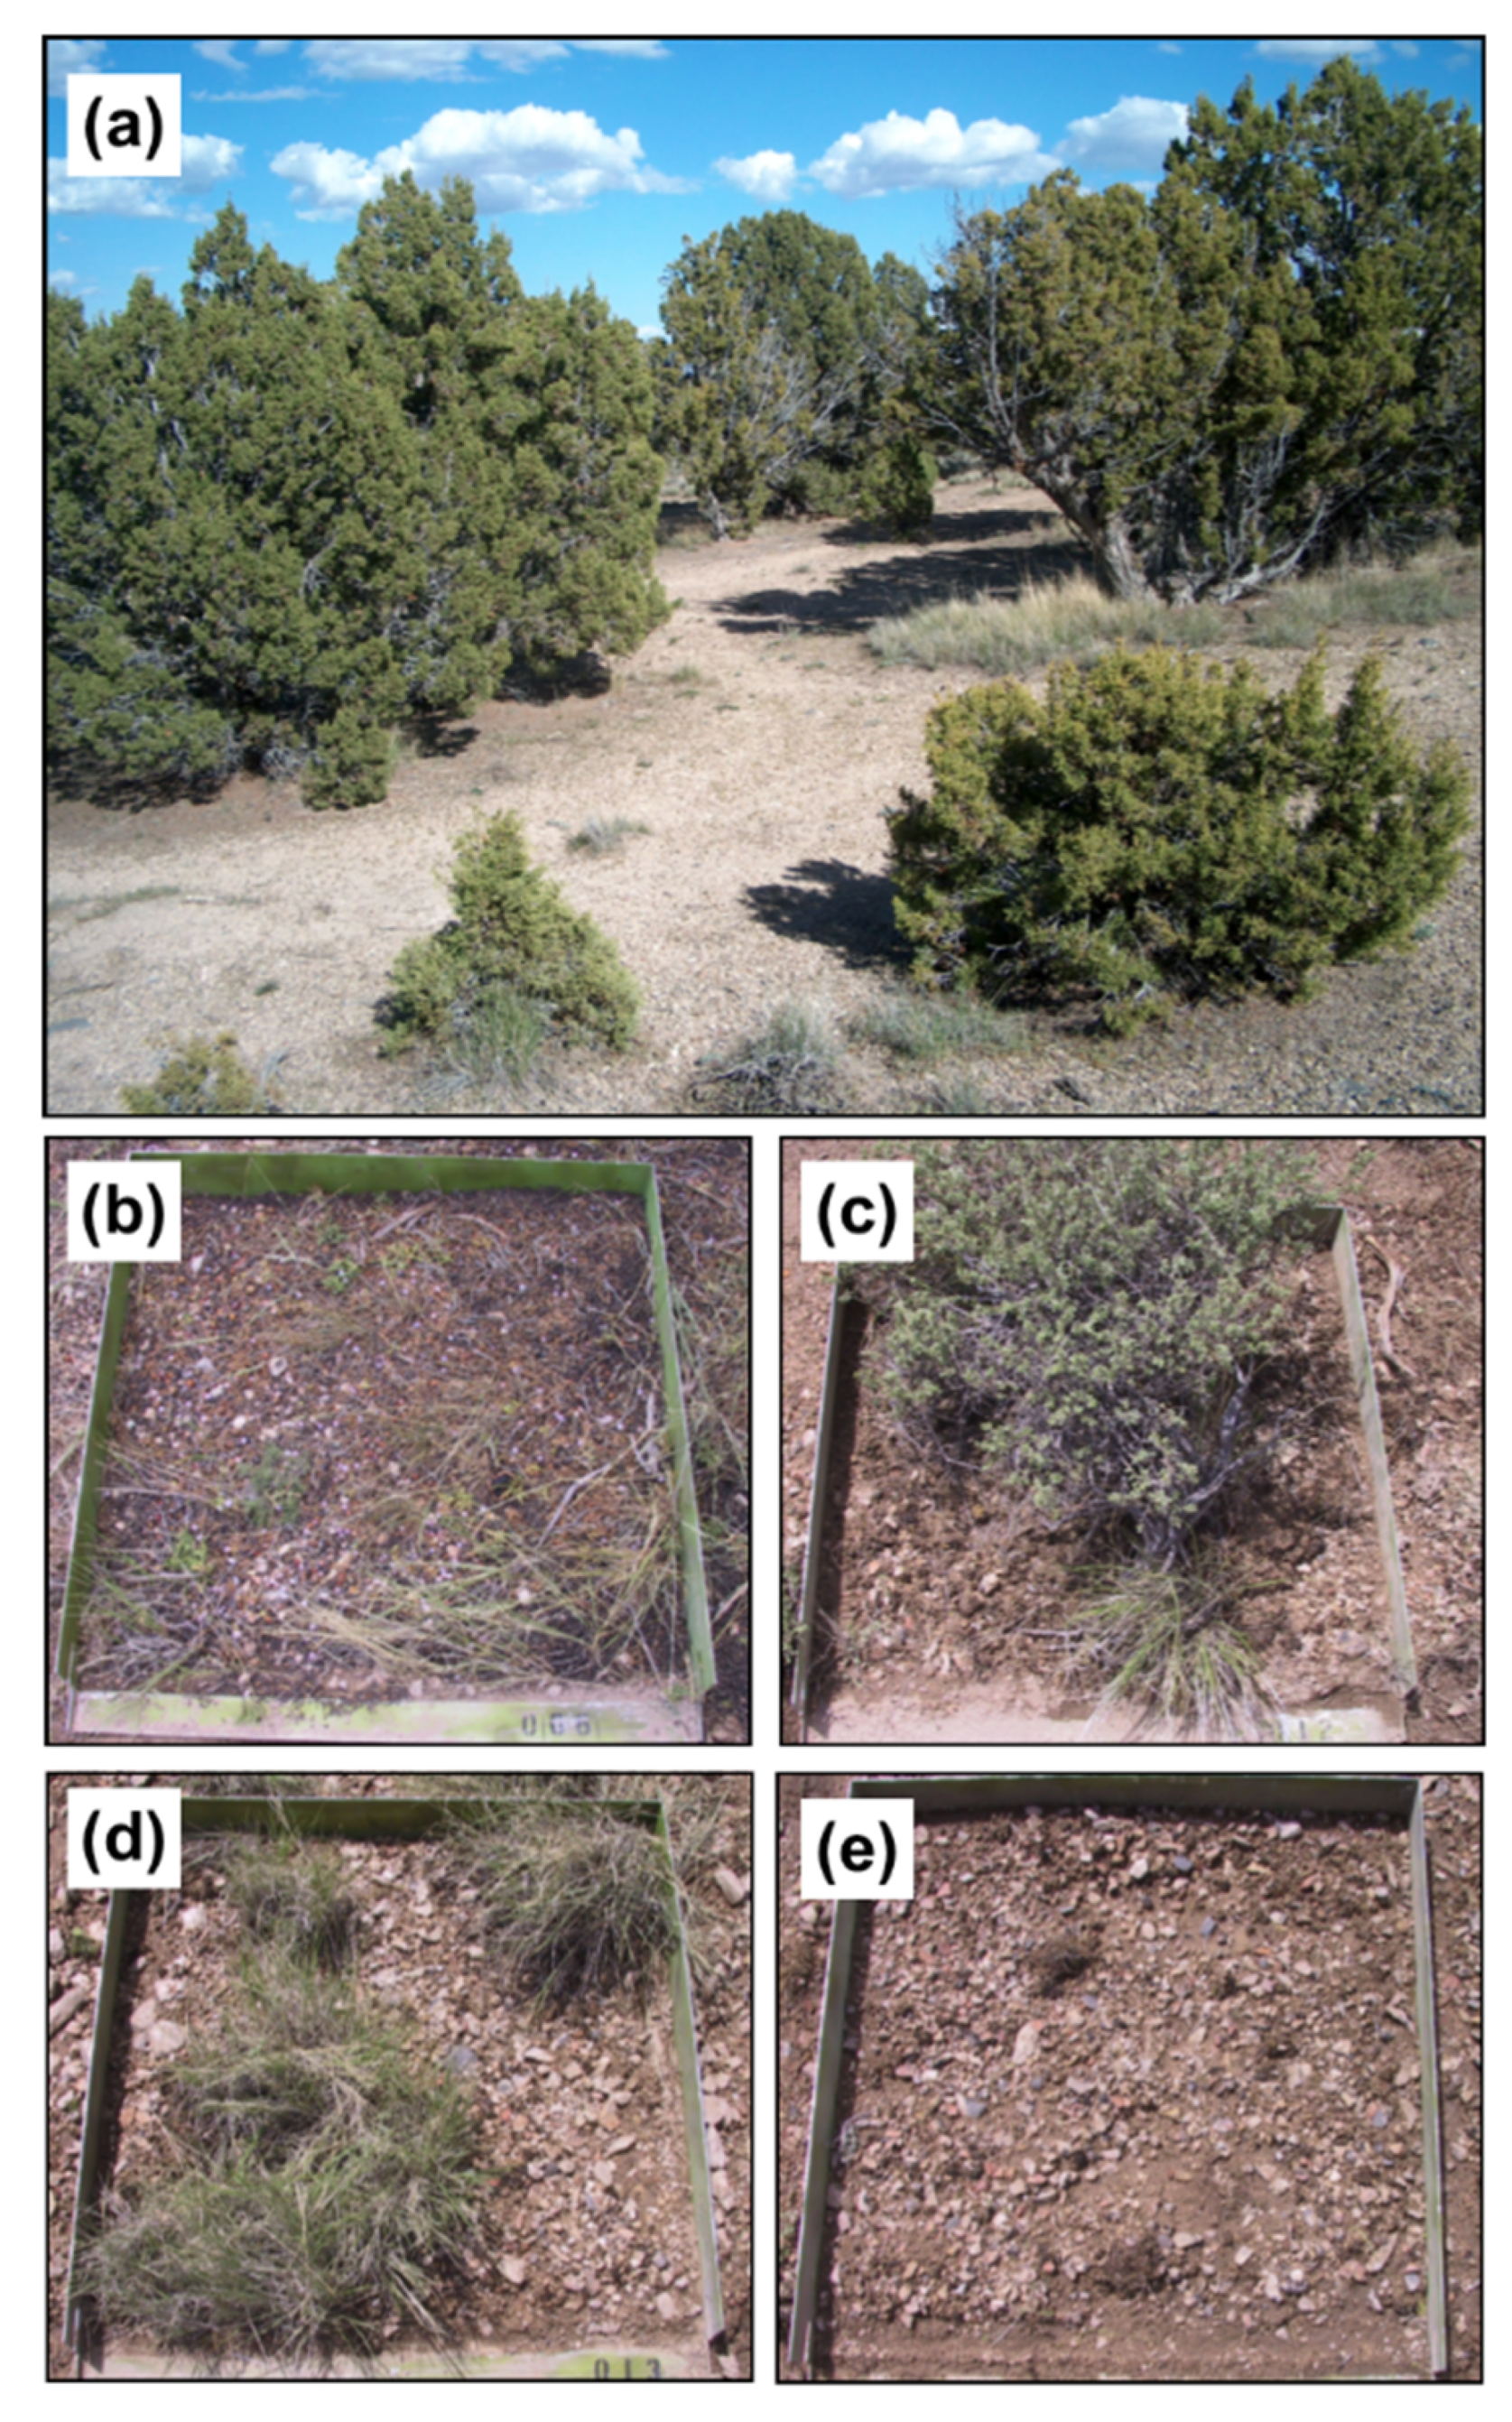
Figure 1. Photographs of the Onaqui site in this study showing: (a) the common woodland vegetation structure on sagebrush (Artemisia spp.) shrublands in the later stages of woodland encroachment, with isolated tree islands and an extensive sparsely-vegetated intercanopy between trees; (b) the typical litter-covered ground surface within the subcanopy underneath trees (subcanopy patch); and (c) shrub, (d) vegetated interspace (≥30% herbaceous cover), and (e) bare interspace (<30% herbaceous cover) microsites typical of areas within the intercanopy patches between trees. Photographs (be) are of rainfall simulation plots used in previous studies at the Onaqui site [18].
Water 12 02213 g001
Figure 2. Photographs of the Marking Corral study site in 2019 (13 years after treatments) showing the untreated (control) woodland area (a), burned (b) and cut (c) treatment areas, and a representative minidisk infiltrometer sampling point adjacent to grass cover (d).
Water 12 02213 g002
Figure 3. Photographs of the Onaqui study site in 2019 (13 years after treatments) showing the untreated (control) woodland area (a) and burned (b), cut (c) and mastication (d) treatment areas.
Water 12 02213 g003
Figure 4. Canopy cover of sagebrush (Artemisia spp.) shrubs (a), total herbaceous cover (all grasses and forbs) (b), perennial grasses (c), and the invasive annual cheatgrass (Bromus tectorum L. (d)) measured in burn (Burn), cut (Cut), and mastication (Mast; Onaqui site only) treatment areas at the Marking Corral (MC) and Onaqui (ON) study sites immediately before the treatments (2006, Pre-Trmt) and 1 year (2007), 9 years (2015), and 13 years (2019) after the treatments (Post-Treatment).
Water 12 02213 g004
Figure 5. Density of mature live trees (≥1 m height) (a), juvenile live trees (<1 m height) (b), and live sagebrush (Artemisia spp.) shrubs (c) as measured in burn (Burn), cut (Cut), and mastication (Mast; Onaqui site only) treatment areas at the Marking Corral (MC) and Onaqui (ON) study sites immediately before the treatments (2006, Pre-Trmt) and 1 year (2007), 9 years (2015), and 13 years (2019) after the treatments (Post-Treatment).
Water 12 02213 g005
Figure 6. Photographs of the Onaqui study site showing the representative tree transects in the control (a), burned (b), cut (c), and mastication (d) treatment areas. The photographs illustrate the typical changes in vegetation and ground cover/surface conditions for each treatment, progressing from a tree base through the subcanopy patch/zone (area underneath the existing or previously existing tree canopy) and into and through the intercanopy patch consisting of a transition zone (area immediately adjacent to canopy drip line) and the intercanopy zone (area immediately adjacent to the transition zone and outside of the tree canopy).
Water 12 02213 g006
Figure 7. Litter depths measured at sampling points spanning the subcanopy (areas from the tree base extending to an existing or previously existing canopy drip line), transition (area immediately adjacent to the canopy drip line), and intercanopy (area immediately adjacent to the transition zone and outside of the tree canopy) zones along tree transects in the control (Cont), burned (Burn), cut (Cut), and mastication (Mast, Onaqui site only) treatment areas at the Marking Corral (a) and Onaqui (b) study sites in 2019, 13 years after treatment applications.
Water 12 02213 g007
Figure 8. Soil water repellency at the mineral soil surface as assessed by water drop penetration time (WDPT) tests at sampling points spanning the subcanopy (areas from the tree base extending to existing or previously existing canopy drip line), transition (area immediately adjacent to the canopy drip line), and intercanopy (area immediately adjacent to the transition zone and outside of the tree canopy) zones along the tree transects in the control (Cont), burned (Burn), cut (Cut), and mastication (Mast, Onaqui site only) treatment areas at the Marking Corral (a) and Onaqui (b) study sites in 2019, 13 years after treatment applications. Soils are considered wettable where the WDPT < 5 s, slightly water repellent where the WDPT ranges between 5 and 60 s, and strongly water repellent where the WDPT > 60 s. WDPT tests were limited to 300 s in this study, yielding a maximum possible WDPT = 300 s.
Water 12 02213 g008
Figure 9. Relationship of soil water repellency with litter depth at the mineral soil surface as assessed by the water drop penetration time (WDPT) tests in the intercanopy (Int) and subcanopy (Sub) patches of the tree transects in control (Cont), burned (Burn), cut (Cut), and mastication (Mast, Onaqui site only) treatment areas at the Marking Corral and Onaqui study sites in 2019, 13 years after treatment applications. Soils are considered wettable where the WDPT < 5 s, slightly water repellent where WDPT ranges between 5 and 60 s, and strongly water repellent where the WDPT > 60 s. WDPT tests were limited to 300 s in this study, yielding a maximum possible WDPT = 300 s.
Water 12 02213 g009
Table 1. Topography, climate, soil, and pre-treatment vegetation characteristics at the Marking Corral and Onaqui study sites *.
Woodland CharacteristicsMarking Corral,
Nevada, USA
Onaqui,
Utah, USA
Woodland communitysingle-leaf pinyon /Utah juniper Utah juniper
Encroachment phase §Late Phase 2—Early Phase 3Late Phase 2—Early Phase 3
Tree dominance index §0.510.66
Elevation (m) and aspect2250—W to SW facing1720—N facing
Slope (%)10–1510–15
Mean ann. precipitation (mm)306 300
Mean ann. air temperature (°C)6.5 8.9
Parent rockandesite and rhyolite **sandstone and limestone ††
Soil associationSegura-Upatad-Cropper **Borvant ††
Depth to bedrock (m)0.4–0.5 **1.0–1.5 ††
Depth to restrictive layer (m)0.4–0.5 **0.3–0.5 ††
Soil surface texturesandy loam,
66% sand, 30% silt, 4% clay
sandy loam,
56% sand, 37% silt, 7% clay
Soil profile texturegravelly clay to clay loam **gravelly loam ††
Tree canopy cover (%) ‡‡15 , 10 26
Trees per ha ‡‡329 , 150 476
Mean tree height (m) ‡‡2.3 , 2.4 2.4
Juvenile trees per ha §§ 296 , 139 154
Live shrubs per ha12,0654914
Dead shrubs per ha2065957
Intercanopy shrub canopy cover (%)215
Intercanopy herbaceous canopy cover (%) ¶¶1311
Intercanopy bare soil and rock (%)6479
Common understory plantsArtemisia tridentata Nutt. ssp. wyomingensis Beetle & Young; Artemisia nova A. Nelson; Artemisia tridentata Nutt. ssp. vaseyana (Rydb.) Bettle; Purshia spp.; Poa secunda J. Presl; Pseudoroegneria spicata (Pursh) A. Löve; and various forbs
* Data from Pierson et al. [18] unless otherwise indicated by the footnote. Pinus monophylla Torr. and Frém. Juniperus osteosperma (Torr.) Little. § See Miller et al. [6] for descriptions of woodland encroachment phases (1–3) and the tree dominance index (TDI, 0 to 1), TDI = tree cover/(tree + shrub + tall perennial grass cover). Estimated from the 4 km grid for the years 1971–2018 from Prism Climate Group [91]. ** Natural Resources Conservation Service (NRCS) [92]. †† NRCS [93]. ‡‡ Live trees ≥ 1 m height. §§ Live trees < 1.0 m height. ¶¶ Intercanopy grass and forb canopy cover.
Table 2. Understory canopy cover and ground cover characteristics measured on 30 m × 33 m site characterization plots in burn and cut treatment areas at the Marking Corral site prior to tree removal (2006) and 1 year (2007), 9 years (2015), and 13 years (2019) after tree removal treatments. Means within a row followed by different lowercase letters are significantly different (p < 0.05).
Marking CorralPre-Burn
2006 *
Burn
2007
Burn
2015
Burn
2019
Pre-Cut
2006 §
Cut
2007
Cut
2015
Cut
2019
Canopy Cover
 Total (%)26.8 a40.0 a76.9 bc93.2 c32.4 a67.9 b73.1 b82.8 bc
 Shrub (%)17.7 b2.9 a8.7 ab11.0 ab14.6 b14.3 b28.7 c29.0 c
 Grass (%)4.8 a10.0 ab63.1 e76.8 e12.4 ab21.4 bc30.2 cd40.1 d
 Forb (%)0.1 a10.6 c0.9 ab1.3 ab1.0 ab3.7 b1.4 ab1.8 ab
Ground Cover
 Total (%) **47.8 b31.5 a47.5 b62.2 cd51.5 bc48.2 b56.2 bcd63.9 d
 Basal plant (%)0.3 a0.1 a7.1 b6.6 b0.3 a0.3 a8.2 b8.1 b
 Litter & woody dead (%)47.4 bc31.4 a40.3 ab55.7 c51.1 bc 47.6 bc 47.9 bc 55.8 bc
 Rock (%) ††25.4 d16.5 cd12.8 bc8.2 b22.0 d11.3 bc1.3 a6.1 ab
 Bare ground (%) ‡‡52.2 c68.5 d52.5 c37.8 ab48.4 bc51.8 c43.8 abc36.1 a
* Data from Pierson et al. [18], restricted to the plots in the area subsequently burned. Data obtained from measurements by Pierson et al. [83]. Data obtained from measurements by Williams et al. [34]. § Data from Pierson et al. [18], restricted to the plots in the area subsequently cut. Data obtained from measurements by Williams et al. [61]. ** Cryptogam, litter, live and dead plant bases, and woody dead cover; excludes rock†† cover. †† Rock fragments > 5 mm in diameter. ‡‡ Bare soil and rock †† cover.
Table 3. Understory canopy cover and ground cover characteristics measured on 30 m × 33 m site characterization plots in burn, cut, and mastication (Mast) treatment areas at the Onaqui site prior to tree removal (2006) and 1 year (2007), 9 years (2015), and 13 years (2019) after tree removal treatments. The means within a row followed by different lowercase letters are significantly different (p < 0.05).
OnaquiPre-Burn
2006 *
Burn
2007
Burn
2015
Burn
2019
Pre-Cut
2006 §
Cut
2007
Cut
2015
Cut
2019
Pre-Mast
2006 **
Mast
2007
Mast
2015
Mast
2019
Canopy Cover
 Total (%)19.8 a17.6 a65.4 d63.8 d21.2 a55.2 cd59.9 d57.2 d30.8 ab29.1 ab53.9 cd39.8 bc
 Shrub (%)0.9 ab0.3 a10.7 de4.8 cd3.4 bc5.0 cd16.9 e16.6 e6.1 cd3.1 bc9.9 de10.8 de
 Grass (%)6.2 ab3.4 a39.7 de40.4 e7.3 ab13.7 bc27.1 cde18.2 bc11.0 ab13.9 bc38.5 de23.8 cd
 Forb (%)3.3 ab6.0 abc14.3 d8.1 bcd 3.2 ab12.1 cd7.4 bcd6.1 abc2.0 a5.3 ab4.0 ab3.7 ab
Ground Cover
 Total (%) ††39.9 ab32.5 a48.8 bc40.7 ab32.6 a48.6 bc47.3 bc40.3 ab42.5 b64.9 d55.6 cd43.0 b
 Basal plant (%)0.9 a0.4 a13.3 cd4.9 b0.6 a0.2 a9.5 c4.3 b0.7 a0.1 a16.1 d3.9 b
 Litter & woody dead (%)34.4 abc 29.7 ab34.7 abc33.7 abc27.3 a43.6 c37.2 abc 35.6 abc 38.6 bc63.1 d 37.0 abc39.1 bc
 Rock (%) ‡‡29.0 cd31.6 d21.6 bc29.2 cd29.8 cd22.3 bcd17.0 ab 23.8 bcd20.1 bc11.2 a14.4 ab20.1 bc
 Bare ground (%) §§60.1 cd 67.5 d51.2 bc59.3 cd67.5 d51.4 bc52.7 bc59.7 cd57.5 c35.1 a44.4 ab57.0 c
* Data from Pierson et al. [18], restricted to the plots in the area subsequently burned. Data obtained from measurements by Pierson et al. [83]. Data obtained from measurements by Williams et al. [34]. § Data from Pierson et al. [18], restricted to the plots in the area subsequently cut. Data obtained from measurements by Williams et al. [61]. ** Data from Pierson et al. [18], restricted to the plots in the area subsequently masticated. †† Cryptogam, litter, live and dead plant bases, and woody dead cover; excludes rock‡‡ cover. ‡‡ Rock fragments > 5 mm in diameter. §§ Bare soil and rock‡‡ cover.
Table 4. The average microsite occurrence, ground cover, litter depth, and soil variables as measured on the tree transects in the control, burned, cut, and mastication (Onaqui only) treatment areas at the Marking Corral and Onaqui study sites 13 years after treatment (2019). The means within a row for a given site (Marking Corral or Onaqui) followed by different lowercase letters are significantly different (p < 0.05).
Transect VariableMarking CorralOnaqui
ControlBurnCutControlBurnCutMastication
Microsite occurrence (%)
Tree49.6 a46.2 a 53.8 a48.8 b30.8 a41.4 ab38.4 ab
Shrub10.4 a0.0 a13.5 a4.0 a1.5 a6.3 a10.3 a
Vegetated interspace16.7 a53.8 b17.3 a11.5 a52.3 b30.0 ab26.8 ab
Bare interspace23.3 b0.0 a15.4 b35.7 b15.4 a22.3 ab24.5 ab
Ground cover (%)
Total ground cover *73.6 a92.3 a75.0 a62.6 a56.4 a58.7 a64.9 a
Plant basal cover0.0 a1.9 ab13.5 b2.0 a9.2 a0.0 a3.3 a
Litter & woody dead73.6 ab90.4 b61.5 a58.4 a40.6 a58.7 a60.1 a
Rock 10.8 a1.9 a1.9 a32.4 a34.4 a25.4 a18.7 a
Bare ground 26.4 a7.7 a25.0 a37.4 a43.6 a41.3 a35.1 a
Litter depth (cm)2.5 a2.5 a2.0 a2.4 a2.6 b0.8 a1.3 ab
Total soil organic carbon, 0–5 cm depth (%)1.25 a1.25 a1.56 a1.62 a4.65 a6.02 a5.41 a
Soil hydrologic properties
WDPT 0-cm depth (s) §71 b18 a22 ab88 b22 a49 ab48 ab
Wettable soil (%) 62.8 a76.9 a73.1 a51.3 a73.8 a63.1 a64.2 a
Slightly repellent (%) 7.8 a17.3 a19.2 a15.3 a20.0 a15.9 a18.4 a
Strongly repellent (%) 29.4 b5.8 a7.7 a33.4 b6.2 a21.0 ab17.4 ab
Hydraulic conductivity, K(h) (mm·h−1) **39 a74 a60 a26 a36 a33 a40 a
Relative infiltration (mL·min−1) **, ††11 a15 a10 a12 a11 a15 a14 a
Number of transects4444555
* Total ground cover by cryptogams, litter, live and dead basal plants, and woody dead debris. Rock fragments > 5 mm diameter. Combination of bare soil and rock. § Water drop penetration time (WDPT, 300 s maximum) used to assess the soil water repellency. Soils were classified wettable if the WDPT < 5 s, slightly water repellent if WDPT ranged between 5 and 60 s and strongly water repellent if the WDPT exceeded 60 s. Percentage of sample points with the WDPT classified as wettable, slightly water repellent, or strongly water repellent. ** Means based on sampling at three locations (one each in the subcanopy, transition, and intercanopy zones) in each of the four transects per treatment at Marking Corral and in each of three transects per treatment at Onaqui. †† Infiltration rate measured over the first 60 s of the minidisk infiltrometer experiments.
Table 5. Average microsite occurrence, ground cover, litter depth, and soil variables as measured in the intercanopy and subcanopy patches of the tree transects in the control, burned, and cut treatment areas at the Marking Corral study site 13 years after treatment (2019). Means within a row followed by different lowercase letters are significantly different (p < 0.05).
Marking CorralControlBurnCut
IntercanopySubcanopyIntercanopySubcanopyIntercanopySubcanopy
Microsite occurrence (%)
Tree0.0 a100.0 b0.0 a100.0 b4.2 a100.0 b
Shrub21.1 b0.0 a0.0 a0.0 a29.2 b0.0 a
Vegetated interspace34.9 b0.0 a100.0 c0.0 a36.3 b0.0 a
Bare interspace44.0 b0.0 a0.0 a0.0 a30.3 b0.0 a
Ground cover (%)
Total ground cover *47.6 a100.0 b93.8 b90.0 b48.8 a100.0 b
Plant basal cover0.0 a0.0 a3.1 a0.0 a28.0 b0.0 a
Litter & woody dead47.6 a100.0 b90.6 b90.0 b20.8 a100.0 b
Rock 22.1 a0.0 a3.1 a0.0 a28.0 a0.0 a
Bare ground 52.4 b0.0 a6.2 a10.0 a51.2 b0.0 a
Litter depth (cm)0.4 a4.7 d1.4 bc2.6 cd 0.7 ab4.0 d
Total soil organic carbon,0–5 cm depth (%)1.11 a1.54 a1.47 a1.76 a1.60 a1.67 a
Soil hydrologic properties
WDPT 0-cm depth (s) §<5 a138 c<5 a35 b<5 a40 b
Wettable soil (%) 100.0 c25.5 a85.7 bc67.0 bc100.0 c49.4 ab
Slightly repellent (%) 0.0 a17.1 ab14.3 ab20.5 ab0.0 a36.3 b
Strongly repellent (%) 0.0 a57.4 b0.0 a12.5 a0.0 a14.3 a
Hydraulic conductivity, K(h) (mm·h−1) **34 a48 ab71 b79 b49 ab81 b
Relative infiltration (mL·min−1) **, ††13 bc6 ab18 c10 ab13 bc4 a
* Total ground cover by cryptogams, litter, live and dead basal plants, and woody dead debris. Rock fragments > 5 mm diameter. Combination of bare soil and rock. § Water drop penetration time (WDPT, 300 s maximum) used to assess soil water repellency. Soils were classified wettable if the WDPT < 5 s, slightly water repellent if WDPT ranged between 5 and 60 s and strongly water repellent if the WDPT exceeded 60 s. Percentage of sample points with the WDPT classified as wettable, slightly water repellent, or strongly water repellent. ** Means based on sampling in each of four transects per treatment. †† Infiltration rate measured over the first 60 s of the minidisk infiltrometer experiments.
Table 6. Average microsite occurrence, ground cover, litter depth, and soil variables as measured in the intercanopy and subcanopy patches of tree transects in the control, burned, cut, and mastication treatment areas at the Onaqui study site 13 years after treatment (2019). Means within a row followed by different lowercase letters are significantly different (p < 0.05).
OnaquiControlBurnCutMastication
IntercanopySubcanopyIntercanopySubcanopyIntercanopySubcanopyIntercanopySubcanopy
Microsite occurrence (%)
Tree0.0 a96.7 c0.0 a77.3 b3.3 a100.0 c0.0 a81.7 bc
Shrub6.7 ab0.0 a2.5 a0.0 a9.2 ab0.0 a19.2 b0.0 a
Vegetated interspace16.9 ab3.3 a77.5 c15.3 ab53.1 bc0.0 a43.1 bc8.3 a
Bare interspace76.4 c0.0 a20.0 ab7.3 a34.4 b 0.0 a37.7 b10.0 a
Ground cover (%)
Total ground cover *24.2 a100.0 c51.1 ab65.3 bc41.1 ab85.0 c41.4 ab95.0 c
Plant basal cover5.0 a0.0 a13.2 a3.3 a0.0 a0.0 a4.0 a3.3 a
Litter & woody dead19.2 a96.7 c37.9 ab46.0 b41.1 ab85.0 c34.5 ab91.7 c
Rock 65.4 c0.0 a43.9 bc20.0 ab40.8 bc0.0 a28.9 ab5.0 a
Bare ground 75.8 c0.0 a48.9 bc34.7 ab58.9 bc15.0 a58.6 bc5.0 a
Litter depth (cm)0.3 a4.7 c0.6 a1.2 ab0.5 a2.3 bc0.5 a4.5 c
Total soil organic carbon,
0–5 cm depth (%)
4.40 a5.16 a6.00 a6.07 a5.46 a5.33 a5.79 a6.44 a
Soil hydrologic properties
WDPT 0-cm depth (s) §<5 a170 b<5 a51 b7 a97 b11 a87 b
Wettable soil (%) 92.1 c15.7 a89.3 c48.7 b80.6 c36.4 ab85.9 c40.7 ab
Slightly repellent (%) 7.9 a20.2 ab10.7 a35.3 b16.9 ab20.0 ab8.4 a28.6 ab
Strongly repellent (%) 0.0 a64.1 c0.0 a16.0 ab2.5 a43.6 c5.7 a30.7 bc
Hydraulic conductivity, K(h) (mm·h−1) **17 a46 bc42 bc24 ab25 ab50 bc20 ab81 c
Relative infiltration (mL·min−1) **,††15 b6 a12 ab9 ab16 b11 ab16 b9 ab
* Total ground cover by cryptogams, litter, live and dead basal plants, and woody dead debris. Rock fragments > 5 mm diameter. Combination of bare soil and rock. § Water drop penetration time (WDPT, 300 s maximum) used to assess soil water repellency. Soils were classified wettable if the WDPT < 5 s, slightly water repellent if WDPT ranged between 5 and 60 s and strongly water repellent if the WDPT exceeded 60 s. Percentage of sample points with the WDPT classified as wettable, slightly water repellent, or strongly water repellent. ** Means based on sampling in each of three transects per treatment. †† Infiltration rate measured over first 60 s of minidisk infiltrometer experiments.