1. Introduction, Materials and Methods
Flood risk analysis and assessment (FRA) is a scientific subdiscipline or a set of techniques regarding the quantitative analysis and evaluation of flood risk, its components, variables and parameters ([
1], in this Special Issue). The modern concept of FRA is based on a combination of flood hazard, probability and potential negative consequences of floods for human health, economic activities, the environment and cultural heritage [
2].
There are several published papers and chapters of books that present overall reviews of FRA [
2,
3,
4,
5,
6,
7]. Thematic reviews have also been published of different FRA approaches, regarding: methodological and spatial scale issues [
8,
9,
10]; uncertainty [
11,
12]; mapping [
13]; global scale risk analyses and assessments [
14] and economic damage [
15], among others.
Nevertheless, most of these thematic reviews provide a snapshot or a partial point of view of FRA. They focus only on a small number of selected methods and approaches (usually developed by the authors of the review). Additionally, they do not allow us to understand the temporal evolution of this subdiscipline or interpret the emerging fields of applications and the main sources of uncertainty. Only a bibliometric analysis of scientific databases that includes all of the technical literature can show us the range of worldwide flood risk analysis and assessment work over time.
Bibliometric studies have become widespread in many fields since 2006. In medical science, this technique has allowed us to analyze the emerging trends, and in economics and finance it has allowed us to discover useful information that is not visible using other bibliographical approaches [
16]. In the scientific field of FRA, the relevant literature has been abundant (over 7000 references; see the following sections), but there are not many bibliometric systematic analyses (less than 20 references). Only partial bibliometric analyses are available: urban flood risk in China [
17]; urban flood vulnerability [
18]; coastal flooding [
19]; group decision-making techniques for risk analysis and assessment [
20]; environmental risks and impacts [
21]; multi-criteria decision-making methods in risk analysis and assessment [
22]; availability of global-scale datasets to support the study of water-related disasters [
23] and among other specific topics and regional reviews. The objective of this global review is thus to carry out a bibliometric analysis of all FRA literature using a well-known worldwide database: Web of Science (WoS).
Web of Science (previously known as ‘Web of Knowledge’, WoK) is a website that provides subscription-based access to six large interconnected databases (‘Science Citation Index Expanded’, ‘Social Sciences Citation Index’, ‘Arts and Humanities Citation Index’, ‘Emerging Sources Citation Index’, ‘Book Citation Index’ and ‘Conference Proceedings Citation Index’) and several regional databases (Latin America, China, Korea and Russia) that provide comprehensive citation data for many different academic disciplines worldwide. It was originally produced by the Institute for Scientific Information (ISI) and is currently maintained by Clarivate Analytics (previously the Intellectual Property and Science business of Thomson Reuters; [
24]). Web of Science Core Collection contains over 1.7 billion cited references from over 155 million records, covering over 34,000 journals. WoS has been chosen as the database to analyze over other sources such as Scopus (Elsevier) or Google Scholar (Google), because it is indisputably the largest citation database available. Moreover, it is more selective in including scientific journal titles in its ‘Journal Citation Reports’ lists; and Web of Science analytics are the most accurate and trusted source of research evaluation [
25]. Of course, the WoS databases are focused on academic based type publications (universities and research centers), their records are skewed to English language science journals from the major academic publishers (i.e., Taylor and Francis, Elsevier, Nature-Springer) and ignore the huge grey literature coming from technical application of this research to management (public administrations) and practice (companies). However, they are the more homogeneous reviewed databases and avoid the need to eliminate redundancies and duplicate records. At the same time, WoS give us homogeneity about published papers quality, as all of them have been revised in a peer-review process (this key point is not always satisficed by grey literature).
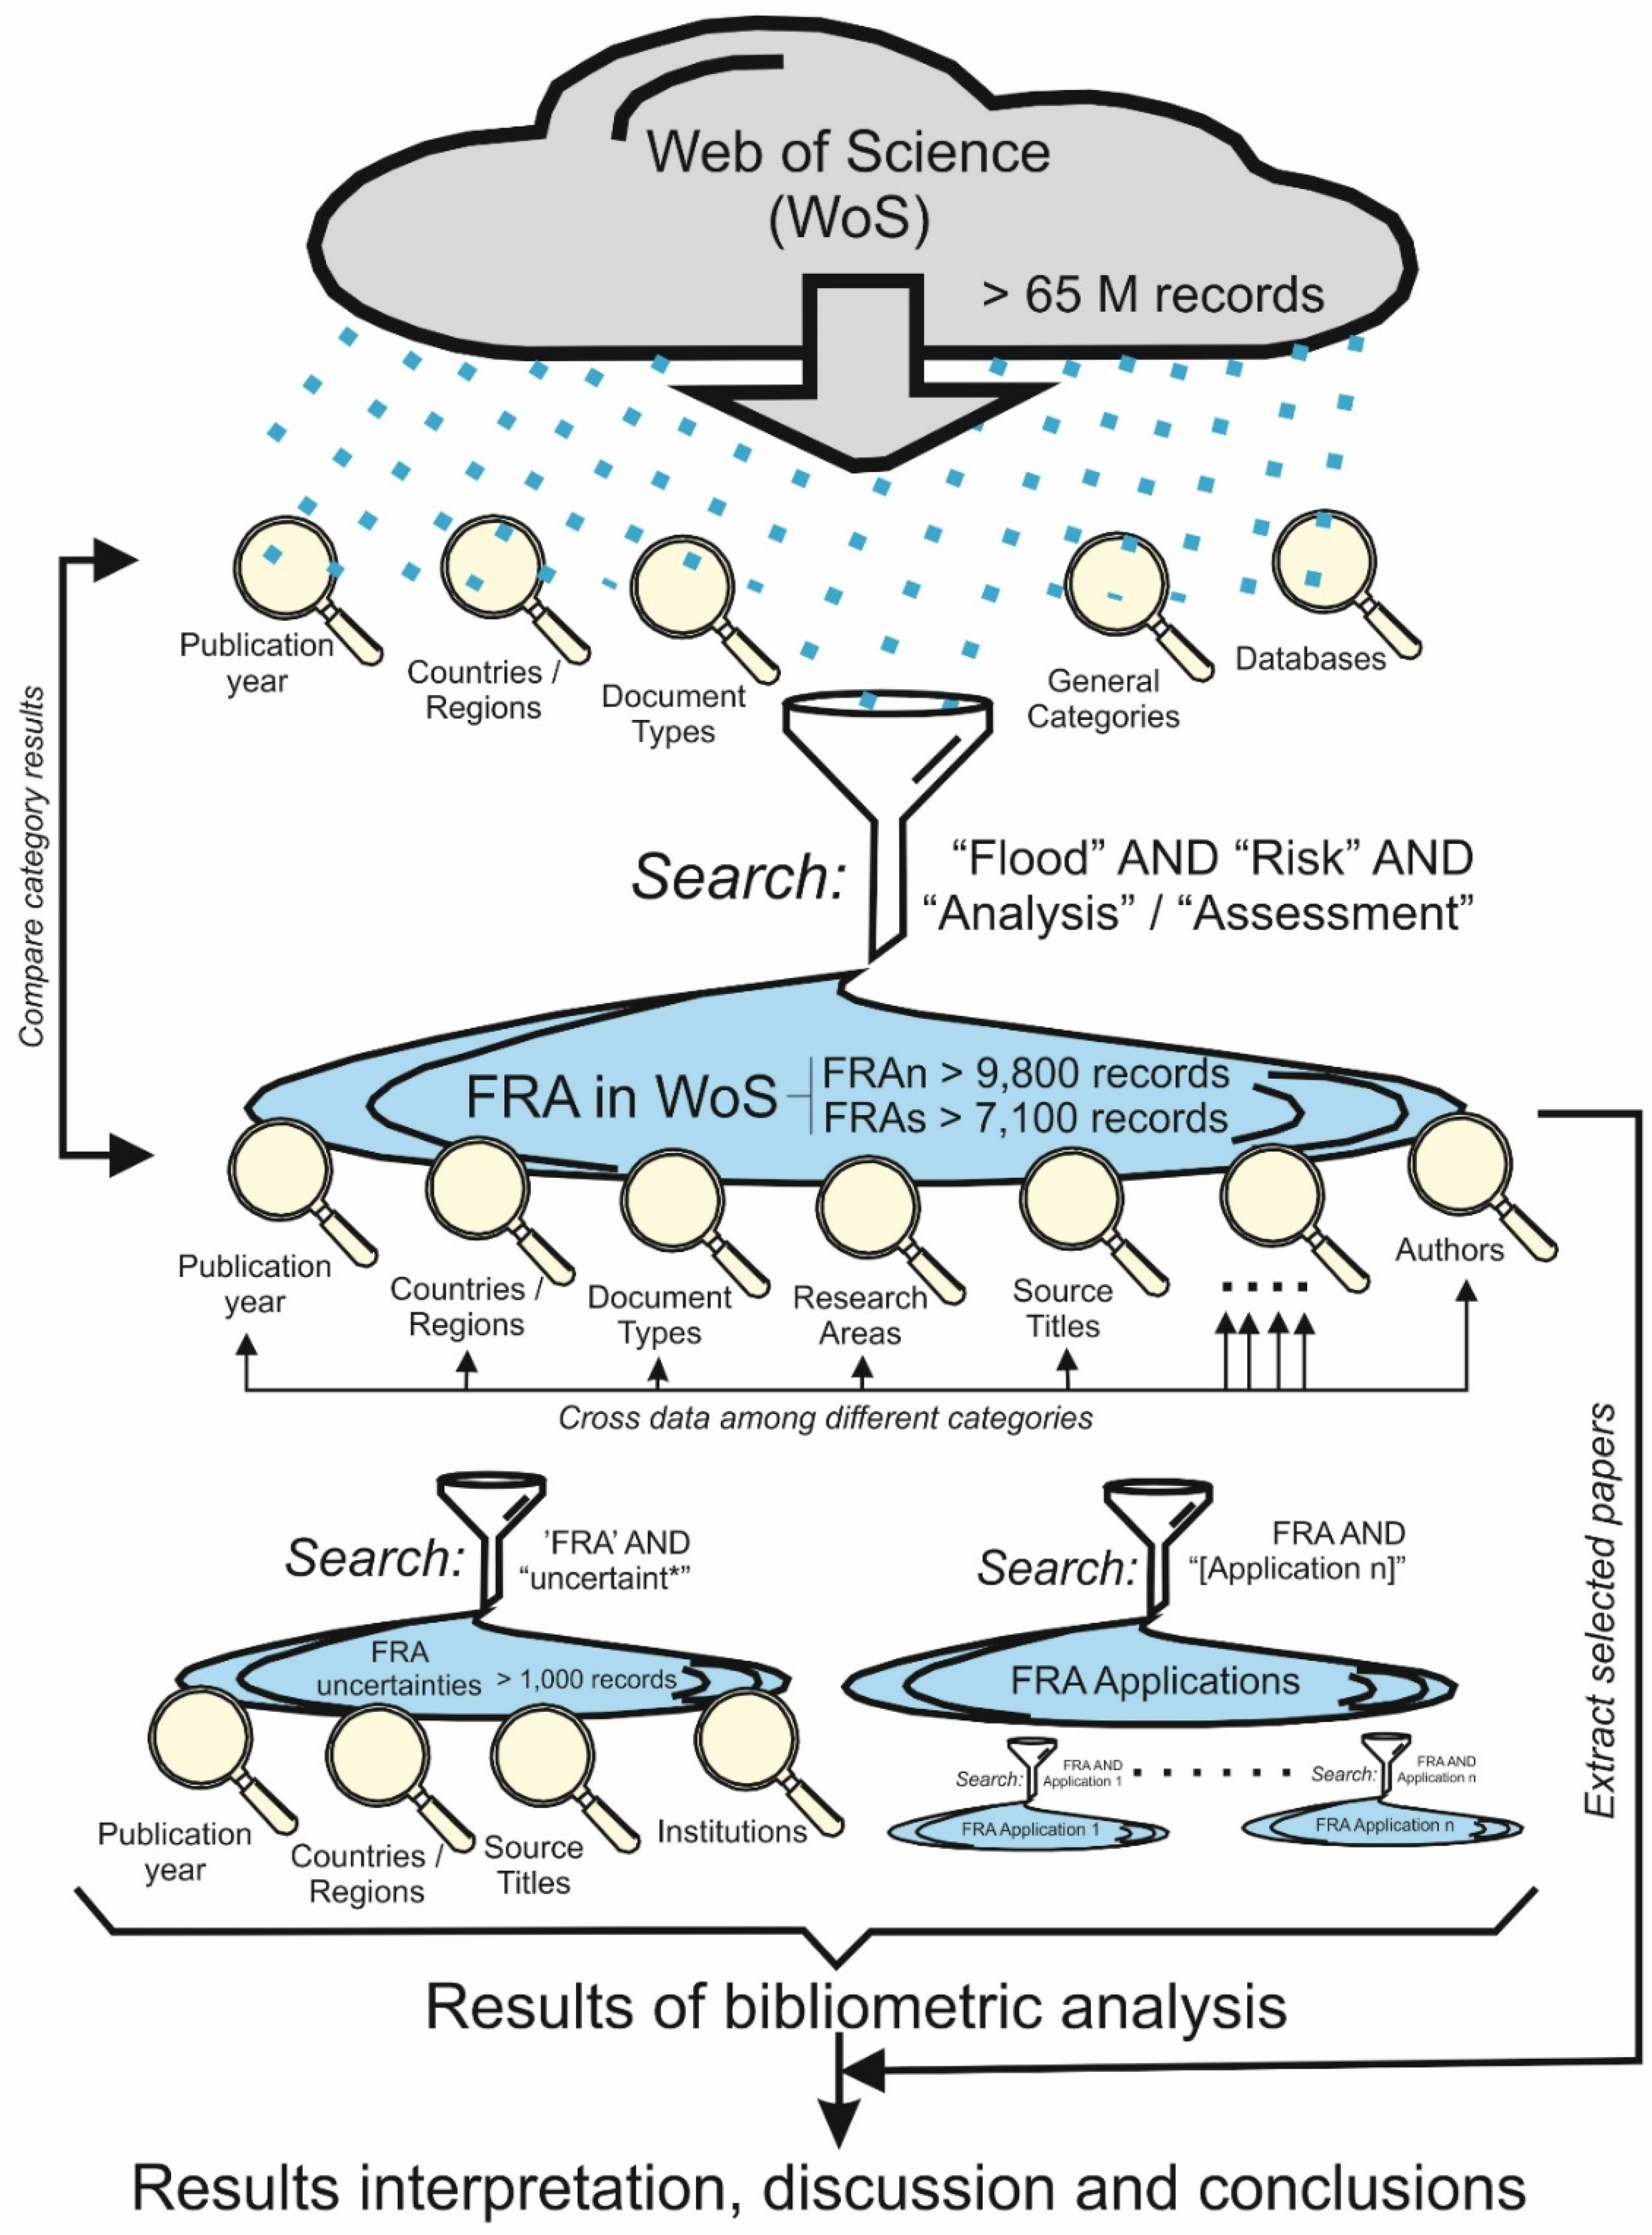
The ‘Core Collection’ of WoS was consulted and several thousand records were extracted using searches to perform a classical bibliometric analysis, using the available tools on the ‘Results Analysis’ menu. These include the fields (
Figure 1): research areas, publication years, databases, document types, authors (with and without Chinese), countries/regions (±Chinese), source titles (±Chinese), meeting titles, group/corporate authors, languages, institutions (±Chinese) and general categories. For each field of results analysis, a visualization treemap or bar graph can be shown; and tables sorted by ‘Record count’ or by a ‘Selected field’; can both be downloaded as image files (.jpg) or tab-delimited text files (.txt), respectively. All these data have been analyzed using a common spreadsheet and other office automation applications.
All of these bibliometric results and statistics were interpreted and discussed by consulting and comparing the scientific literature and selected webpage content (see the References section). Finally, the main conclusions regarding FRA trends are highlighted, as well as the current main topic fields, and those that are currently underdeveloped.
2. Recent Evolution of FRA in the Scientific Literature
Flood risk analysis and assessment is a recurrent theme in scientific and technical literature, at least in the past decades. Some of the logical queries using different combinations of FRA terms in WoS databases are shown in
Table 1. The more statistically representative combinations of query terms related to all FRA words are: the sum of terms “Flood” AND “Risk” AND “Analysis” (FRAn, 9840 records, updated at 22 June 2020); and the sum of terms “Flood” AND “Risk” AND “Assessment” (FRAs, 7166 records; updated at 19 January 2020). So, both record sets (FRAn and FRAs) will be analyzed in detail in the next sections.
The search in the WoS webpage using key words in the ‘Topic’ field, only guarantees the search in the publication title, abstract and author keywords (and Keywords Plus by WoS), but not in the full text of the publication. The statistical distribution of these records according to different criteria allows us to interpret the worldwide thematic, temporal and geographical evolution of FRA.
2.1. Document Types, Databases and Year of Publication
Most of the FRA publications in the WoS databases are ‘Articles’ or journal papers (86% FRAn and 84.5% FRAs), followed by communications and presentations at ‘Meetings’ and conferences (17.5% FRAn and 19.8% FRAs), ‘Reviews’ (2.8% FRAn and 3.8% FRAs) and ‘Books’ (2.0% FRAn and 3.1% FRAs). Other document types, like editorials, early access, abstracts and news have percentages of less than 1.5%. This is a logical distribution, taking into account that, in the global database, articles also accounted for 66% of the records. What is striking is the very low percentage of patents (0.1%) compared to their presence in the entire WoS database on any subject (22%). Both figures denote a more scientific approach to FRA (with a higher percentage of articles) than a technological or industrial approach (with more patents).
Most FRA publications are in the ‘Web of Science’ nuclear database (WoS; 9377 records, 95.3% FRAn; 6914 records, 96.5% FRAs), followed by ‘Current Contents Connect’ (CCC; 6371 records, 64.7% FRAn; 4775 records, 66.6% FRAs) and finally by Medline (1577 records, 16% FRAn; 1326 records, 18.5% FRAs). Articles from the rest of the WoS databases like KJD, SCIELO, RSCI and DIIDW (Clarivate Analytics, 2018) are almost testimonial, less than 2.5%. This distribution is very similar to the global distribution of the database, although with a greater presence of the WoS nuclear database (95.3–96.5% vs. 70%), double the percentage in CCC (64.7–66.6% vs. 34.2%) and half of the percentage in Medline (16–18.5% vs. 32.7%). Once again, we see a more scientific vision of the FRA and its technical application (CCC), compared to more research related to biomedical sciences (Medline).
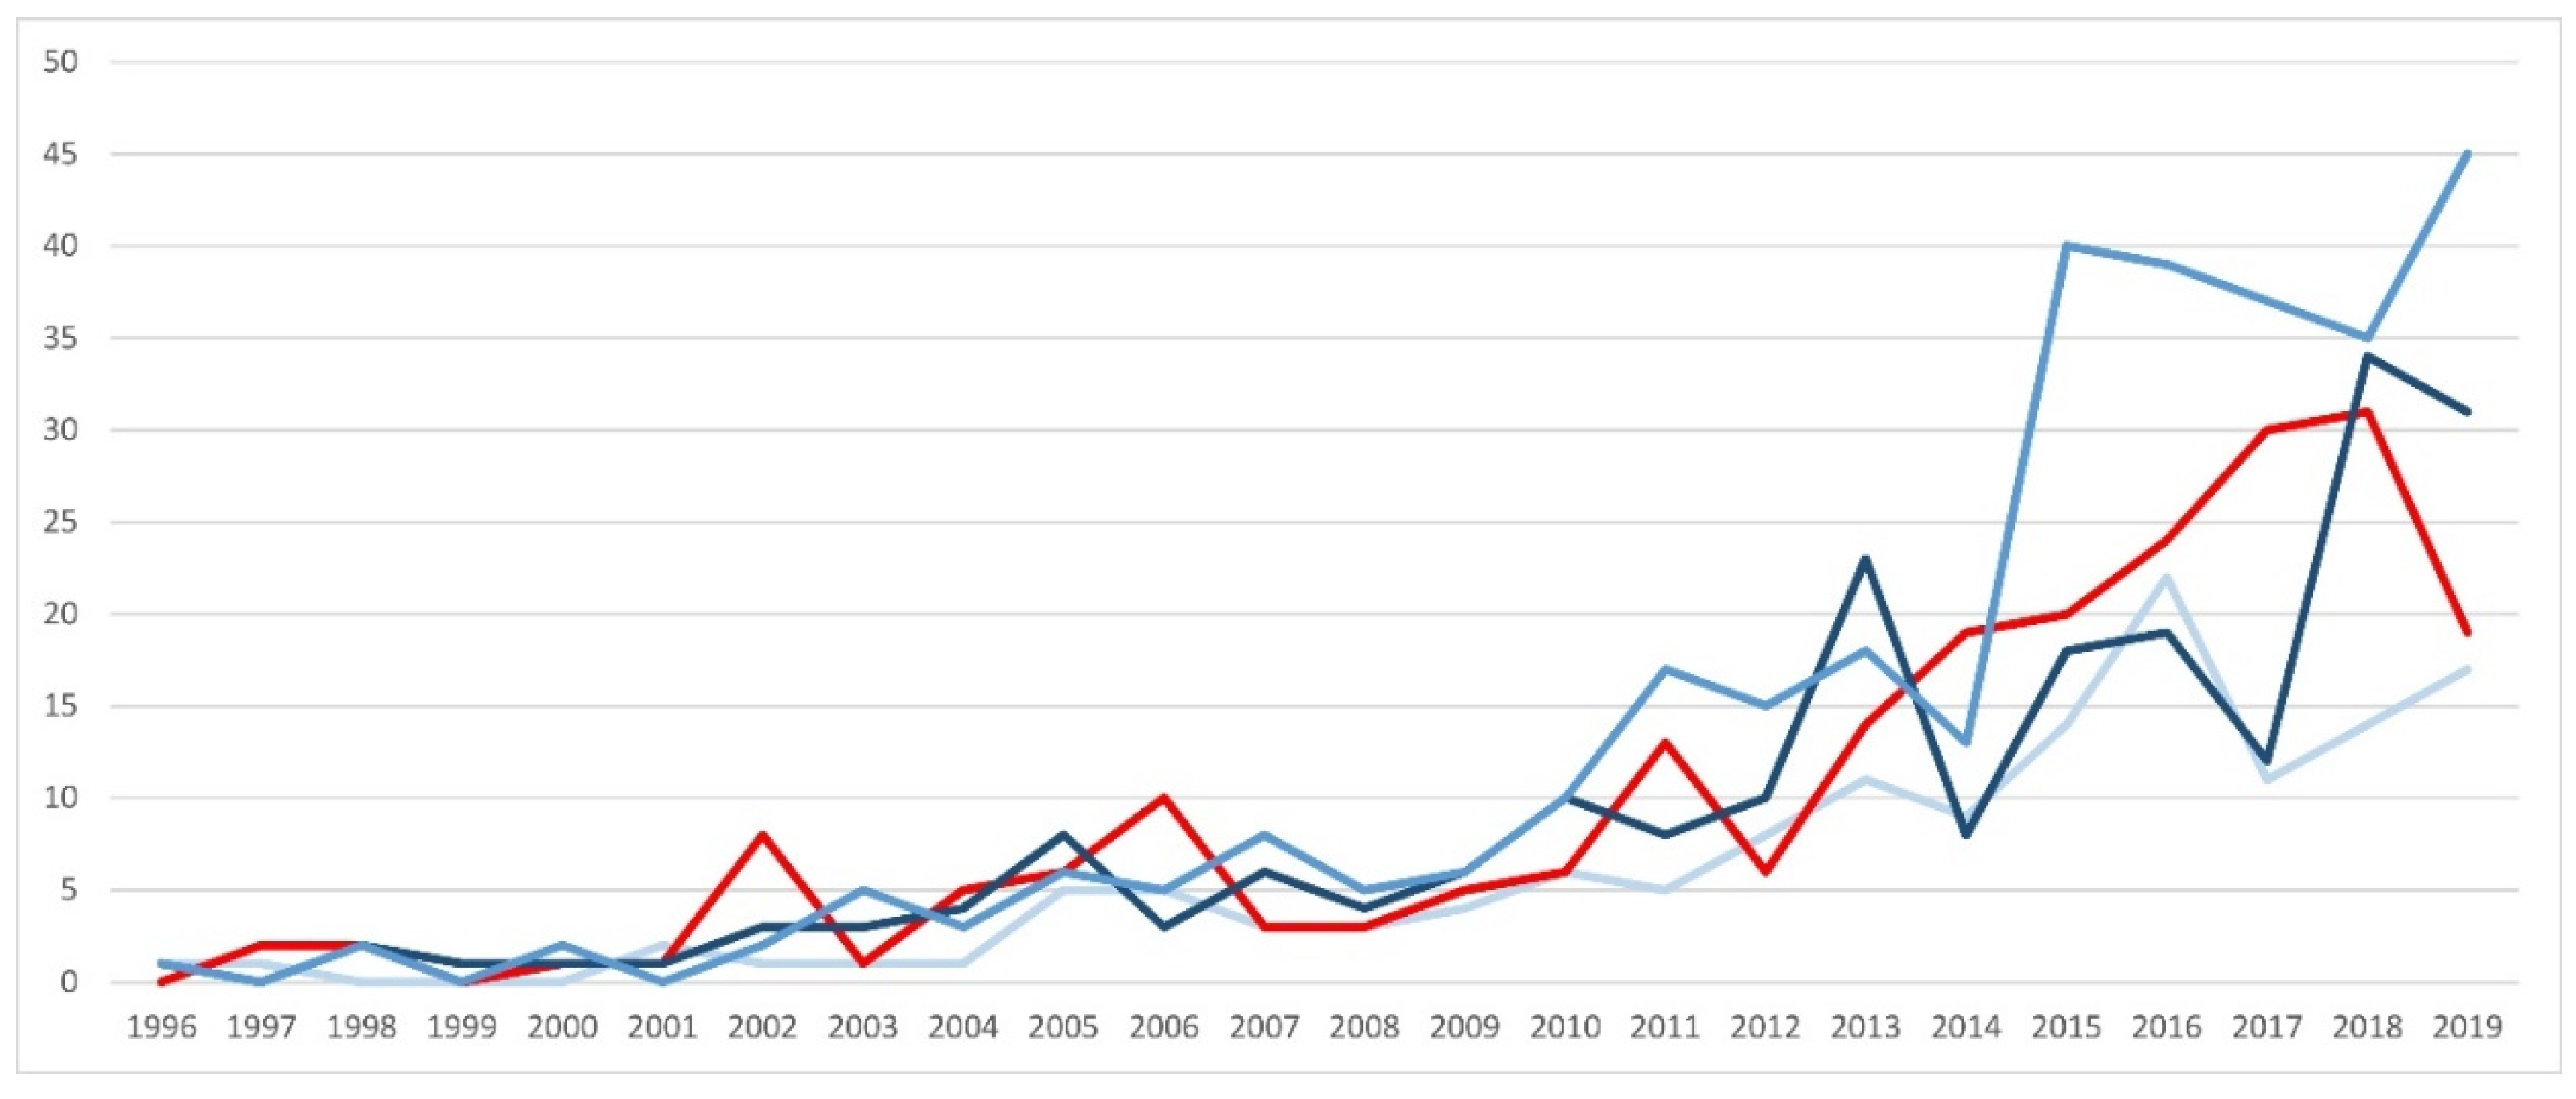
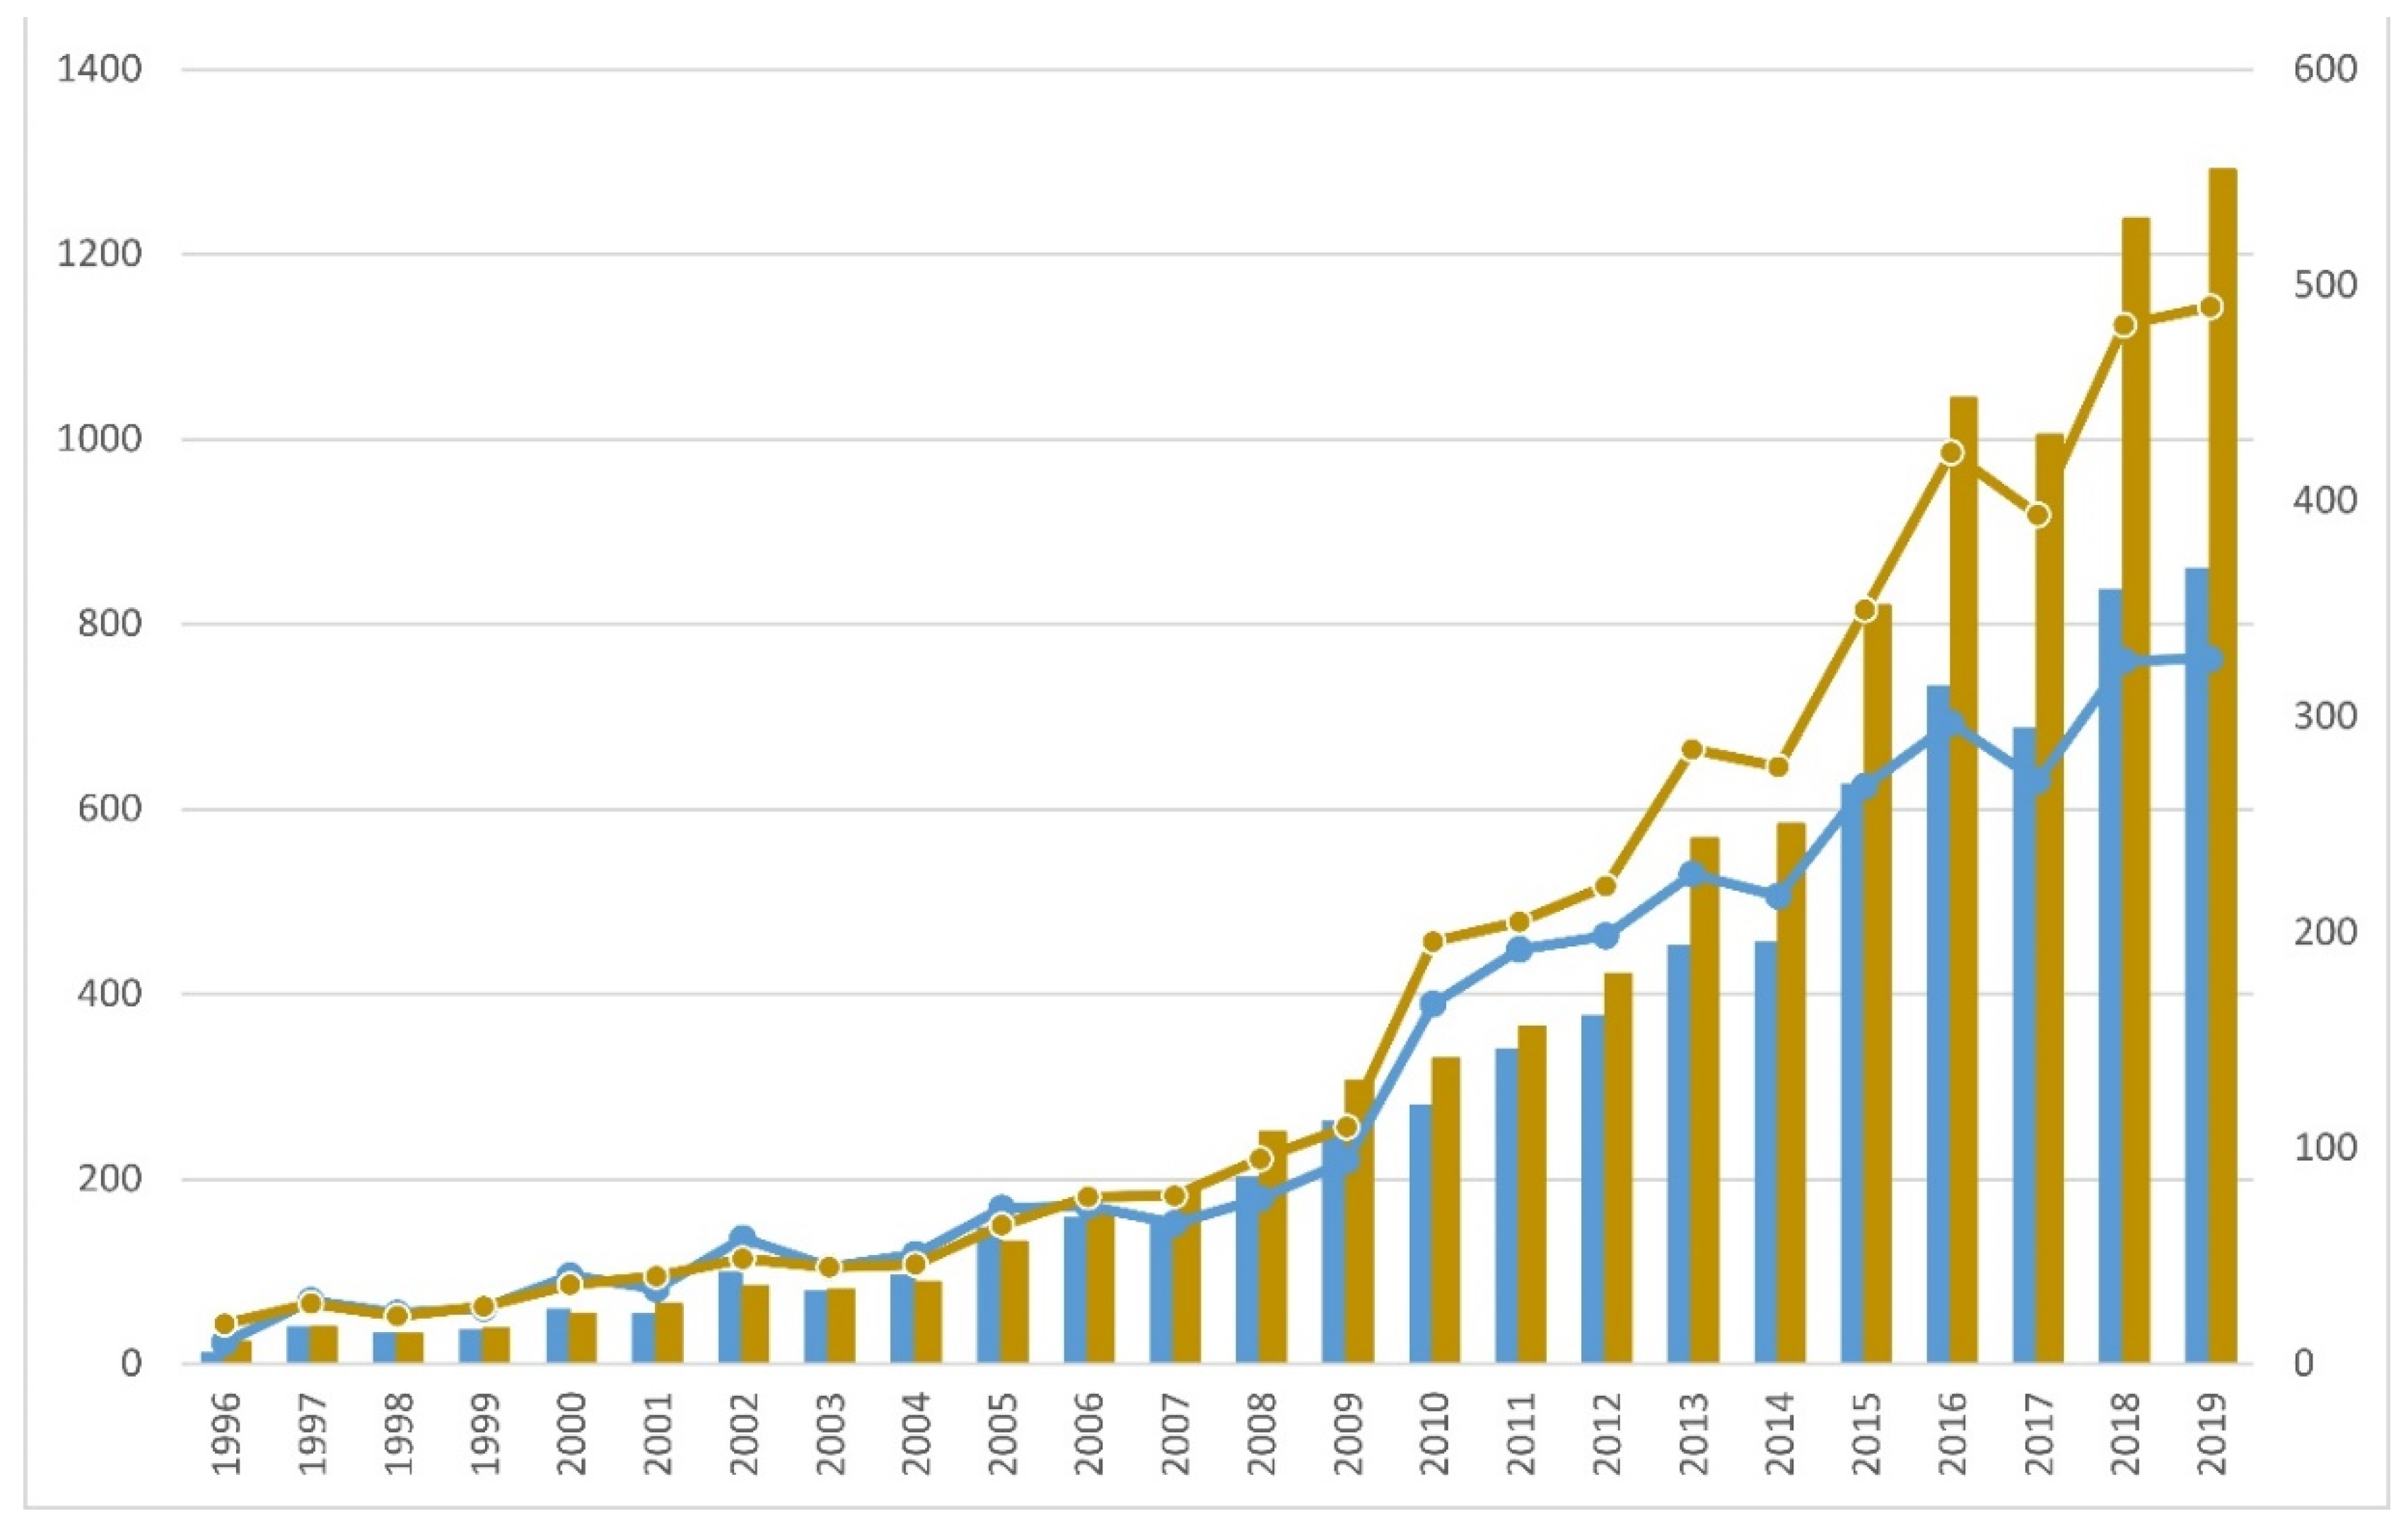
In the past 25 years (1996–2020), there has been a significant increase in publications on FRA, greater than one order of magnitude, and this growth has continued over time, without any significant decreases. FRA is thus an emerging discipline that has not reached its peak. Curiously, the series shows that when there is a large annual increase in publications, the following year is often similar (or even decreases slightly), forming pairs of characteristic years of growth stabilization, such as 2006–2007, 2013–2014, 2016–2017 and 2018–2019. The most significant increases occurred between 2014 and 2015, and between 2017 and 2018 (
Figure 2). These could be related to international provisions or programs that provide impetus for the scientific-technical community, such as the application of the European Flood Directive (EC 60/2007) and its successive cycles, although perhaps with a time lag due to the editing and publication times of the manuscripts. This progressive increase in records over time follows a parallel evolution with the WoS database as a whole, although there is a sharp drop in WoS records between 2009 and 2010 that is not reflected in the temporal evolution of FRA records. Quite the contrary, FRA publications show an increase in the number of registrations per million (
Figure 2), which may be related to the effects of the aforementioned European Directive, with a delay of three years.
2.2. General Categories, Research Areas and Source Titles
In the WoS database there are several general categories, some of which stand out for the number of records in the scientific-technical categories, in this order: science and technology (95.2% FRAn and 97.3% FRAs), physical sciences (73.7% FRAn and 78.9% FRAs), life sciences and biomedicine (63.3% FRAn and 66.9% FRAs), social sciences (44.7% FRAn and 40.3% FRAs) and technology (43% FRAn and 43.2% FRAs). Not so evident are arts and humanities and other categories, which have less than 200 records (<3%). This distribution is logical and correlates with that of the WoS database as a whole, although for FRA the scientific and technological values are slightly higher (FRA 95.2–97.3% vs. WoS 93.3%), and more than double those related to social sciences (FRA 44.7–40.3% vs. WoS 15.8%). This is due to the duality of FRA: a scientific bias for hazard analysis and a social bias for the analysis of exposure and vulnerability.
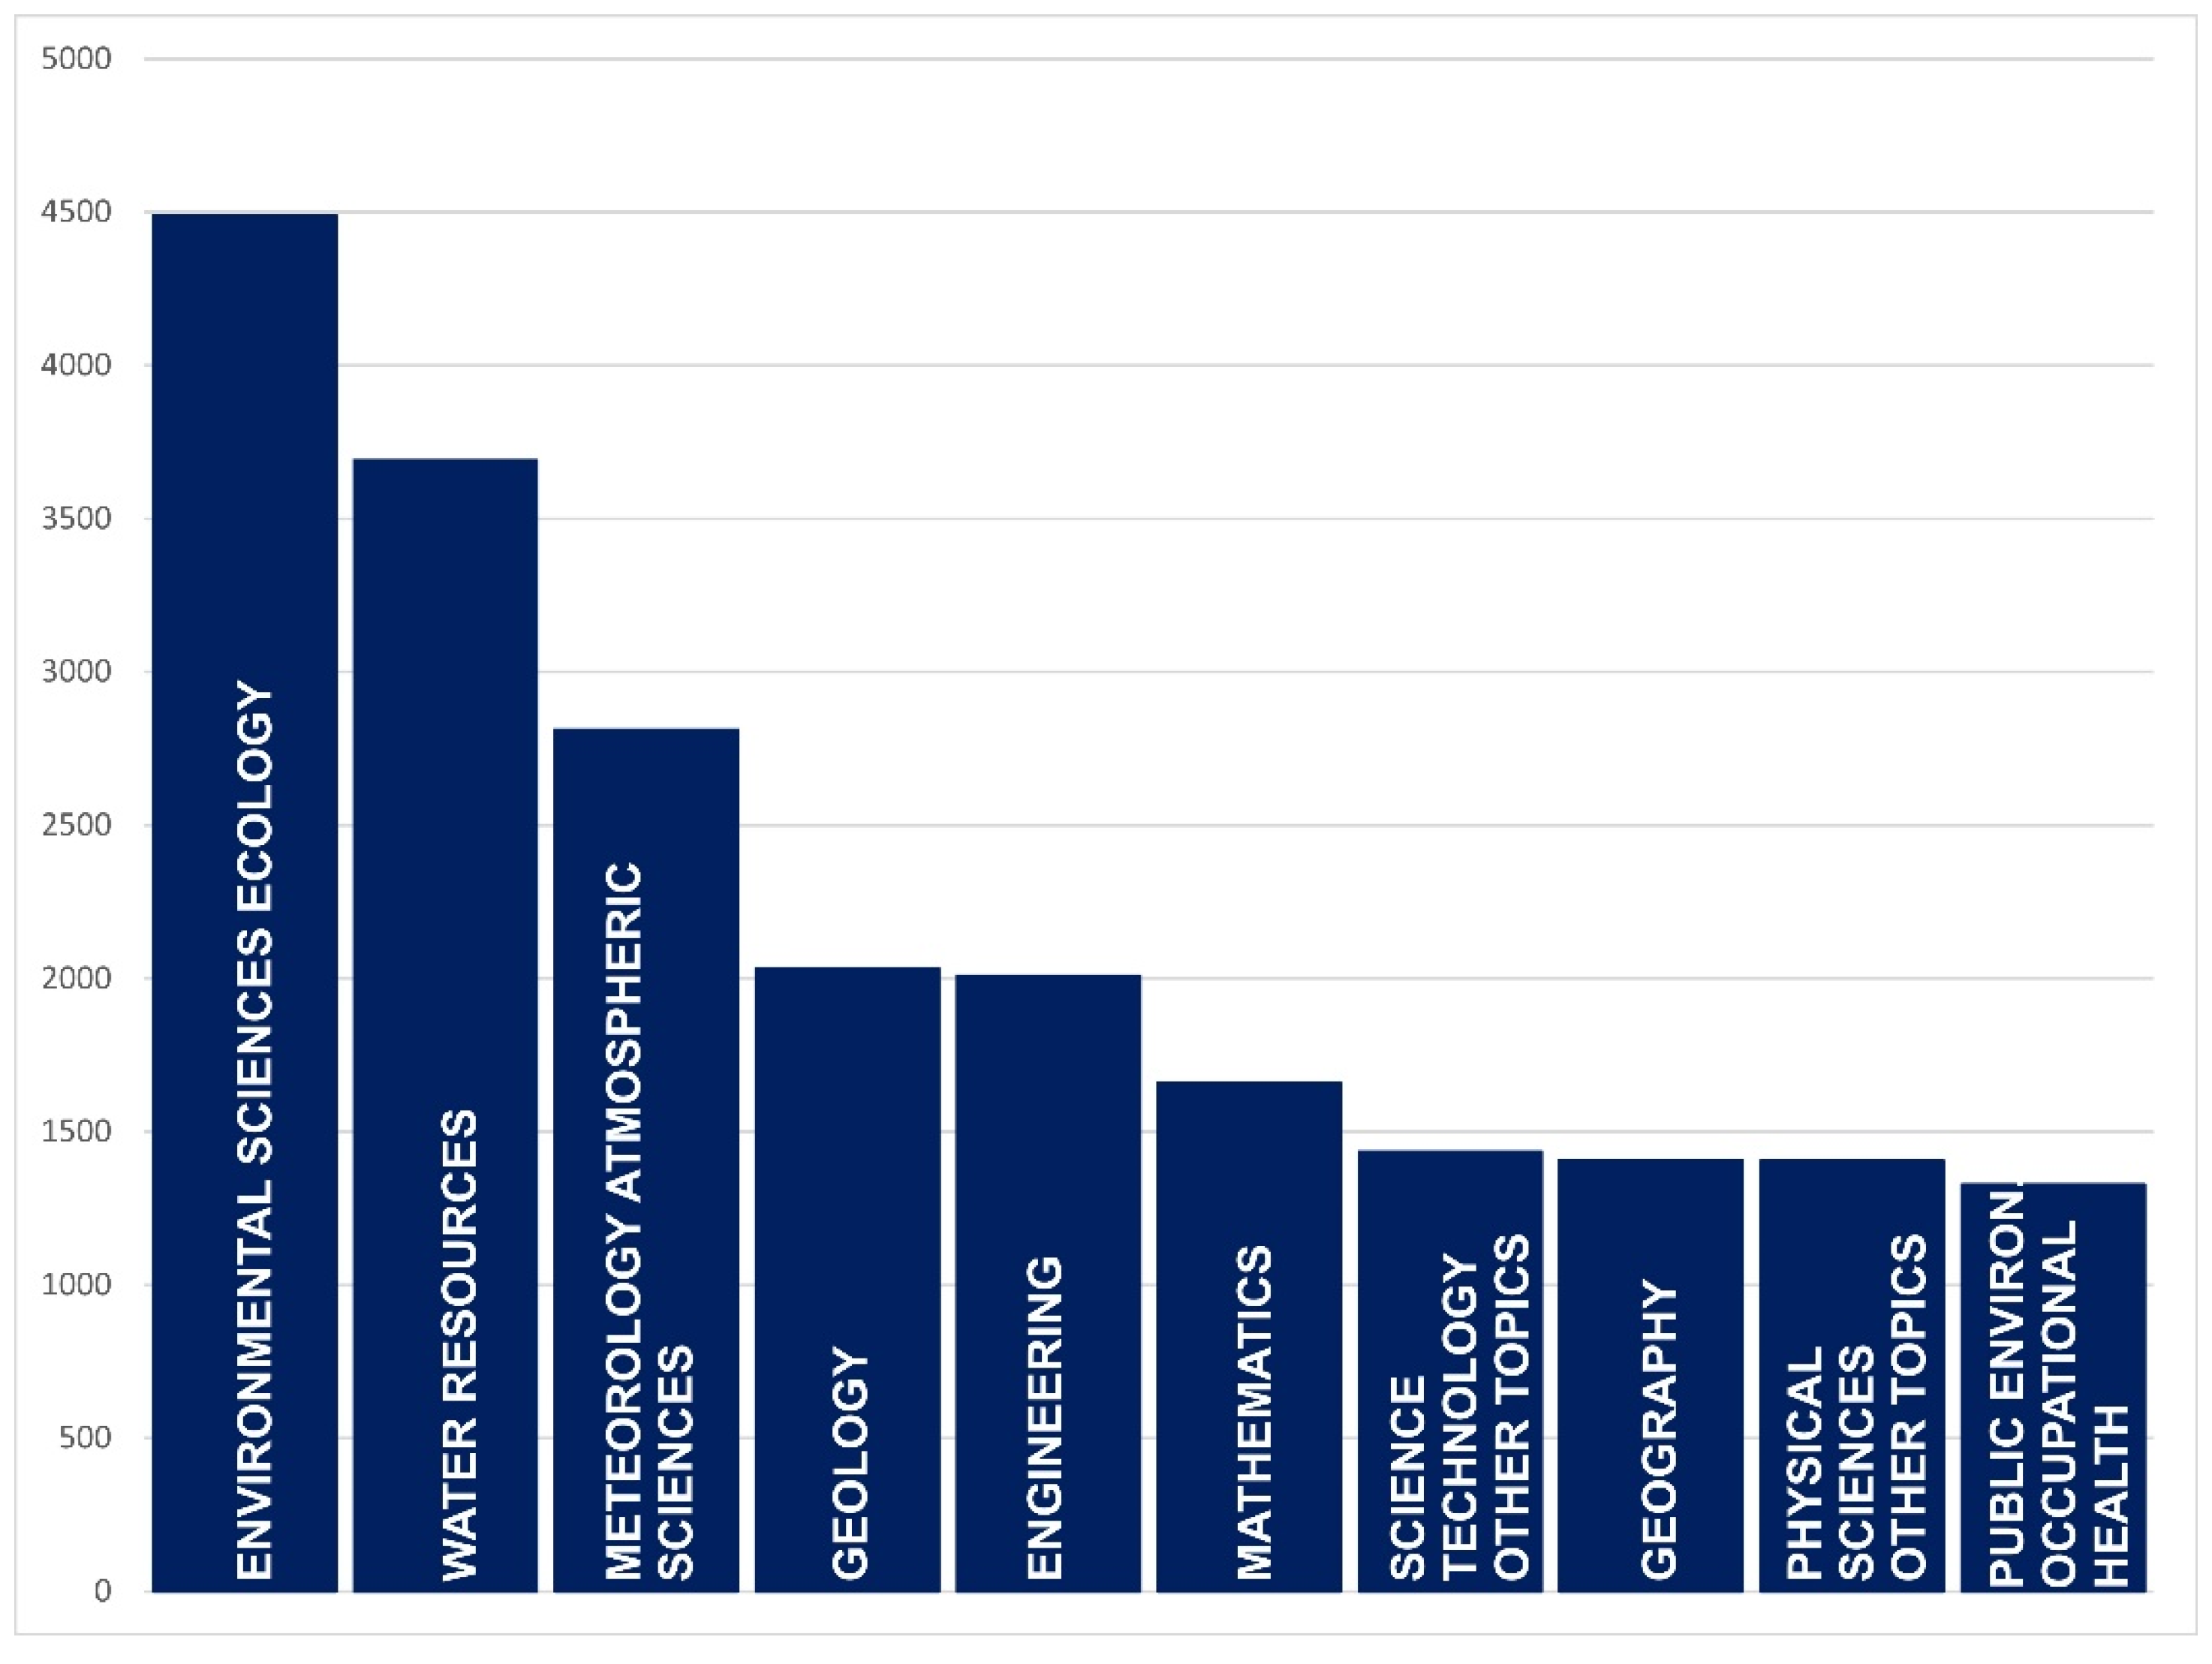
Regarding ‘Research Areas’, publications from the ‘Environmental Sciences’ area predominated (57.6% FRAn; 63% FRAs), followed by ‘Water Resources’ (45.7% FRAn; 51% FRAs) and ‘Meteorology and Atmosphere’ (36.7% FRAn; 39% FRAs); and to a lesser extent geology, engineering, mathematics, etc. (
Figure 3). This distribution is logical since FRA often requires multi and interdisciplinary evaluations of flood hazard, exposure and vulnerability, such as those usually developed by environmental sciences. In second place, as expected, was the area that manages flood risks and applies prevention measures (water resources), and following that, the research area that studies one of its main causes and early warning and forecasting (meteorology and atmosphere).
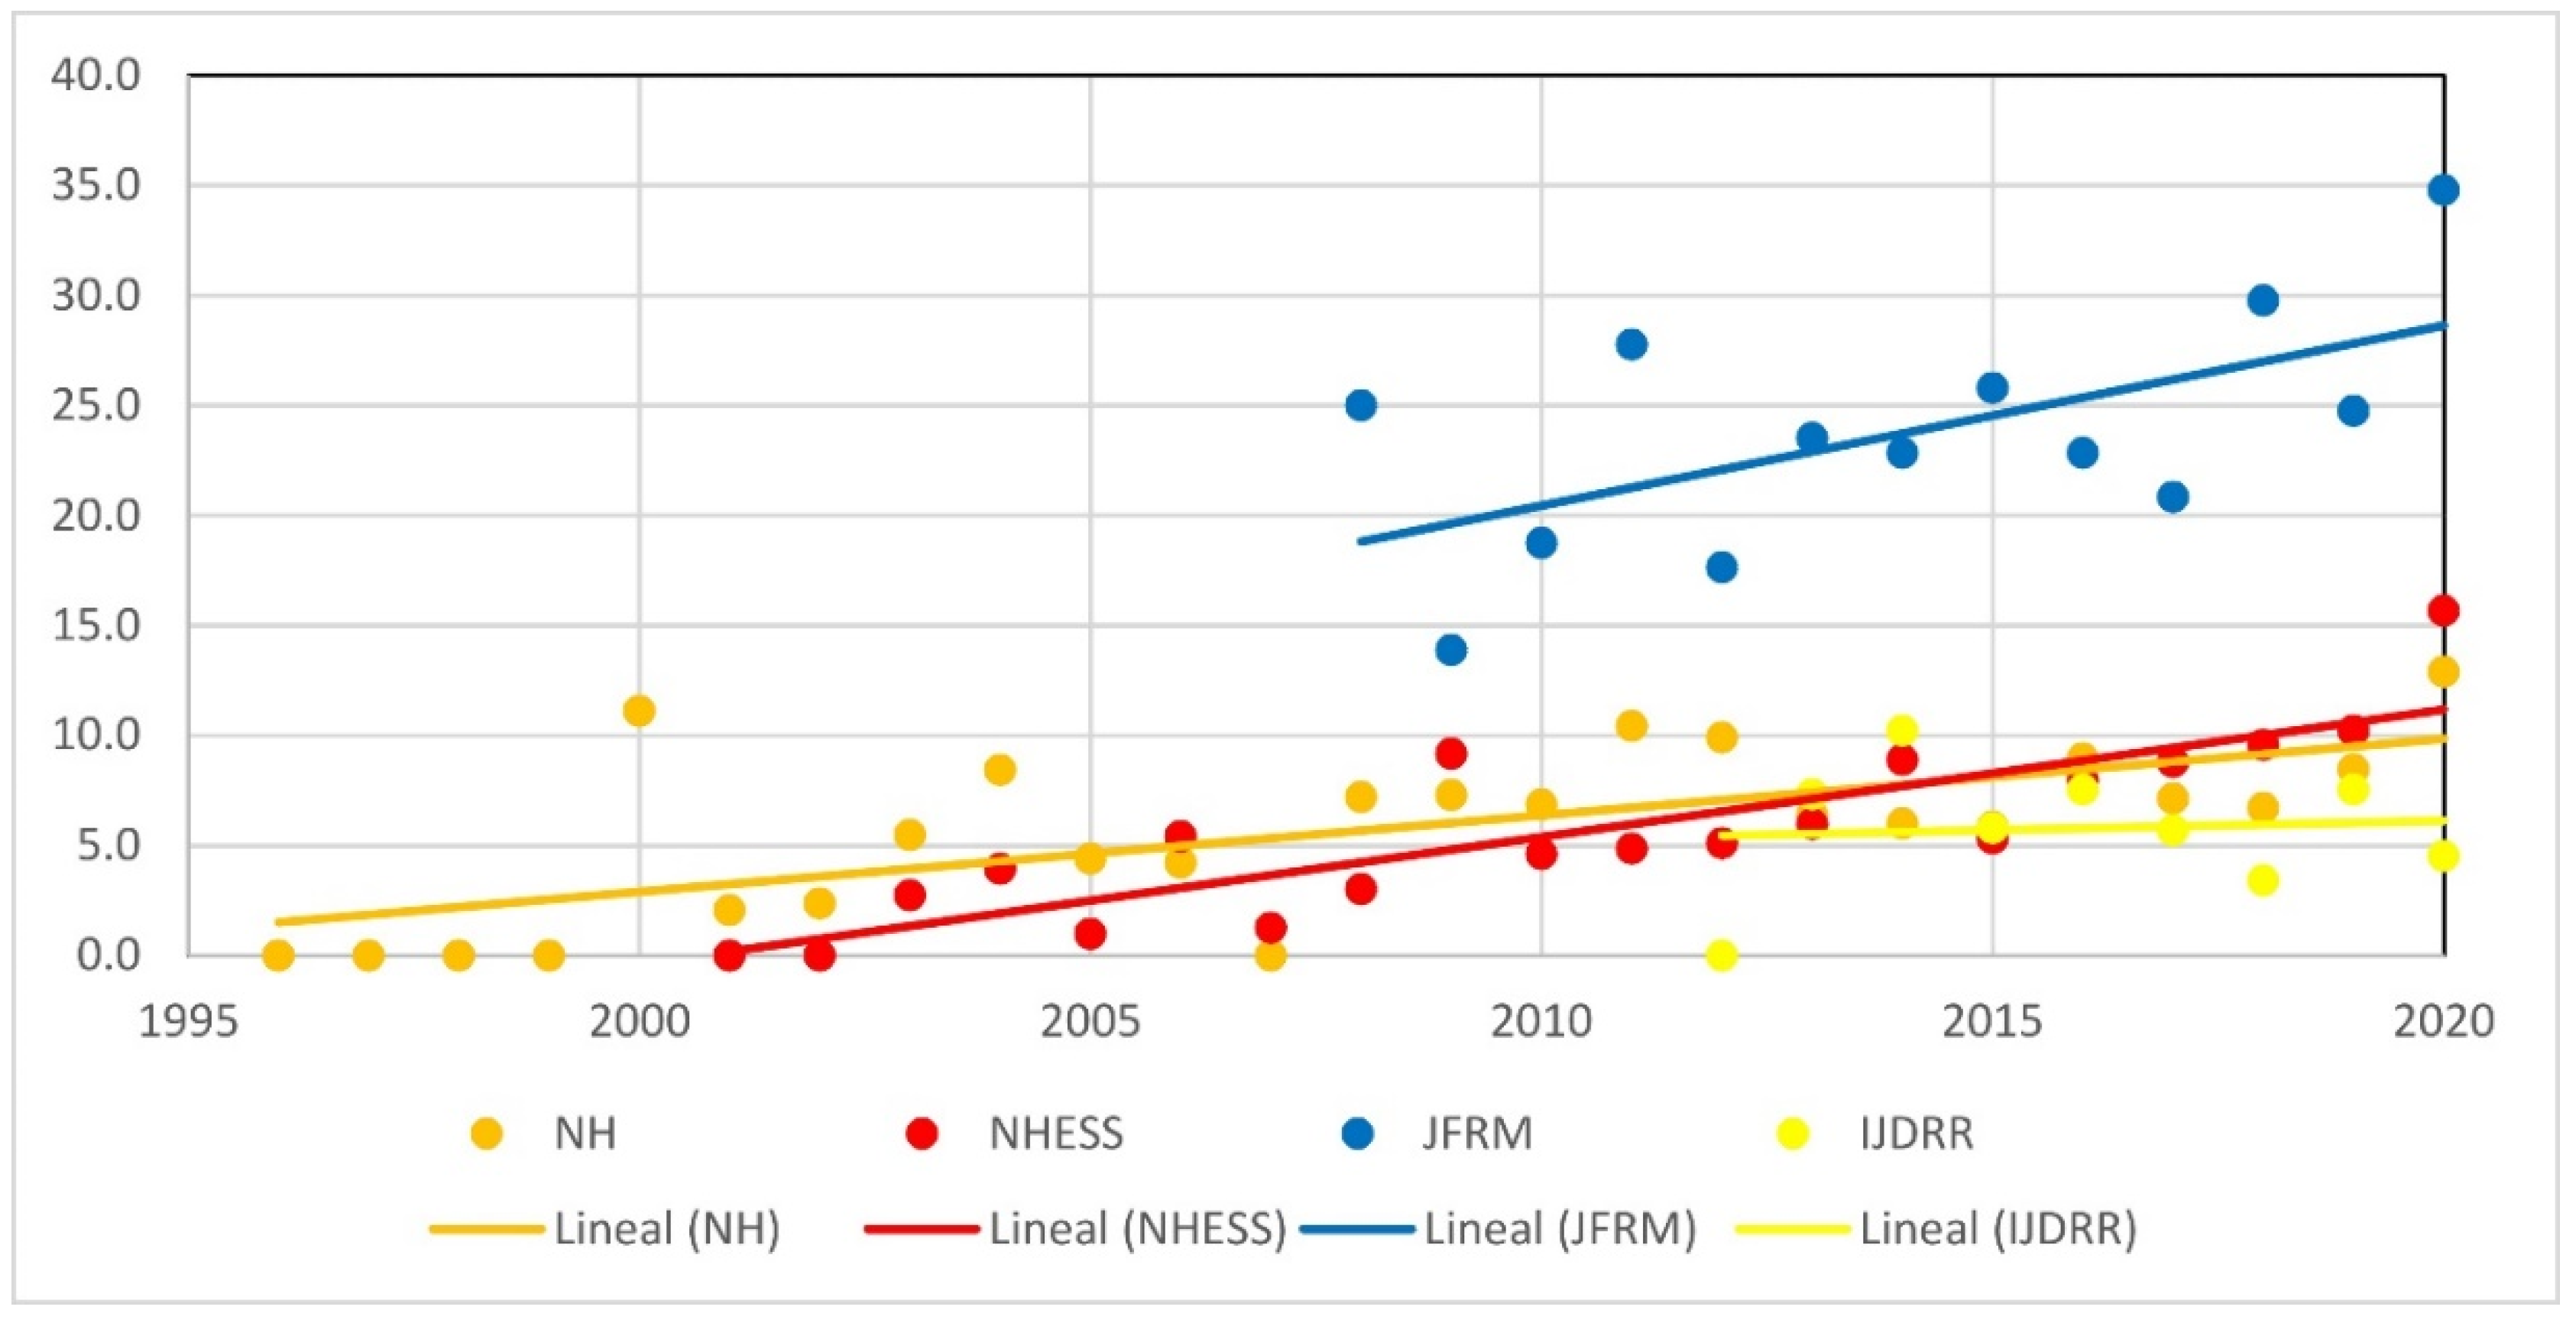
Among the journals that publish FRA papers, there are three sets of source titles: (i) a high level journal (>350 records), including only ‘Natural Hazards’ (NatHaz); (ii) middle level journals (between 140 and 250 records for each title), including ‘Natural Hazards and Earth System Sciences’ (NHESS), ‘The Science of the Total Environment’ (STOTEN), ‘Journal of Hydrology’ (JoH), ‘Water’ and ‘Journal of Flood Risk Management’ (JFRM) and (iii) low level journals (<125 records), including ‘International Journal of Disaster Risk Reduction’ (IJDRR), ‘Hydrological Processes (HP), ‘Water Resources Research’ (WRR), ‘Water Science and Technology’ (WST), ‘Risk Analysis’ (RA), among others. There are two possible explanations for this polymodal distribution of the source titles: either some of these journals publish a greater number of volumes and issues, and they therefore have a higher number of records (e.g., NatHaz reached a record production of 648 papers in 2015); or the scientific-technical community publish their works in a low number of journals due to their prestige (e.g., NatHaz had an impact factor of 2.319 in 2018) or due to their short editorial process times (e.g., NatHaz has a time span of 277 days of submission to acceptance); or a combination of both. In fact, most referenced sources are categorized as Q1 or Q2 in journal rankings (such as ‘Journal Citation Reports’ and ‘Scopus’) in recent times. Another factor that influences this distribution of records is the journals’ age, since titles such as ‘Water’ and JFRM (published since 2009 and 2008, respectively) have monopolized a large part of these works on FRA; compared to older ones such as JoH (1963), WRR (1965), STOTEN (1972), RA (1981), WST (<1982), HP (1986) or NatHaz (1988). NHESS (2001) could possibly be an intermediate case because it appeared at the time when FRA studies began to increase and it monopolized a large part of them. Another case is IJDRR (2012), the most recent, which is a journal that also seems directly focused on that kind of works. Indeed, if these journals are organized taking into account the percentage of articles on FRA they represent with respect to the total scientific production of the journal, three groups can be seen: (i) a journal with a high proportion of FRAs works, JFRM (24.5%); (ii) journals with an intermediate proportion (6–7%), such as NH, NHESS and IJDRR and (iii) journals with a percentage lower than 2%, including ‘Water’, JoH, HP, RA, STOTEN, WRR and WST. Furthermore, the evolution of these percentages over time was increasing for the first two groups of journals (
Figure 4), but especially in the case of the JFRM, which is on the way to becoming the journal of choice for the scientific-technical community for works on FRA.
Regarding the ‘Meeting Titles’, there is one congress (‘3rd European Conference on Flood Risk Management’ FLOODrisk 2016, held in Lyon, France, and supported by the Flood Risk Management Research Consortium) that has more than double the number of records (66 FRAn and 61 FRAs) than the next biggest contributors, which are 35th and 36th IAHR World Conferences, held in The Hague, The Netherlands, and organized by the International Association for Hydro-Environment Engineering and Research; (28 FRAn and 23 FRAs records). The rest of the meetings (FRIAR, IEEE IGARSS, 12th International IAEG Congress) all contribute between 10 and 20 publications.
Related to the main source titles and meeting proceedings, published exclusively in English, FRA papers contained in the WoS were mostly written in English (94.2% FRAn and 95.8% FRAs), as were most of the publications in this database (93%). FRA contributions in other languages (
Table 2), such as Korean, French, German, Spanish, Chinese and Russian, were almost incidental in WoS (less than 2.5% of total FRA records).
2.3. Countries, Institutions, Corporate/Groups and Authors
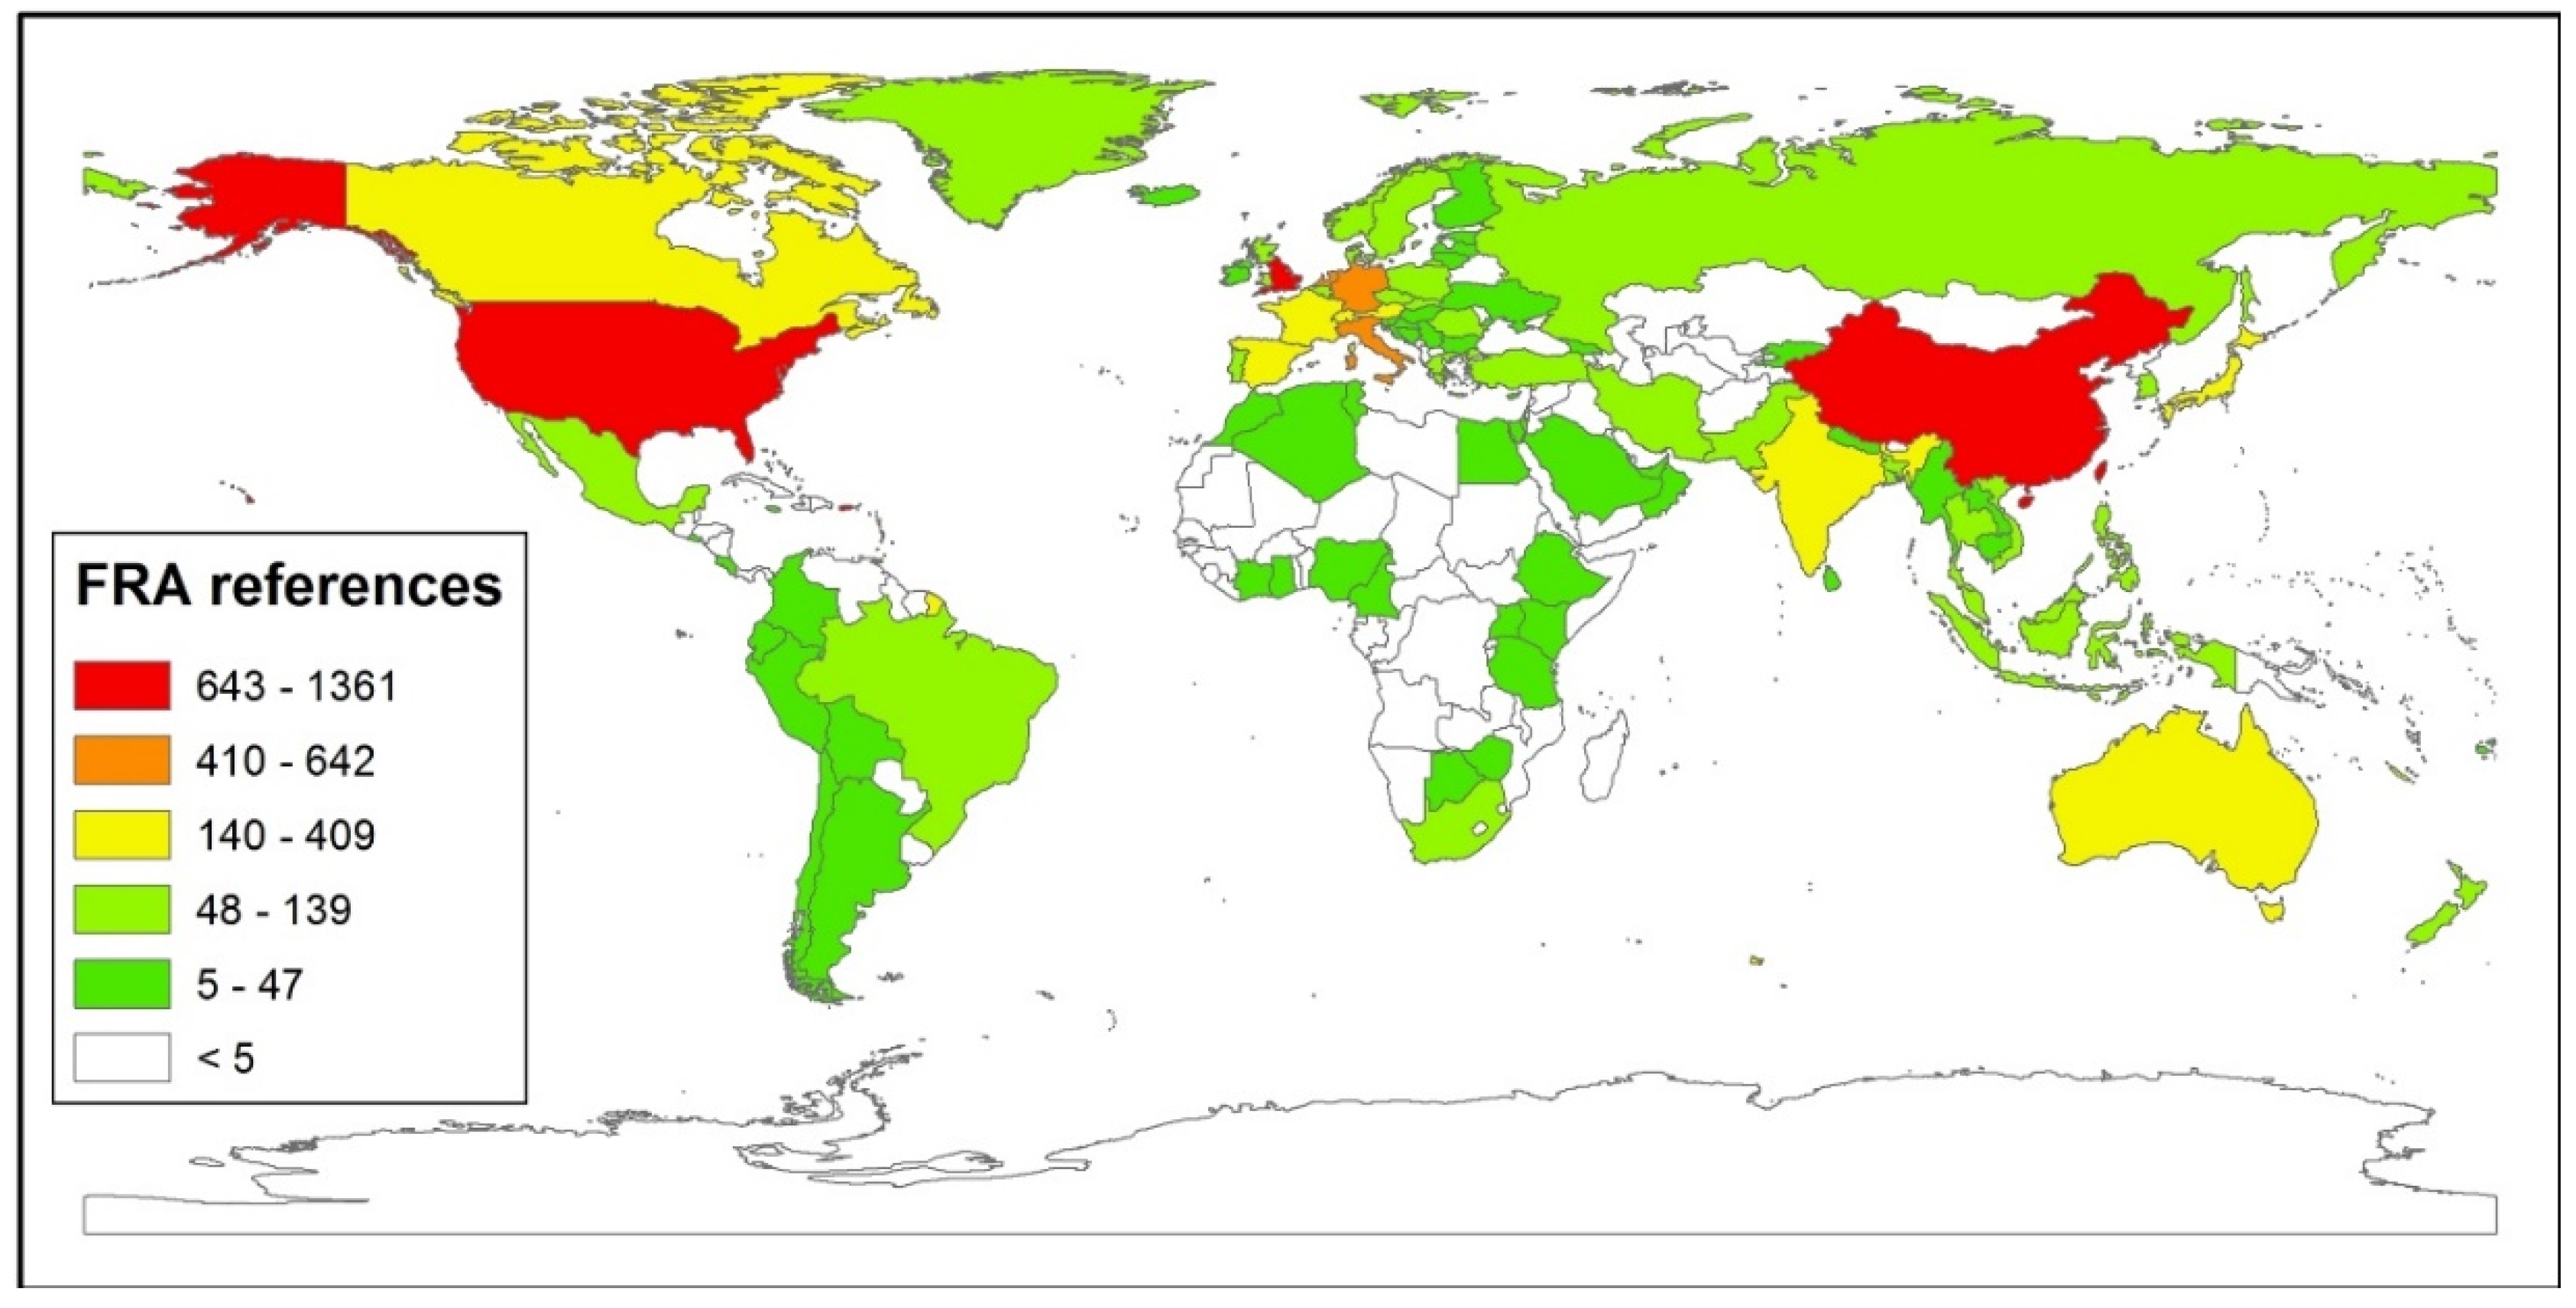
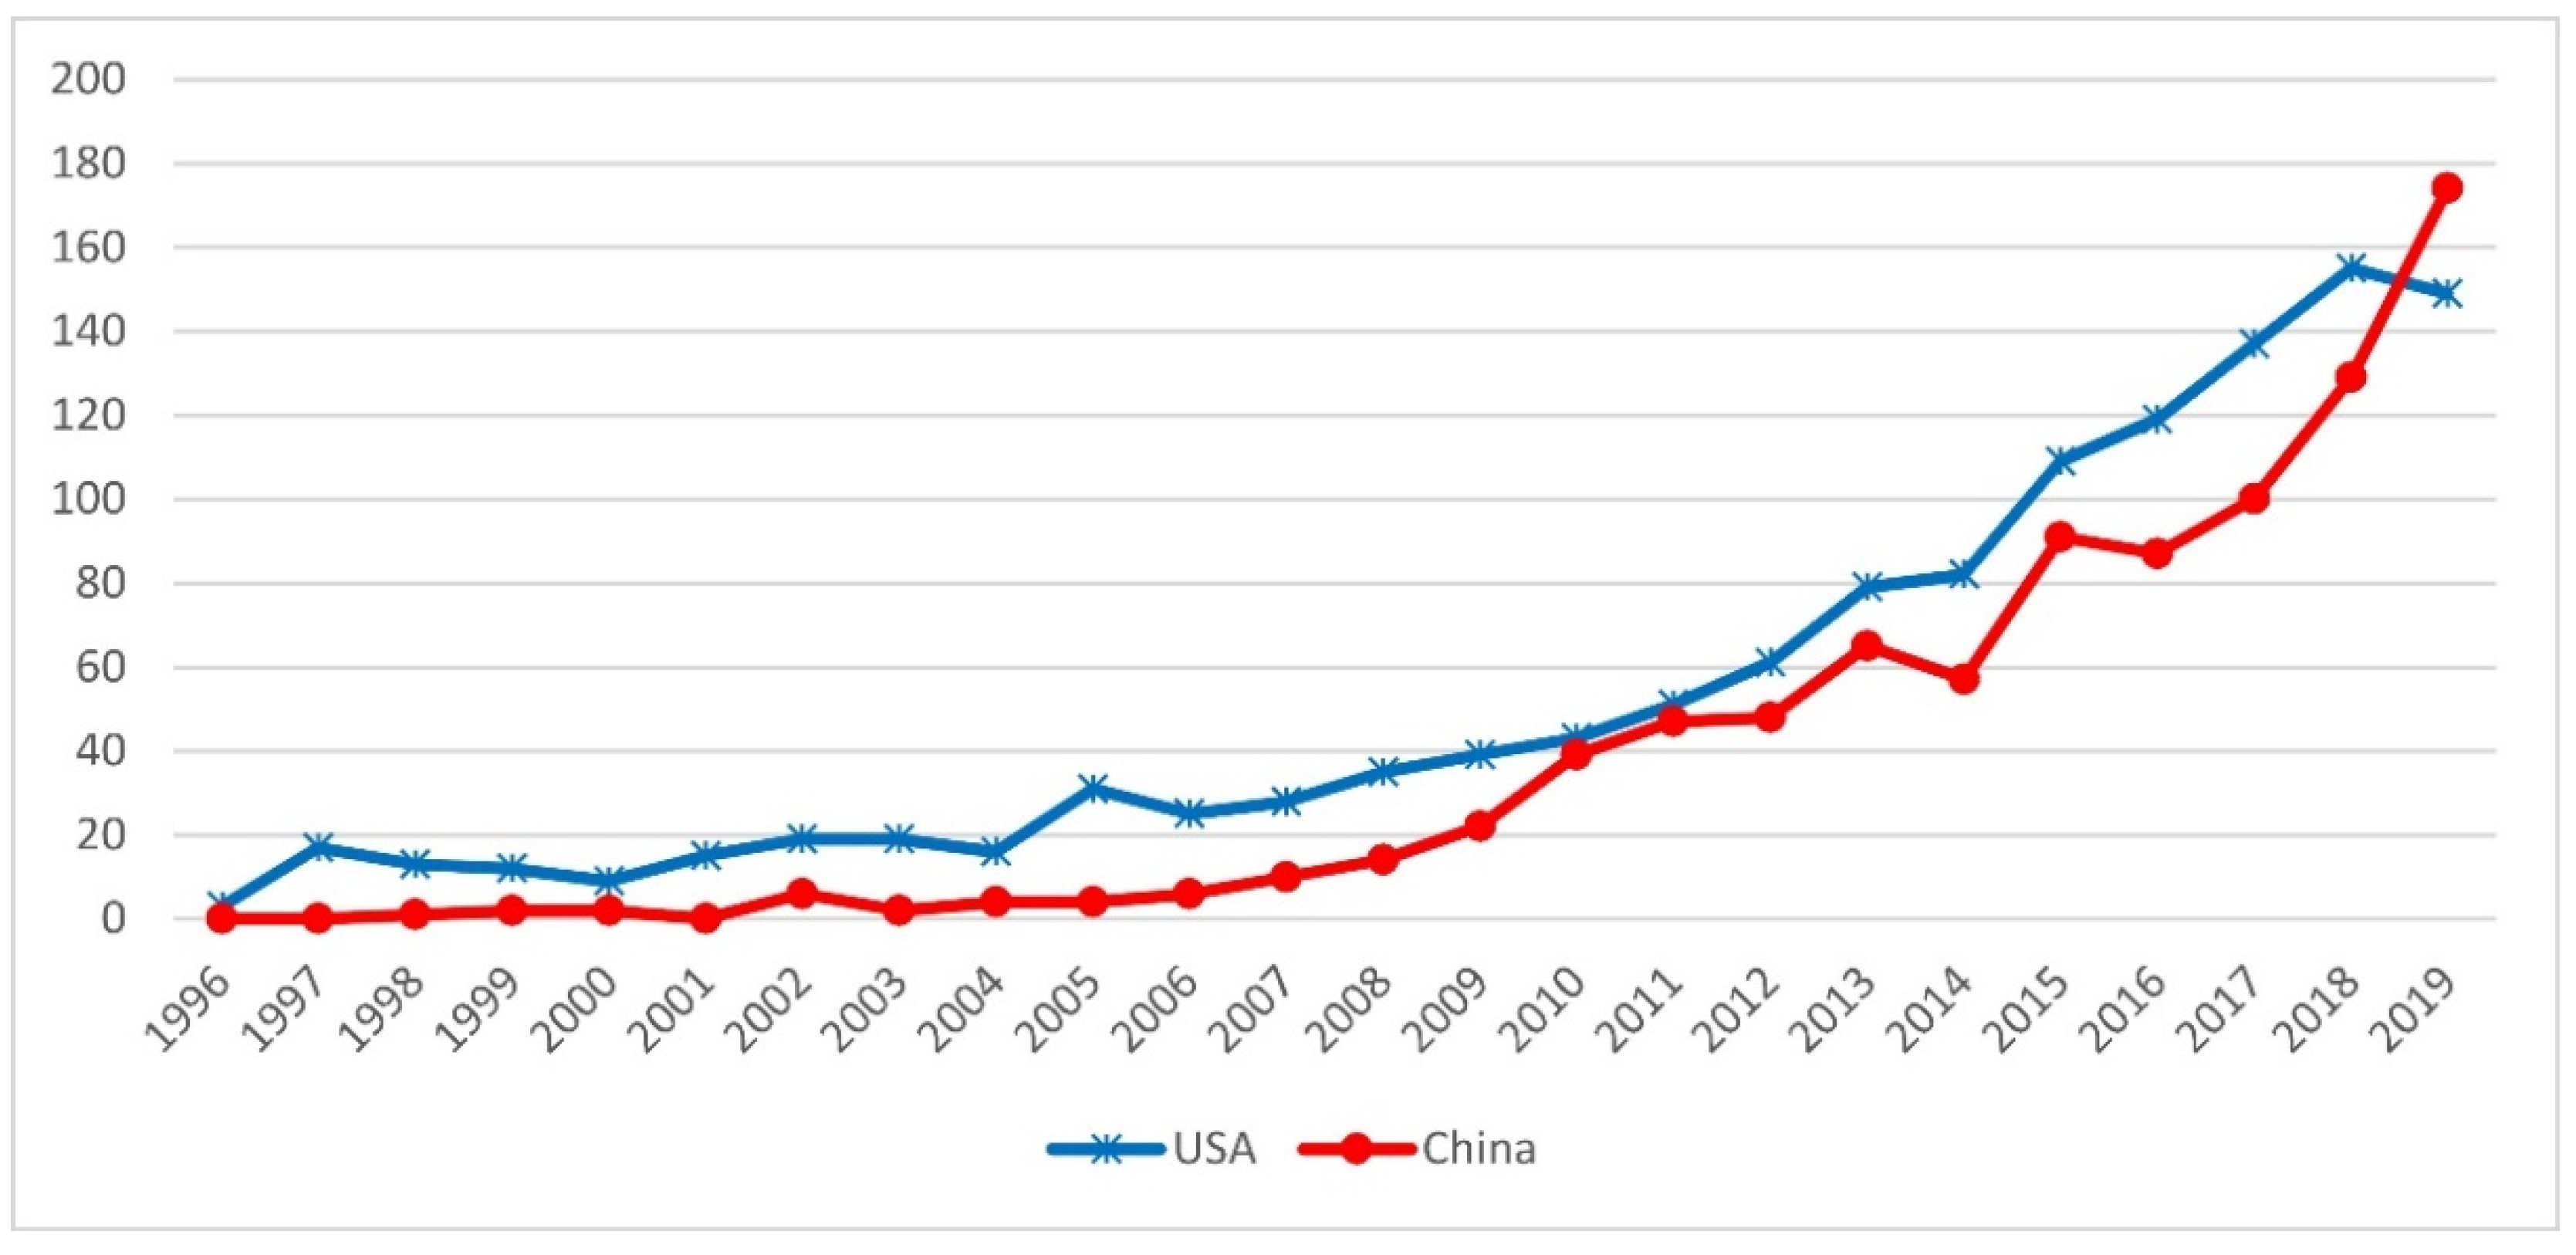
The geographical distribution of the countries and regions of the FRA articles, based on the study area and author affiliation, was heterogeneous. The records associated with the United States of America (19.2% FRAn and 18.1% FRAs) stand out, followed at a distance by those from the People’s Republic of China (14% FRAn and 12.7% FRAs) and England (10.5% FRAn and 12% FRAs). A succession of European countries (Germany, Italy, The Netherlands) held a smaller percentage (6.5–9%), in addition to other developed countries of Europe, Oceania, North America and Asia (
Figure 5). It is a reflection of North American leadership in science and technology in the late 20th century-early 21st century and the Anglo-Saxon dominance in scientific journals, especially in the source titles contained in the WoS. However, the emerging scientific production of FRA in China has been gaining on the US in the past years (and surpassed it in 2019;
Figure 6). This is due to the huge population of China and its growing university community, the fact that flood risk is one of the main problems of this country, and the incisive policies of scientific and technological production that have led to the opening of specific sections for Chinese authors in bibliographic databases such as the WoS.
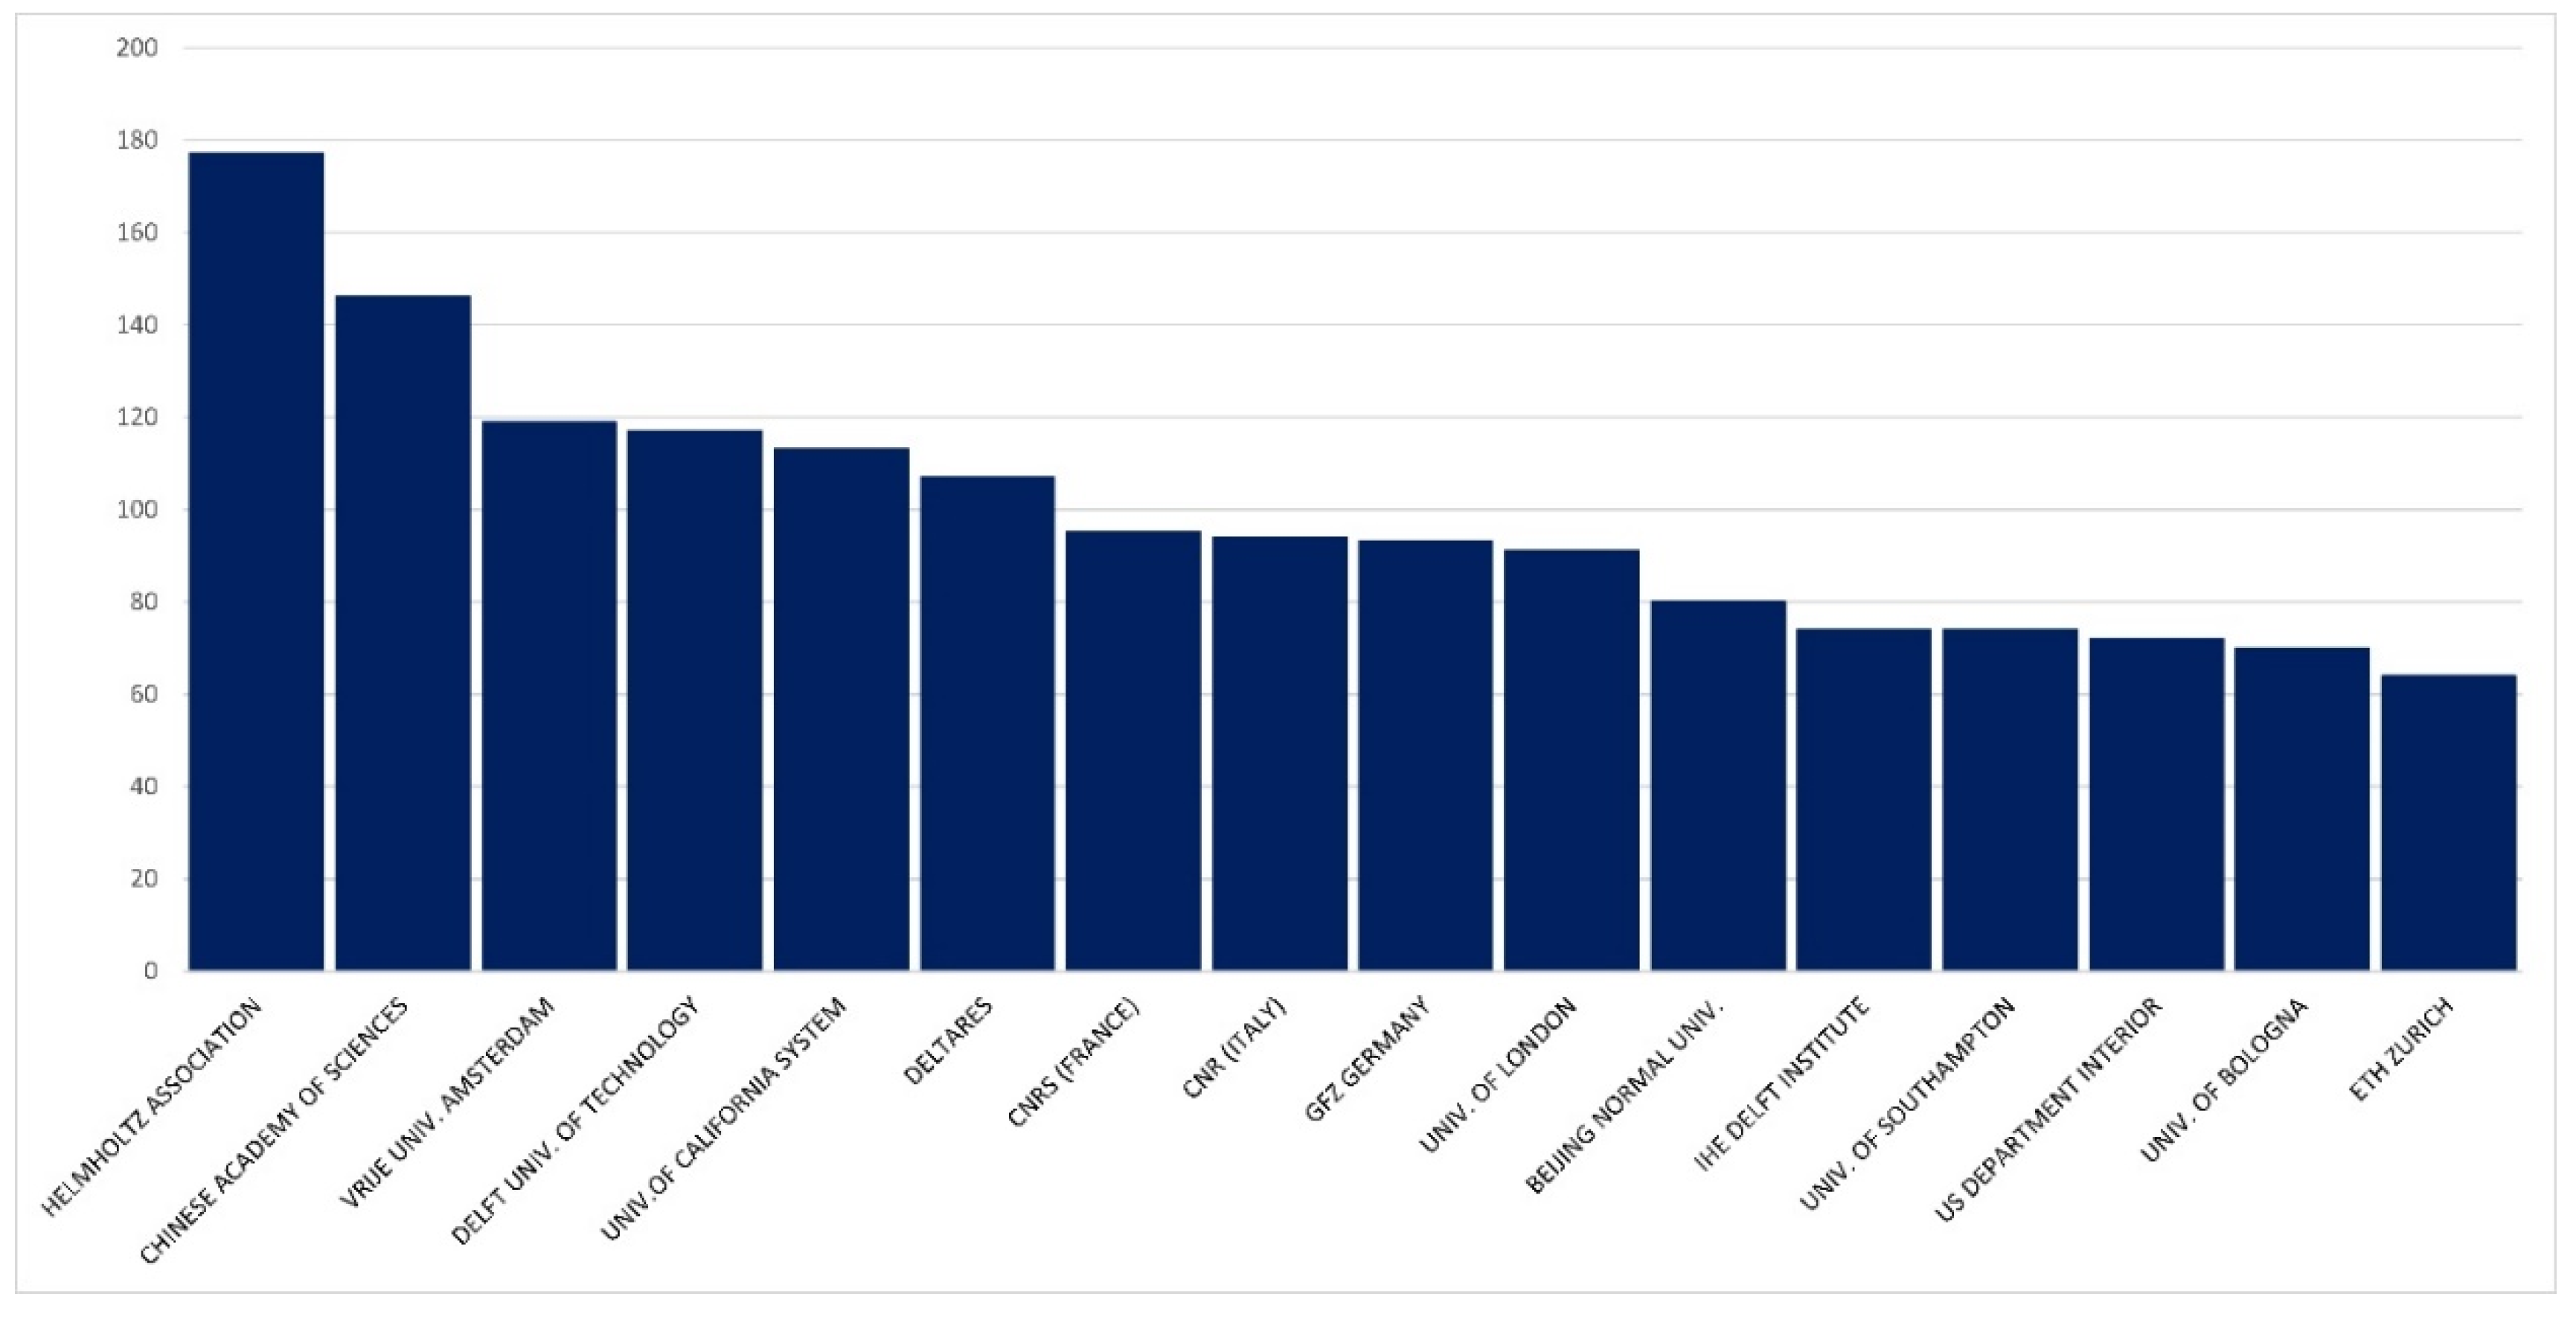
Related to those emerging countries in these techniques and their scientific policy strategies, the two institutions leading the production of FRA papers are the Helmholtz Association and the Chinese Academy of Sciences. This is followed by a uniform distribution of publications among other many European and North American institutions (
Figure 7), where the production of manuscripts by institutions from a relatively small country, like The Netherlands, must be highlighted due to the third and fourth position of the universities of Amsterdam and Delft.
The Helmholtz Association of German Research Centers (in German, Helmholtz-Gemeinschaft Deutscher Forschungszentren) was created in 1995 to formalize existing relationships between several globally renowned independent research centers [
26]. The Helmholtz Association contributes to solving important challenges facing society, science and industry by conducting top-level research in the fields of aeronautics, space and transport; Earth and environment; energy; health; matter and key technologies. It distributes core funding from the German Federal Ministry of Education and Research (BMBF) to its, now, 19 autonomous research centers and evaluates their effectiveness against the highest international standards. Among them, FRA production comes mainly from centers like the German Research Center for Geosciences (GFZ), at Potsdam. GFZ currently has a staff of around 1180 people and is active in all fields of Earth science. Its hydrology section has internationally recognized experience in research in the entire flood risk chain and in risk analysis and assessment methods. They develop simulation models of the various processes and calculate probabilities of occurrence and intensity for extreme hydrological events.
The Chinese Academy of Sciences (CAS) is the cornerstone of China’s ambition to explore and harness high technology and natural sciences for the benefit of both this country and the rest of the world. CAS was established on 1 November 1949, in Beijing, where it is headquartered. It was created by bringing together several existing scientific institutes and soon welcomed over 200 returning scientists who provided CAS with the high-level expertise they had acquired abroad [
27]. Among the most important CAS branches and institutes for FRA production are the Institute of Atmospheric Physics (IAP), the Center for Earth Observation and Digital Earth or the Institute of Hydroecology, Ministry of Water Resources.
Finally, the Department of Water and Climate Risk (Vrije Universiteit Amsterdam) is a dynamic group of 45 international researchers, faculty members and PhD students in the Institute for Environmental Studies (IVM). The department is led by Prof. Jeroen Aerts (Head) and Mr. Philip Ward (Deputy Head).
For the United States of America, despite being the country with the highest scientific production in FRA, the records are distributed among multiple universities (i.e., University of California system; included as a whole in the WoS databases) and isolated research centers, so that none stands out among the top positions. Conversely, the Chinese Academy of Sciences stands out by far for Chinese scientific production, providing most of the records from that country. Institutions in European countries and other centers in North America, Asia and Oceania are in an intermediate situation, except the German institutions, mainly concentrated in the Helmholtz Association.
Contrary to what happens with research institutions, there is no established tradition for using the names of research groups or corporate authors in scientific-technical publications. For this reason, in the list of research groups that undertake FRA studies, the records are few and widely scattered. Only one corporate author, the Institute of Electrical and Electronics Engineers (IEEE), accounts for most of the authors of publications (137 FRAn and 85 FRAs). It is followed by the Institute of Physics (IOP; 43 FRAn and 21 FRAs) and Surveying Geology and Mining Ecology Management-SGEM (42 FRAn and 32 FRAs), with about a third of the IEEE’s production; and other minor group/corporate authors (The American Society of Mechanical Engineers, ASME; 32 FRAn and 23 FRAs). The other groups (Geobalcanica Soc., United States Soil Department-USSD, Centers for Disease Control and Prevention-CDC, United States Committee on Large Dams-USCOLD, etc.) have less than 10 FRA records. IEEE, more than a group of corporate authors, is actually a global community. Its aim is to innovate for a better tomorrow through its 419,000+ members in over 160 countries by way of its highly cited publications, conferences, technology standards and professional and educational activities in engineering, computing and technology information. Similarly, SGEM is a group of scientists and technicians that organizes the International Multidisciplinary Scientific GeoConference. Their aim is to bring together leading academic scientists, researchers and research scholars to exchange and share their experiences and research results in the SGEM conferences on all aspects of Earth and planetary sciences. It also provides a premier interdisciplinary platform for researchers, practitioners and educators to present and discuss the most recent innovations, trends and concerns, as well as the practical challenges encountered and the solutions adopted in the fields of Earth and planetary sciences.
Nevertheless, several featured authors account for most of the group’s scientific production on FRA. Only a dozen authors exceed 30 records FRAn or 20 records FRAs (nFRAn-nFRAs) in the WoS database: Kreibich, H. (49–48); Merz, B. (43–45); Aerts, J.C.J.H. (41–35); Nicholls, R.J. (30–33); Hall, J.W. (43–30); Thieken, A.H. (27–30); Ward, P.J. (25–27); Singh, V.P. (32–8); Jonkman, S.N. (29–24); Fuchs, S. (18–23); Wang, J. (36–23); Zelenakova, M. (17–23); Zhang, Y. (32–23); Bouwer, L.M. (14–22); Li, Y. (32–22) and Chen, C.W. (24–21). All of them are prestigious researchers with high impact parameters, with a Publons h-index and ResearchGate Score-RG usually over 30. They lead groups with dynamic scientists and technicians that are attached to powerful institutions. This leads us to suppose that, at least in the FRA research field, it is more productive (in terms of publications) to have teams that provide a critical mass than the individual works of isolated researchers. An overview of some of their research profiles (FRA records > 25) is:
Heidi Kreibich (h = 31; RG = 37.51) is head of the working group “Flood risk and climate adaptation” (8 members) at the Hydrology Section, German Research Center for Geosciences (GFZ). Her research is focused on flood risk assessment and mitigation with a background in Environmental engineering, Hydrology and Geography.
Bruno Merz (h and RG unavailable) is head of the Hydrology Section in the German Research Center for Geosciences (GFZ), where he led one of the most influential research groups on FRA studies and on European flood prevention policies. His research interests are: flood risk, hydrological extremes, multi-hazards, monitoring and simulation of hydrological/hydraulic processes, risk analysis and non-linear statistical methods.
Jeroen C.J.H. Aerts (h = 46; RG = 29.48), holds a Ph.D. in Hydrology and Risk Assessment and is director of the Institute for Environmental Studies (IVM), as well as head of the ‘Water and Climate Risk’ department, and currently supervises a research group, with 6 academic staff, 20 PhD students and 5 post-docs addressing various aspects of water and climate risk management.
Robert J. Nicholls (h = 53; RG= -) is Professor of Coastal Engineering at the Engineering and Physical Science Department at the University of Southampton (United Kingdom). His research is mainly focused on long-term coastal engineering and management, especially the issues of coastal impacts and adaptation to climate change, with emphasis on sea-level rise.
Jim W. Hall (h = 18; RG = 42.38) is Professor of Climate and Environmental Risks at the University of Oxford (United Kingdom) and Director of Research in the School of Geography and the Environment. He is internationally recognized for his research on risk analysis and decision making under uncertainty for water resource systems, flood and coastal risk management, infrastructure systems and adaptation to climate change.
Annegret H. Thieken (h = 37; RG = 36.44) currently works at the Institute of Environmental Science and Geography (part of the former Institute of Earth and Environmental Science), Universität Potsdam, Germany, where she is head of the working group “Geography and Disaster Risk Research” (12 members). Her team investigates natural hazards and risks, particularly flooding. One ongoing project is the research training group NatRiskChange—Natural Hazards and Risks in a Changing World.
Philip J. Ward (h = 37; RG = 39.04), holds a Ph.D. in Earth and Life Sciences and is senior researcher at the Institute for Environmental Studies (IVM) at the Vrije Universiteit Amsterdam (Amsterdam, The Netherlands), where he is Lab head supervising five members.
As can be seen, several of the top authors work in the same research centers (GFZ: Kreibich, Merz and Thieken; IVM: Aerts and Ward), which again demonstrate the importance of having a critical mass of researchers with interrelated teams. On the other hand, it is curious that some famous and prestigious authors in the field of flood risk, such as Günter Blöschl (Vienna University of Technology, Vienna, Austria), Marco Borga (University of Padova, Padova, Italy), Bruno Mazzorana (Austral University of Chile) or Lorenzo Marchi (Italian National Research Council), among others, do not lead the ranking in number of FRA publications in the WoS database. Perhaps many of their contributions are categorized as flood hazard analysis or simply as basic studies of the flooding phenomenon.
2.4. Research Spotlight on FRAs
Regarding the research spotlight on FRAs, a citation report has been created for the 7421 FRAs records in the WoS (20 April 2020). The average number of citations per item was 16.91, and per year 2852. The sum of times cited was 125,478 (106,991 without self-citations). Citing articles were 77,718 (73,738 without self-citations). The oldest record was published in 1976 and the newest one this year (2020).
Sorting all records by number of times cited, there were: 80 items with citations over ten times the average (170); 16 items over twenty times (339) and only one item over thirty times or more. Of the top 20 items by times cited, there were at least 14 records directly related to FRAs as the main theme of papers (
Table 3). Note that the main themes of the top-cited papers were evaluated subjectively based primarily on title and abstract.
These 14 items share a number of common characteristics. Most of them were published recently (2005–2015), and despite this, they had a high number of citations in a short time. All of them had two or more authors (2–17), with a mean of 5.2 authors per paper. This is because some of the selected items were reviews and syntheses made by huge groups of collaborators and international consortia. Global or continental studies predominate (17/20) over regional or national papers (3/20). The most frequently repeated themes were related to climate change (global change, greenhouse effect and sea-level rise) and their impacts on flood risk (9/20). Other common themes were flood risk perception and communication (4/20), coastal flood risk (4/20) and relation to other natural hazards, such as landslides (2/20) or glacial hazards. Finally, most research spotlights were papers published in some of the most prestigious scientific journals (Q1), related to climate change and natural risks, like Nature Climate Change (2), Risk Analysis (2), Nature, PNAS, PloS One, Climate Change, Global and Planetary Change, NHESS, etc.
Among these 14 selected items, five papers can be highlighted for their global contributions to FRA research, especially regarding the consequences of global change for flood risk. Two of them were published in the same issue and volume of Nature Climate Change. “Future flood losses in major coastal cities”, Hallegatte et al. [
28], provided a quantification of present flood losses in the 136 largest coastal cities (average of 6 billion USD per year). It identified the cities that seem most vulnerable to climate change trends, that is, where the largest increase in losses can be expected in the future (up to 50%). “Global flood risk under climate change”, Hirabayashi et al. [
29], proposed a global river routing model with an inundation scheme to compute river discharge and inundation area. It showed that global exposure to floods would increase in certain areas of the World depending on the degree of warming. Another review article on “Assessment of economic flood damage” (Merz et al., [
15]) reviewed the state of the art and identified research directions of economic flood damage assessment, which required much greater efforts for empirical and synthetic data collection and for providing consistent data to scientists and practitioners. The paper “Flood risk and climate change: global and regional perspectives” (Kundzewicz et al. [
30]) provided a holistic perspective on changing rainfall-driven flood risk for the late 20th and early 21st centuries, assessing the literature included in the IPCC SREX report and new literature published since then. Finally, the paper “A Review of Risk Perceptions and Other Factors that Influence Flood Mitigation Behavior” (Bubeck et al., [
31]) provided a review of factors that motivate precautionary behavior other than risk perceptions. It concluded that the current focus on risk perceptions as a means to explain and promote private flood mitigation behavior is not supported on either theoretical or empirical grounds.
2.5. Including “Uncertainty” as a Theme
The analysis of uncertainties is increasingly important in FRA, not only because the analysis and assessment involve many different data sources and methodologies, each one with their associated uncertainties, but because of their spread or propagation throughout the analysis and assessment process. Two different sources of uncertainty, aleatory uncertainty (due to natural and anthropogenic variability) and epistemic uncertainty (due to incomplete knowledge of the system), must be analyzed [
11].
If a new term related to uncertainty (“uncertaint*”) was entered in the search string (
Figure 1), the number of search results dropped significantly, going from the previous 9840 FRAn and 7166 FRAs to only 1444 and 1093 records, respectively. Furthermore, the number of FRA records related to uncertainties increased exponentially over the last quarter century (
Figure 8). However, this effect is misleading, because the percentage of these items with respect to the total number of FRA publications (which increased in the same proportion) remained between 10 and 20%, without a clear trend. This shows that although all definitions of risk, risk analysis and assessment include uncertainties (see Díez-Herrero and Garrote [
1]; in the Editorial of this Special Issue), the reality is that only a sixth of the FRA publications included the concept in their key topics. The reason for this may be the difficulty of incorporating quantitative uncertainty analysis, and especially its dissemination through the risk analysis and assessment process.
Among the search results, including uncertainties and their distribution according to different categorization criteria, only the following items show remarkable changes with respect to previous analyses (see
Section 2.1,
Section 2.2 and
Section 2.3):
Research areas: the publications in the environmental sciences and water resources areas were more equally represented (65.8% FRAn and 65.6% FRAs; and 63.5% FRAn and 64.7% FRAs; respectively), because it was precisely in the latter that a greater number of uncertainty analyses were carried out on parameters of frequency and magnitude of floods for hazard analysis.
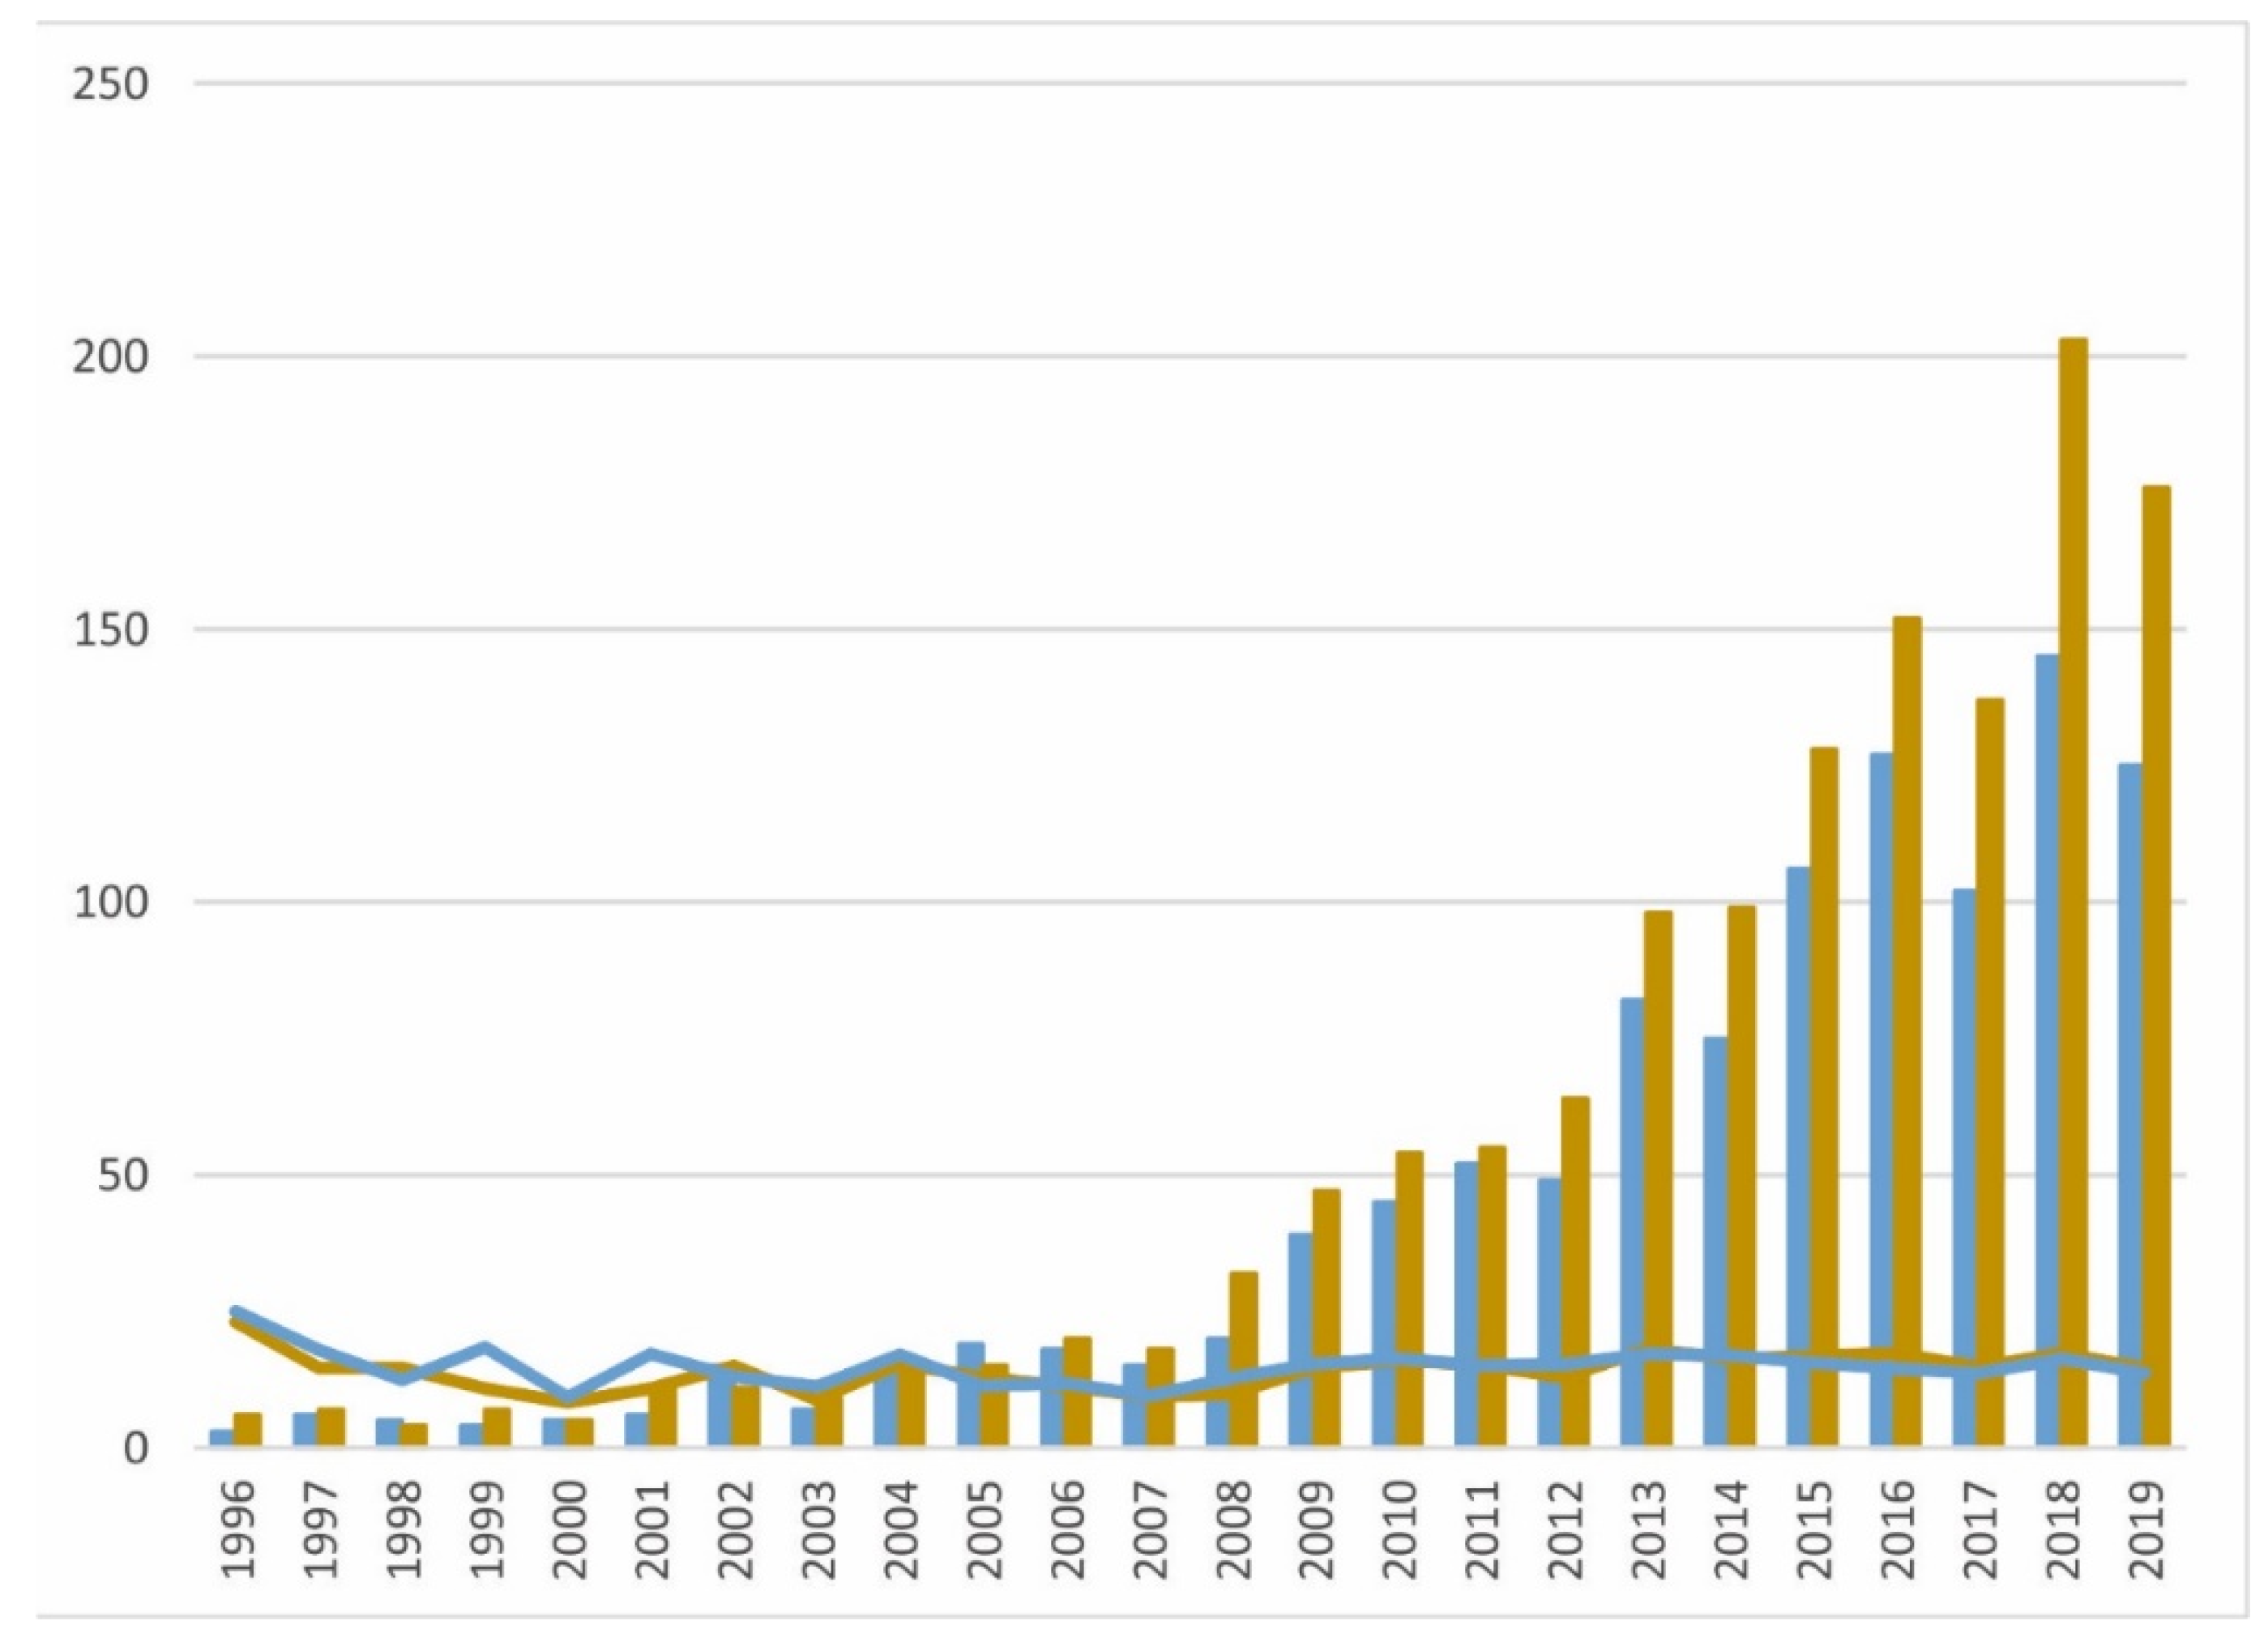
Publication years: although the temporal evolution shows an upward trend, the growth in publications over time was not as continuous and progressive, but rather shows successive decreases and peaks in three-year cycles (compare bar charts in
Figure 2 and
Figure 8). There were also significant leaps in 2009 first, and then in 2013, possibly due to improvements in uncertainty analysis procedures.
Countries/regions: the number of publications from England and the US became similar; the People’s Republic of China moved from second (see
Figure 5) to third position (FRAn) or to the sixth position (FRAs) and the rest of the European countries appeared with lower percentages in differences, especially Germany, Italy and The Netherlands. Perhaps English-speaking countries have a longer tradition of analyzing uncertainties than the Chinese, who conduct research projects that are not as conceptual and more pragmatic. This could indicate that those countries with a longer tradition (such as the US and the United Kingdom) are also ahead in terms of including uncertainty, while China, which is a newer player, mostly uses methodologies that were standardized long ago and that do not consider uncertainty.
Source titles: Journal of Hydrology (FRAn) and NHESS journal (FRAs) surpassed NatHaz. Additionally, the percentages of the main sources were more equal than in previous analyses, especially those that were more quantitative and that promoted more scientific publications, compared to the more descriptive and applied ones.
Institutions: Delft University of Technology surpassed Helmholtz for FRAn; although the first position in the ranking of publications for FRAs was still occupied by Helmholtz. The following places were now occupied by prestigious European technical institutes with a strong focus on river engineering (Bristol, Deltares, Oxford) and not so much by scientific institutions. This could indicate that the institutions that the use of more of an engineering approach may be better prepared to cope with the spread of uncertainty throughout the process, unlike those with a different focus that may have less statistical knowledge.
2.6. Regarding the Most Used Approaches and Methodologies
Regarding the most frequent methodological approaches for flood risk analysis and assessment (frequency estimation, use of magnitude-damage functions, etc.), the specialized bibliography, following some of the items listed by Merz et al. [
15], offers the results shown in
Table 4.
The number of records in the WoS database shows that flood risk analyses and assessments mainly used hazard analysis, to a lesser extent vulnerability, and even much less exposure. Within flood hazard analysis, geological methods may seem to be predominant, but this misleading result is due to references to the geological context of the studies, and not so much to the use of geological analysis itself. It is evident that hydrological modeling and the flood frequency analysis were used the most, compared to other methods and data sources, such as historical-documentary and palaeohydrological, which were almost incidental. Within the hydrologic–hydraulic methodologies, the recent trend shows an increase in hydrologic and hydraulic modeling (probably related to an increase in the study of small ungauged basins), and a decrease in flood frequency analysis (
Figure 9).
Regarding flood exposure, published studies mainly deal with population and land use data, compared to a limited use of the cadastre and the CORINE-Land Cover inventory. Regarding flood vulnerability, although frequently cited, quantitative analyses are performed only occasionally, and in those cases they mainly use the damage functions, specifically those that look at depth-damage. Finally, the widespread use of geographic information systems (GIS) and maps in most of the published works is striking. Common methodologies and techniques, like cost–benefit analysis (CBA) and Monte Carlo, had only been cited in 7% and 2.5% publications, respectively. The three main components of flood risk (hazard, exposure and vulnerability), as well as the use of GIS and flood mapping, had evolved over time (1996–2019) with a sustained upward and parallel trend, with no significant variations between them.
2.7. Fields of Application
Another interesting exercise is to organize scientific-technical production according to the main fields of application of flood risk analysis and assessment [
13], which allows us to have a perspective of their past and future usage. The results of organizing the fields of application into general aspects and predictive, preventive and corrective applications are presented in
Table 5.
Preventive applications that focus on risk management predominated, as opposed to corrective ones in civil protection, which were a minority. This distribution is logical, bearing in mind that the scientific-technical community is much more dedicated to preventive studies than to acting in emergencies.
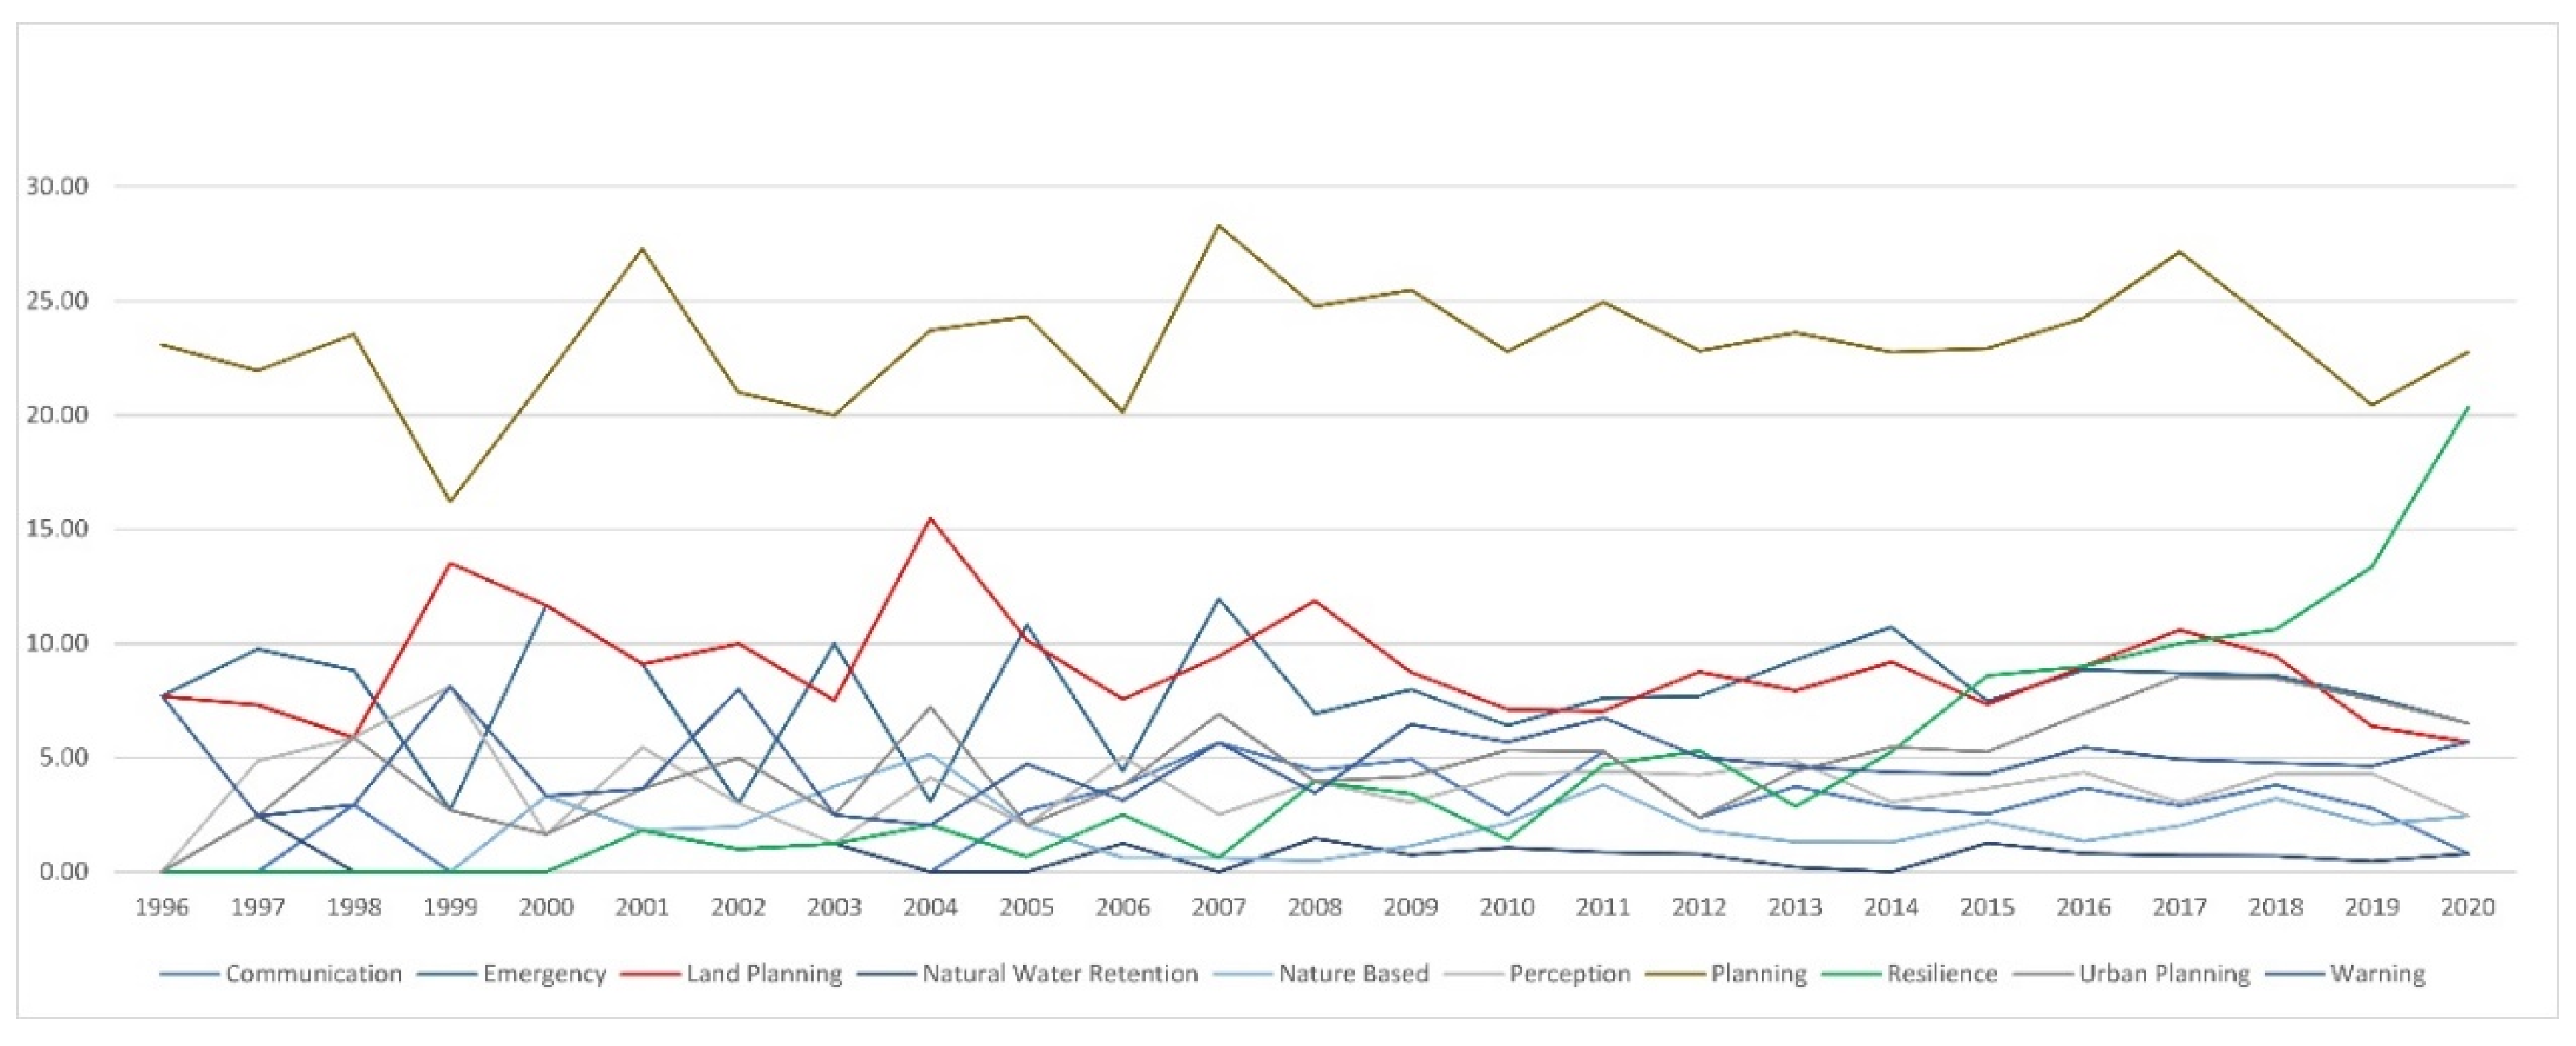
Non-structural preventive applications predominated and, among them, land planning applications. This is more common in natural areas than in those related to urban planning. The next group would be applications for improving resilience, which were much more common than other non-structural applications of a psycho-social type, such as increasing perception, communication and dissemination of flood risk or the establishment of insurance and reinsurance systems. Among the structural measures employed, civil works covered most of the references and, although they were gaining more and more prominence (
Figure 10), there were still few references to natural water retention measures (NWRM) or nature-based solutions (NbS). Predictive applications were dominated by early warning systems associated with weather models; and among the corrective applications, those aimed at emergency management, with fewer references to civil protection.
Another interesting aspect is the evolution over time of civil works referring to various groups of these applications, which were on the rise in almost all cases and in scientific production overall. However, as the total production of publications had also undergone sustained growth, it was necessary to normalize the total number of FRA works published each year, which allowed us to see more clearly the changes in priorities in mitigation policies and their reflection in international scientific-technical production (
Figure 10).
As can be seen in
Figure 10, the different fields of application analyzed for FRAs maintained similar percentages of scientific production over the past 25 years, with the exception of resilience, which went from zero between 1996 and 2020, to around 20% in 2020, with sustained growth over time. Although the rest of the applications remained in a band of percentages, between 1996 and 2010 they registered an enormous year-on-year fluctuation, with peaks and valleys in the percentages, compared to a period of greater stability between 2011 and 2020. This can be interpreted as a stabilization of the scientific production of these specialties. Only land planning (“land* planning”) shows a decrease in production percentage with 15% at the beginning of the century, and barely 5% at present. This may be associated with the increased precision of spatial data. Previously, studies could be less accurate and used a territorial scope to quantify flood damage (economic valuation, €/m
2, occupation and land-use units). Whereas now, as the precision of the starting data increased, we tended to perform more local (urban) analyses and the concept of land use was slightly lost. However, applications that focus on planning had generally been maintained over time, with fluctuations between 20 and 25% of the scientific-technical production.
3. Discussion
This bibliometric review of FRA scientific-technical production presents limitations derived both from the data sources and from the analysis methodology used. The sole use of the WoS database, compared to other bibliometric studies that combine several databases, has both disadvantages and advantages. Hudson and Botzen [
32] used three databases (Web of Science, Google Scholar and Google Search) because the use of multiple sources reduces the likelihood of a biased sample [
33]. However, the use of a unique and high-quality database (like WoS; Cho and Chang [
18] and this work) means that the sample is homogenous and avoids the need to eliminate redundancies and duplicate records. Furthermore, the use of Google’s bibliographic databases and its criteria for record selection, classification and keyword searches have been widely criticized for over a decade [
34].
However, authors are aware that the bibliometric analysis is not complete when the FRA grey literature, other databases and articles in non-English languages are excluded. The implications of excluding the grey literature in particular, which is more focused the actual application of this research to management and practice, will make a difference. Moreover, perhaps the type of publication included in WoS also biases our search towards a particular conception of conceptual and core research. It is true that technology has been increasingly science-based; but science has been increasingly technology-based—with the choice of problems and the conduct of research often inspired by societal needs [
35]. Traditionally, it has been imagined that ‘basic’ research tends to happen in universities and then later gets applied in practice. However, increasing this division of labor is no longer so clear, particularly in the technological sector, where most of the important innovations take place in the private sector. It has even been proposed to strengthen the public sector, harnessing science and securing societal impacts from publicly funded research is needed [
36]. Even in flooding, many of the most important innovations in flood forecasting and flood risk mapping, for example, are getting rolled out in government laboratories (Hydrologic Engineering Center, US) or by private companies, like JBA or Fathom in the UK, or the First Street Foundation in the US. Our search methods could tend to miss out on the work they are doing. So, the implications of this paper focused on academic WoS outputs that will tend to: (i) overlook practitioner grey literature research putting things into practice and (ii) give less emphasis to private sector research, which is increasingly where innovation in the Tech world, and even in FRM, is now coming. However, the complete incorporation of all the grey literature from the technical and governmental worlds is an endless task and, above all, impossible to carry out objectively and homogeneously. Additionally, as we point out before, their inclusion break with the homogeneity linked to the use of WoS database about quality, accessibility or field expert peer-review process of manuscripts.
Regarding the analysis methodology, the search tools provided by WoS do not ensure that the results obtained are complete. As we explained in the
Section 2, the search in the WoS application using key words in the ‘Topic’ field, only guarantees the search in publication title, abstract and author keywords (and keywords Plus by WoS), but not in the full text of the publication. Hudson and Botzen [
32] established that not all abstracts and titles were sufficiently informative to judge whether the inclusion criteria are met; so they read the full document to confirm that it met all required criteria. However, this procedure is only possible for sets of tens or hundreds of records. For data sets with over 7000 records (such as the present study), detailed reading of the complete texts is impossible. Moreover, no additional programs to perform a bibliometric analysis, like Sci2 and Gephi, as have been used [
18] to generate representative results (e.g., network maps). As the used search terms (words) define the field tends to focus on time-independent assessments of flood risk, it excludes an important body of time-dependent dynamic flood forecasting that sits at the interface of hydrology and meteorology. However, regarding flood forecasting, it could be noticed that even though there were more than 7841 records in WoS databases, only a fifth of them (1551 records) seemed to include a complete flood risk study (see
Table 1). This scenario point out to a major relationship between flood forecasting and flood hazard, more than flood forecasting and flood risk.
Nevertheless, this bibliographical review presents some advantages and significant contributions in comparison with previous partial reviews. Firstly, this review covered all FRA topics and all possible approaches (basis, methodologies and applications), not just a specific subset (e.g., cost–benefit analysis [
32] or urban flood vulnerability [
18]). Secondly, this review explored all possible search criteria, including their evolution over time by analyzing publications by year (not included in previous reviews) and not only a short period [
18]. Finally, all results were interpreted in terms of future prospects and practical conclusions, useful to guide future research.
From the results, a continuous increase in the number of bibliographic references associated with both search terms (“analysis” and “assessment”) could be observed, which have different meaning nuances. Additionally, therefore, it cannot be argued on the basis of these results that there has been a tendency to temporarily replace the term “analysis” by that of “assessment”. For the Society for Risk Analysis, the main difference between terms ‘assessment’ and ‘analysis’ is that the former implies an evaluation and quantification, not only a qualitative decomposition of a complex element into its components or factors. In that way, the productions of more complete studies (as shown in
Figure 2) about flood risk were increased with time.
The results show several future trends in FRA research and development. There will be a predominance of the papers or journal articles compared to other types of publication. FRA publications will increase significantly over time (which could be related to the general increase over time of scientific manuscript production), but including pairs of characteristic years of growth stabilization. There may be increases in scientific production in 6-year cycles, due to regulatory requirements (e.g., European Floods Directive). There will be a predominance of multi- and interdisciplinary studies covering several research categories (science and technology, physical sciences and social sciences) and comprising of various research areas (environmental sciences, water resources and meteorology). A small group of source titles (and mainly recently published journals) will retain most of the publications. Although the US and the European countries will continue to lead in publications, Asian and South American countries will grow in number and quality. Research groups with a large critical mass of scientists, or groups of centers and institutes in national federated institutions (such as Helmholtz or CAS) or international associations (such as IEEE) will continue to have priority in high impact publications. Finally, only a reduced group of twenty researchers will maintain leadership. The results show the importance of the consolidated research groups or centers dedicated to these analyses, in the advancement of FRA knowledge and techniques, as opposed to the dissemination of production in different small centers.
At this point, there is a large gap in FRA in the African continent, which can be clearly seen in
Figure 5 where the largest region of very low production of papers about FRA is located just in the African continent. This is not related to the absence of flood events, but to the limited number of scientific institutions and data sources (only 261 of the 7454 FRA records in the WoS databases). The lack of appropriate infrastructures and data make development of FRA difficult in African countries, beyond the inclusion of this continent in global risk studies, such as those cited in Ward et al. [
14]. The same causes are behind the absence of FRA manuscripts in high impact journals. For example, the first African country in the FRA production ranking is South Africa (50 records, 44th place); followed by Egypt (47, 45th), Nigeria (28, 58th), Ghana (15, 63rd), Morocco (13, 66th), Uganda (13, 67th) and Ethiopia (12, 70th). In most African countries, the best option is the 30 m spatial resolution digital elevation model (DEM) from the SRTM project or the ASTER project, or the SRTM derived ‘Bare-Earth’ DEM and Multi-Error-Removed Improved-Terrain (MERIT) DEM. The lack of detailed DEMs can be considered as one but not the only key factor of the limited FRA in Africa. Apart from the lack of DEMs for flood hazard analysis, the poor quality or limited availability of flow data must be kept in mind. Furthermore, the analysis of the risk exposure and vulnerability components, which are closely linked to the availability of social data, is also highly compromised by the absence of systematic and quality social data.
Another unique case is that of the Australian continent, where Australia has a production of 401 records (8th position) and New Zealand (75 records, 31st position). However, there is a significant absence of research groups, institutions or individual researchers among those that stand out for their FRA manuscript production.
By examining the main articles that represent the research spotlight on FRA (see
Section 2.4), four fields of emerging research and development could be recognized: (i) the impact of global change and its components (greenhouse effect, climate change, global warming and sea-level rise) in the frequency and magnitude of floods and their associated damages, as highlighted by other papers [
29,
30]; (ii) coastal floods and their economic consequences, especially in the main coastal urban centers, as reported in previous papers [
15,
28]; (iii) multi-risk studies and interactions between the risk of flooding with other types of natural hazards, such as landslides, volcanic eruptions, seismic phenomena, etc., and (iv) incorporation of the psycho-social aspects of flood risk, with an analysis of the perception and importance of risk communication (e.g., Bubeck et al. [
31]).
Apart from the four emerging fields mentioned above, the studies carried out on a global scale (specifically reviewed by Ward et al. [
14]) deserve individual mention. These analyses focus mainly on the past decade, sharing some similarities with the majority of meso- or micro-scale studies (an increase in the spatial resolution of the results obtained in recent studies; predominance of studies that focus on flood hazard analysis; prevalence of studies evaluating direct flood damages; importance and number of studies focused on coastal floods; etc.). They also show some differentiating characteristics, among which the conception or use of a time horizon for calculations could be highlighted, which generally cover the entire 21st century and include climatic change scenarios.
As a check and validation of future FRA trends and the fields and topics that seem to have the greatest future projection, the publications of the authors mentioned in
Section 2.3 have been analyzed for the last two years (2019 and 2020). The result is illuminating, because the 28 records in the WoS databases published by these seven authors in this last half year (January–June 2020) on FRA, correspond to: psycho-social aspects (six records; e.g., [
37,
38]), the impact of global change (five records; e.g., [
39]), coastal floods (five records; e.g., [
40]) and global scale studies (four records; e.g., [
41]); or combination of two or more (e.g., [
42]). Analyzing the 112 records on FRA of these 7 authors in the years 2019 and 2020, all the emerging topics are also represented, since all but one of the records (111) include references to the global change.
Other possible emerging studies fields that were analyzed in the total production on FRA of the years 2019 and 2020 (total of 1257 records) are: machine learning (33 records), big data (10), location intelligence (1), decision support systems (DSS; 1), remote sensing (74) and socio-environmental systems (1). As can be seen, its representation in the last works carried out on FRA is still minimal compared to the total number of works published, except for the machine learning field and especially for the remote sensing field, which is very broad and used for decades, so it cannot strictly be considered an emerging field (although possibly the use of data provided by UAVs can be considered). So, it is not justified to call location intelligence, DSS and socio-environmental systems “emerging fields” on the basis of a single record in 2019–2020.
Although the percentage of papers (per year) that deal with uncertainty has remained more or less constant, the number of publications has increased along with the total number of papers. This increase should continue in the future, in such a way that the percentage of manuscripts that analyze the uncertainty of their results with respect to the total number of jobs produced in the field of FRA will increase significantly. It is also necessary to identify the contributions of individual sources of uncertainty to overall uncertainty [
11]. Moreover, in the coming years, due to factors such as population growth, increasing urbanization, infrastructure decay and the potential impact of climate change, FRA studies must incorporate the uncertainties associated with the spatio-temporal dimension of these factors in flood risk modeling [
7].
Within the methodologies for flood hazard analysis, in urban areas with mild terrain and complicated topography, 2-D fully dynamic flood modeling is usually employed [
6]. Regarding the methodologies used to assess economic flood damage, considerable research has been carried out and progress made on damage data collection, data analysis and model development in recent years. However, there still seems to be a mismatch between the relevance of damage analyses and assessments and the quality of the available models and datasets [
15]. Future FRA studies must be better balanced, paying the same attention to both damage and hazard. Cho and Chang [
18] concluded that the continuously increasing number of comprehensive approaches to urban flood risk assessment shows evidence of a new paradigm shift toward a more inclusive way to understand multi-dimensional aspects of urban flood vulnerability across disciplines and different knowledge systems.
The complexity of the flooding process and its analysis and assessment are another obstacle that we must try to overcome, with the aim of transferring analysis methodologies from the scientific research domain to that of private companies. In this sense, the objective would be to try to transfer robust but simple analysis methodologies, in which most of the aspects linked to the uncertainty of the results were easy to implement or could already be tabulated based on the experience and results obtained by scientists.
Ologunorisa and Abawua [
3] concluded that the GIS technique appears to be the most promising as it is capable of integrating all the other techniques of flood risk analysis and assessment. Yet, the recent evolution of publications using this tool shows a certain stagnation since it is a complementary technique and not the main tool of FRA studies. This stagnation may be due to the fact that GIS are used as a receptacle for the results of different analyses and as a map generator, but not as a real analytical tool. There are at least two reasons for this. Firstly, information sources do not have standardized formats, which makes it difficult to systematically use GIS as a standard analysis tool. The information must be “formatted” so that the GIS can understand and analyze it. Secondly, there has not been a sufficiently flexible or adaptable development of GIS packages for flood risk analysis, probably due to the aforementioned reason. Only watertight applications have been developed (which do not allow modification or application in other parts of the planet other than those where they were implemented). Many of these have had a macroscale approach (applying land uses in the vulnerability of the territory), like the FRA compute option of HEC-WAT software [
43] or the applicability of HEC-FDA. FRA models that do not focus on flood damage analysis and assessment (such as HIS–SSM for The Netherlands, Flood Loss Estimation Model (FLEMO) in Germany, the Multi-Coloured Manual in UK and Rhine Atlas in Germany) are very scarce. Examples that could be mentioned include Hazards U.S. Multi-Hazard (HAZUS-MH) [
44,
45] in the US, HAZUS-MH 2.1 in UK or the Flood Risk Assessment Model for Companies (FRAC, [
46]).
In relation to mitigation measures, applications of NWRM and NbS will increase to the detriment of traditional civil works. All these measures for flood risk mitigation will need a cost–benefit analysis. To this end, Hudson and Botzen [
32] proposed a multistep process: (i) determine the spatial extent of the zoning policy and how interconnected the zoned area is to other locations; (ii) conduct a CBA using estimated monetary costs and benefits from an integrated hydro-economic model to investigate whether total benefits exceed total costs; (iii) conduct a sensitivity analysis regarding the main assumptions and (iv) conduct a multicriteria analysis (MCA) of the normative outcomes of a zoning policy.
4. Conclusions
The main characteristics that we can expect from future FRA studies can be inferred from the results of this bibliographic review. We can expect an increase in these studies over time and a more heterogeneous distribution around the world.
By interpreting the past evolution and future prospects and trends in FRA research, we can conclude that countries such as the United States, China and some European countries (Germany and The Netherlands) will continue to lead. However, certain aspects such as uncertainty analysis in FRA, highlighting production in the United Kingdom and in other Asian countries, will be incorporated in the future. However, it remains unclear how the African countries will join the development and production of FRA.
The success of the concentration of research efforts in large centers or consortia of universities and research institutes (Helmholtz, Chinese Academy of Sciences) is evident. They not only produce a greater number of publications but also those of higher quality and worldwide impact. This situation can have advantages and disadvantages. On the one hand, you have FRA development accompanied by the seal of quality provided by the work done by competent and consolidated research groups. On the other, there may be a loss of “small big-ideas” proposed by isolated researchers, which do not achieve the necessary scientific repercussion. Other countries or continents (such as South America or Africa) will copy and adapt this model to achieve greater weight in world science, trying to overcome the drawbacks mentioned.
Faced with the enormous increase in scientific production, a select few very specialized journals, (e.g., JoH, JFRM, IJDRR and NHESS) will concentrate the majority of scientific production on FRA, becoming the preferred communication mechanisms of the scientific-technical community. Of course, there will be an increasing acceptance of open access initiatives for scientific production, supported by public policies of funding agencies (e.g., EU Horizon, South American CONICYT agencies and US-National Academy of Science).
There are four themes within FRA research that mark future trends: global change, coastal floods, economic evaluation and psycho-social analysis. This last theme, including the analysis of the perception and communication of flood risk, is still undervalued and not sufficiently developed. The most widely used methodologies place a lot of emphasis on the analysis of flood hazard, but very little on the analysis of exposure and vulnerability, and their integration into risk. In the future, FRA studies should focus on the integration of the three factors by giving them equal weight and taking into account the uncertainties associated with the sources, methodologies and their propagation during the analysis. They should also consider how we transfer all this complex methodological analysis to private engineering or environmental companies that, in fact, will conduct most of the FRA in the current “urban-growth” scenario.
In short, FRA research has a relevant past, a prominent present and an innovative and hopeful future to provide solutions to humanity’s problems in relation to the reduction of natural disasters.


