Drought Vulnerability in the United States: An Integrated Assessment


Abstract
1. Introduction
2. Materials and Methods
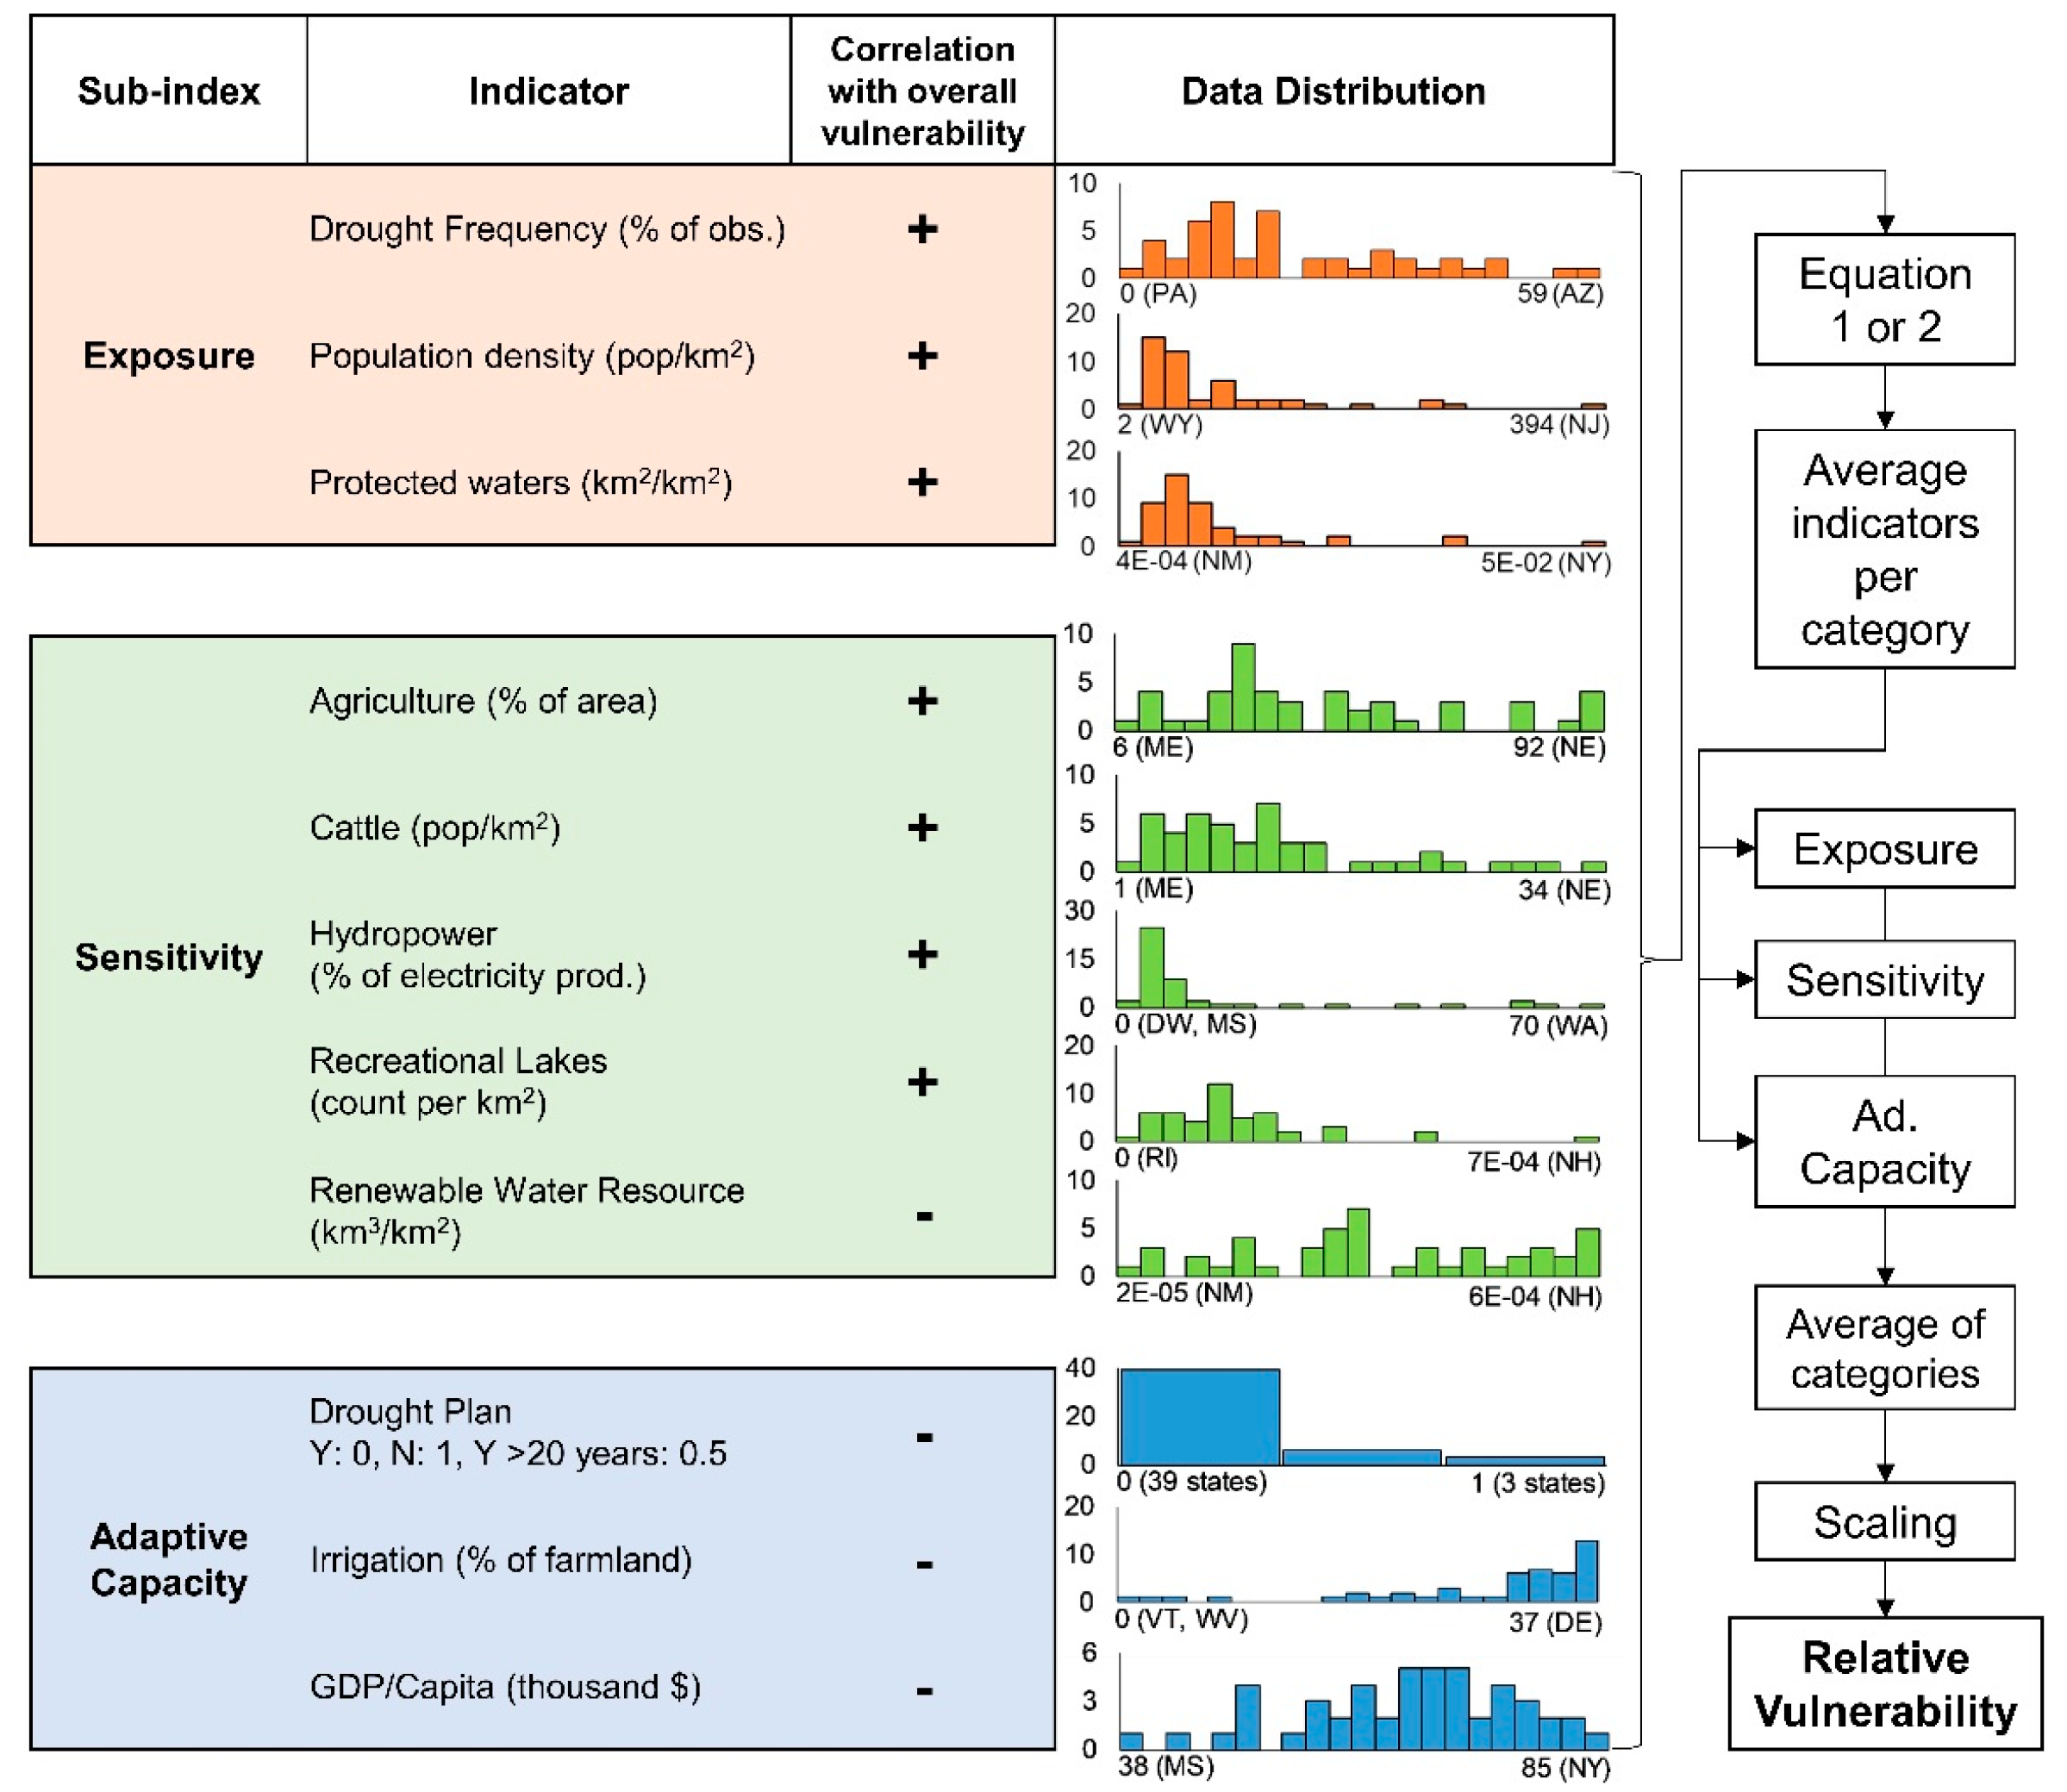
2.1. Exposure Indicators
2.2. Sensitivity Indicators
2.3. Adaptive Capacity Indicators
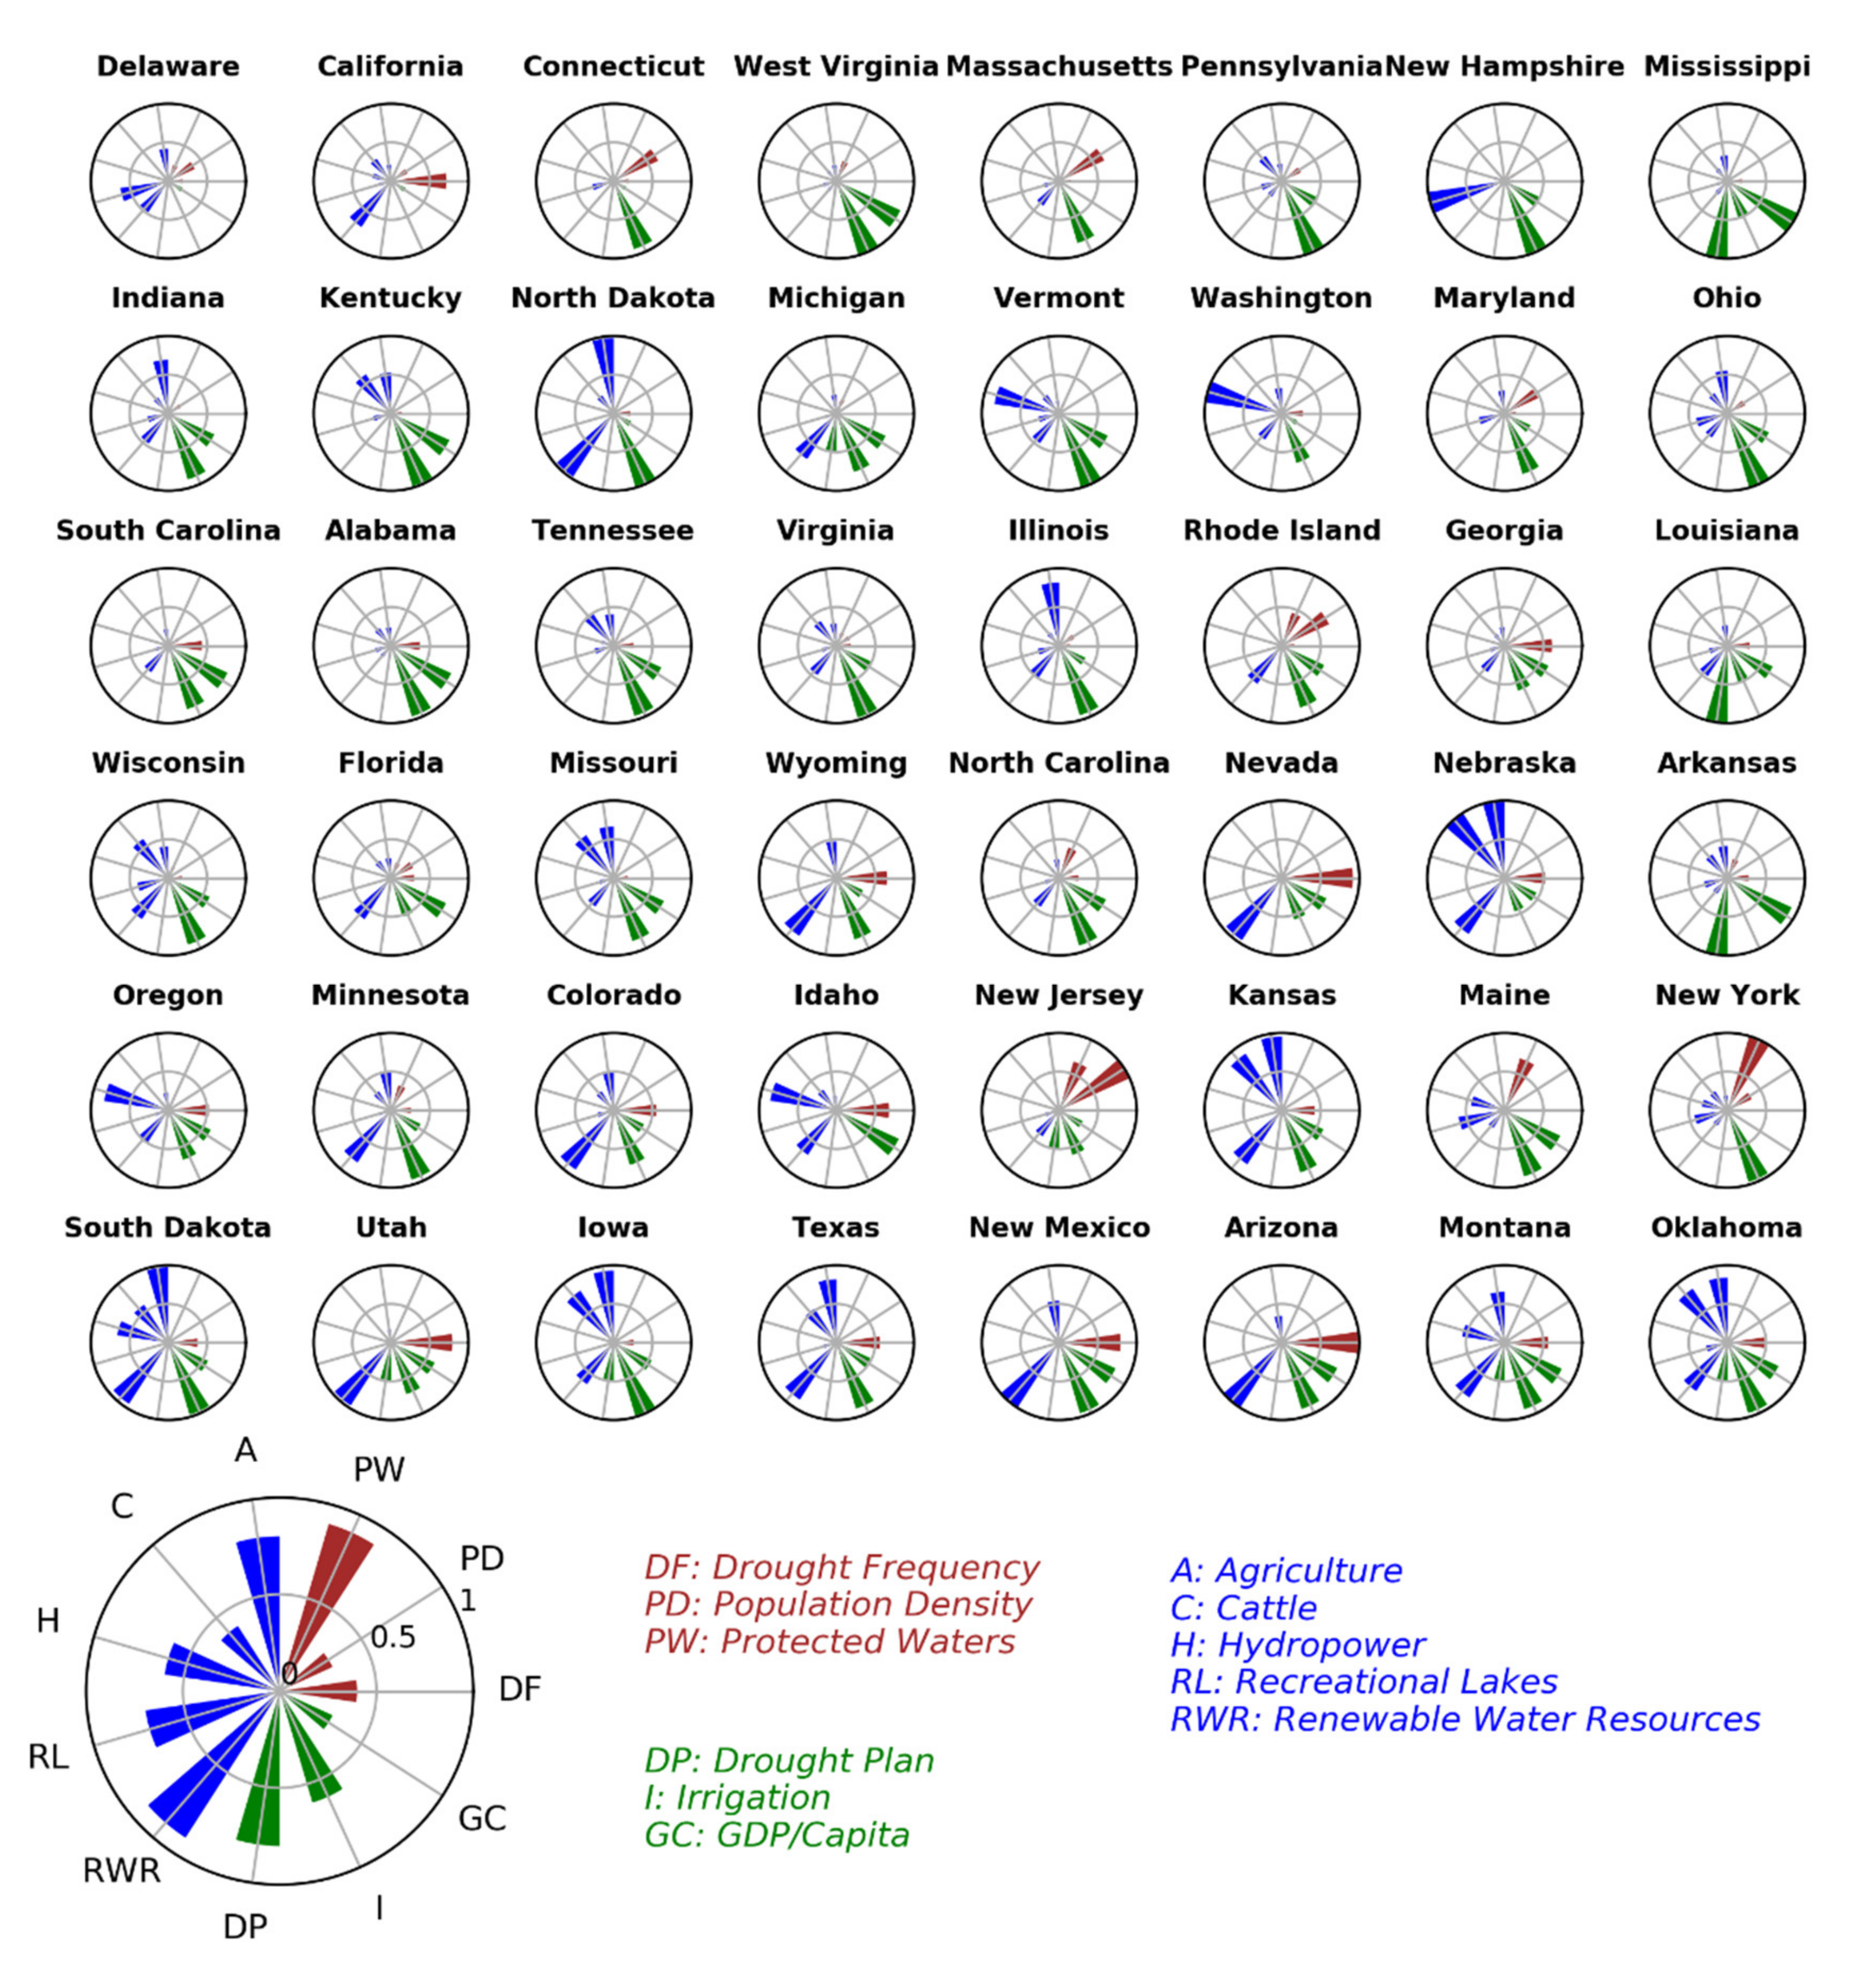
2.4. Drought Vulnerability Indices (DVI) and Vulnerability Classes (VC)
3. Results and Discussion
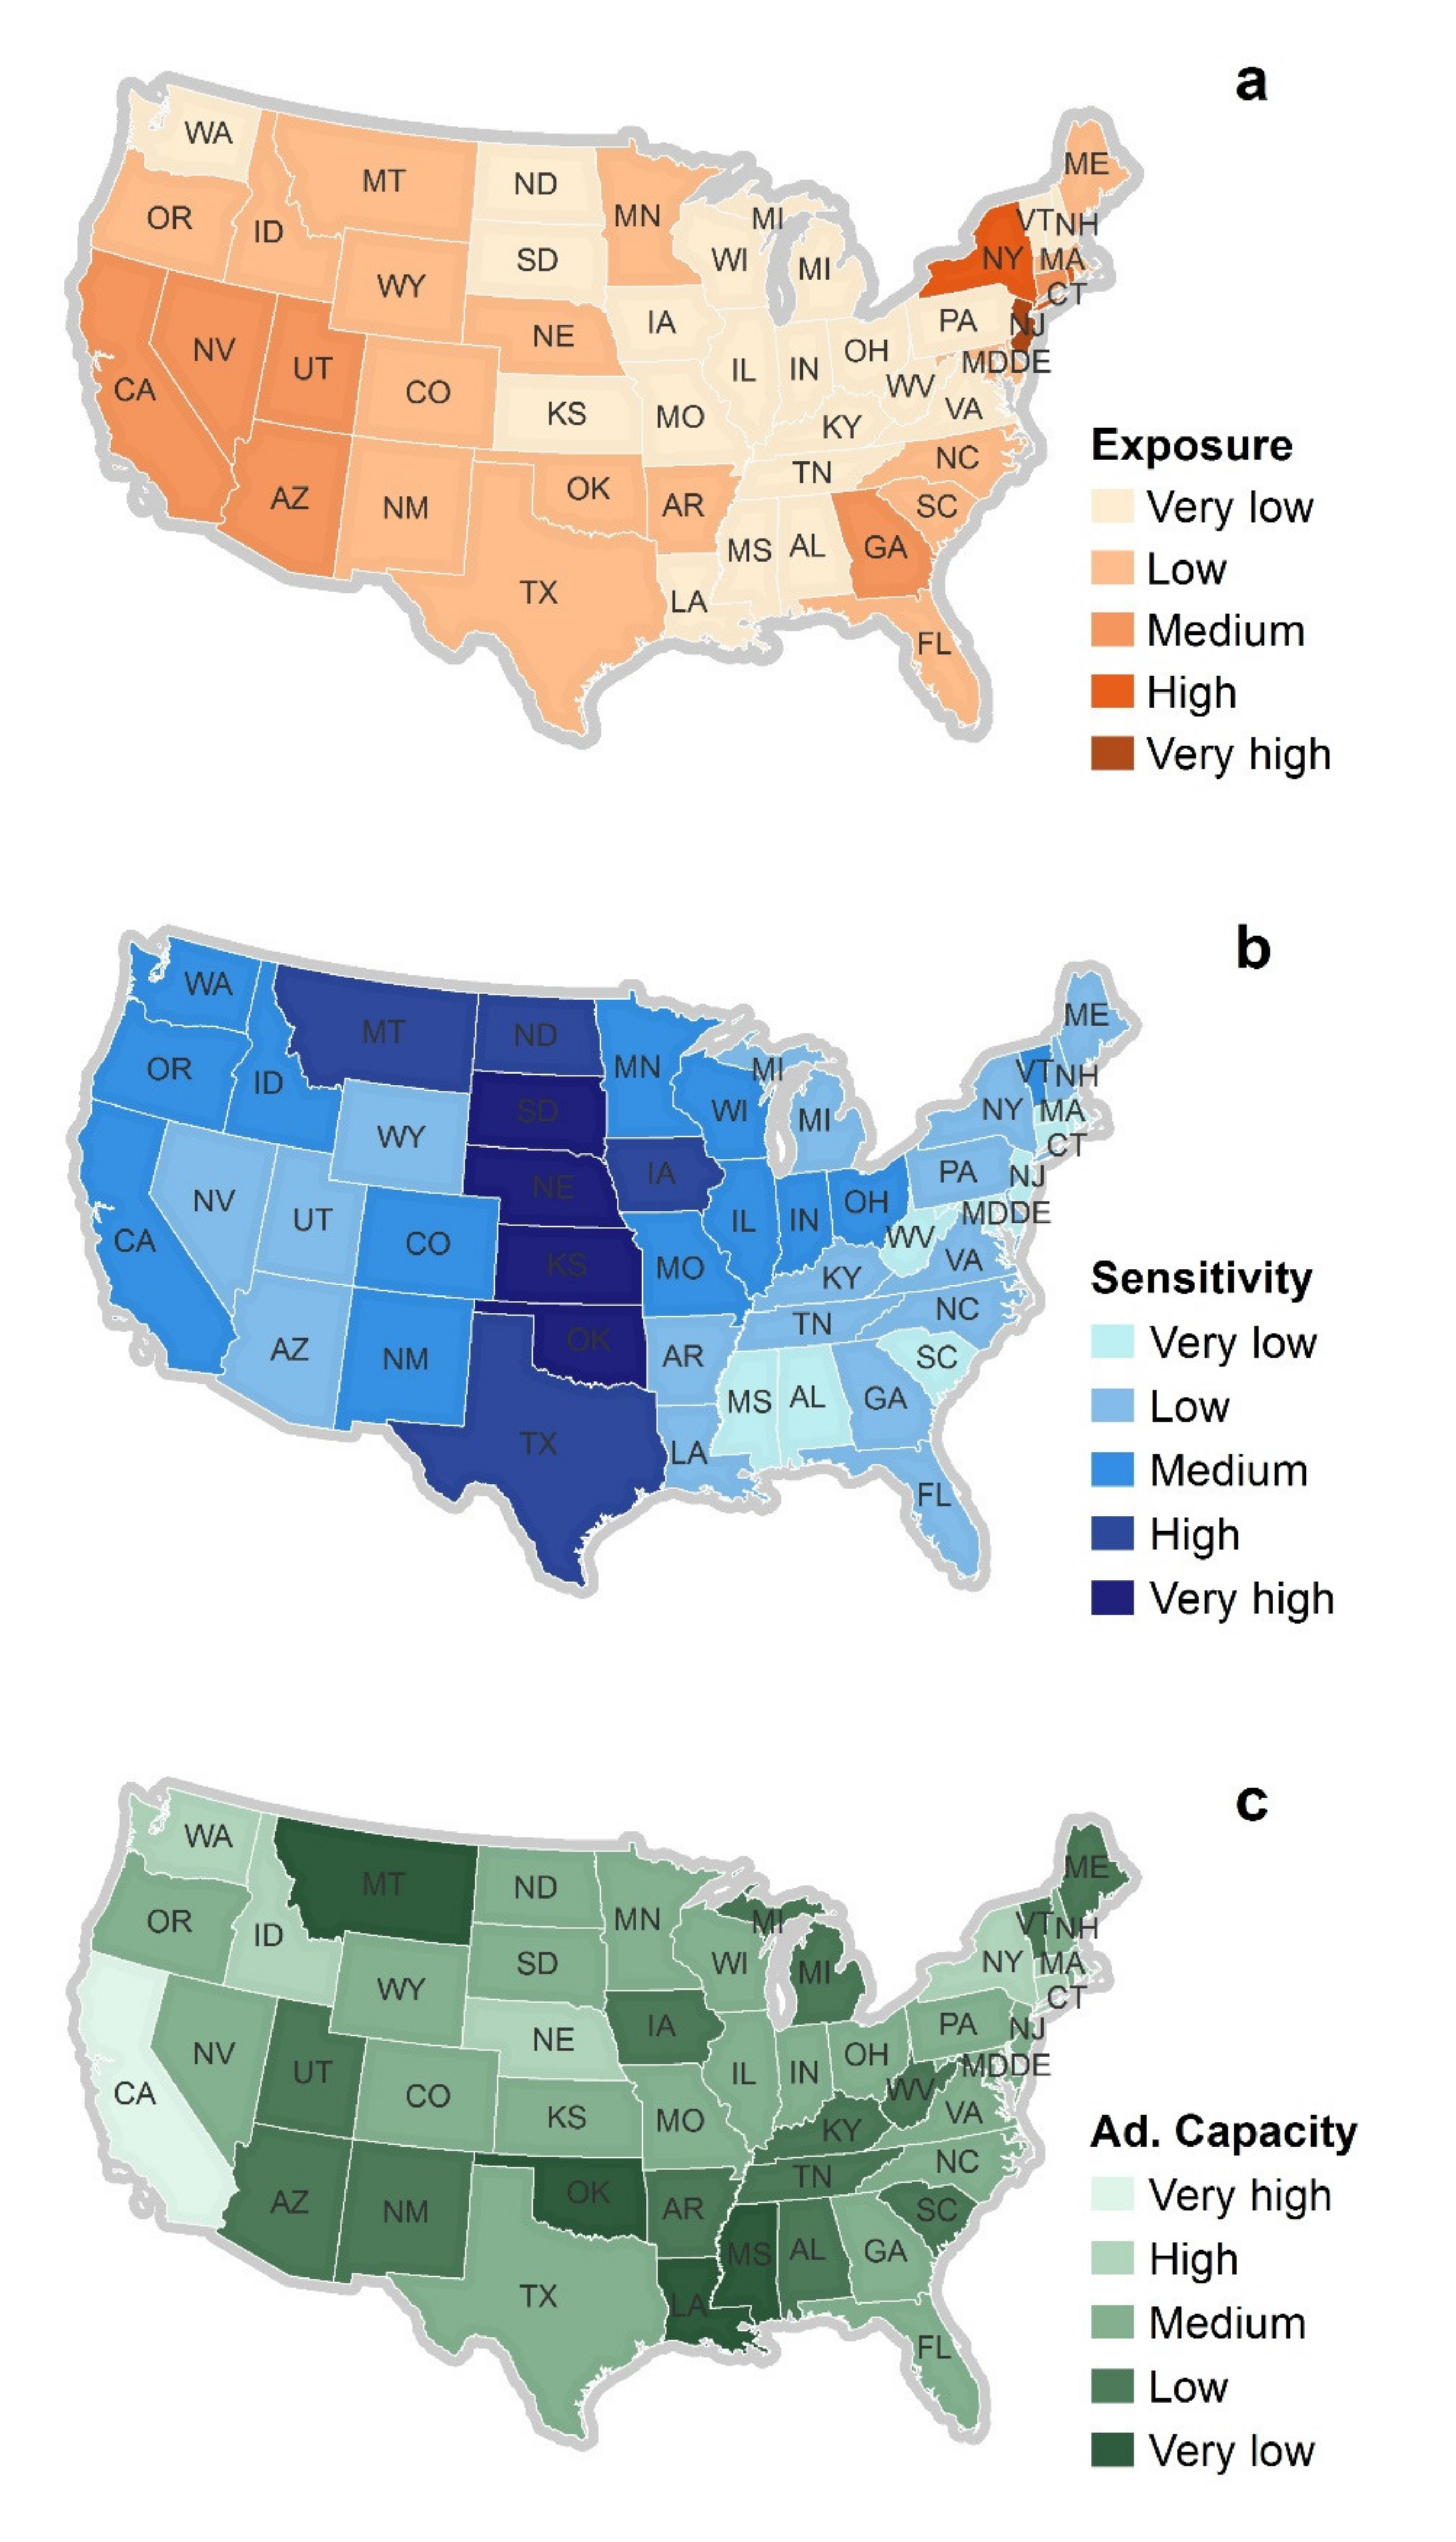
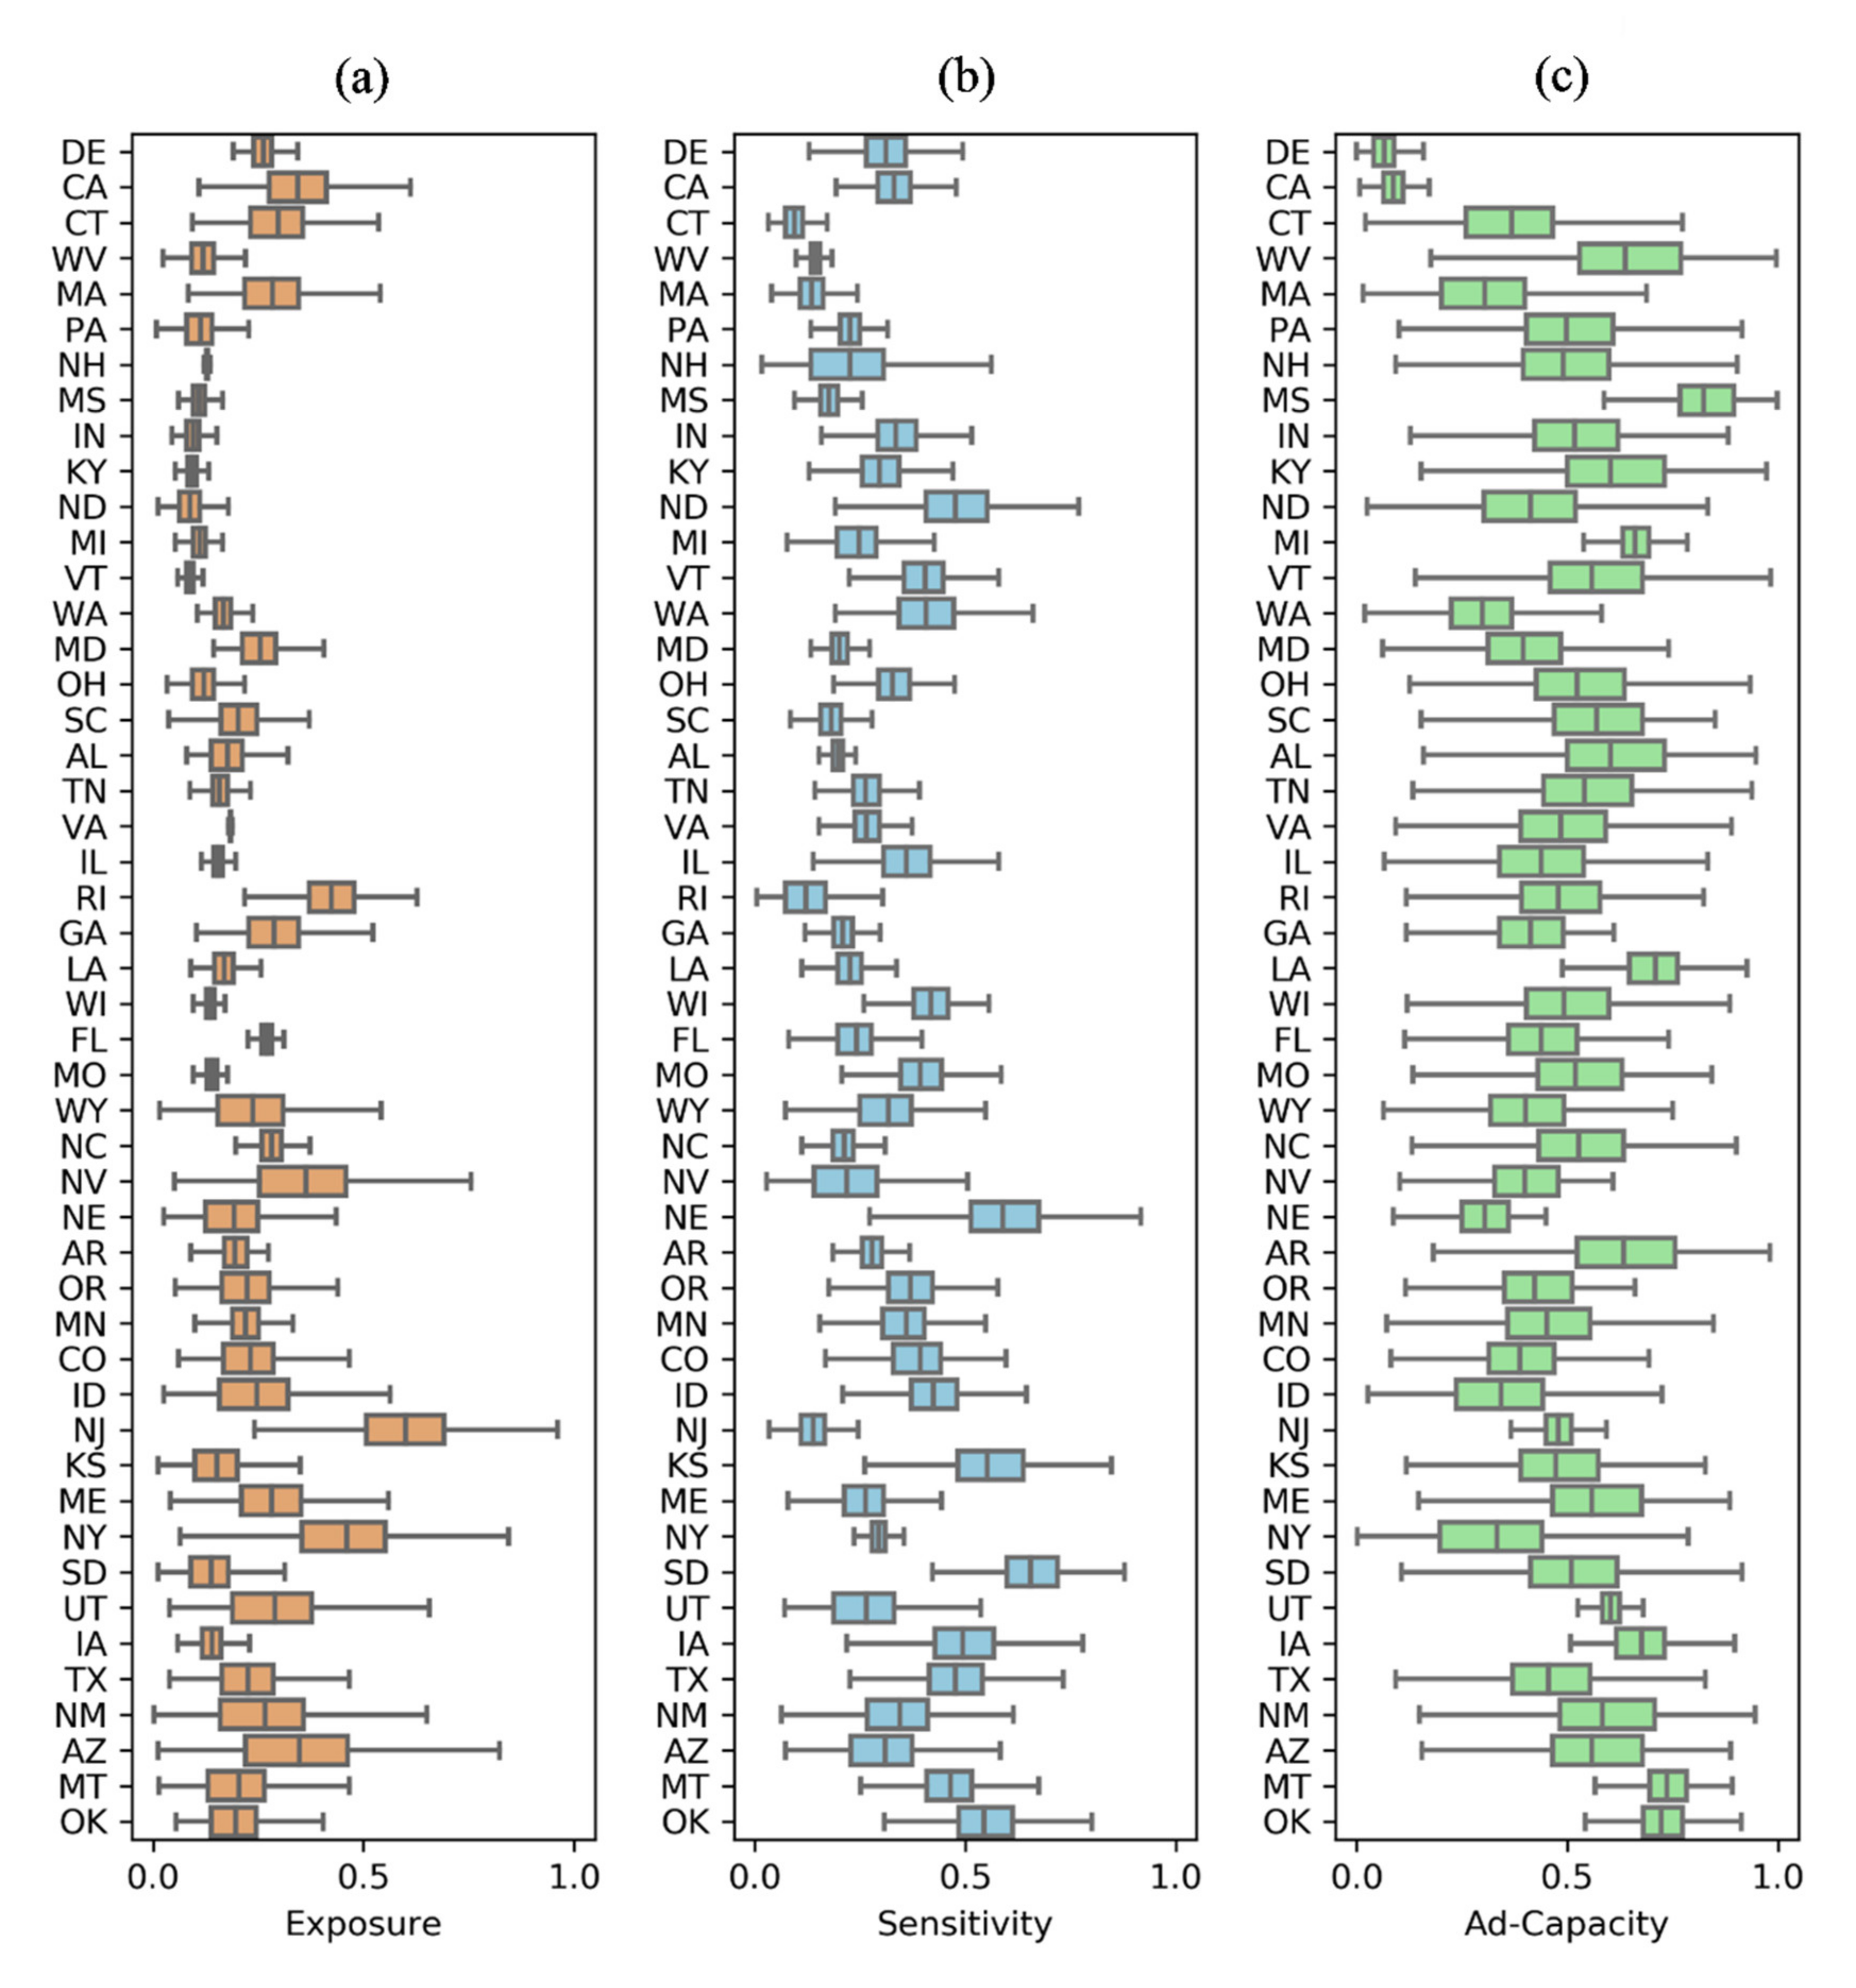
3.1. Deterministic Approach
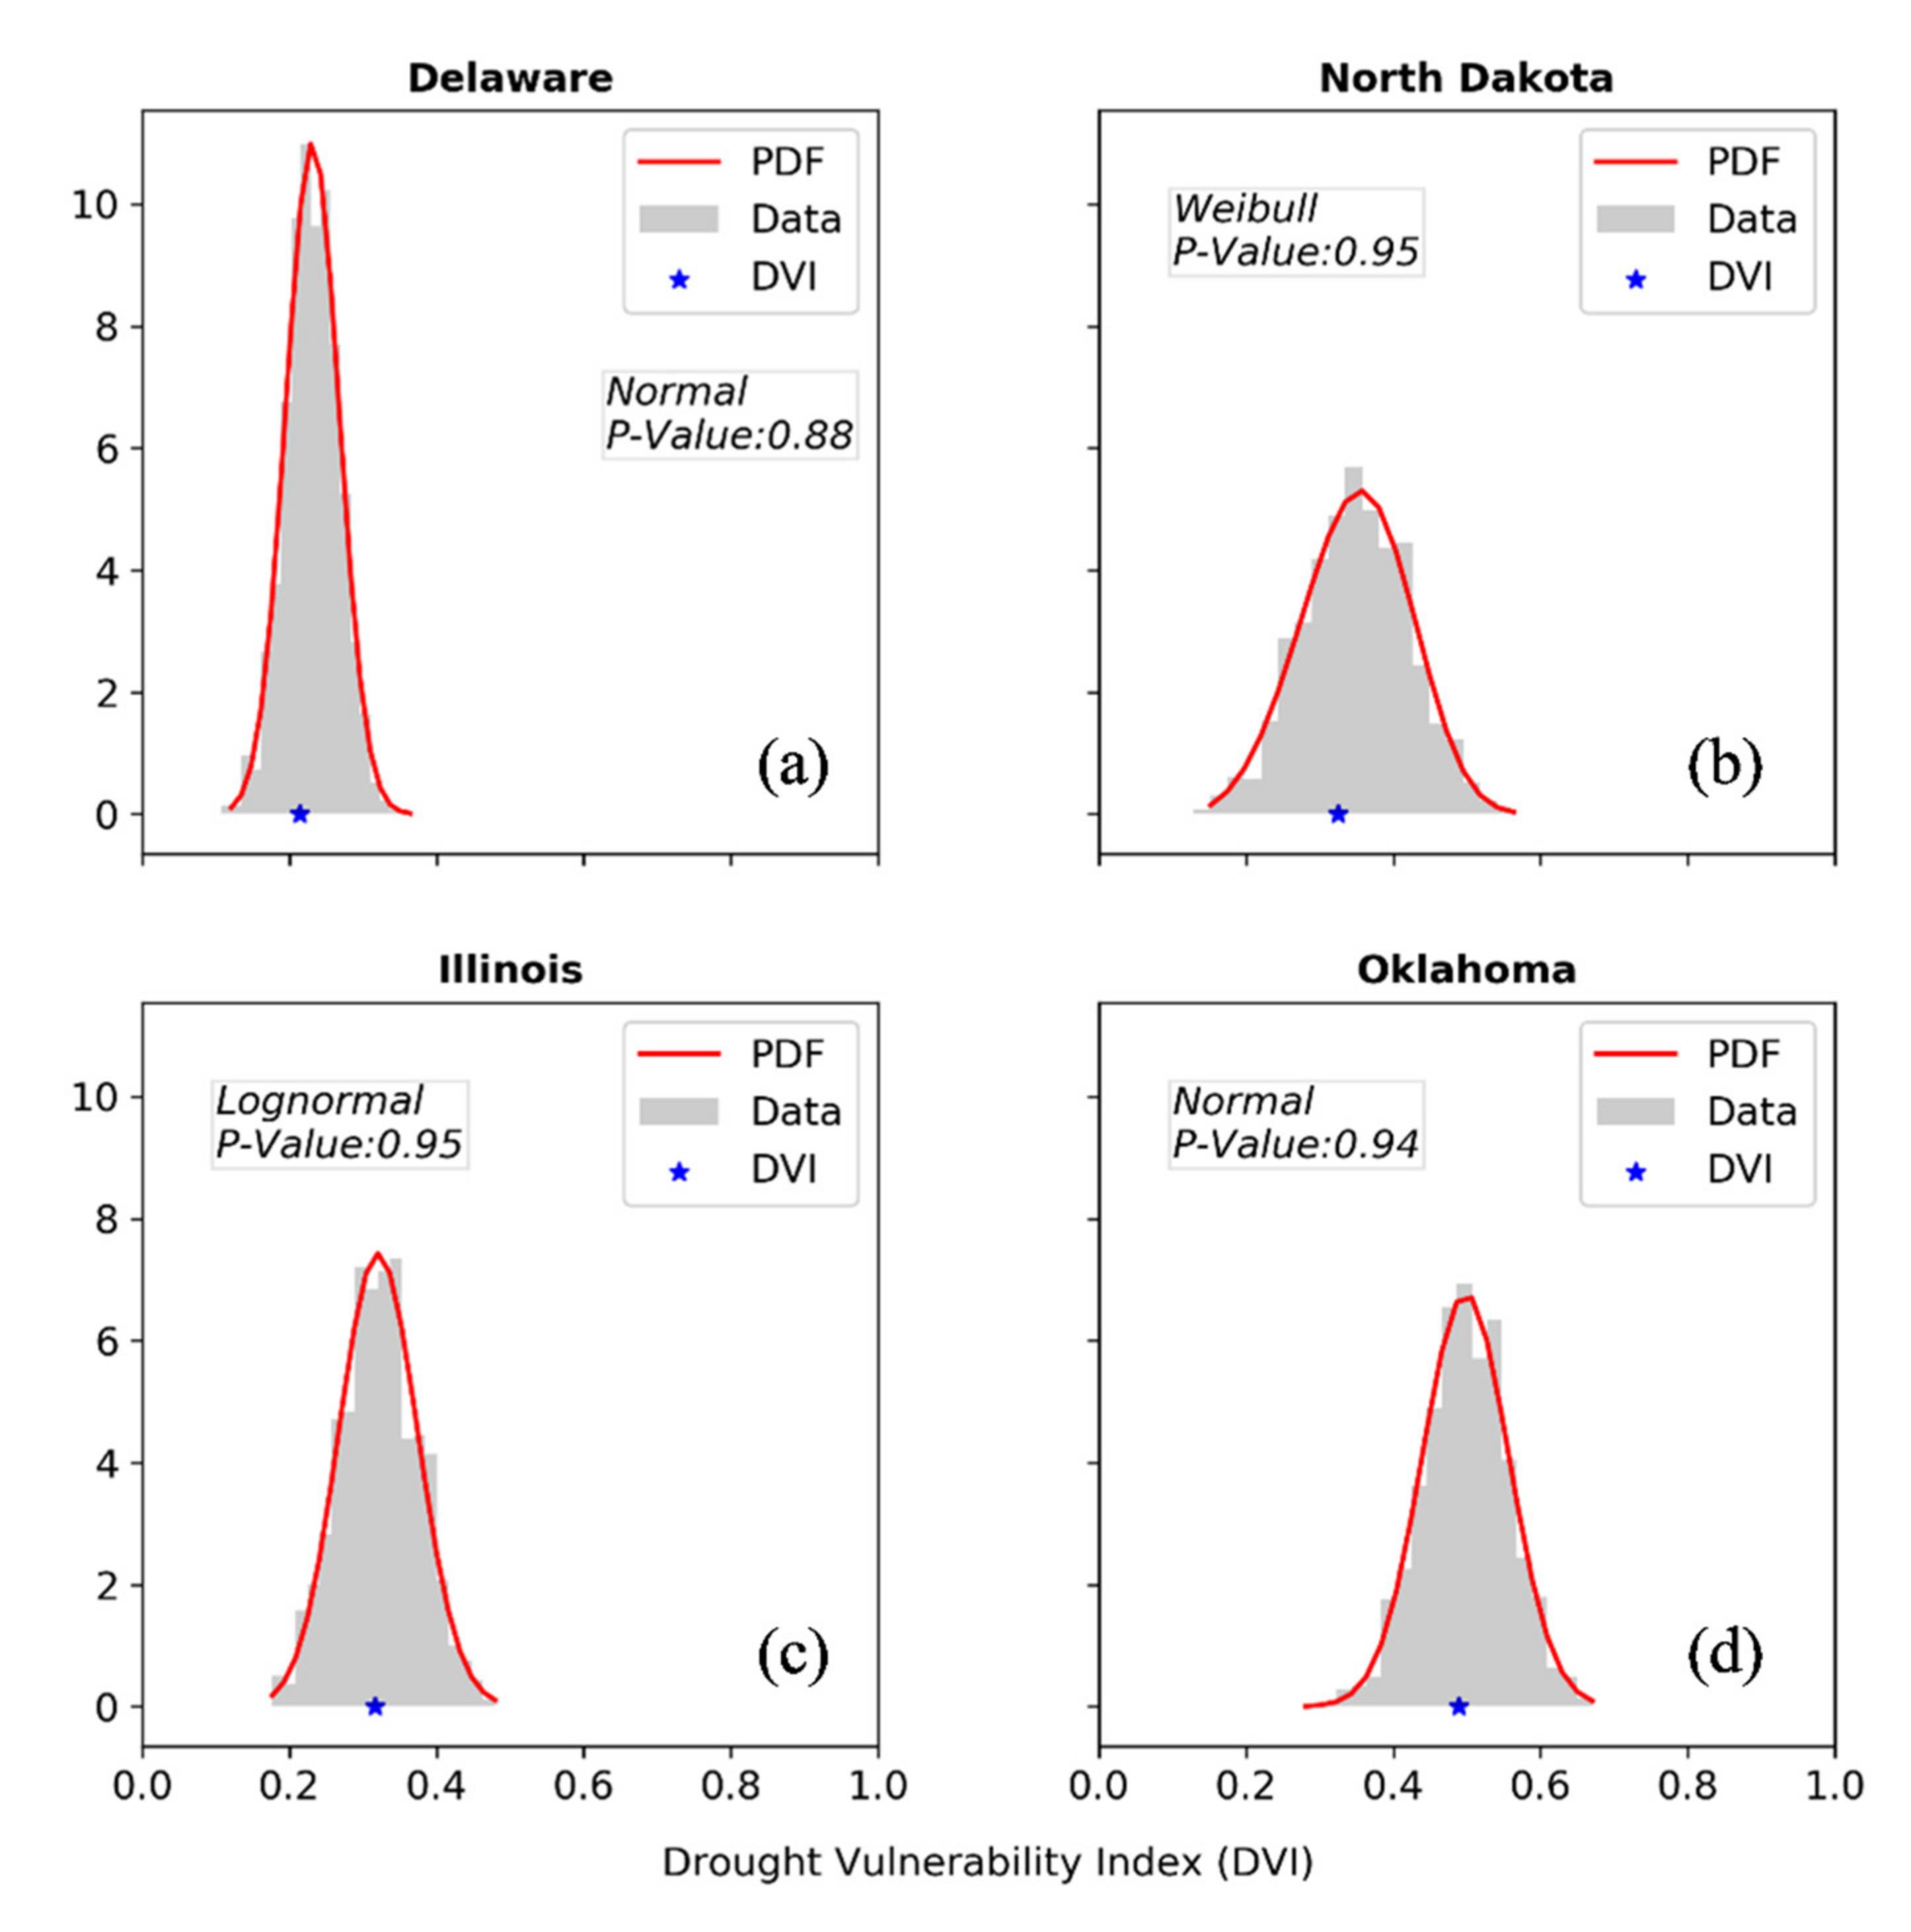
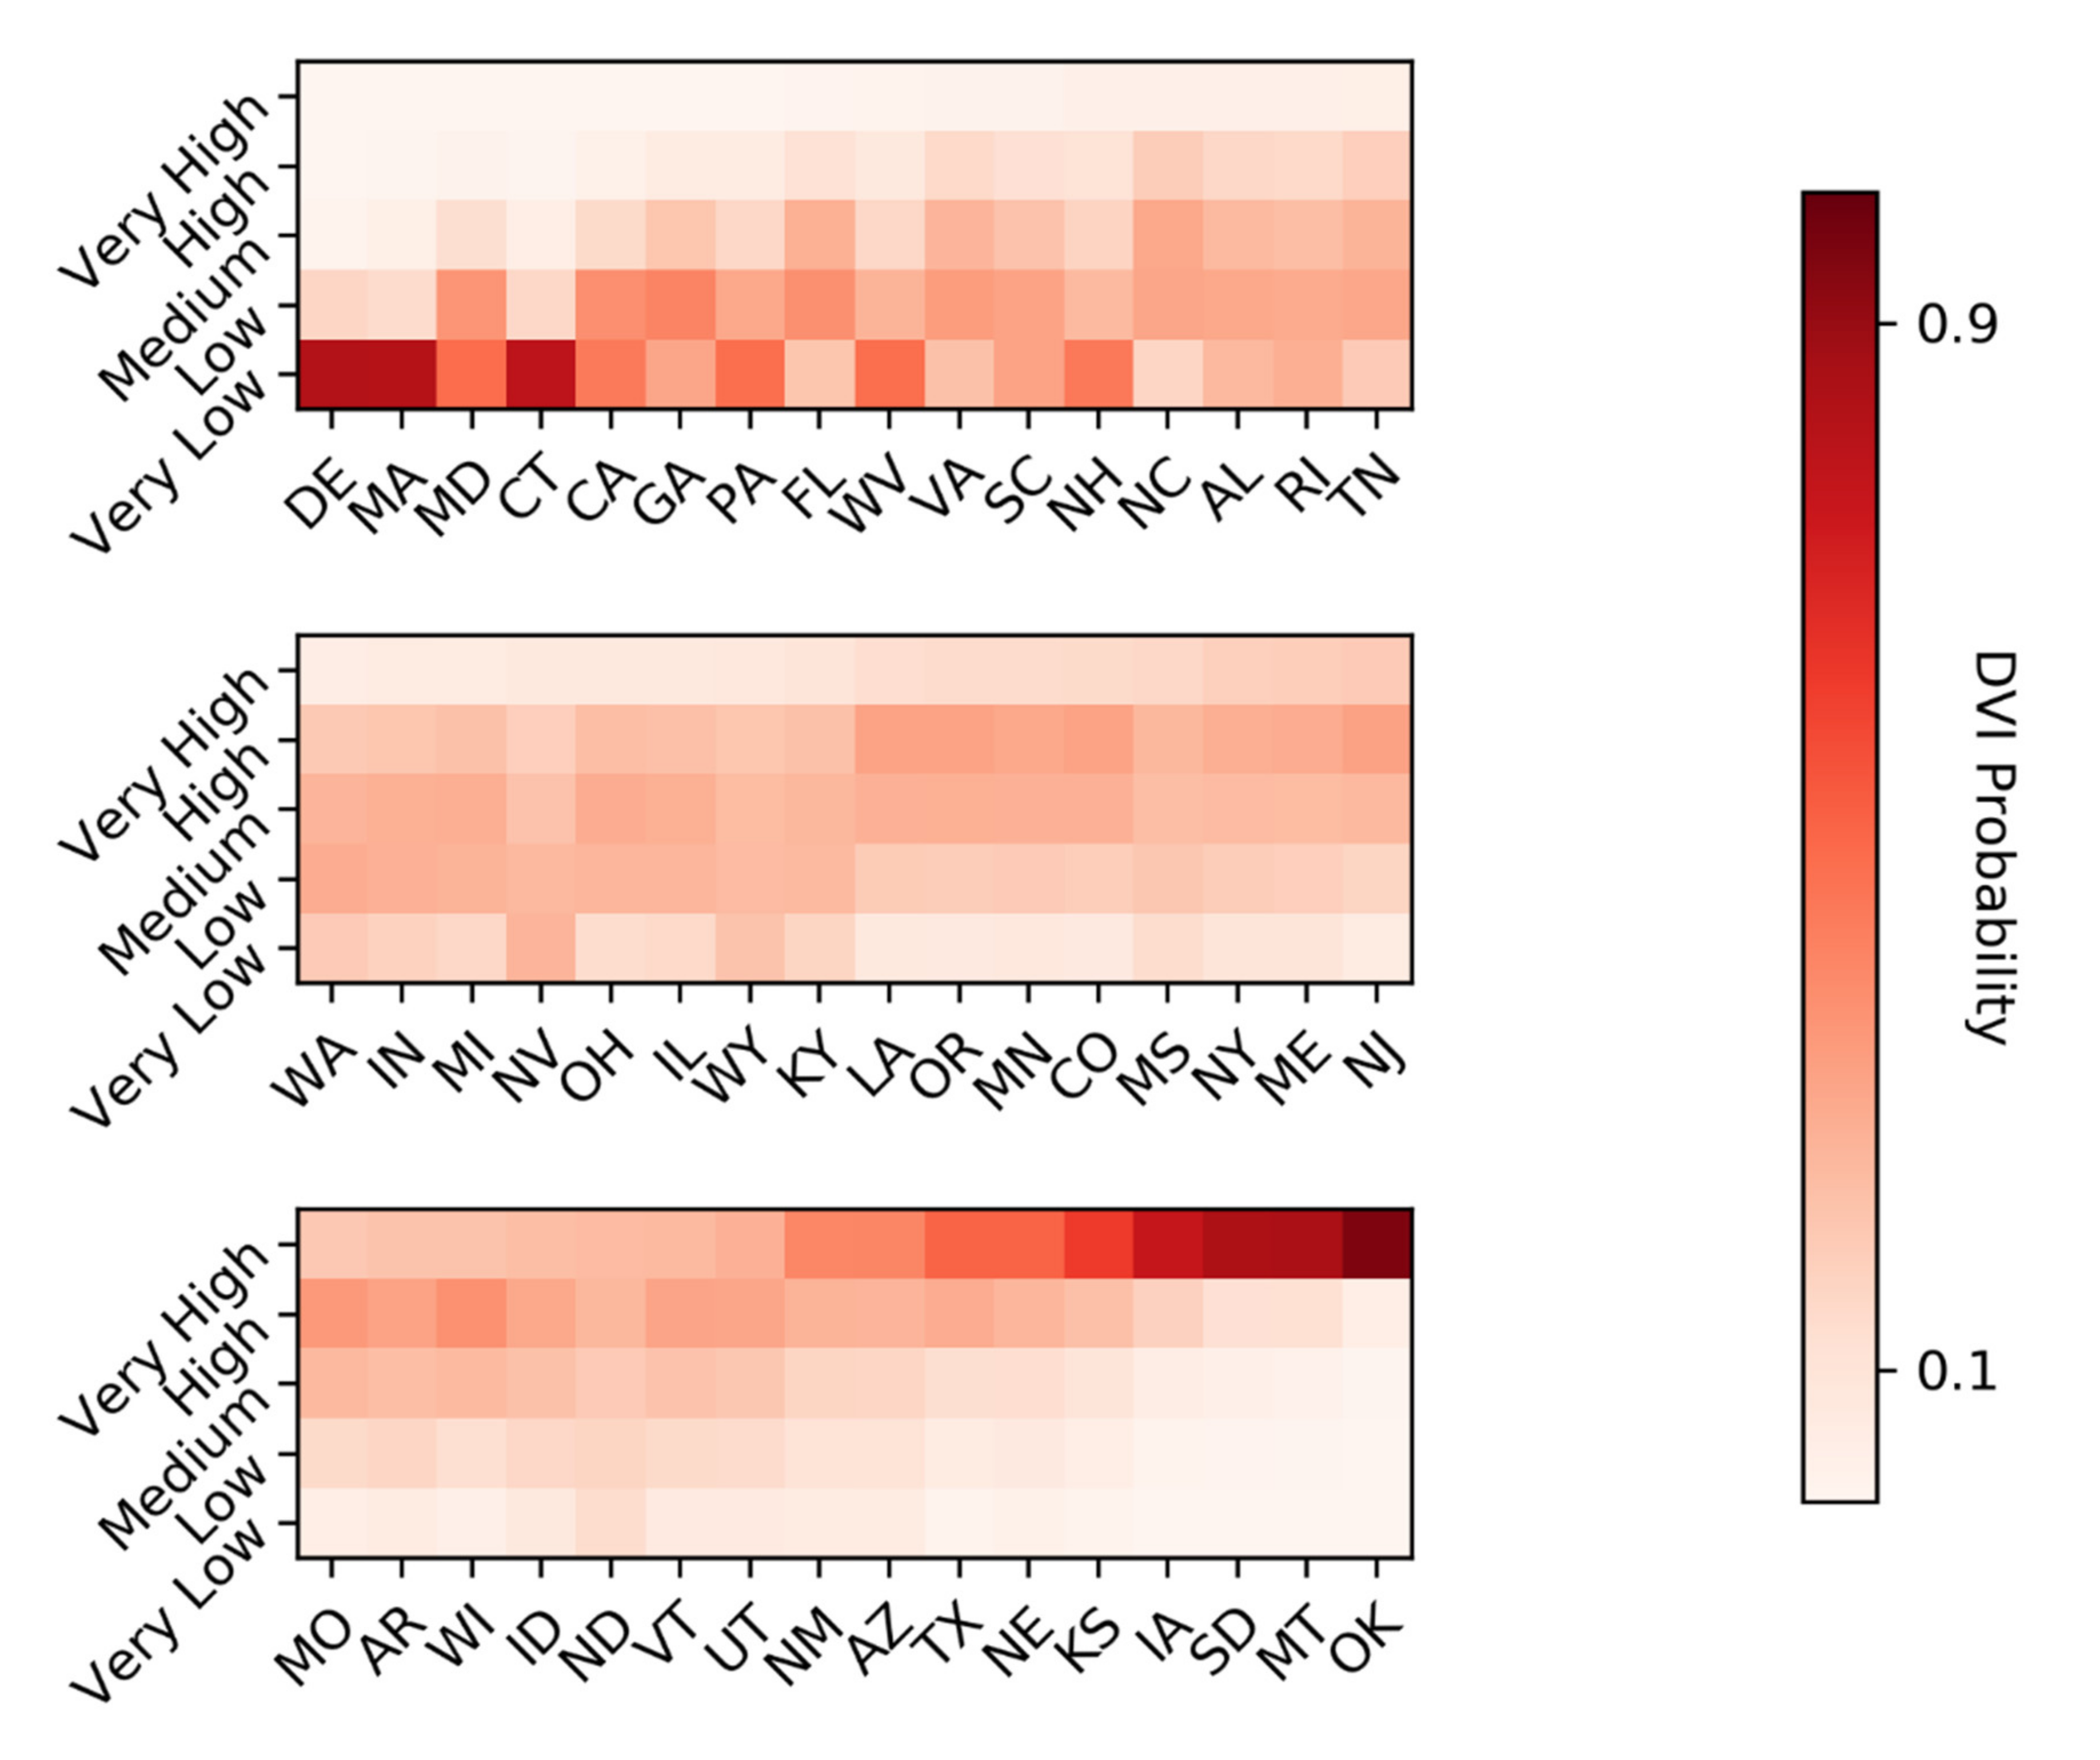
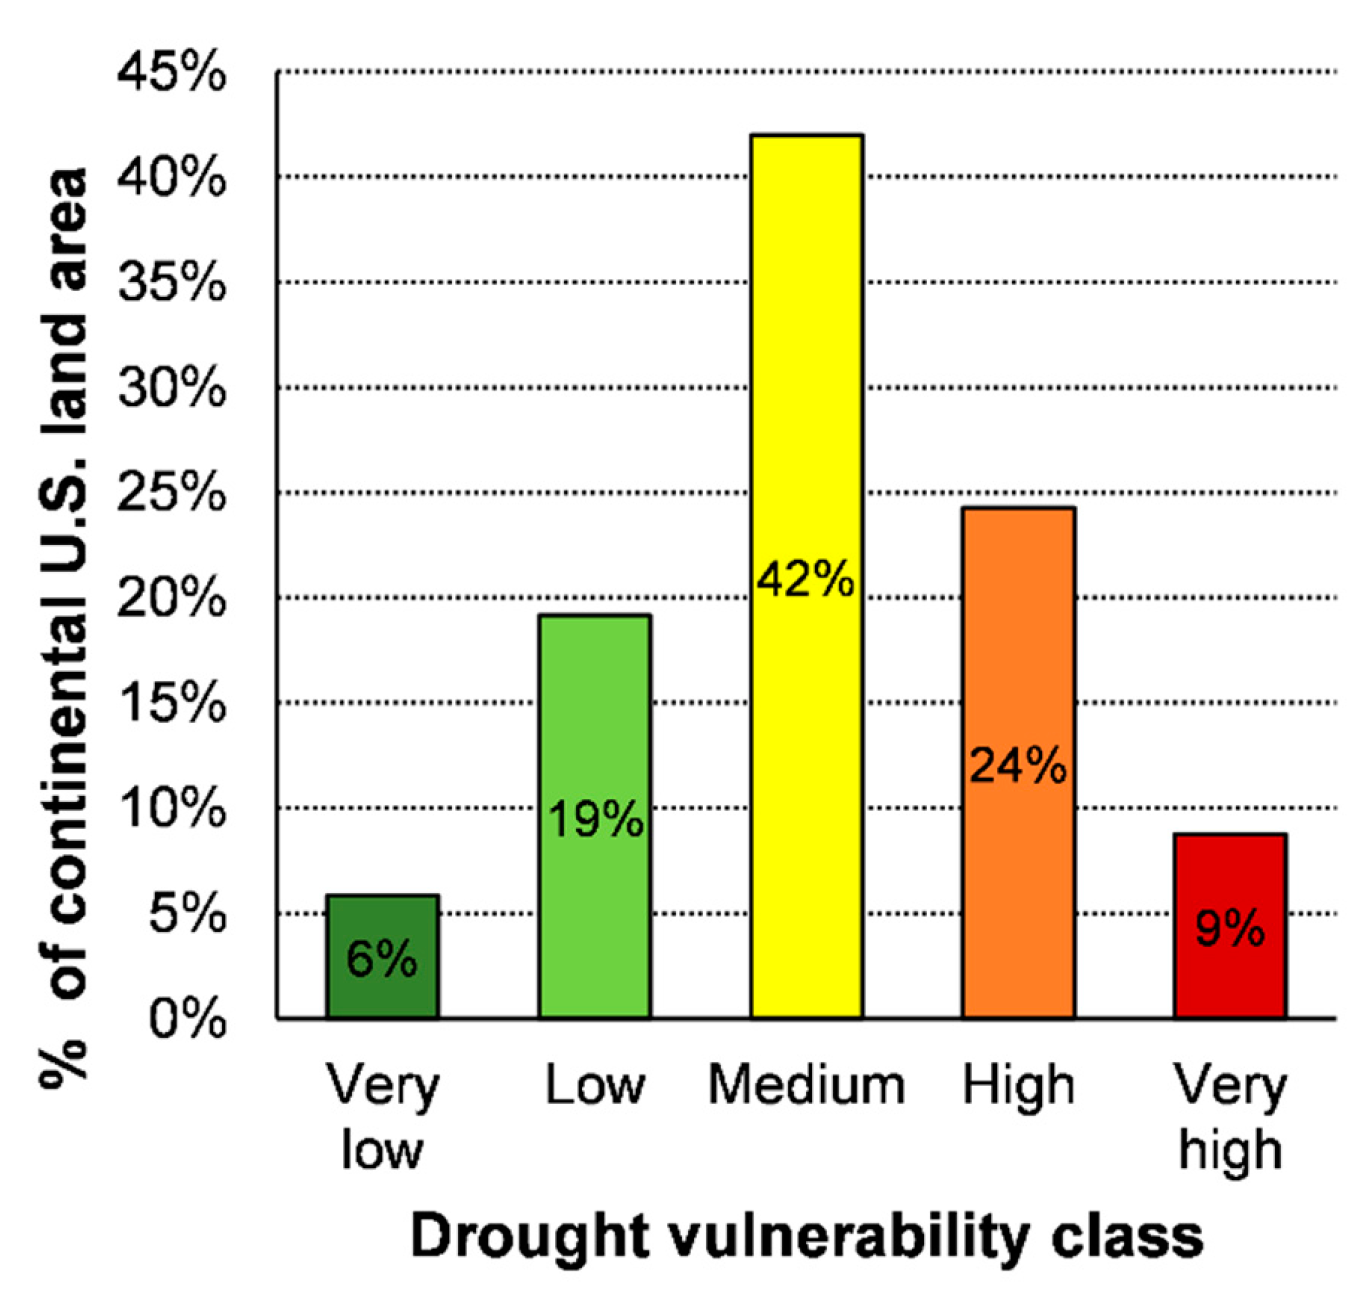
3.2. Probabilistic Approach
4. Conclusions
Author Contributions
Funding
Conflicts of Interest
References
- Ding, Y.; Hayes, M.J.; Widhalm, M. Measuring economic impacts of drought: A review and discussion. Disaster Prev. Manag. Int. J. 2011, 20, 434–446. [Google Scholar] [CrossRef]
- Billion-Dollar Weather and Climate Disasters: Overview National Centers for Environmental Information (NCEI). Available online: https://www.ncdc.noaa.gov/billions (accessed on 30 June 2020).
- Atlas of Mortality and Economic Losses from Weather and Climate Extremes 1970–2012. Available online: https://public.wmo.int/en/resources/library/atlas–mortality–and–economic–losses–weather–and–climate–extremes–1970–2012 (accessed on 30 June 2020).
- Mukherjee, S.; Mishra, A.; Trenberth, K.E. Climate Change and Drought: A Perspective on Drought Indices. Curr. Clim. Chang. Rep. 2018, 4, 145–163. [Google Scholar] [CrossRef]
- Dai, A. Drought under global warming: A review. WIREs Clim. Chang. 2011, 2, 45–65. [Google Scholar] [CrossRef]
- Madadgar, S.; Moradkhani, H. Drought Analysis under Climate Change Using Copula. J. Hydrol. Eng. 2013, 18, 746–759. [Google Scholar] [CrossRef]
- Ahmadalipour, A.; Moradkhani, H.; Castelletti, A.; Magliocca, N. Future drought risk in Africa: Integrating vulnerability, climate change, and population growth. Sci. Total Environ. 2019, 622, 672–686. [Google Scholar] [CrossRef] [PubMed]
- Keellings, D.; Engström, J. The Future of Drought in the Southeastern U.S.: Projections from Downscaled CMIP5 Models. Water 2019, 11, 259. [Google Scholar] [CrossRef]
- Drought. Available online: https://www.ametsoc.org/index.cfm/ams/about-ams/ams-statements/statements-of-the-ams-in-force/drought/ (accessed on 30 June 2020).
- Boruff, B.J.; Easoz, J.A.; Jones, S.D.; Landry, H.R.; Mitchem, J.D.; Cutter, S.L. Tornado hazards in the United States. Clim. Res. 2003, 24, 103–117. [Google Scholar] [CrossRef]
- Senkbeil, J.C.; Scott, D.A.; Guinazu-Walker, P.; Rockman, M.S. Ethnic and Racial Differences in Tornado Hazard Perception, Preparedness, and Shelter Lead Time in Tuscaloosa. Prof. Geogr. 2014, 66, 610–620. [Google Scholar] [CrossRef]
- Strader, S.; Ashley, W.; Pingel, T.; Krmenec, A.J. Projected 21st century changes in tornado exposure. Clim. Chang. 2017, 141, 301–313. [Google Scholar] [CrossRef]
- Pita, G.; Pinelli, J.-P.; Gurley, K.; Mitrani-Reiser, J. State of the Art of Hurricane Vulnerability Estimation Methods: A Review. Nat. Hazards Rev. 2015, 16, 04014022. [Google Scholar] [CrossRef]
- Song, J.Y.; Alipour, A.; Moftakhari, H.R.; Moradkhani, H. Toward a more effective hurricane hazard communication. Environ. Res. Lett. 2020, 15, 064012. [Google Scholar] [CrossRef]
- Cho, S.Y.; Chang, H. Recent research approaches to urban flood vulnerability, 2006–2016. Nat. Hazards 2017, 88, 633–649. [Google Scholar] [CrossRef]
- Cutter, S.l.; Emrich, C.t.; Morath, D.p.; Dunning, C.m. Integrating social vulnerability into federal flood risk management planning. J. Flood Risk Manag. 2013, 6, 332–344. [Google Scholar] [CrossRef]
- Nasiri, H.; Yusof, M.J.M.; Ali, T.A.M. An overview to flood vulnerability assessment methods. Sustain. Water Resour. Manag. 2016, 2, 331–336. [Google Scholar] [CrossRef]
- Alipour, A.; Ahmadalipour, A.; Abbaszadeh, P.; Moradkhani, H. Leveraging machine learning for predicting flash flood damage in the Southeast US. Environ. Res. Lett. 2020, 15, 024011. [Google Scholar] [CrossRef]
- Khajehei, S.; Ahmadalipour, A.; Shao, W.; Moradkhani, H. A Place-based Assessment of Flash Flood Hazard and Vulnerability in the Contiguous United States. Sci. Rep. 2020, 10, 1–12. [Google Scholar] [CrossRef]
- IPCC. Climate Change 2001: Impacts, Adaptation, and Vulnerability: Contribution of Working Group II to the Third Assessment Report of the Intergovernmental Panel on Climate Change; McCarthy, J.J., Canziani, O.F., Leary, N.A., Dokken, D.J., White, K.S., Eds.; Cambridge University Press: Cambridge, UK, 2001; Volume 2. [Google Scholar]
- IPCC. Annex II: Glossary. In Climate Change 2014: Synthesis Report. Contribution of Working Groups I, II and III to the Fifth Assessment Report of the Intergovernmental Panel on Climate Change; Mach, K.J., Planton, S., von Stechow, C., Eds.; IPCC: Geneva, Switzerland, 2014. [Google Scholar]
- Hoogeveen, J.; Tesliuc, E.; Vakis, R.; Dercon, S. A Guide to the Analysis of Risk, Vulnerability and Vulnerable Groups; The World Bank: Washington, DC, USA, 2004. [Google Scholar]
- Adger, N. Vulnerability-ScienceDirect. Glob. Environ. Chang. 2006, 16, 268–281. [Google Scholar] [CrossRef]
- IPCC. Climate Change 2014: Impacts, Adaptation, and Vulnerability. Part A: Global and Sectoral Aspects. Contribution of Working Group II to the Fifth Assessment Report of the Intergovernmental Panel on Climate Change; Cambridge University Press: Cambridge, UK, 2014. [Google Scholar]
- Tánago, I.G.; Urquijo, J.; Blauhut, V.; Villarroya, F.; De Stefano, L. Learning from experience: A systematic review of vulnerability to drought. Nat. Hazards 2016, 80, 951–973. [Google Scholar] [CrossRef]
- Weis, S.W.M.; Agostini, V.N.; Roth, L.M.; Gilmer, B.; Schill, S.R.; Knowles, J.E.; Blyther, R. Assessing vulnerability: An integrated approach for mapping adaptive capacity, sensitivity, and exposure. Clim. Chang. 2016, 136, 615–629. [Google Scholar] [CrossRef]
- Singh, N.P.; Bantilan, C.; Byjesh, K. Vulnerability and policy relevance to drought in the semi-arid tropics of Asia–A retrospective analysis. Weather Clim. Extrem. 2014, 3, 54–61. [Google Scholar] [CrossRef]
- Opiyo, F.; Wasonga, O.; Schilling, J.; Mureithi, S. Resource–based conflicts in drought–prone Northwestern Kenya: The drivers and mitigation mechanisms. Wudpecker J. Agric. Res. 2012, 1, 442–453. [Google Scholar]
- Gleick, P.H. Water, Drought, Climate Change, and Conflict in Syria. Weather Clim. Soc. 2014, 6, 331–340. [Google Scholar] [CrossRef]
- Kamanga, T.F.; Tantanee, S.; Mwale, F.D.; Buranajarukorn, P. A multi hazard perspective in flood and drought vulnerability: Case study of Malawi. Geogr. Tech. 2020, 15, 132–144. [Google Scholar] [CrossRef]
- Ahmadalipour, A.; Moradkhani, H. Multi-dimensional assessment of drought vulnerability in Africa: 1960–2100. Sci. Total Environ. 2018, 644, 520–535. [Google Scholar] [CrossRef] [PubMed]
- Naumann, G.; Barbosa, P.; Garrote, L.; Iglesias, A.; Vogt, J. Exploring drought vulnerability in Africa: An indicator based analysis to be used in early warning systems. Hydrol. Earth Syst. Sci. 2014, 18, 1591. [Google Scholar] [CrossRef]
- Eklund, L.; Thompson, D. Differences in resource management affects drought vulnerability across the borders between Iraq, Syria, and Turkey. Ecol. Soc. 2017, 22. [Google Scholar] [CrossRef]
- Hameed, M.; Ahmadalipour, A.; Moradkhani, H. Drought and food security in the Middle East: An analytical framework. Agric. For. Meteorol. 2020. [Google Scholar] [CrossRef]
- Mohammad, A.H.; Jung, H.C.; Odeh, T.; Bhuiyan, C.; Hussein, H. Understanding the impact of droughts in the Yarmouk Basin, Jordan: Monitoring droughts through meteorological and hydrological drought indices. Arab. J. Geosci. 2018, 11, 103. [Google Scholar] [CrossRef]
- Taleb, O.; Mohammad, A.H.; Hussein, H.; Ismail, M.; Almomani, T. Over-pumping of groundwater in Irbid governorate, northern Jordan: A conceptual model to analyze the effects of urbanization and agricultural activities on groundwater levels and salinity. Environ. Earth Sci. 2019, 78, 40. [Google Scholar] [CrossRef]
- Ortega-Gaucin, D.; De la Cruz Bartolón, J.; Castellano Bahena, H.V. Drought Vulnerability Indices in Mexico. Water 2018, 10, 1671. [Google Scholar] [CrossRef]
- Kiem, A.S.; Johnson, F.; Westra, S.; van Dijk, A.; Evans, J.P.; O’Donnell, A.; Rouillard, A.; Barr, C.; Tyler, J.; Thyer, M.; et al. Natural hazards in Australia: Droughts. Clim. Chang. 2016, 139, 37–54. [Google Scholar] [CrossRef]
- Bordi, I.; Sutera, A. An analysis of drought in Italy in the last fifty years. Il Nuovo Cimento C 2002, 25, 185–206. [Google Scholar]
- Tarawneh, Q. Quantification of Drought in the Kingdom of Saudi Arabia. Int. J. Water Resour. Arid Environ. 2013, 2, 125–133. [Google Scholar]
- Karl, T.R.; Gleason, B.E.; Menne, M.J.; McMahon, J.R.; Heim, R.R., Jr.; Brewer, M.J.; Kunkel, K.E.; Arndt, D.S.; Privette, J.L.; Bates, J.J.; et al. U.S. temperature and drought: Recent anomalies and trends. Eos Trans. Am. Geophys. Union 2012, 93, 473–474. [Google Scholar] [CrossRef]
- Najac, J.; Vidal, J.-P.; Martin, E.; Franchisteguy, L.; Soubeyroux, J.-M. Changes in drought characteristics in France during the 21st century. EGU Gen. Assem. Conf. Abstr. 2010, 8975. [Google Scholar]
- Bonsal, B.R.; Wheaton, E.E.; Chipanshi, A.C.; Lin, C.; Sauchyn, D.J.; Wen, L. Drought Research in Canada: A Review. Atmosphere-Ocean 2011, 49, 303–319. [Google Scholar] [CrossRef]
- Kim, H.; Park, J.; Yoo, J.; Kim, T.-W. Assessment of drought hazard, vulnerability, and risk: A case study for administrative districts in South Korea. Assess. Drought Hazard Vulnerability Risk Case Study Adm. Dist. South Korea 2015, 9, 28–35. [Google Scholar] [CrossRef]
- Vargas, J.; Paneque, P. Challenges for the Integration of Water Resource and Drought-Risk Management in Spain. Sustainability 2019, 11, 308. [Google Scholar] [CrossRef]
- Wilhelmi, O.V.; Wilhite, D.A. Assessing Vulnerability to Agricultural Drought: A Nebraska Case Study. Nat. Hazards 2002, 25, 37–58. [Google Scholar] [CrossRef]
- Fontaine, M.M.; Steinemann, A.C. Assessing Vulnerability to Natural Hazards: Impact-Based Method and Application to Drought in Washington State. Nat. Hazards Rev. 2009, 10, 11–18. [Google Scholar] [CrossRef]
- Kiem, A.S.; Austin, E.K. Drought and the future of rural communities: Opportunities and challenges for climate change adaptation in regional Victoria. Glob. Environ. Chang. 2013, 23, 1307–1316. [Google Scholar] [CrossRef]
- Praskievicz, S. The myth of abundance: Water resources in humid regions. Water Policy 2019, 21, 1065–1080. [Google Scholar] [CrossRef]
- Preziosi, E.; Bon, A.D.; Romano, E.; Petrangeli, A.B.; Casadei, S. Vulnerability to Drought of a Complex Water Supply System. The Upper Tiber Basin Case Study (Central Italy). Water Resour. Manag. 2013, 27, 4655–4678. [Google Scholar] [CrossRef]
- Lund, J.; Medellin-Azuara, J.; Durand, J.; Stone, K. Lessons from California’s 2012–2016 Drought. J. Water Resour. Plan. Manag. 2018, 144, 04018067. [Google Scholar] [CrossRef]
- Horridge, M.; Madden, J.; Wittwer, G. The impact of the 2002–2003 drought on Australia. J. Policy Model. 2005, 27, 285–308. [Google Scholar] [CrossRef]
- Ciais, P.; Reichstein, M.; Viovy, N.; Granier, A.; Ogée, J.; Allard, V.; Aubinet, M.; Buchmann, N.; Bernhofer, C.; Carrara, A.; et al. Europe-wide reduction in primary productivity caused by the heat and drought in 2003. Nature 2005, 437, 529–533. [Google Scholar] [CrossRef] [PubMed]
- Rippey, B. The US drought of 2012. Weather Clim. Extrem. 2015, 10, 57–64. [Google Scholar] [CrossRef]
- Stah, K.; Kohn, I.; Blauhut, V.; Urquijo, J.; De Stefano, L.; Acácio, V.; Dias, S.; Stagge, J.H.; Tallaksen, L.M.; Kampragou, E.; et al. Impacts of European drought events: Insights from an international database of text-based reports. Nat. Hazards Earth Syst. Sci. 2016, 16, 801–819. [Google Scholar] [CrossRef]
- Ahmadi, B.; Ahmadalipour, A.; Moradkhani, H. Hydrological drought persistence and recovery over the CONUS: A multi-stage framework considering water quantity and quality. Water Res. 2019, 150, 97–110. [Google Scholar] [CrossRef]
- Allen, C.D.; Breshears, D.D. Drought-induced shift of a forest–woodland ecotone: Rapid landscape response to climate variation. Proc. Natl. Acad. Sci. 1998, 95, 14839–14842. [Google Scholar] [CrossRef]
- Jump, A.S.; Ruiz-Benito, P.; Greenwood, S.; Allen, C.D.; Kitzberger, T.; Fensham, R.; Martínez-Vilalta, J.; Lloret, F. Structural overshoot of tree growth with climate variability and the global spectrum of drought-induced forest dieback. Glob. Chang. Biol. 2017, 23, 3742–3757. [Google Scholar] [CrossRef]
- Zimmer, H.C.; Brodribb, T.J.; Delzon, S.; Baker, P.J. Drought avoidance and vulnerability in the Australian Araucariaceae. Tree Physiol. 2016, 36, 218–228. [Google Scholar] [CrossRef] [PubMed]
- Chessman, B.C. Identifying species at risk from climate change: Traits predict the drought vulnerability of freshwater fishes. Biol. Conserv. 2013, 160, 40–49. [Google Scholar] [CrossRef]
- Wilson, S.; Smith, A.C.; Naujokaitis-Lewis, I. Opposing responses to drought shape spatial population dynamics of declining grassland birds. Divers. Distrib. 2018, 24, 1687–1698. [Google Scholar] [CrossRef]
- Freire-González, J.; Decker, C.; Hall, J.W. The economic impacts of droughts: A framework for analysis. Ecol. Econ. 2017, 132, 196–204. [Google Scholar] [CrossRef]
- Kirby, M.; Connor, J.D.; Bark, R.H.; Qureshi, M.E.; Keyworth, S.W. The economic impact of water reductions during the Millennium Drought in the Murray-Darling Basin. Available online: https://ageconsearch.umn.edu/record/124490 (accessed on 11 July 2020).
- Padowski, J.C.; Jawitz, J.W. Water availability and vulnerability of 225 large cities in the United States. Water Resour. Res. 2012, 48. [Google Scholar] [CrossRef]
- Shiklomanov, I.A.; Rodda, J.C. World Water Resources at the Beginning of the Twenty-First Century; Cambridge University Press: Cambridge, UK, 2004. [Google Scholar]
- Hoekstra, A.Y.; Mekonnen, M.M.; Chapagain, A.K.; Mathews, R.E.; Richter, B.D. Global Monthly Water Scarcity: Blue Water Footprints versus Blue Water Availability. PLoS ONE 2012, 7, e32688. [Google Scholar] [CrossRef]
- Svoboda, M.; LeComte, D.; Hayes, M.; Heim, R.; Gleason, K.; Angel, J.; Rippey, B.; Tinker, R.; Palecki, M.; Stooksbury, D.; et al. THE DROUGHT MONITOR. Bull. Am. Meteorol. Soc. 2002, 83, 1181–1190. [Google Scholar] [CrossRef]
- Bureau, U.C. State Population Totals: 2010–2019. Available online: https://www.census.gov/data/tables/time-series/demo/popest/2010s-state-total.html (accessed on 30 June 2020).
- Crausbay, S.D.; Ramirez, A.R.; Carter, S.L.; Cross, M.S.; Hall, K.R.; Bathke, D.J.; Betancourt, J.L.; Colt, S.; Cravens, A.E.; Dalton, M.S.; et al. Defining Ecological Drought for the Twenty-First Century. Bull. Am. Meteorol. Soc. 2017, 98, 2543–2550. [Google Scholar] [CrossRef]
- Matthews, W.J.; Marsh-Matthews, E. Effects of drought on fish across axes of space, time and ecological complexity. Freshw. Biol. 2003, 48, 1232–1253. [Google Scholar] [CrossRef]
- Kovach, R.P.; Dunham, J.B.; Al-Chokhachy, R.; Snyder, C.D.; Letcher, B.H.; Young, J.A.; Beever, E.A.; Pederson, G.T.; Lynch, A.J.; Hitt, N.P.; et al. An Integrated Framework for Ecological Drought across Riverscapes of North America. BioScience 2019, 69, 418–431. [Google Scholar] [CrossRef]
- The Nature Conservancy TNC Lands. Available online: http://www.tnclands.tnc.org/ (accessed on 17 January 2020).
- U.S. Geological Survey Protected Areas Database of the United States (PAD-US): U.S. Geological Survey data release. Available online: https://doi.org/10.5066/P955KPLE (accessed on 17 January 2020).
- United States Department of Agriculture. Census of Agriculture 2017. United States Summary and State Data; United States Department of Agriculture: Washington, DC, USA, 2019.
- USDA Economic Research Service Annual cash receipts by commodity. Available online: https://data.ers.usda.gov/reports.aspx?ID=17832 (accessed on 8 January 2020).
- Mekonnen, M.M.; Hoekstra, A.Y. A Global Assessment of the Water Footprint of Farm Animal Products. Ecosystems 2012, 15, 401–415. [Google Scholar] [CrossRef]
- U.S. Energy Information Administration. Electric Power Monthly with Data for December 2018; Department of Energy: Washington, DC, USA, 2019.
- Gleick, P.H. Impacts of California’s ongoing drought: Hydroelectricity Generation; Pacific Institute: Oakland, CA, USA, 2015; p. 10. [Google Scholar]
- Christian-Smith, J.; Levy, M.C.; Gleick, P.H. Maladaptation to drought: A case report from California, USA. Sustain. Sci. 2015, 10, 491–501. [Google Scholar] [CrossRef]
- Marcouiller, D.W.; Kim, K.K.; Deller, S.C. Natural amenities, tourism and income distribution. Ann. Tour. Res. 2004, 31, 1031–1050. [Google Scholar] [CrossRef]
- Hutt, C.P.; Hunt, K.M.; Steffen, S.F.; Grado, S.C.; Miranda, L.E. Economic Values and Regional Economic Impacts of Recreational Fisheries in Mississippi Reservoirs. North Am. J. Fish. Manag. 2013, 33, 44–55. [Google Scholar] [CrossRef]
- Connelly, N.A.; Brown, T.L. Net Economic Value of the Freshwater Recreational Fisheries of New York. Trans. Am. Fish. Soc. 1991, 120, 770–775. [Google Scholar] [CrossRef]
- Food and Agriculture Organization of the United Nations. AQUASTAT–FAO’s Global Information System on Water and Agriculture, Georeferenced Database on Dams. Available online: http://www.fao.org/aquastat/en/databases/dams (accessed on 10 January 2020).
- Food and Agriculture Organization of the United Nations. AQUASTAT Main Database. Available online: http://www.fao.org/nr/water/aquastat/data/query/index.html?lang=en (accessed on 13 January 2020).
- Brown, T.; Mahat, V.; Ramirez, J.A. Adaptation to Future Water Shortages in the United States Caused by Population Growth and Climate Change. Earths Future 2019, 7, 219–234. [Google Scholar] [CrossRef]
- Cherkauer, K.A.; Bowling, L.C.; Lettenmaier, D.P. Variable infiltration capacity cold land process model updates. Glob. Planet. Chang. 2003, 38, 151–159. [Google Scholar] [CrossRef]
- Seaber, P.R.; Kapinos, F.P.; Knapp, G.L. Hydrologic Unit Maps; U.S. Geological Survey: Reston, VA, USA, 1987.


© 2020 by the authors. Licensee MDPI, Basel, Switzerland. This article is an open access article distributed under the terms and conditions of the Creative Commons Attribution (CC BY) license (http://creativecommons.org/licenses/by/4.0/).
Share and Cite
Engström, J.; Jafarzadegan, K.; Moradkhani, H. Drought Vulnerability in the United States: An Integrated Assessment. Water 2020, 12, 2033. https://doi.org/10.3390/w12072033
Engström J, Jafarzadegan K, Moradkhani H. Drought Vulnerability in the United States: An Integrated Assessment. Water. 2020; 12(7):2033. https://doi.org/10.3390/w12072033
Chicago/Turabian StyleEngström, Johanna, Keighobad Jafarzadegan, and Hamid Moradkhani. 2020. "Drought Vulnerability in the United States: An Integrated Assessment" Water 12, no. 7: 2033. https://doi.org/10.3390/w12072033
APA StyleEngström, J., Jafarzadegan, K., & Moradkhani, H. (2020). Drought Vulnerability in the United States: An Integrated Assessment. Water, 12(7), 2033. https://doi.org/10.3390/w12072033