1. Introduction
Estuaries, located at the confluence of rivers and oceans, are the main channel of material between basin and marine, and also one of the natural habitats of many aquatic organisms [
1]. Due to the particular location and the interaction between land and sea, the estuarine ecosystem has unique environmental characteristics such as the mixing of freshwater and saltwater and nutrients enrichment, as well as critical ecological services functions such as biodiversity maintenance [
2,
3,
4]. Estuarine sluice construction has positive benefits such as flood prevention, increasing freshwater resources and improving the urban water landscape [
5]. However, it also directly isolates the interaction between rivers and oceans, disrupts the circulation of freshwater and nutrients into the marine system [
6] and changes the seasonal fluctuation of salinity and nutrients in the coastal waters [
7]. Hence, the construction of sluices in estuaries can not only significantly disrupt hydrodynamic processes, but also change the freshwater input and nutrients distribution to a certain extent, and as a result, habitat functions. Specifically, salinity, as a sensitive ecological factor in estuarine habitats, is related to the distribution of phytoplankton [
8], while the concentration and distribution pattern of nutrients restrict the biomass of phytoplankton [
9]. Besides, there is established consensus that the increase of nutrients is the leading cause of water eutrophication, which has been identified as one of the greatest threats to the health of coastal ecosystems [
10]. There is ample evidence that maintaining a suitable salinity and nutrient environment is a fundamental guarantee of the survival and reproduction of organisms and the maintenance of biodiversity [
11,
12,
13]. However, the presence of sluices will change the distribution and structure of organisms in estuaries [
14], thus affecting the structure and function of the entire marine ecosystem [
15,
16].
At present, the researches on the impact of sluice construction on the ecological environment mainly focus on the change of water environment after sluice construction, the evolution trend of brackish water and saltwater biome, the impact of the changing freshwater input flow in the estuary on the ecosystem [
17,
18,
19] and the ecological water demand of different estuaries and the evaluation method of ecological health system, etc. [
20,
21]. However, there is a lack of study on the changes of salinity and nutrients caused by the operation of estuarine sluice, as well as the influence factors on organisms. In recent years, Jiaojiang River estuary is planning to build an estuarine sluice. Nevertheless, the water quality of Jiaojiang estuary is affected by the coastal sanitary sewage, aquaculture wastewater discharge and the loss of agricultural fertilizer, which result in a severe pollution of dissolved inorganic nitrogen and active phosphate. Jiaojiang River sea area is a high-incidence area of red tide outbreak in China’s coastal areas, which not only threatens the biodiversity and stability, but also harms tourism and aquaculture [
22]. Therefore, it is of considerable significance to reasonably evaluate the stress of sluice construction on the estuarine ecosystem and to develop appropriate sluice regulation measures for the protection of the estuarine ecosystem.
The impact of sluice construction on the water ecological environment was mainly studied by establishing a mathematical model to simulate the hydrodynamic processes and the change of salinity and nutrients [
23]. Since the flow structure and nutrient distribution characteristics of natural rivers are relatively complex, to accurately reflect the influence of sluice construction, a plane two-dimensional turbulent flow model is generally used to simulate the flow field distribution. As computer performance greatly improved and mathematical model simulation technology developed, many scholars have used the two-dimensional numeric simulation method to simulate the different characteristics of estuaries and obtained satisfactory results. For example, Le Thi Viet Hoa et al. [
24] used the numeric model to analyze the comprehensive impact of dams on the Mekong River and sea level rise on the hydrodynamic environment of the Mekong river estuary. At present, there are many two-dimensional models widely used in the world, among which MIKE 21, a useful and powerful tool based on two-dimensional free surface flow simulation for simulating hydrodynamics and environment, is widely used in the shallow estuary region [
25,
26,
27]. This study demonstrated the practicality of the MIKE 21 model in hydrodynamic simulation and reflection of nutrient distribution and movement in the estuarine system.
In this study, different scheduling schemes of estuarine sluice were designed, and the salinity field and nutrient concentration of estuarine and coastal waters under each scenario were simulated and calculated by the mathematical model. Subsequently, from the perspective of giving full play to the economic benefits of the project and relieving the adverse effects, the specific environmental regulation measures to reduce estuarine stress were proposed. (Determine the discharge volume, discharge time, duration, and so on.)
2. Study Area: Jiaojiang Catchment
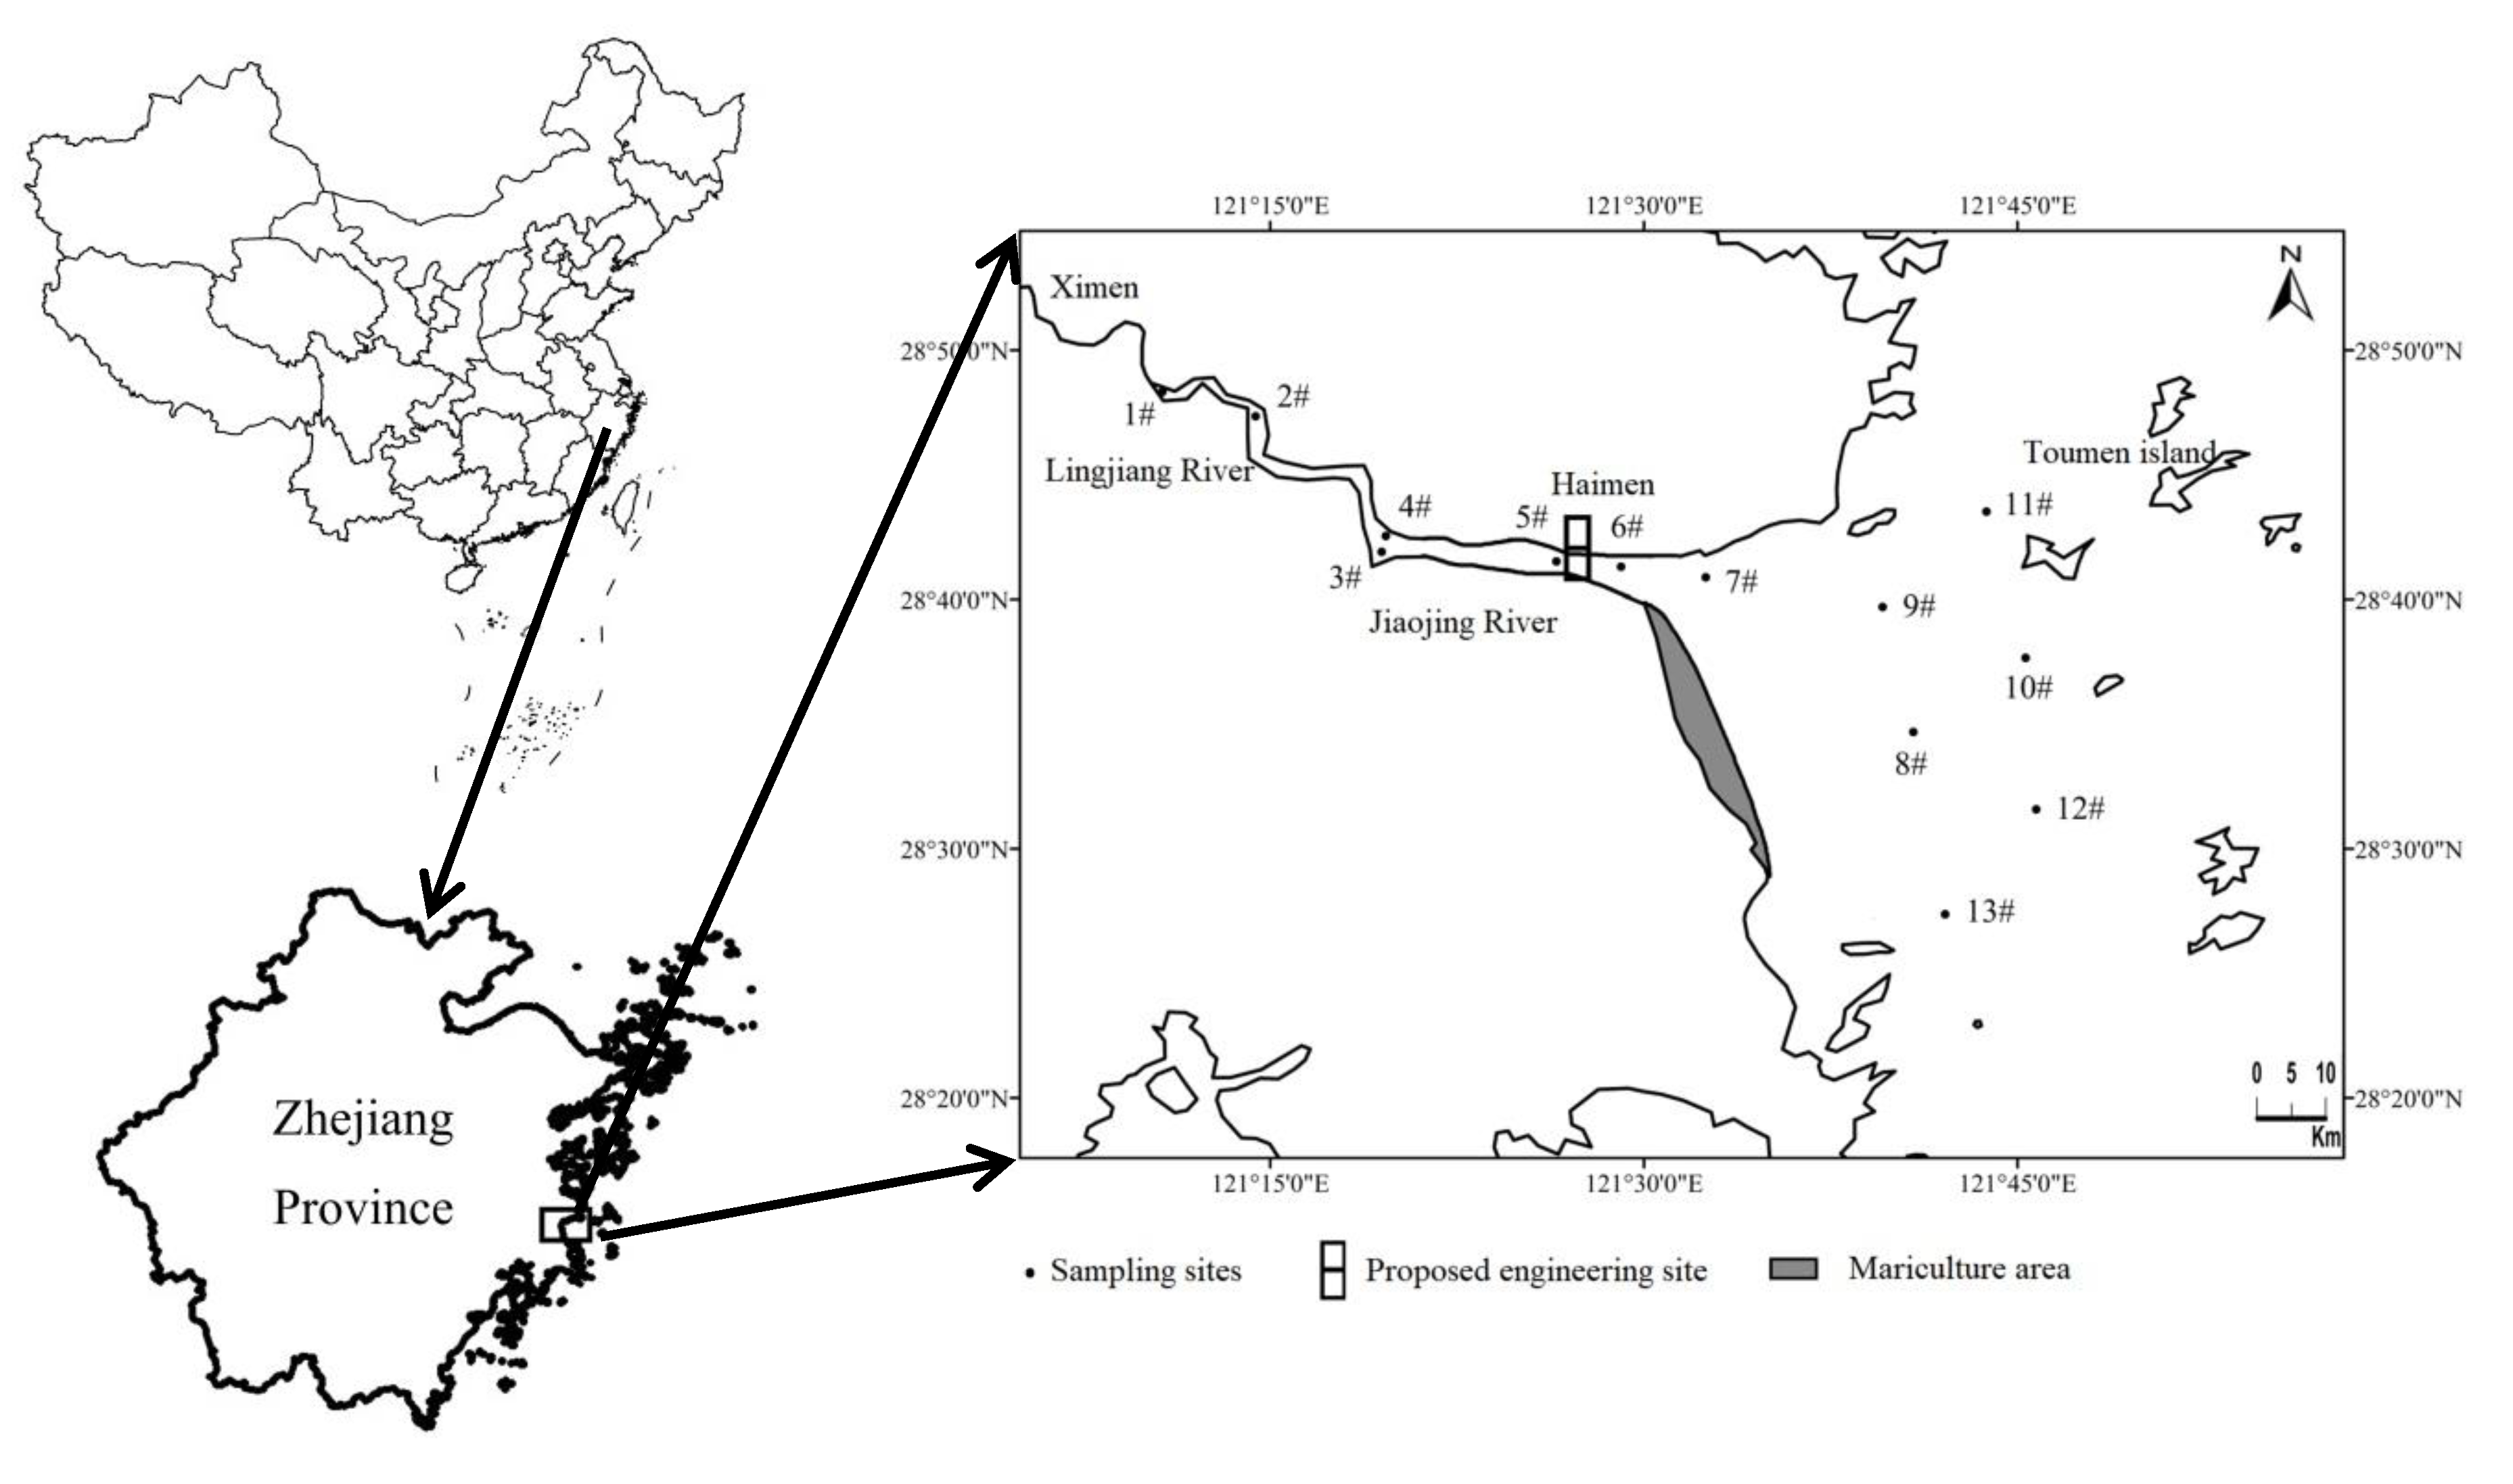
Jiao (ling) jiang River basin, located in the central coastal area of Zhejiang, China, is triangular and between the latitudes 28°22’–29°19’ N and longitudes 120°14’–121°55’ E. Jiao (ling) jiang River system is the largest water system in Taizhou City and the third-largest water system in Zhejiang Province. The lower reaches of Jiaojiang River is a tidal river, and mainly affected by the estuary. Jiaojiang River estuary is a strong tidal estuary and the tide type is irregular semidiurnal tide [
28]. The Taizhou Bay outside the estuary shapes like a trumpet, which is a typical regular semidiurnal tide. In 2010, a large-scale reclamation project was completed on the south bank of Jiaojiang River estuary, and pond mariculture has become one of the primary aquaculture mode [
29] (
Figure 1).
In 2013, 13 vertical lines were set up to sample the water body of Jiao (ling) jiang River (
Figure 1), among which five (1#–5#) were set up in the mainstream and eight (6#–13#) were set up in the estuary and the coastal waters. Water samples were taken at the characteristic moments of maximum flood tide, high slack water, maximum ebb tide and low slack water of the first half tide of 13 vertical lines in the flood season of large, medium and small tide flood voyages. The monitoring contents included flow rate, salinity (S), dissolved inorganic nitrogen (DIN =
) and
ο-phosphate (
) and the monitoring frequency was once per month.
The distribution and variation of salinity in Jiao (ling) jiang River Basin in rivers, estuaries, and offshore were related to the influence of many factors such as tidal current and runoff. The average salinity of Lingjiang River channel, Jiaojiang river channel and Jiaojiang River estuary and its periphery was 0.4–8.3‰, 11.1–18.0‰ and 19.9‰–28.6‰, respectively. On the whole, the salinity increased gradually from the upper Lingjiang river channel to the lower Jiaojiang River channel, then to Jiaojiang River estuary and periphery.
Monitoring results showed that the DIN concentration ranged from 1.34 to 2.40 mg/L, and o-phosphate concentration ranged from 0.20 to 0.40 mg/L in Jiaojiang River while in the estuary and nearshore waters the range was 0.61–0.89 mg/L and 0.032–0.042 mg/L. The nutrient concentration in the mainstream of Jiaojiang river was significantly higher than that in the estuary and nearshore waters.
According to statistics, there were 58 genera (species) of phytoplankton in the Jiaojiang River estuary area, which belong to five phyla. Bacillariophyta was the main dominant phylum, accounting for 76% of the total species, followed by Pyrrophyta and Chlorophyta.
In order to fully reflect the impact of the sluice construction on salinity and nutrients of the estuary and coastal waters, the proposed site of the sluice was selected at Niutoujing after considering the current topography, water quality, policies and other factors (
Figure 1). The proposed site is two kilometers upstream of the second Jiaojiang Bridge in the Niutoujing operation area of Haimen port area, Taizhou port. Xiaoyuanshan is on the left bank, Niutoujing is on the right bank, and the river width is about 900 m. According to the terrain conditions, from left to right, the following are arranged in sequence: diversion dam at the left bank, tidal sluice, diversion dam at the right bank, double-lane ship lock and dam blocking at the right bank. The tidal sluice has a total of 24 drain holes, each with a net width of 25 m and a total net width of 600 m, and the elevation of sluice bottom is −5.0 m. The designed normal pool level and the lowest water level at upstream of the sluice gate are 2.6 m and 1.5 m, respectively. In addition, to facilitate the passage of migratory fish, fishways are set up on the diversion dams on both river banks.
4. Model Output Result and Discussion
In this section, the changes of salinity, nutrients, and flow velocity after the opening of sluice are analyzed, and thus determine the pressure brought by sluice operation on aquaculture organisms and phytoplankton.
4.1. Salinity
After the construction of tidal sluice on Jiaojiang estuary, a similar cecum channel would be formed to connect with the sea. The estuarine sluice should begin to drain at the early stage of ebb tides, as the tidal level of the outer sea decreased continuously. Subsequently, the salinity value of the area near the sluice decreased rapidly, causing a drastic change of the salinity field, whist the change of the salinity value of the nearshore area was not significant. During modeling, the salinity value generally showed a decreasing process from Jiaojiang estuary (7# vertical line), through the middle part of the bay (8# and 9# vertical line) and to the periphery (10#, 11#, 12#, 13# vertical line). Such change, where a joint influence is involved, results from the trumpet-shaped opening of Taizhou Bay and the limited amount of freshwater and the salinity compensation of the outer sea during the high tide.
The tidal currents in this sea area are regular semidiurnal tides showing a reciprocating flow and the salinity value also fluctuates with it. During ebb tide, the contour line of salinity extended outward in the shape of the tongue with more significant curvature. During high tide, the contour line extended to the interior of estuary in the form of an arc with a smaller curvature. There is no doubt that the salinity value would drop to the lowest at low tide and the impact area caused by the discharge of freshwater would be the largest. Hence, the study area could be further differentiated by the salinity value. Salinity data at three times of low tide during the simulation were grouped by salinity regimes of tidal fresh (<0.5‰), oligohaline (>0.5–5.0‰), mesohaline (>5.0–18.0‰) and polyhaline (>18.0‰) [
31]. The drawing results are presented in
Figure 8.
As shown in
Figure 8, (1) The estuarine sluice would be closed after the end of the first low tide when it was discharged at a large flow of 5000 m
3/s. The mixing effect of tidal current made the areas of tidal fresh reduce continuously, from 12.4 km in front of the sluice to within 4.6 km (c) at spring tide and from 11.8 km to within 5.6 km (f) at neap tide, while the areas of mesohaline expanded continuously. Due to the difference of tidal dynamics, the extended range of mesohaline area at neap tide was smaller than that at spring tide, and it could be as far as the regional boundary (c) at spring tide; (2) The estuarine sluice would remain open at all times of low tide when it was discharged at a small flow of 1500 m
3/s. With the continuous replenishment of freshwater, the areas of tidal fresh expanded continuously from 5.8 km to 9.2 km (a) in front of the sluice at spring tide, and from 3.8 km to 8.7 km (d) at neap tide, whose influence range even exceeded the large flow.
Moreover, the salinity fluctuation brought by water release would repeatedly cover the coastal aquaculture area on the south bank of Jiaojiang River estuary (
Figure 8). According to the investigation, shellfish (clams and
Sinonovacula constricta), bass, black snapper and other fish, as well as green crabs, are the primary aquaculture organisms in Zhejiang coastal areas. For all species and life stages, the lethal salinity is 5‰–8‰, and the salinity amplitude should never surpass 10‰ or it will affect their growth. Therefore, to figure out whether the salinity change would become a major threat in the aquaculture area, the salinity values under different scheduling schemes were randomly selected and statistically calculated, and the results are shown in
Figure 9. It can be seen from
Figure 9 that the minimum value of the salinity field in the aquaculture area was 9‰–15‰ when water was released in each regulation scheme, which was higher than the survival limit value of 8‰ of aquaculture organisms. Likewise, the fluctuation range of salinity was not higher than or substantially higher than the upper limit of 10‰ at spring tide and neap tide, where the range with the increase of discharge was 5.6‰, 9.5‰ and 12‰, in the former and 1.8‰, 8.4‰ and 11.8‰, in the latter. The results indicated that the low salinity drainage had little impact on the aquaculture of Jiaojiang River estuary. Moreover, the opening of the sluice with the small flow was more conducive to the growth and reproduction of aquaculture organisms in the sea area.
4.2. Nutrient Restriction
The supply of nutrients plays a crucial role in the algae competition. In some sea areas, especially in semi-closed bays, due to the increase of nutrients flux into the sea, the structural distribution of nutrients changes, which have a corresponding impact on the population structure of phytoplankton [
32]. The measured data showed that the nutrient concentration in the mainstream of Jiaojiang River was significantly higher than that in the estuary and coastal water. Therefore, the upper high concentration nutrient drainage of the estuarine sluice after construction would change the nutrient structure in the estuary, which would have a strong selective effect on the phytoplankton community. Michael Neill [
33] proposed a method of mapping the superposition of nutrients and salts to determine the limiting factor of phytoplankton at any salinity. According to the drawing method, the ratio of DIN(=
) and
ο-phosphate (
) on the vertical axis in the overlay chart was set as the Redfield atomic ratio that was easy to be bioavailable and satisfied for the growth of aquatic plants, i.e., N:P = 16:1 [
34]. When the nutrient map was superimposed, the lowest trend line represented the limiting nutrient of algae under any salinity. The drawing results are presented in
Figure 10.
The
ο-phosphate trend line in
Figure 10a was located at the bottom of the superposition figure, which showed that within the sampling date,
ο-phosphate (P) was the limiting nutrient when the salinity of the Jiaojiang River estuary was less than 30‰. The trend line of DIN and
ο-phosphate tended to converge with the increase of salinity, indicating that the limiting degree of P tended to decrease with the increase of salinity.
When the proposed estuarine sluice released water (
Figure 10b–g), the concentration of DIN and ο-phosphate under the sluice would increase significantly, which could deteriorate the eutrophication of the estuary. Moreover, as can be seen from the diagrams, the distribution of nutrients was similar, where the concentration near the shore was high, while that in the open sea was low. At the same time, the diagrams provided an insight of a good correlation between the concentration of nutrients and salinity, which indicated that the reduction of nutrient content was mainly affected by the dilution of outer seawater in the process of mixing. Not only that, N became the limiting factor in the nearshore area due to the different increase degree of N and P input. Meanwhile, in the process of transition from low salinity to high salinity, P changed more rapidly in the salinity gradient direction, which increased the degree of the water body in P limitation, accordingly, causing limitation in the open sea turned into P. By comparing
Figure 10b–g, it was not difficult to find that the salinity value of the transition from N limitation to P limitation in the estuarine environment increased with the discharge volume, which was the same as the influence rule of different scheduling schemes on the salinity field. Furthermore, in addition to the discharge volume, the effect of tidal dynamics was fully reflected in the difference of the transitional salinity value, in other words, the change was more obvious at spring tide.
4.3. Effects on Phytoplankton
In Jiaojiang River estuary and sea area, red tides of Gymnodinium (Dinophyta), Skeletonema costatum (Bacillariophyta) and Thalassiosira (Bacillariophyta) have occurred for many times. According to the survey, the first dominant phylum of phytoplankton in Jiao (Ling) River basin was Bacillariophyta, while the second dominant phylum was Chlorophyta (27%) and Cyanophyta (11%) in freshwater areas and Dinophyta in estuary areas. The total proportion of the first and second dominant phyla in the two regions is 93% and 95%, respectively, which accounted for most the total phytoplankton species composition in the two regions. Therefore, we predicted that the community structure succession of the dominant species of phytoplankton after the construction of the sluice would happen among the first and second dominant species before the construction.
Various phytoplankton shows different adaptability to the change of flow velocity, but the one common is that tremendous flow velocity can interfere with its floating for photosynthesis. From the flow velocity diagram of each representative vertical line, the disturbance of estuarine sluice to the water body was mainly reflected in the sudden maximum value appearance of flow velocity compared with the flow velocity before water release. According to statistics, with the increase of set discharge, the maximum velocity of each vertical line was between 0.35–2.07 m/s, 0.63–2.15 m/s and 0.95–2.15 m/s, respectively at spring tide and between 0.58–1.37 m/s, 0.61–1.38 m/s and 0.82–1.38 m/s, respectively at neap tide. Compared with Dinophyta, Bacillariophyta have a more extensive range of suitable flow velocity and can survive in water bodies of 0.05–2.5 m/s. Therefore, from the perspective of flow velocity change, it is believed that Bacillariophyta can better adapt to the change of flow velocity when the sluice was in frequent stop–start motion in flood season.
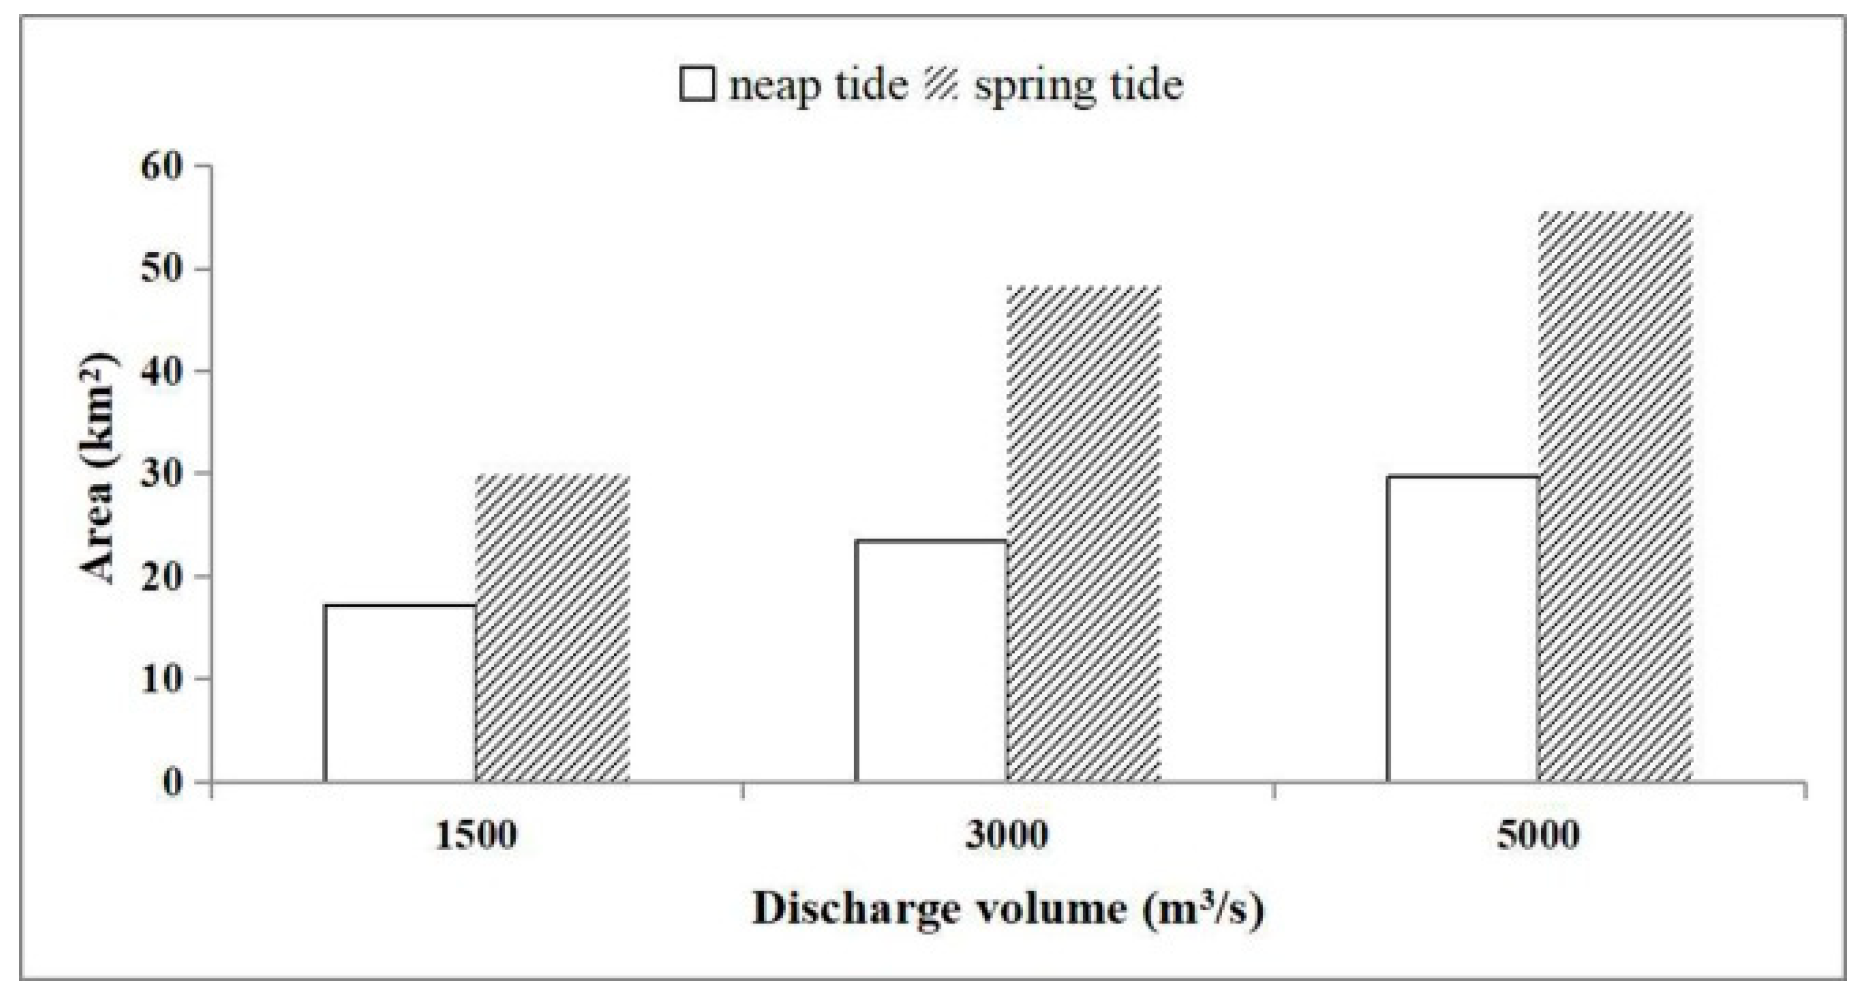
In addition to the slow flow rate, the current recognized conditions for phytoplankton growth include suitable salinity and sufficient nutrients [
35]. Studies on the Yangtze River estuary and adjacent estuaries showed that, under the influence of the diluted water tongue in summer, within the area with salinity value between 15‰ and 25 ‰, the amount of phytoplankton could reach a yearly peak and the area was also a high-incidence area of red tide [
36]. Therefore, the area with an average salinity of 15‰–25‰ under different operation schemes was counted, and the relationship between schemes and area is presented in
Figure 11. The analysis was carried out in combination with the nutrient situation in the salinity area (
Figure 10). The results showed that in the salinity area (15‰–25‰), when the water discharged at a small flow rate at spring tide, the estuary was under P limitation, which was the same as the initial state. In this situation, for phytoplankton that had adapted to the change of the salinity and nutrients in the estuary, the high nutrient concentration brought by the discharged water would allow them to grow in large quantities and may form an algal bloom. Conversely, when the estuarine sluice opened in other ways, the salinity zone was in the N and P limitation alternating zone. Therefore, to adapt to the changes in nutrient structure, phytoplankton need to pay more energy to regulate physiological activities thus resulting in the decrease of species diversity and interspecific competition, which may lead to the proliferation of harmful or potentially harmful species.
To sum up, when the estuarine sluice was in operation, a salinity area suitable for phytoplankton growth would be formed within the range of 8–14 km from the estuarine sluice (15‰ < s < 25‰). In this area, there were not only abundant nutrients brought by water discharge, but also lower suspended sediment content and higher transparency than coastal areas. Therefore, some algae species with wide temperature, extensive salinity and strong adaptability, mainly Bacillariophyta, would rapidly reproduce and reach a peak and very likely, may form the red tide.
5. Conclusions
MIKE 21 water environment platform model was successfully applying to Jiaojiang River estuary, and simulations had provided reasonably good predictions in the region, and model values showed a good fit. The mathematical model could be used to simulate the influence of different operations on the water body after the construction of proposed estuarine sluice. The simulation results showed that the eutrophic freshwater on the sluice would change the concentration of salinity and nutrients under the sluice. The simulation results demonstrate that when the sluice was in operation, the area under the sluice would change from the saltwater area to an interaction zone of freshwater, brackish water and saltwater. Moreover, with the increase of salinity, the concentration of nutrients would decrease due to the dilution of seawater. The better relationship between nutrients and salinity (
Figure 10) also showed that physical mixing played a vital role in nutrient decline.
The adverse factors caused by the discharging of estuarine sluice included sharp changes in salinity and changes in nutrients distribution. More important, the degree to which adverse factors affected the organisms varied with the scheduling schemes. First of all, the change of the salinity field would have an impact on the organisms in the aquaculture area. The minimum salinity in aquaculture areas under different sluice opening methods was higher than the tolerance threshold of organisms, indicating that the opening of sluice would not cause the death of mariculture organisms. However, a sharp fall in salinity value caused by the selection of large discharge would have a particularly negative impact on its growth (
Figure 9). Second, for phytoplankton, the releasing of water may form a red tide explosion area under the estuarine sluice, and the area and quantity were firmly related to the scheduling schemes. The sequence from high to low is small flow at spring tide, large flow at spring tide, large flow at neap tide, small flow at neap tide (
Figure 10 and
Figure 11). In conclusion, to reduce the stress on aquaculture organisms and the range of red tide, it is suggested that the proposed tide sluice at Jiaojiang River estuary should choose the mode of draining frequent with the small flow at neap tide as far as possible.
The appraisal of the long-term effects of the construction of sluice on estuarine ecosystem can provide a suggestion to carry out the ecological restoration measures for estuary and riparian zones. Above all, improving the water network circulation and the treatment standard of the sewage treatment plant is an indispensable implementation measure to recover the river water quality. In addition, ecological dredging of coastal tidal flat is the most promising restoration action in many polluted estuaries. It is also encouraged to use motor vessel to move back and forth to mix water quality when receiving the tide and increase the inflow of high-salinity tide before drainage.


