Article

Reservoir-Induced Hydrological Alterations Using Ecologically Related Hydrologic Metrics: Case Study in the Beijiang River, China

1
School of Civil Engineering and Transportation, State Key Laboratory of Subtropical Building Science, South China University of Technology, Guangzhou 510641, China
2
Guangdong Engineering Technology Research Center of Safety and Greenization for Water Conservancy Project, Guangzhou 510641, China
3
Center for Water Resource and Environment, Sun Yat-Sen University, Guangzhou 510275, China
*
Author to whom correspondence should be addressed.
Water 2020, 12(7), 2008; https://doi.org/10.3390/w12072008
Submission received: 4 June 2020 / Revised: 8 July 2020 / Accepted: 13 July 2020 / Published: 15 July 2020
(This article belongs to the Special Issue Wetland Ecohydrology and Water Resource Management)

Abstract

:
Anthropogenic activities have a tremendous impact on water ecosystems worldwide, especially in China. To quantitatively evaluate the hydrological alteration connected with aquatic lives and river ecological risks, we took the Beijiang River located in South China as the case study and used ecosurplus (defined as ecological carrying capacity exceeding ecological consumption)/ecodeficit (defined as ecological consumption exceeding carrying capacity) and Indicators of Hydrological Alterations to evaluate hydrological changes. The Ecologically Relevant Hydrologic Indicators were employed to select the key indices of Indicators of Hydrological Alterations, and the eco-environmental water demand calculation provide an effective way for the reservoir operation. Results showed that: (1) High flows contributed more to the ecodeficit, while low flows contributed more to the ecosurplus; (2) the ecodeficit in some parts of the river basin might exceed the ecosurplus after reservoir construction, especially along the main stream; and (3) the determination of eco-environmental water demand is a feasible way for improving the environment by controlling reservoirs. The current study can help guide the optimization of hydrological operation in the basin toward making the ecosystem healthier and has potential to further provide a reference for other basins in terms of hydrological alterations driven by anthropogenic activities.

1. Introduction

Human activities have a substantial impact on aquatic ecosystems through the development of social processes, population growth, urbanization, and the control of rivers [1,2,3,4,5]. In particular, the resultant pollution of ecological environment has adverse impacts on aquatic organisms and causes ecological damage [6,7]. There is an urgent need to analyze the hydrological changes as a result of reservoir construction to better control hydrological regimes.
Along with increase in dams, the analysis of hydrological scenarios has become a matter of great concern worldwide. Lian et al. [8] analyzed the change in Indicators of Hydrological Alterations (IHA) caused by human activities, such as flow diversion, levee building, and the construction of dams in the Illinois River, a tributary of the Mississippi River in United States, and found that human activities had substantial effects on the magnitudes, frequency, and duration of hydrological regimes, and the hydroclimatic alterations led to the loss of submerged aquatic plants as well as soil-moist plants. Soon after, McManamay [9] quantified and summarized the hydrological responses that have been impacted by dams, while McDaniel and O’Donnell [10] used IHA and hydrological model to evaluate the effects of two watersheds in southeastern U.S. caused by the urbanization. Other developed countries with early dam constructions such as the European countries, have also analyzed the effects of dams on rivers. Panagopoulos et al. [11] assess the present hydrologic stress of European rivers by using IHA and model integration. Warner [12] explored the environmental impacts of hydroelectric power and other human activities on the Durance channel in Southeast France and found that the flow diversion caused by a hydropower development has resulted in the shrinkage of the channel and reduction in habitat. Meißner et al. [13] compared the water temperature, discharge, and macroinvertebrate samples to determine a means of mitigating the negative impact of the hydrological alterations resulted from downstream dams in Germany, while Alfredsen [14] used IHA to assess the effect of ice on river flow in Norway. Yuichiro et al. [15] analyzed the impacts of dam operation on the water discharge and capture fisheries in the lower Mekong basin in Southeast Asia. Senay et al. [16] surveyed 25 rivers of six physiographic regions in Canada to compare different habitat properties between unregulated and regulated rivers.
China has more than half of the world’s dams including the Three Gorges Dam with abundant fishery resources [17], which necessitates the exploration of the degree to which dams can alter hydrological regimes in China. Dam constructions have developed rapidly after the 1950s, and now there are more than 90,000 dams. A subject of special significance is whether the reservoirs also influence aquatic ecosystems in China. Richter et al. [18,19,20] proposed 32 hydrological parameters as IHA indices and developed the Range of Variability Approach as threshold of IHA to characterize the comprehensive hydrological alteration, and adjusted IHA indices to 33 parameters later on. Black et al. [21] proposed the Dundee Hydrological Regime Alteration Method to evaluate hydrological alterations, while Shiau and Wu [22] developed an overall index (Do) to assess comprehensive alterations of rivers. Wang et al. [23] found that the Three Gorges project has substantial influences on the ecological regimes in the downstream of Yangtze River; the changes in flow have negative effects on migratory fish and greatly affect fish biodiversity. Yang et al. [24] used ecologically relevant hydrological indicators (ERHIs) to simplify the IHA indices, and Shu et al. [25] proposed eco-environmental water demand to develop a method for making ecosystems healthier by controlling dams. In addition, Vogel et al. [26] combined flow duration curves (FDCs) with ecodeficit and ecosurplus to analyze the relationships between dam construction and ecological flow regimes, which was applied in the Yangtze River the Yellow River recently [27,28,29]. The Pearl River, the second-largest and the third-longest river in China, is an important water resource for the Guangdong–Hong Kong–Marco Greater Bay Area [30]. Some previous studies have been conducted across the entire Pearl River system regarding changes in river flow and sediment load [31,32], and some have focused on the Dongjiang River, one of the primary tributary of the Pearl River [33,34,35].The Beijiang River is another primary tributary of the Pearl River and is known for its plenty fishery resources and high concentration of dams. Previous studies have shown that human activities, especially reservoir construction, have greatly impacted the Beijiang River [36,37]. However, most studies on hydrological alterations in the Beijiang River have not utilized more in-depth approaches to improve the redundant IHA indices, nor have they assessed the relationships between hydrological alterations and aquatic life and ecosystem. Considering the importance of variability and availability of water resources and the conservation of fluvial ecological health of the Beijiang River, there is an urgent need to use multiple hydrological indicators such as ecosurplus and ecodeficit as well as IHA to characterize the effects that dam constructions have on the river system. Moreover, for the purposes of ecologically relevant water resources management, the eco-environmental water demand should also be considered.
The objectives of this study were: (1) To quantitatively evaluate the degree of hydrological alteration in the Beijiang River using eco-flow metrics and IHA indices; (2) to specifically identify the current ecological risks faced in the Beijiang River; and (3) to calculate the eco-environmental water demand to help develop a more environmental friendly program for the operation of reservoirs.

2. Study Area and Data

2.1. Study Area

The Beijiang River (23°09′25″–25°21′47″ N; 112°49′13″–114°38′37″ E, Figure 1) is the second-largest tributary of the Pearl River in southeastern China, and is an important source for the Guangdong–Hong Kong–Marco Greater Bay Area. It is also known for its abundant fish resources. The upper reach of the Beijiang River contain the Wujiang River as the trunk stream, which originates in Hunan Province, and the Zhenjiang River is the most important tributary originating in Jiangxi Province. The two rivers provide much of the water supply to the upper reach of the Beijiang River. The average yearly runoff, drainage area, and length of the rivers are shown in Table 1 [38].
There are twelve major reservoirs along the Beijiang River. Each of them plays an important role in hydropower generation, water control, irrigation, shipping, and the ecological balance of the river system. The cascade reservoirs operate synergistically and have altered hydrology regimes through dam construction and operation [39]. The Feilaixia reservoir is the largest comprehensive reservoir in the Beijiang River and greatly affects the river basin since its operation [40]. The information associated with the reservoirs is shown in Table 1. Thus, there is a need for more research to be conducted on the Beijiang River as well as to develop a robust approach for solving the ecological problems of the river basin.

2.2. Data

We selected three representative hydrological stations in the Beijiang River to evaluate the relationship between reservoirs and the ecosystem: The Shijiao station, the Lishi station, and the Yangshao station, which control the Beijiang River, the Wujiang River, and the Zhenjiang River, respectively. The analysis of the river basins is based on the daily runoff at the time shown in Table 1. In addition, we used the annual rainfall from 1960 to 2018 to assess the relationship between rainfall and runoff. Hydrological data were acquired from the Guangdong Hydrological Bureau of China, and there were no missing data. The quality of data was strictly controlled before their release.
The dividing years of the three stations were primarily based on the timing of the completion of important reservoirs. The selection of these years was also based on the result of the MK test. We selected 1999 and 1993 as the dividing years for the Shijiao and Yangshao stations given that these years represent the times that construction of the Feilaixia hydraulic project and Jinjiang reservoir were completed, respectively. Because the construction of the Lechangxia hydraulic project began late, we selected the dividing year of the Lishi station based on the MK test results and the other important reservoirs on the Wujiang River. The year 1972 was selected because the Changhe, Xiniutan, and Muxi Reservoirs in the Wujiang River were built close to 1972; in addition, the results of the MK test revealed that there was a noticeable ecological change in 1972. The corresponding relationships of these three stations and other information are shown in Table 1.

3. Methodology

3.1. IHA Selection

IHA, which are widely applied in fluvial ecosystem researches, were initially developed in 1996 [18], revised in 1998 [20], and were divided into five groups (Table 2). Each group contains different hydrologic parameters that reflect different impacts on the ecosystem. The Range of Variability Approach boundary [19] is an auxiliary index of IHA expressed as a range between two percentages. The IHA indices were used to measure the extent of hydrological alterations. However, we only used 32 indicators in this study except for “the number of zero-flow days” because zero-flow conditions did not occur during the study period. Each indicator was related to the ecosystem [41]. We selected 25% and 75% as the default percentiles, instead of 33% and 67%, as the Range of Variability Approach boundary to make the revised percentiles fit those in the FDC. In addition, Zhang et al. [33] used principal component analysis to identify ERHIs from 32 indices defined in the IHA. These selected indicators are mostly hydrologic metrics but can reflect impact on ecology.

3.2. Hydrological Alterations

The degrees of hydrological alterations were calculated using the approach of Shiau and Wu [22]:
D i = N o , i N e N e × 100 %
where Di is the degree of hydrological alteration of the ith index, No,i is the number of years that the IHA values after reservoirs construction were between 25% and 75% of the ones before, and Ne is the presumptive number of years (Ne = P × NT, P is 50%, and NT is the sample size of runoff after reservoirs construction in years). According to Di, we calculated each hydrological indicator, and the overall degree of the IHA after construction was expressed as [22]:
D o = 1 32 i = 1 32 D i 2 .
Higher Do values imply that the ecological system of hydrological regimes experiences greater risks. Black et al. [21] proposed another hydrological alteration indicator, Dundee Hydrological Regime Alteration Method, to objectively evaluate the degree and range of hydrological regime alterations that human activities can cause. Each of the IHA indicators generates a percentage change of the mean and coefficient of variation (CV). By distributing equal weight to each IHA group in the Dundee Hydrological Regime Alteration Method, the mean values are found successively for all of the absolute changes in means and CVs of each class (Table 2), which contains five total indices for the average alterations of the groups (1a–5a) and five for CV alterations of groups (1b–5b). According to the hydrological change thresholds [21] and the mean percentage alterations in five groups for the means and CVs, each impact point is obtained for each index with three grades: Grade numbers indicate the number of impact points and represent the lower, middle, and upper thresholds. Therefore, for the total indices, the maximum number of points in theory of the total three pulse peak values is 30 points. Dundee Hydrological Regime Alteration Method, which is expressed by point scores, shows the integrated degree of change and is divided into five grades: The grade with the larger number denotes that there are heavier negative influences of the reservoirs on hydrological regimes. In this study, Do and Dundee Hydrological Regime Alteration Method were used to evaluate the degree and the negative effects of hydrological regime changes on ecosystems.

3.3. Ecosurplus and Ecodeficit

Vogel et al. [26] developed the ecosurplus and ecodeficit metrics for evaluating the river runoff ecosystem. The calculations of ecosurplus and ecodeficit are based on the FDC and show the percentage of time that the value exceeds the pre-defined one using daily runoff data. Daily runoff (Qi) was arranged in descending order to calculate the exceeding probability [26]:
p i = i n 1
where n is the total observed amount of daily runoff (Qi) and i is the rank of them. FDC is a function of the independent variable pi and the dependent variable Qi. In addition, the FDC is based on daily runoff data and can be used by the annual as well as seasonal FDC. Before analysis, the division or change point of the daily runoff series was selected and the period was subdivided into two subseries. The annual and seasonal FDC series, which were based on the daily runoff before the dividing point, had 25% and 75% percentiles as the threshold values for analysis. Two boundaries of the FDC were recognized as the critical interval for river ecological protection. According to the annual or seasonal FDC figure, the area in which the FDC exceeded the 75% percentile boundary was defined as ecosurplus, and the area below the 25% percentile was defined as the ecodeficit. The ecosurplus and ecodeficit have been used in fluvial ecosystem studies as eco-flow indicators [26].

3.4. Eco-Environmental Water Demand

The eco-environmental water demand [25], which can be estimated by the IHA data and Range of Variability Approach boundary, is used to determine the range of values indicative of healthy hydrological characteristics for controlling the water ecosystem by determining the rate of flow. The ecological flow month value, which indicates the minimum flow rate needed to maintain ecosystem balance, was expressed as:
S e c o = S a v e ( S u p S l o w )
where S a v e is the average of the monthly discharge, S u p is the upper percentile threshold, and S l o w is the lower percentile threshold. We selected the 75% percentiles for the threshold values as S u p and 25% as S l o w for the analysis.

4. Results

4.1. Ecological Variability

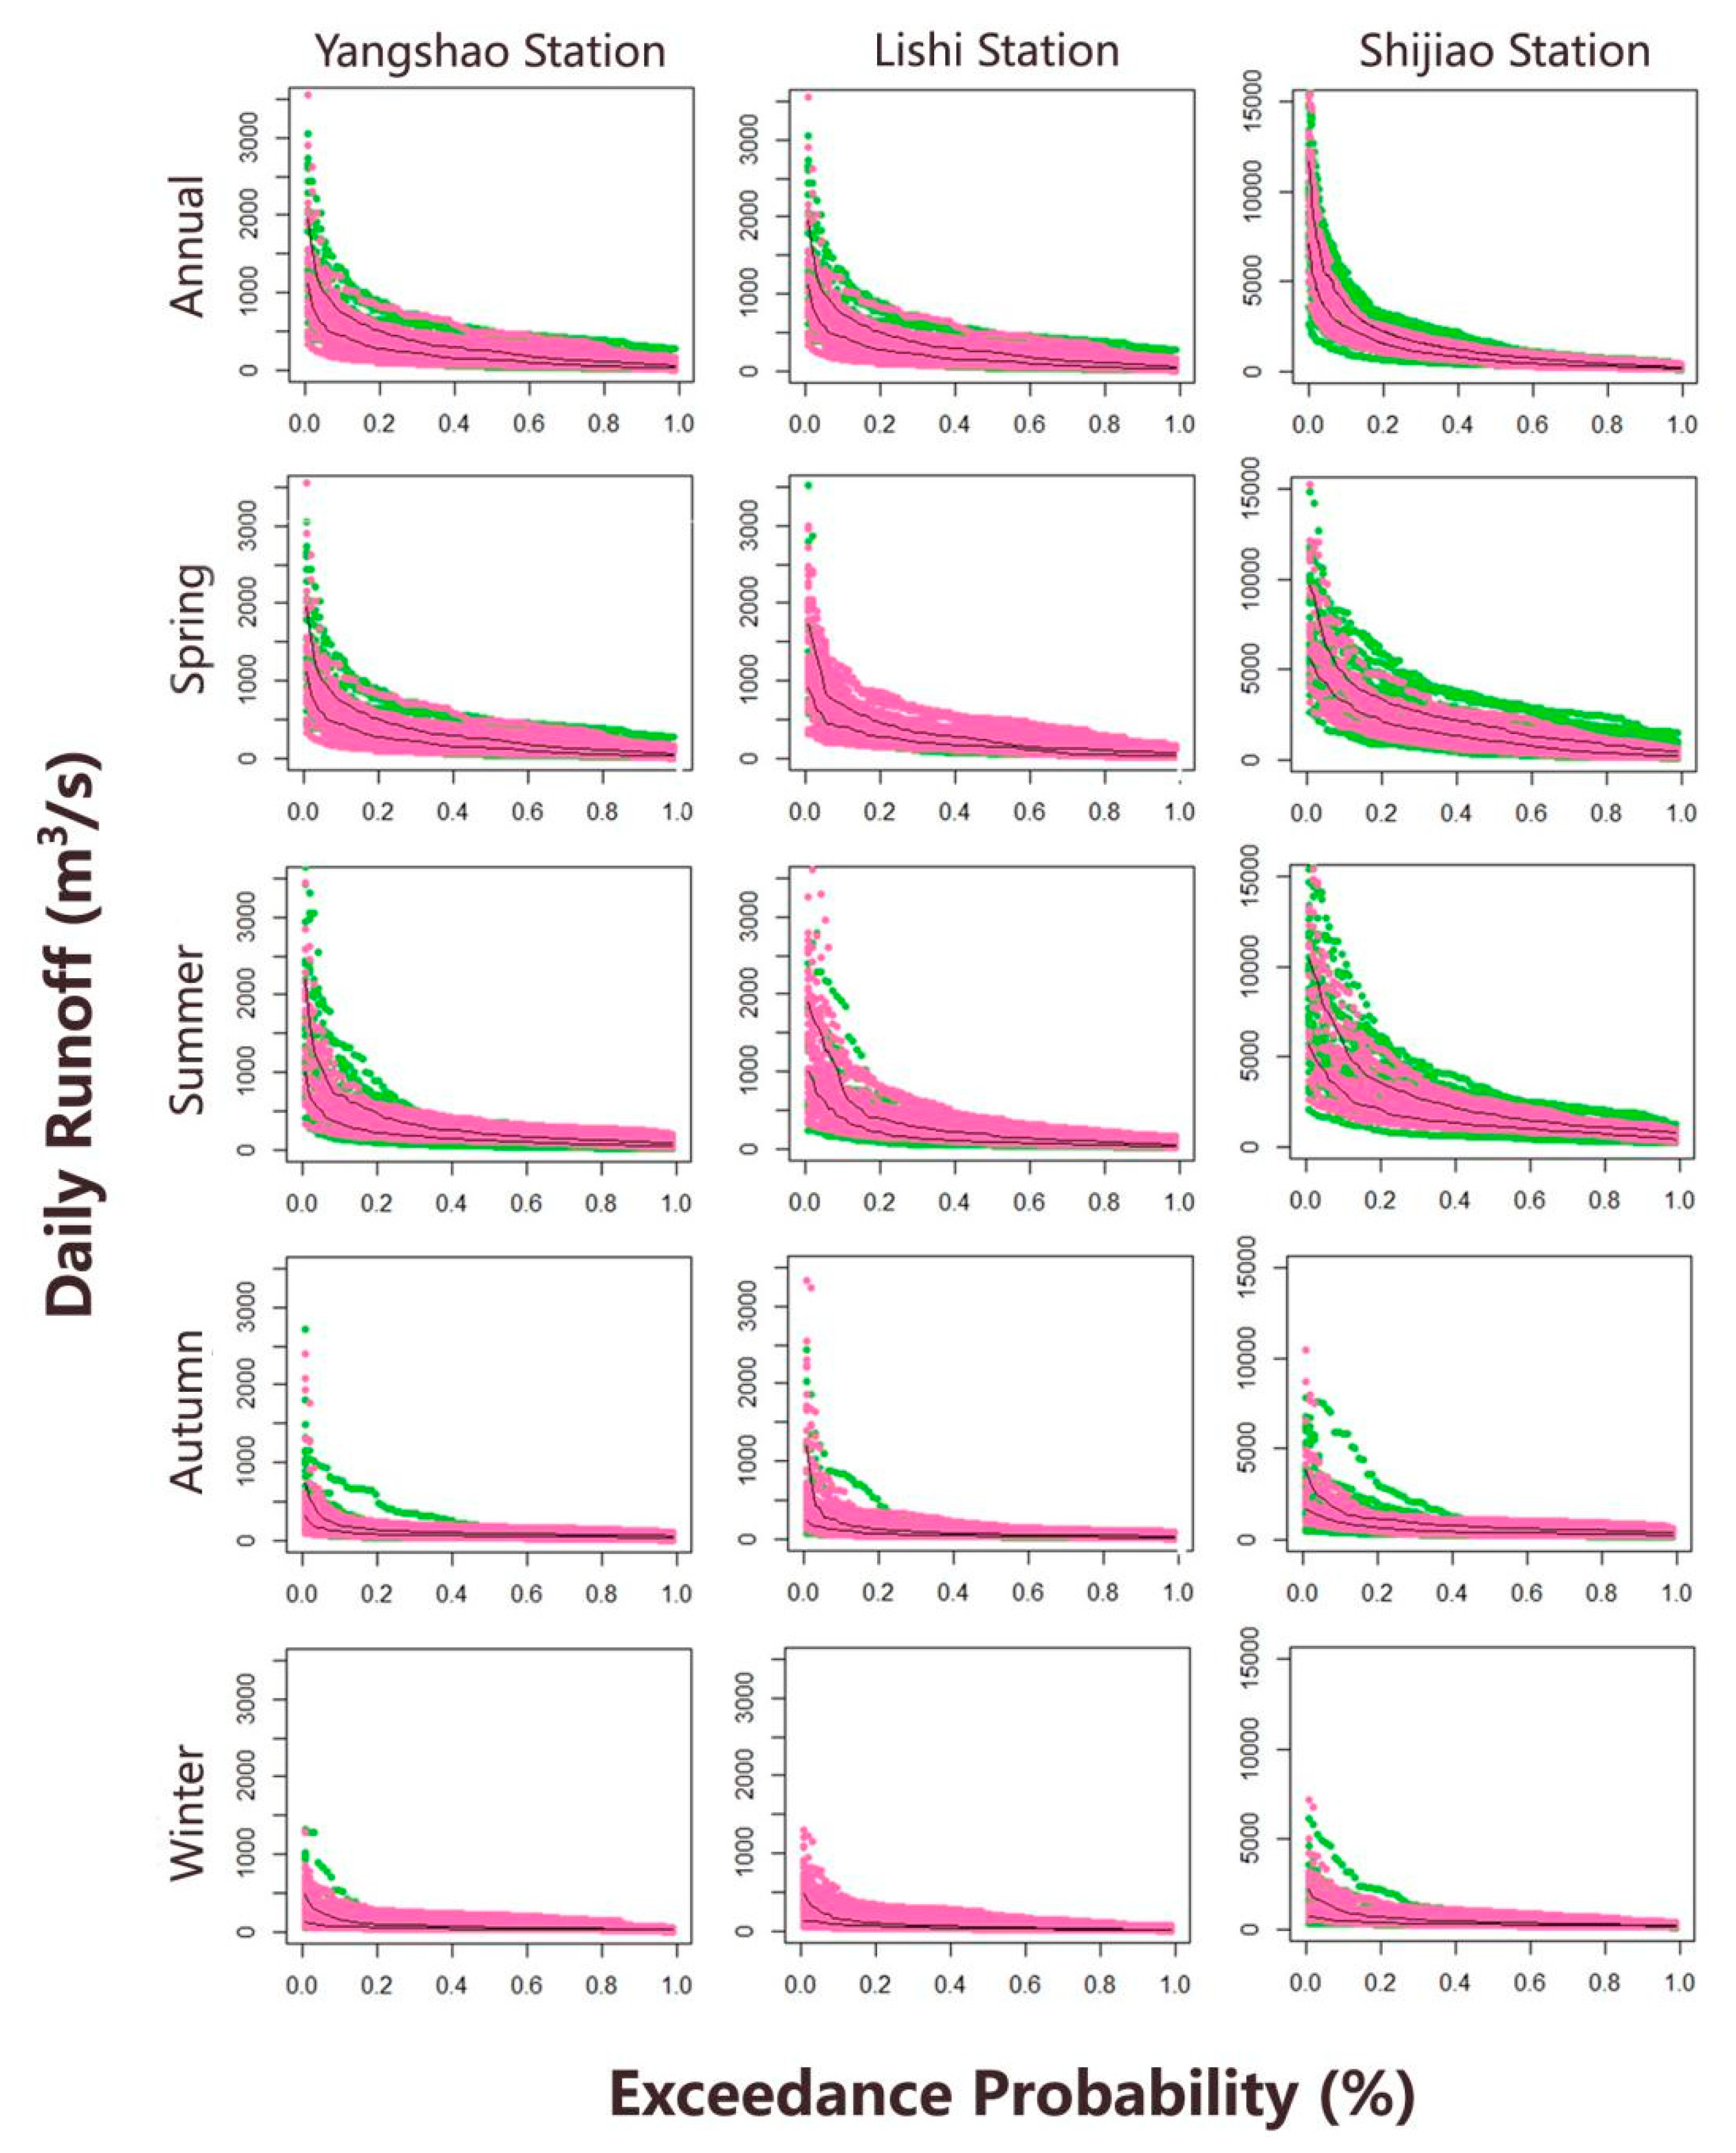
Water ecological regimes are affected by ecosurplus and ecodeficit through ecological variability. Figure 2 shows the annual and seasonal runoff to the reservoir construction by FDCs. Posterior runoff differed little between the high and low-flow regimes (Figure 2). Therefore, low flow contributed more to ecosurplus, while the high flow contributed more to ecodeficit, and this pattern was most obvious at Yangshao station and less obvious at Shijiao station, especially in the winter. The seasonal FDC figures showed that this pattern was less obvious in the winter (the dry season) and was more obvious in the spring and summer (the flood season). The dry season also contributed much higher degrees of ecosurplus than ecodeficit compared with the flood season.
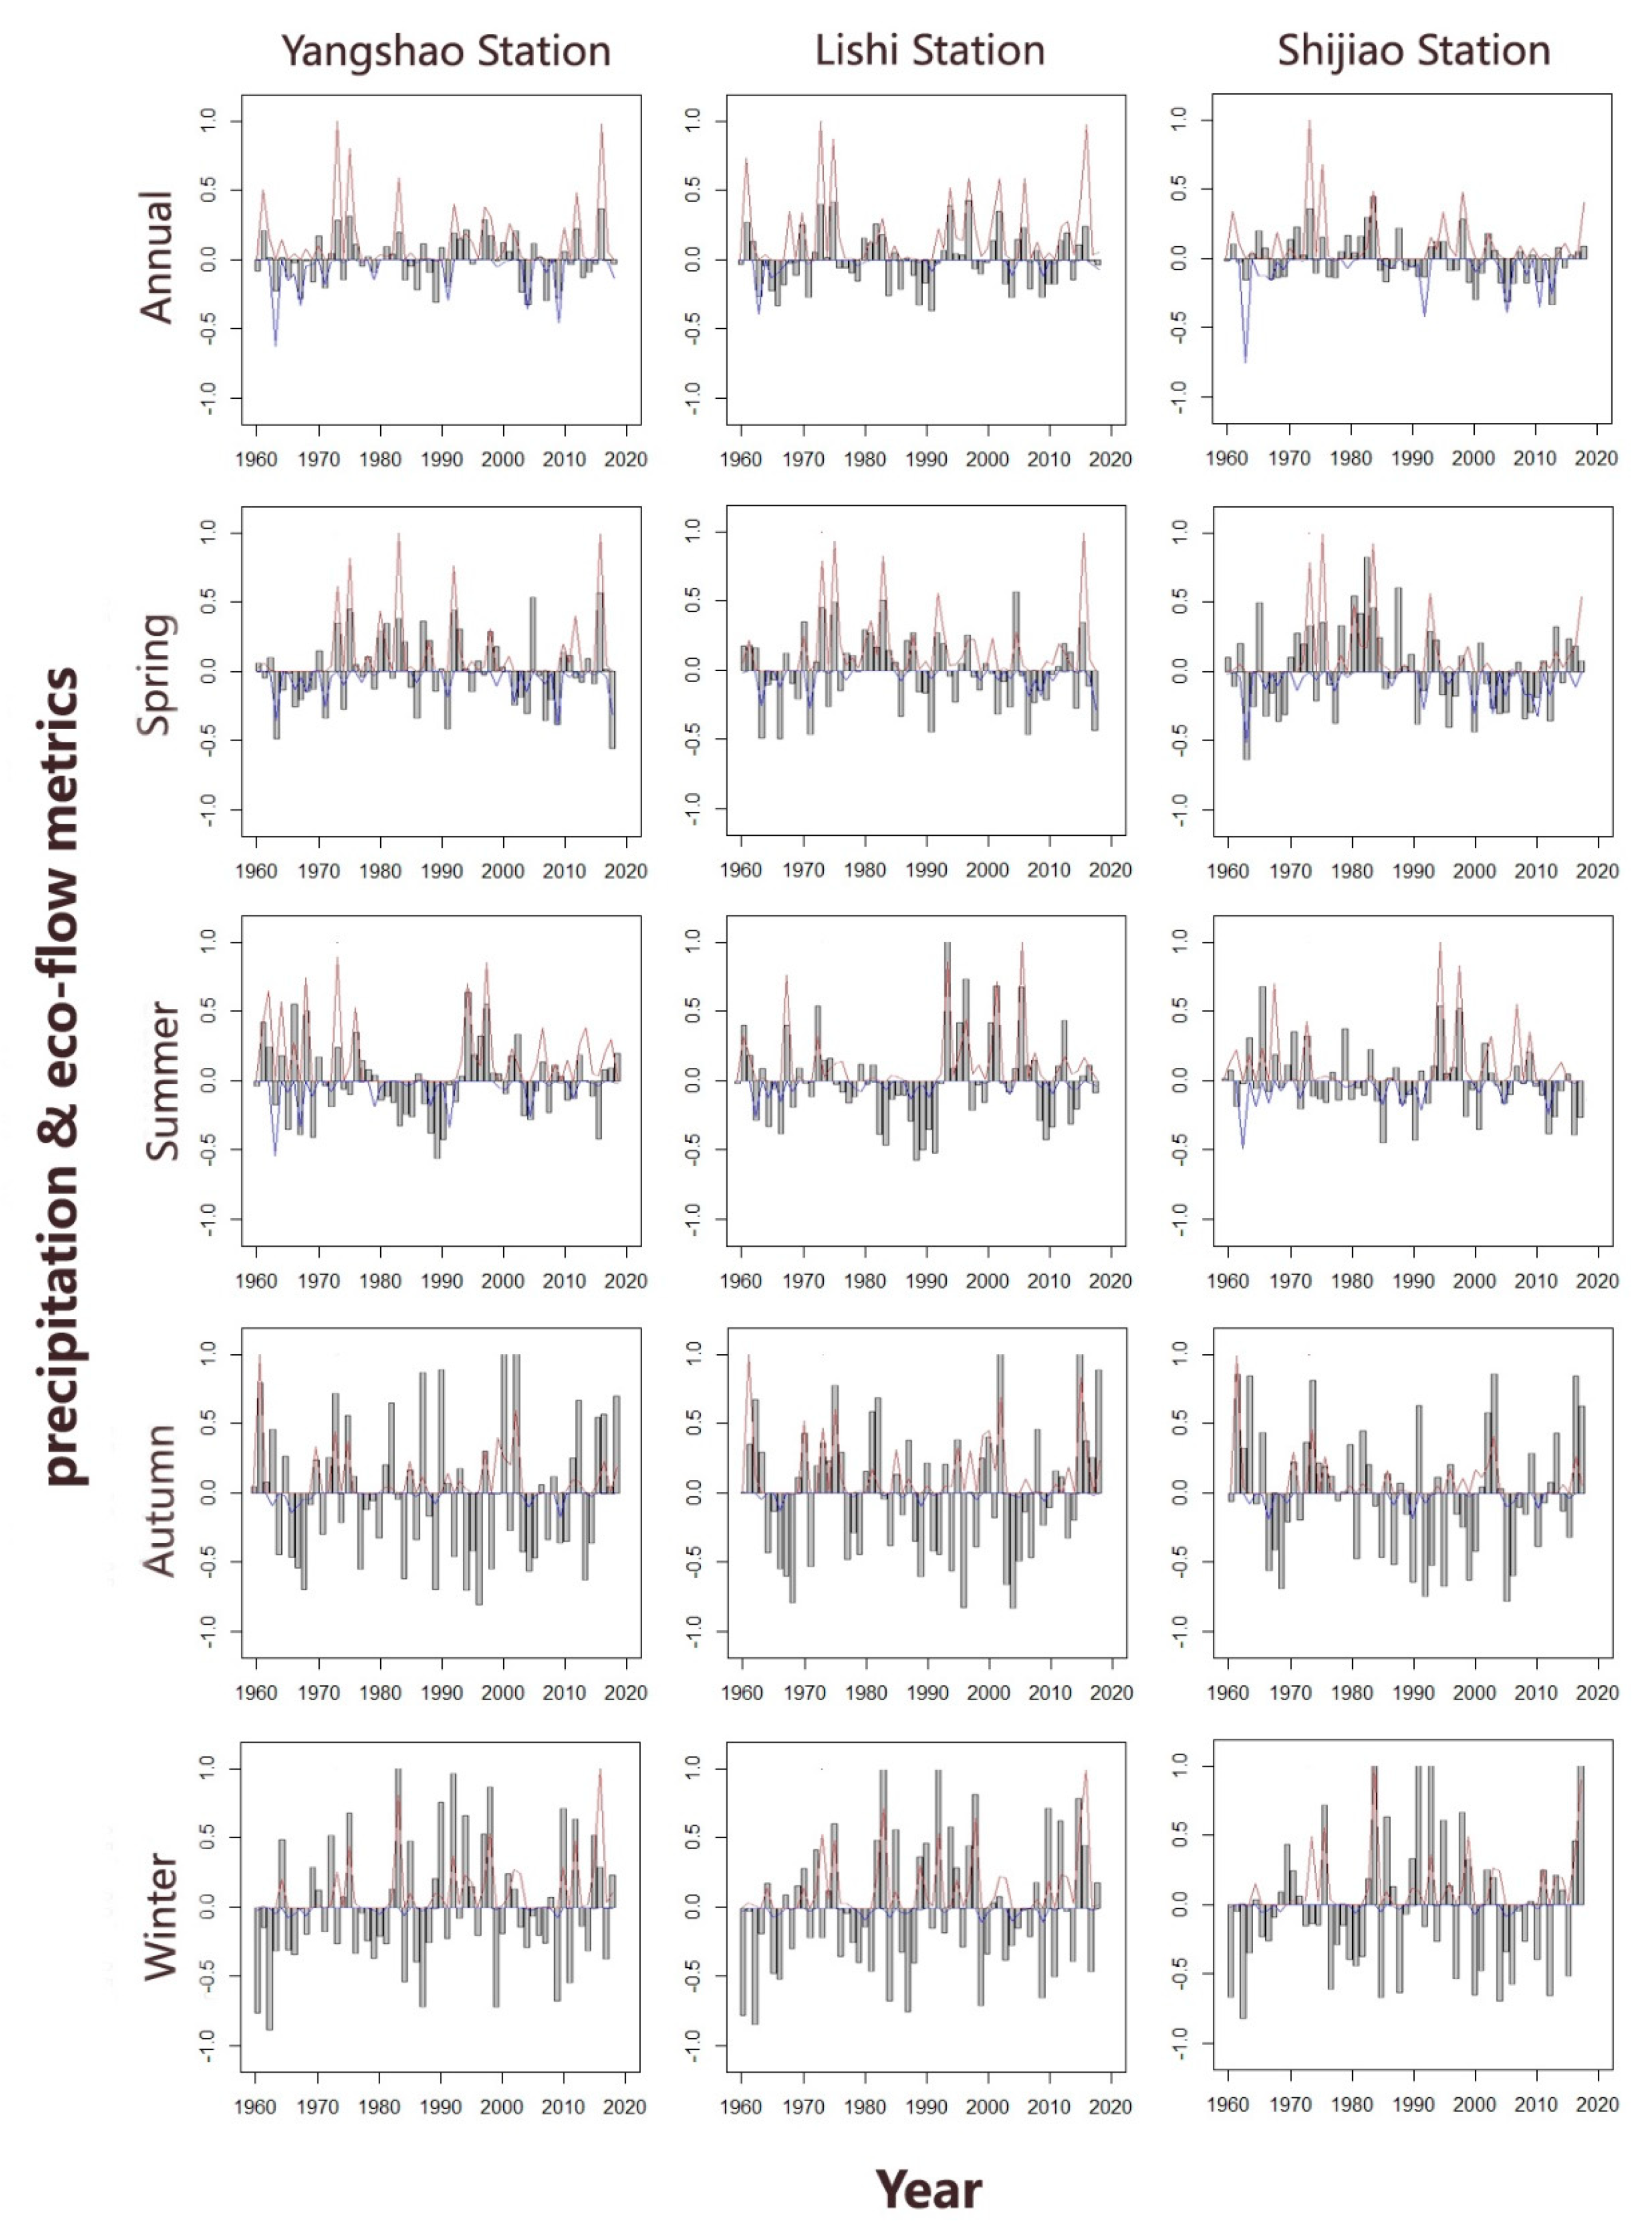
Figure 3 compares the precipitation between the ecosurplus and ecodeficit and shows that there was a positive correlation between them. The peaks of ecosurplus and ecodeficit usually did not coincide and happened alternately; in addition, the peak values of ecosurplus were much greater than those of ecodeficit. Ecosurplus and ecodeficit in the flood season had more peaks, and the maximum values of ecosurplus were greater than those of ecodeficit in the dry seasons compared with the flood seasons. The Shijiao station had fewer peaks and smaller peak values because of its more stable rainfall. The peak value of ecosurplus and ecodeficit in the Shijiao station decreased after the demarcation time. Although annual precipitation was more stable than seasonal precipitation, the seasonal ecosurplus and ecodeficit were less than the annual ecosurplus and ecodeficit, especially in the dry season. Thus, the ecological variability depends critically on both the amount and deviation in rainfall, which also means rainfall always leads to the hydrological uncertainty.
Figure 4 shows the ecosurplus and ecodeficit of the three stations during the ten-year circle in a box diagram, showing that the ecosurplus was greater than the ecodeficit. The Shijiao station had the least ecosurplus and the most ecodeficit of the three stations, and winter had the lowest ecosurplus of the four seasons. The amount of annual ecodeficit in the Shijiao station approached the ecosurplus after the dividing year, and the spring ecodeficit even exceeded the ecosurplus. The number of outliers slightly decreased after the dividing year overall, suggesting that the ecosurplus and ecodeficit stabilized after the construction of dams.
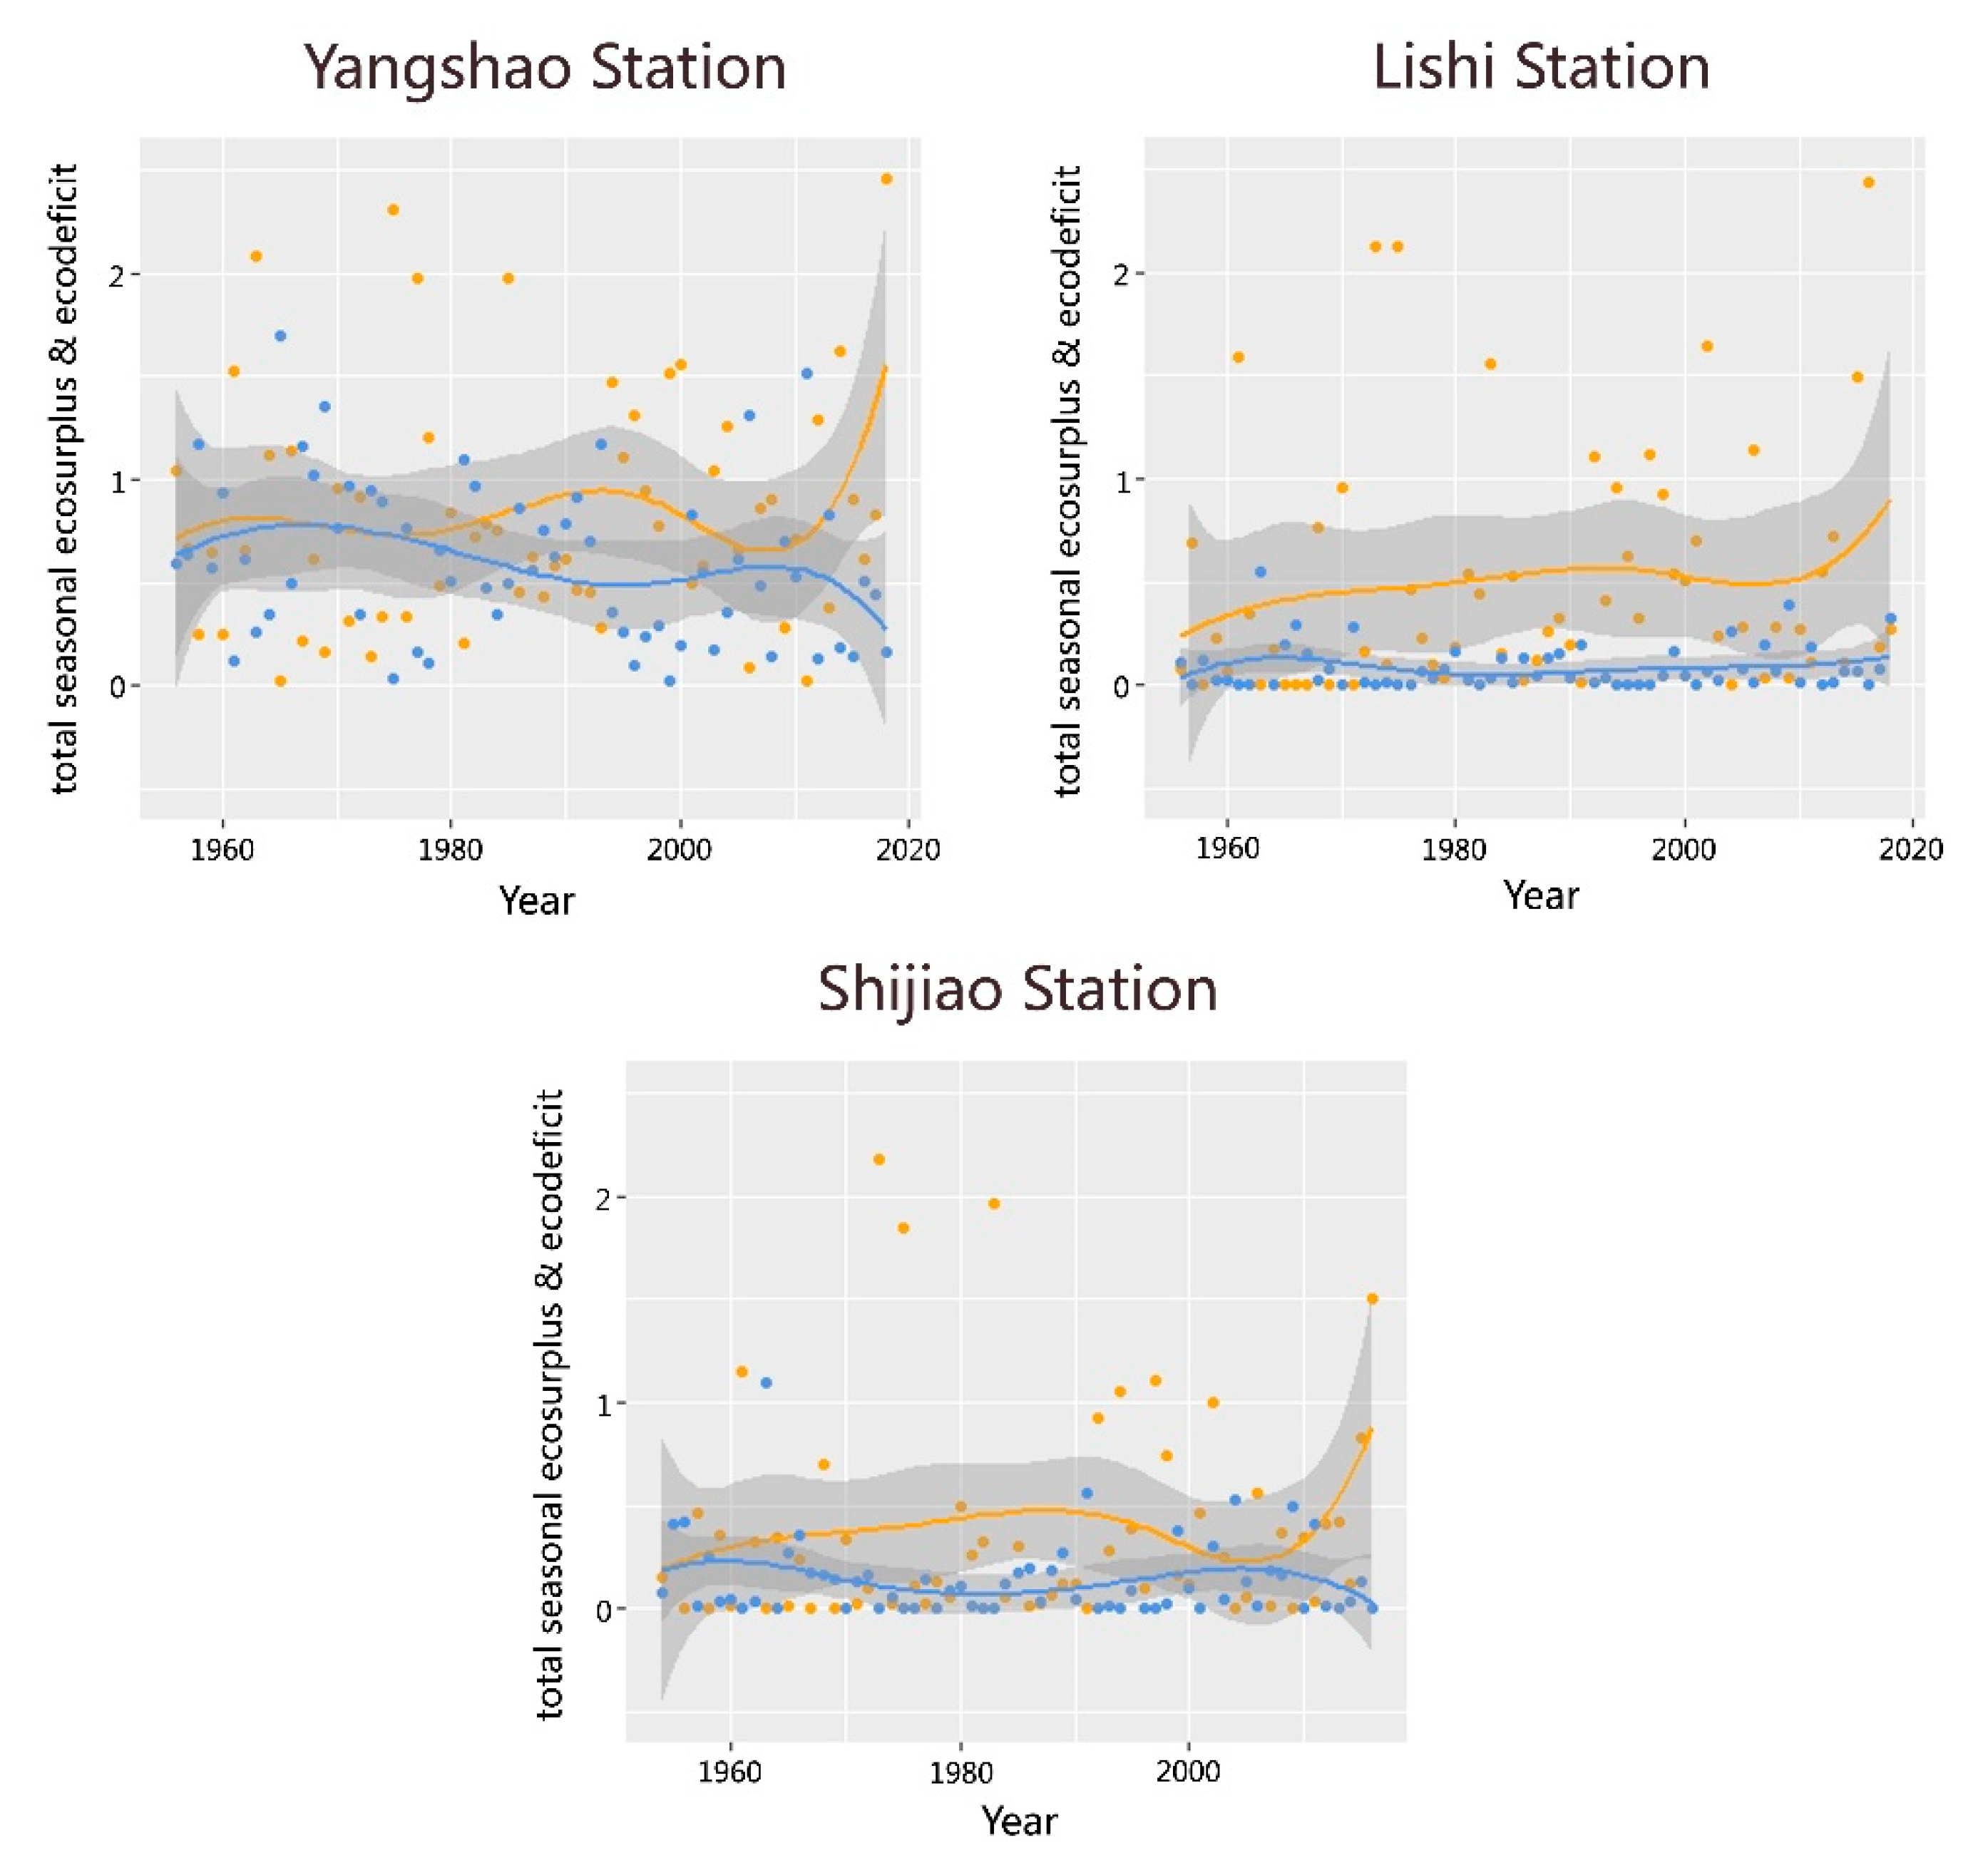
Figure 5 shows the total seasonal ecosurplus and ecodeficit with the 95% confidence intervals, which reflected alterations at the annual scale. The seasonal ecosurplus and ecodeficit of the three stations were also similar, and the ecosurplus showed an increasing trend, while the ecodeficit remained stable overall. However, after 1999, the ecosurplus and ecodeficit in the Shijiao station destabilized, suggesting that the construction of the Feilaixia Reservoir had a great impact on the trunk of the Beijiang River as well as the other two stations in the upper reaches.
The four figures revealed that, aside from the effects of the environment and climate change, the hydrological regimes had effects of their own after reservoir construction, which were most obvious in the Shijiao station, the hydrological observation station in the trunk of the Beijiang River. What is more, the large-scale reservoir construction will have an impact on the entire basin. As a result, more attention needs to be given to river health.

4.2. Analysis of IHA Indices

IHA indices are generally used to evaluate changes in hydrology. Table 3 shows the rates of change of all 32 IHA indices in each station. Indices tended to increase more than decrease. The rates of change were divided by 33% and 67% and classified into three groups: Low, moderate, and high-degree groups. The rates of decline of the Yangshao station and the Lishi station in months were all less than 10%, and there were more than three months that had rates of increase that were greater than 33%, which occurred in the moderate and high-degree groups. The negative and positive numerical values of the monthly rates of change at the Shijiao station were closer together compared with the other two stations. The months in the summer flood season and the winter dry season showed more incremental values than the other two seasons. Most of the indices of the maximum and minimum runoff showed small alterations in degree, except for the 30-day minimum in the Yangshao station and the Lishi station. The Yangshao station also showed greater decreases in maximum and minimum runoffs. Unexpectedly, the maximum indices in the Yangshao station all decreased. The base flow of the three stations remained almost unchanged, and the date of the minimum runoff in the Shijiao station showed a moderate degree of decrease. The low pulse and fall rate largely increased, and the duration of low pulse largely decreased, especially in the Yangshao and Shijiao stations. Moreover, the reversals showed high degrees of alterations in all three stations.
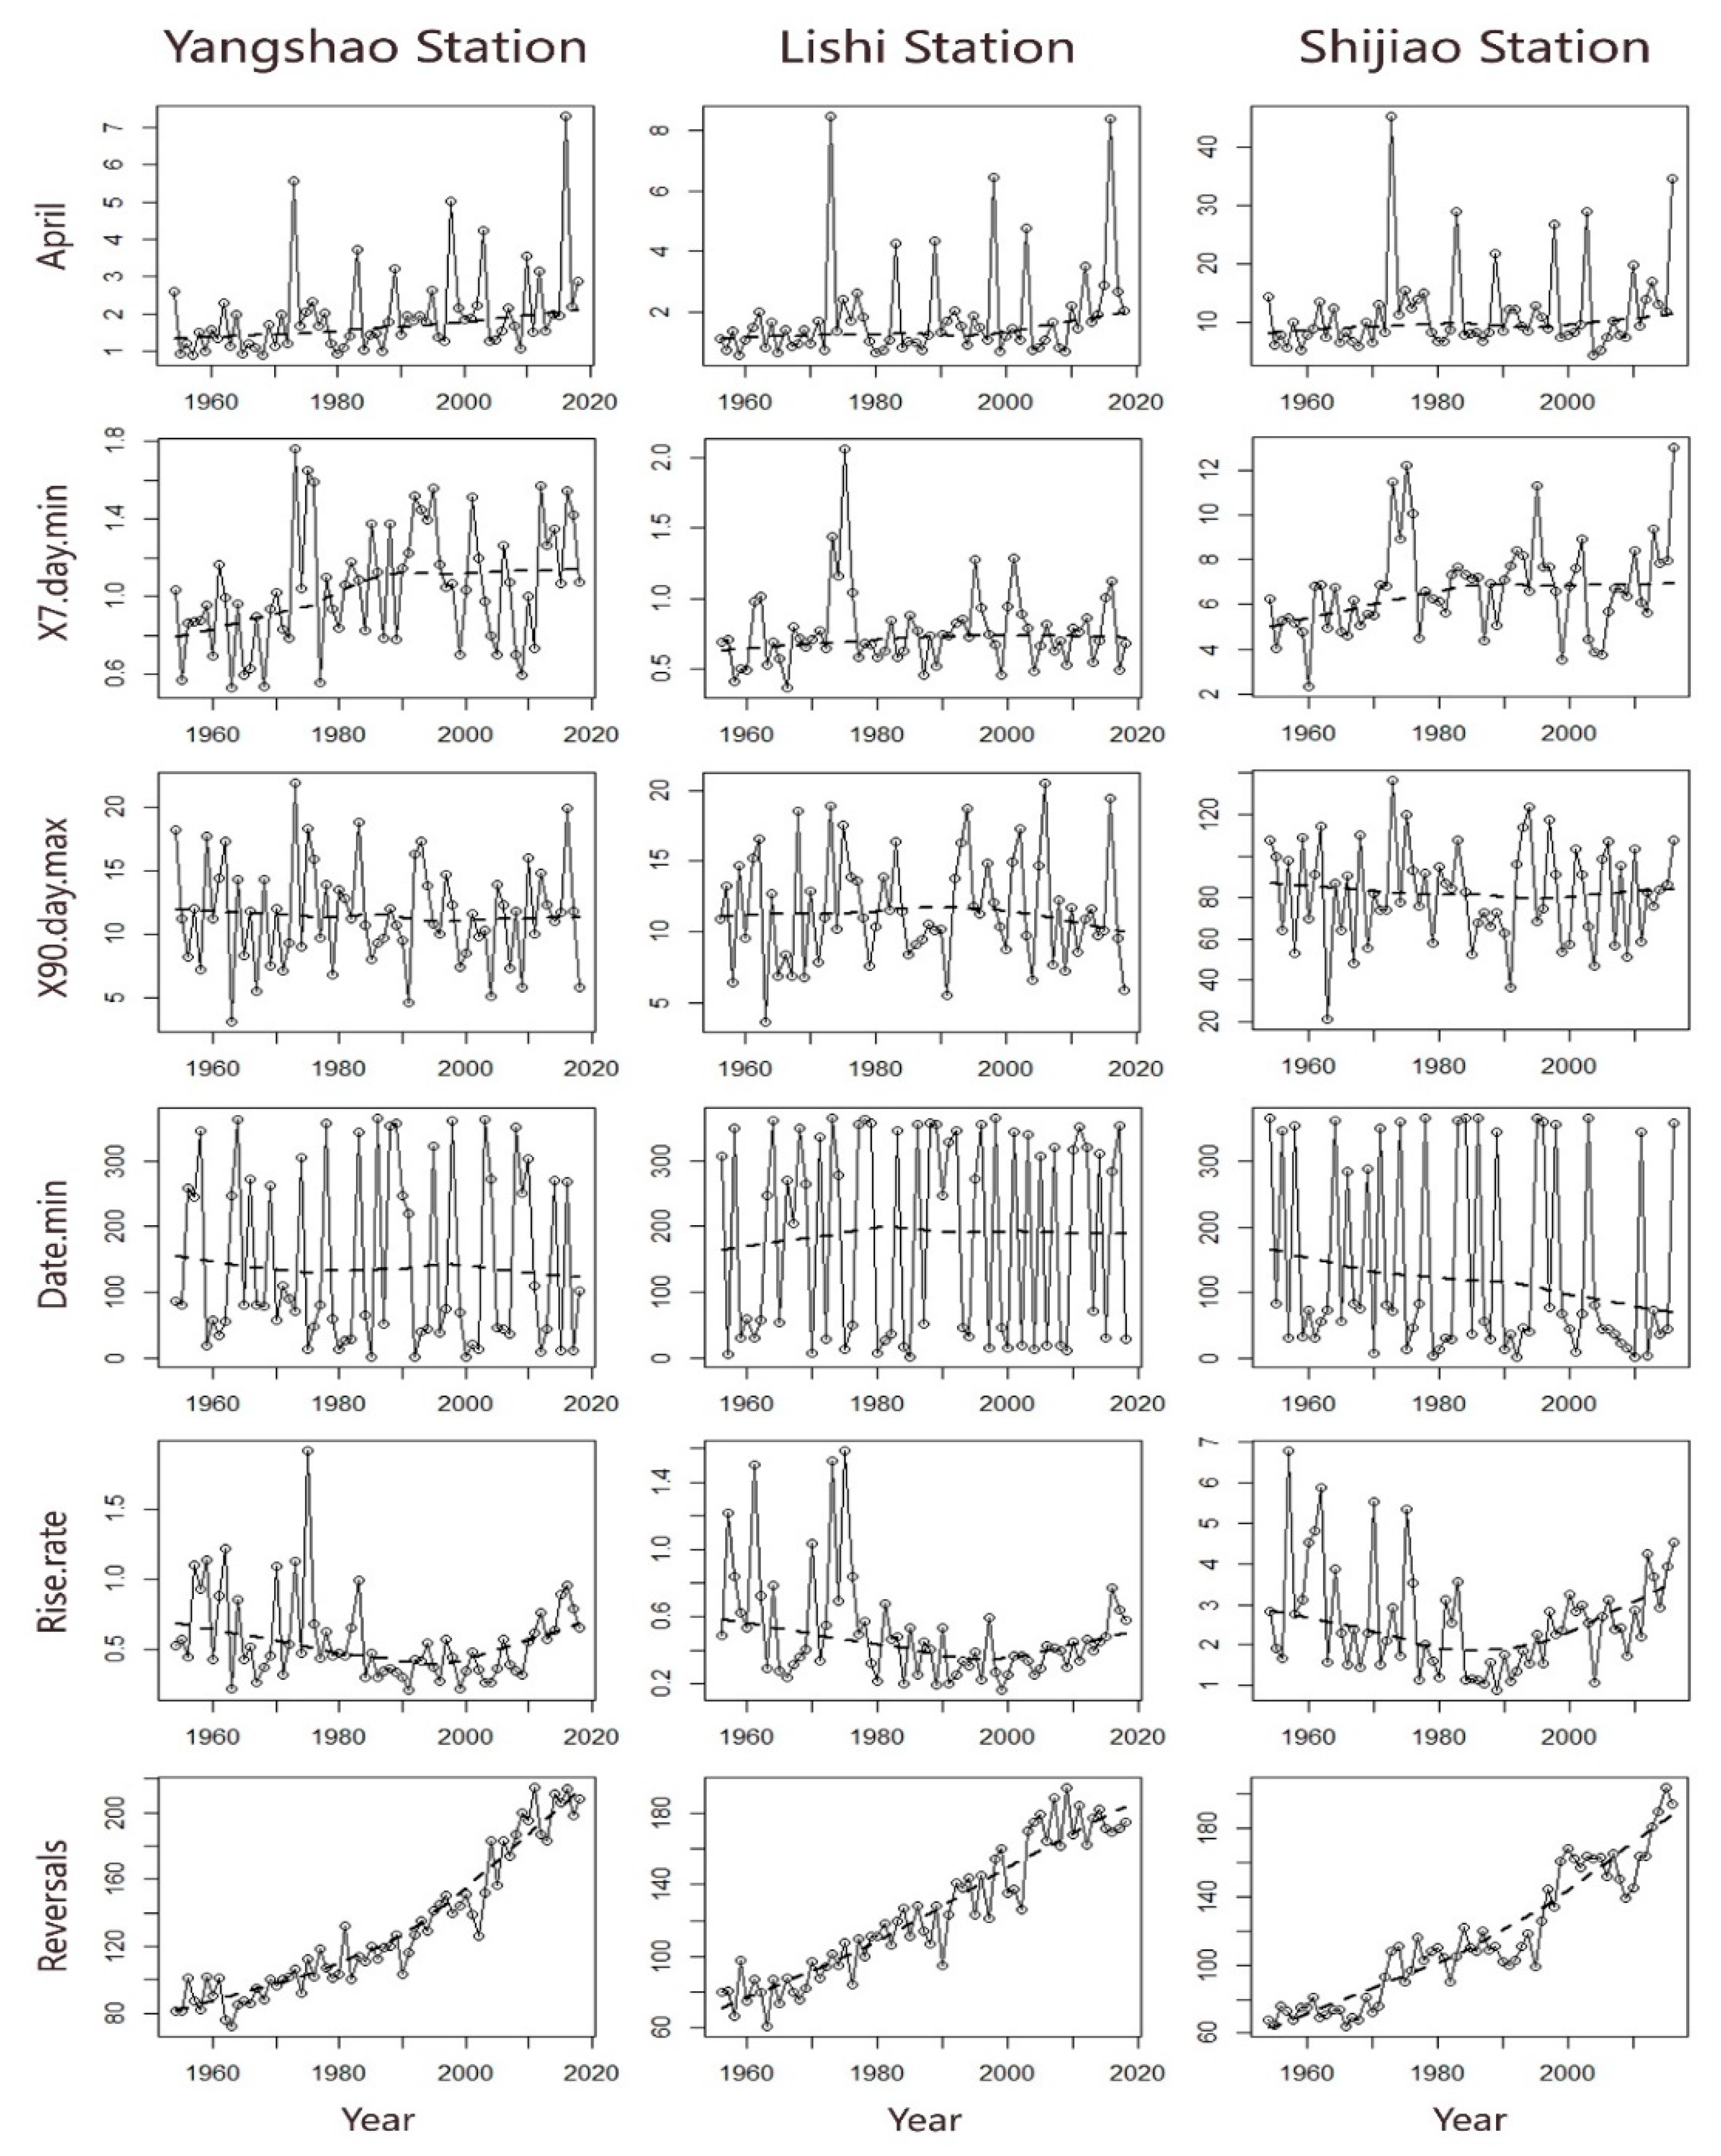
The IHA indices in the current study were so numerous that it is difficult to analyze and interpret them individually. ERHIs are also considered key metrics for fulfilling ecological hydrological requirements. There are many methods to analyze ERHIs, and we used principal component analysis. Table 4 shows the collection of IHA indices of each station after analysis by principal component analysis. Because some IHA indices, such as monthly indices, max runoff indices, and min runoff indices were highly correlated, we only selected indicators with the highest loadings between similar indices. Figure 6 shows the alterations of the ERHIs in the three stations. The runoff in April showed an overall upward trend, and some abnormal peaks could be observed for several years. The 7-day minimum runoff increased in the Yangshao and Shijiao stations, and only fluctuated in the Lishi station. In addition, there were drastic fluctuations in the 30-day maximum runoff during the study period.
The IHA indices were comprehensively analyzed by Do and Dundee Hydrological Regime Alteration Method (Table 5). The total scores of Dundee Hydrological Regime Alteration Method showed that the river basin, which is controlled by all the three stations, was in level 2, which is a low risk of impact, and the risk faced by the Shijiao station was greater than the other two stations. Based on the use of 33% and 67% as the boundaries of the three degrees, the Do of each of the three stations was around 33%, and all three Dos of the Lishi station were below 33%, although the other two stations had Do values over 33%. According to the analysis with Do, the Lishi station showed the lowest degree of change, and the Yangshao and Shijiao station showed moderate degrees of change. The results of the three stations were similar, which essentially represents the situation of the entire Beijiang River.

4.3. Eco-Environmental Water Demand

Table 6 lists the water demand and the monthly average runoff in the three stations. The Yangshao station demands the most water in April and the least water in March. The Lishi station demands the most water in April and the least water in December. The Shijiao station demands the most water in May and the least water in March. It is perhaps surprising that the water demand does not completely correspond with the flood season and the dry season. All of the three stations have their maximum and minimum water requirements in the spring. There are also some months of unusually high demand, such as March and June in the Yangshao station, January and June in the Lishi station, as well as March in the Shijiao station. Additional research is needed to understand this pattern more fully.

4.4. Comparison Between IHA-32 Indices and Eco-Flow Metrics

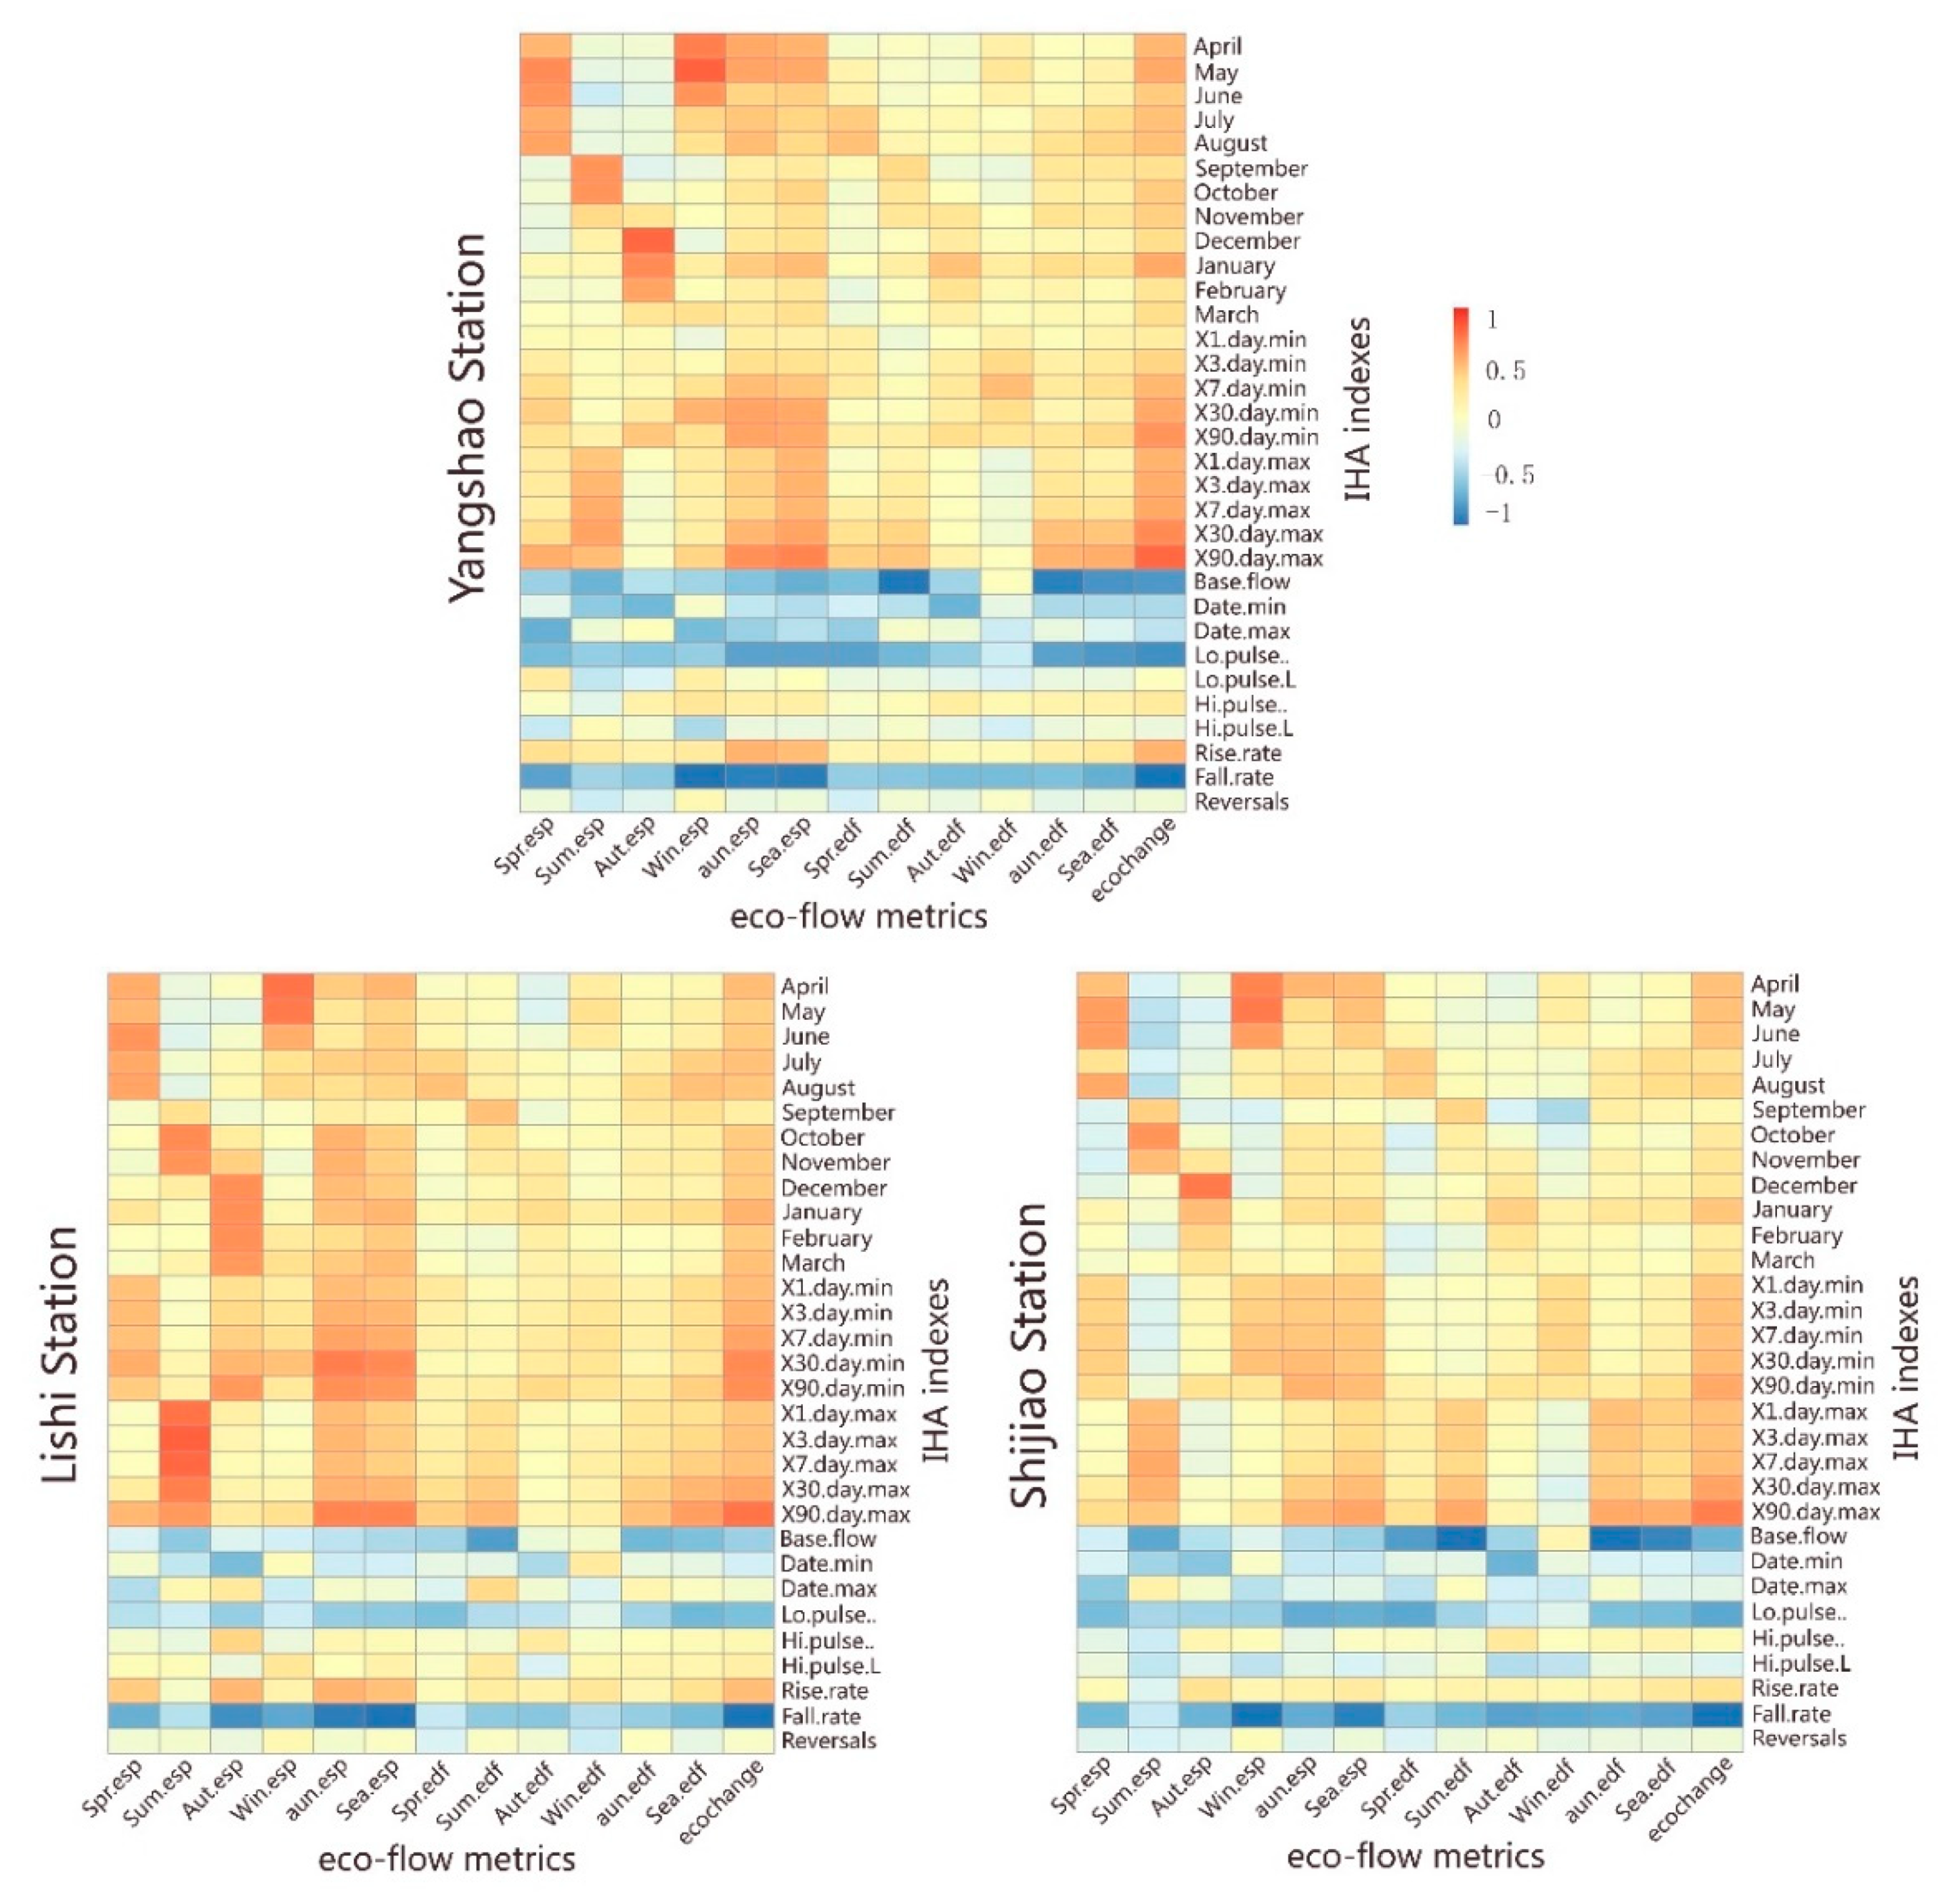
IHA-32 indices using is the popular way before to evaluate hydrological regimes, while eco-flow metrics are new indicators of evaluating which related to ecology. Figure 7 shows the relationship between IHA indices and stream flow indicators with a heat map, and Table 7 provides information on the eco-flow metrics used in Figure 7. Nearly all of the monthly, maximum, and minimum indices have strong positive correlation with eco-flow metrics, and the high pulse and rise rate were also positively connected with them. However, the base flow, low pulse, and fall rate were negatively connected with eco-flow metrics; while the reversals, the maximum and minimum date, as well as the duration of the high and low pulses, were mutually independent with eco-flow metrics. According to the analysis above, eco-flow metrics can capture the primary features of most of the IHA indices, which can provide a good representation without redundant indexes. The combination of IHA indicators and eco-flow metrics can be a powerful way to measure the degree of hydrological alteration and protect the river ecosystems by guiding reservoir operations [29,42].

5. Discussion and Conclusions

In this study, we used multiple indicators to evaluate changes in IHA indices as well as the ecosurplus and ecodeficit in the Beijiang River, China with daily runoff data from the 1950s to 2010s. We found that dam constructions stabilize hydrological regimes, which also results in reductions in the peak and that the valley increases with reservoir construction. The Do and Dundee Hydrological Regime Alteration Method, which represent the degree of river changes, showed that the three stations had low risks of experiencing impacts. The Lishi station had the lowest degree of change, while the other two stations exhibited moderate changes. The precipitation has great connection to the hydrological uncertainty, which is also found in the whole Pearl River [43]. The important role of human activities in aquatic ecosystems has also been studied in the Yangtze River, the Yellow River, and the Pearl River. Research in the Yangtze River has revealed that the ecodeficit in high flows and ecosurplus in low flows increase drastically as more reservoirs are exploited [44]. In the Yellow River, the incidence of the high and low-flow regimes is decreasing, and the ecological risks faced by the Yellow River have become increasingly series from the upper to the lower reaches [27]. Zhang et al. [33] found that dam constructions decrease the high flow and increase the low flow and that ecosurplus is affected by rainfall, while the ecodeficit is affected more by dams. Dam construction also causes moderate alteration as well as declines in ecological diversity, which has a negative influence on all life. Unlike the aforementioned watersheds, the high-flow reduction and the low-flow increase of the Beijiang River were lower than those reported for other watersheds; thus, its degree of risk and damage was weaker than that of other aforementioned river basins. In addition, the ecosurplus and the ecodeficit of the Beijiang River are positively correlated with rainfall. The hydrological impact caused by reservoir construction was weaker than that of the other three river basins. The quantitative analysis we conducted provides some suggestions for what might be suitable for the Beijiang River.
Our study revealed meaningful results and special outcomes. First, the construction of the Feilaixia reservoir had a great effect on the hydrological regime in the Beijiang River. Indeed, the construction of Feilaixia reservoir also influences the ecosystem of the river basin to a large extent. In addition, the Shijiao station had some differences compared with the other two stations in the upper reaches. The Shijiao station has more ecodeficit and less ecosurplus as well as more flow reduction. The Shijiao station had the most runoff of the three stations and thus requires more attention, especially when the hydrological regimes are out of balance. The Feilaixia reservoir plays an important role in the Beijiang River and has a great impact on the ecosystem in the Beijiang River basin, which has also been mentioned in previous studies [39,40]. Otherwise, the hydrological regimes of the three stations were largely similar, especially after the construction of reservoirs. We also observed that different parts of the river basin can affect each other and that reservoir construction can strengthen the connections. The results demonstrate a superposition effect of the reservoirs similar to that observed by Ge et al. [37].
One of the unexpected findings of this study was that the monthly runoff of the Yangshao station decreased more than the other stations. Other anthropogenic factors might have contributed to decreases in runoff; however, additional research is required to test this possibility. It was also unexpected that the recent total seasonal ecosurplus showed signs of an increase. Han [45] found that the Shijiao station experienced a complete cycle of change in abundance, flatness, and dryness, while Wu et al. [31] and Zhou et al. [32] also observed periodicity in the runoff of the Beijiang River. Wu and Huang [46] found that large-scale soil and water conservation measures implemented around 1990 reduced the peak flows, and Li et al. [47] found that the excess metal fluxes in the Beijiang River increased rapidly from 1988 to 1998 but decreased gradually after 1999 because of government intervention. These may have contributed to explaining the above findings. Identifying the reasons underlying why total seasonal ecosurplus increases is important for improving the environment in the Beijiang River.
The outcome of the present study indicates that reservoir construction can have strong influences on ecosystems. Although the risks of the three stations in the Beijiang River of the study were less compared with the Yangtze River, the Yellow River, and the Dongjiang River, the hydrological changes caused by anthropogenic activities observed in the study need to be taken seriously [27,33,44]. The Beijiang River basin had less risk, which makes it easier to restore the normal operation of the ecosystem. However, this basin will certainly be destroyed without appropriate protection measures based on the trends observed in the study. Wu et al. [31] showed that the peak flow of the entire Pearl River increased, but the upward trend in average flow was not obvious, which indicates that the risk of flooding may increase. Therefore, future work should examine water demand to make the water ecosystem in the Beijiang River as well as the entire Pearl River healthier.
The current study in the Beijiang River provides a framework for future studies, and the results are also consistent with those from other water basins. First, the construction of dams has indeed caused river basin risks, which should be more thoroughly considered. Moreover, the combination of the eco-flow metrics and the IHA indices is an effective way to evaluate the water regimes. In addition, the water demand calculation provides an effective way for making the water ecosystem healthier by controlling the reservoirs. Overall, our findings are conducive to guide the hydrological operation in the basin to make the ecosystem healthier and can also provide a reference for other basins where hydrological alterations driven by anthropogenic activities are observable.
It should be noted that many of studies have only used IHA and Range of Variability Approach for analyses of river ecology [48,49,50,51]. The current study represents an improvement of previous research by combining IHA indices with eco-flow metrics (ecosurplus and ecodeficit), which enhances the quantitative nature of the evaluation. Comparing with using genetic programming to select the ERHIs [24], the principal component analysis can consider all of the IHA indices, which is more rounded compared with the genetic programming. In addition, Ma and Su [52] used half of the difference value as the monthly water demand, and the method in this study focused more on the average runoff, which can reduce the effect of atypical conditions in Range of Variability Approach boundaries as well as obviate the direct effect from the prior data. Overall, through the analyses we believe that the use of combination of IHA indices, ecosurplus and ecodeficit as well as the eco-environmental water demand is a feasible way to reflect ecology conditions. Certainly, if conditions allowed (e.g., availability of water quality or other ecology-related data), future works should be conducted to have a closer look at the ecology and biodiversity in the Beijiang River basin.

Author Contributions

J.D. wrote the original draft. X.W. and Z.W. provided supervision and directed the study. J.L. designed figures and tables. X.C. provided data curation and interpretation. All authors have read and agreed to the published version of the manuscript.

Funding

This research was financially supported by the National Natural Science Foundation of China (51879107, 51709117), China Postdoctoral Science Foundation (2019M662919), the Water Resource Science and Technology Innovation Program of Guangdong Province (2020-29), and the Guangdong Basic and Applied Basic Research Foundation (2019A1515111144).

Acknowledgments

The authors wish to express their gratitude to all authors of the numerous technical reports used for this paper.

Conflicts of Interest

The authors declare no conflict of interest.

References

  1. Vörösmarty, C.J.; Green, P.; Salisbury, J.; Lammers, R.B. Global water resources: Vulnerability from climate change and population growth. Science 2000, 289, 284–288. [Google Scholar] [CrossRef] [PubMed] [Green Version]
  2. Li, J.; Wang, Z.; Lai, C. Severe drought events inducing large decrease of net primary productivity in mainland China during 1982–2015. Sci. Total Environ. 2019. [Google Scholar] [CrossRef]
  3. Li, J.; Wang, Z.; Lai, C.; Wu, X.; Zeng, Z.; Chen, X.; Lian, Y. Response of net primary production to land use and land cover change in mainland China since the late 1980s. Sci. Total Environ. 2018, 639, 237–247. [Google Scholar] [CrossRef]
  4. Wu, X.; Guo, S.; Yin, J.; Yang, G.; Zhong, Y.; Liu, D. On the event-based extreme precipitation across China: Time distribution patterns, trends, and return levels. J. Hydrol. 2018, 562, 305–317. [Google Scholar] [CrossRef]
  5. Li, J.; Wang, Z.; Wu, X.; Xu, C.; Guo, S.; Chen, X. Toward monitoring short-term droughts using a novel daily scale, standardized antecedent precipitation evapotranspiration index. J. Hydrometeorol. 2020, 21, 891–908. [Google Scholar] [CrossRef]
  6. Nilsson, C.; Reidy, C.A.; Dynesius, M.; Revenga, C. Fragmentation and flow regulation of the world’s large river systems. Science 2005, 308, 405–408. [Google Scholar] [CrossRef] [Green Version]
  7. Schwarzenbach, R.P.; Egli, T.; Hofstetter, T.B.; Gunten, U.; Wehrli, B. Global water pollution and human health. Annu. Rev. Environ. Resour. 2010, 35, 109–136. [Google Scholar] [CrossRef]
  8. Lian, Y.; You, J.; Sparks, R.; Demissie, M. Impact of human activities to hydrologic alterations on the Illinois River. J. Hydrol. Eng. 2012, 17, 537–546. [Google Scholar] [CrossRef] [Green Version]
  9. McManamay, R.A. Quantifying and generalizing hydrologic responses to dam regulation using a statistical modeling approach. J. Hydrol. 2014, 519, 1278–1296. [Google Scholar] [CrossRef] [Green Version]
  10. McDaniel, R.D.; O’Donnell, F.C. Assessment of hydrologic alteration metrics for detecting urbanization impacts. Water 2019, 11, 1017. [Google Scholar] [CrossRef] [Green Version]
  11. Panagopoulos, Y.; Stefanidis, K.; Sanchez, M.F.; Weiland, F.S.; Beek, R.V.; Venohr, M.; Globevnik, L.; Mimikou, M.; Birk, S. Pan-European calculation of hydrologic stress metrics in rivers: A first assessment with potential connections to ecological status. Water 2019, 11, 703. [Google Scholar] [CrossRef] [Green Version]
  12. Warner, R.F. Environmental impacts of hydroelectric power and other anthropogenic developments on the hydromorphology and ecology of the Durance channel and the Etang de Berre, southeast France. J. Environ. Manag. 2012, 104, 35–50. [Google Scholar] [CrossRef] [PubMed]
  13. Meißner, T.; Schutt, M.; Sures, B.; Feld, C.K. Riverine regime shifts through reservoir dams reveal options for ecological management. Ecol. Appl. 2018, 28, 1897–1908. [Google Scholar] [CrossRef]
  14. Alfredsen, K. An assessment of ice effects on indices for hydrological alteration in flow regimes. Water 2017, 9, 914. [Google Scholar] [CrossRef] [Green Version]
  15. Yoshida, Y.; Lee, H.S.; Trung, B.H.; Tran, H.; Lall, M.K.; Kakar, K.; Xuan, T.D. Impacts of mainstream hydropower dams on fisheries and agriculture in lower Mekong Basin. Sustainability 2020, 12, 2408. [Google Scholar] [CrossRef] [Green Version]
  16. Senay, C.; Taranu, Z.E.; Bourque, G.; Macnaughton, C.J.; Lanthier, G.; Harvey-Lavoie, S.; Boisclair, D. Effects of river scale flow regimes and local scale habitat properties on fish community attributes. Aquat. Sci. 2017, 79, 13–26. [Google Scholar] [CrossRef]
  17. Revenga, C.; Brunner, J.; Henninger, N.; Kassem, K.; Payne, R. Pilot Analysis of Global Ecosystems; World Resources Institute: Washington, DC, USA, 2008; pp. 1–69. [Google Scholar]
  18. Richter, B.D.; Baumgartner, J.V.; Powell, J.; Braun, D.P. A method for assessing hydrologic alteration within ecosystems. Conserv. Biol. 1996, 10, 1163–1174. [Google Scholar] [CrossRef] [Green Version]
  19. Richter, B.D.; Baumgartner, J.V.; Wigington, R.; Braun, D.P. How much water does a river need? Freshw. Biol. 1997, 37, 231–249. [Google Scholar] [CrossRef] [Green Version]
  20. Richter, B.D.; Baumgartner, J.V.; Braun, D.P.; Powell, J. A spatial assessment of hydrologic alteration within a river network. Regul. Rivers Res. Manag. 1998, 14, 329–340. [Google Scholar] [CrossRef]
  21. Black, A.R.; Rowan, J.S.; Duck, R.W.; Bragg, O.M.; Clelland, B.E. DHRAM: A method for classifying river flow regime alterations for the EC Water Framework Directive. Aquat. Conserv. 2005, 15, 427–446. [Google Scholar] [CrossRef]
  22. Shiau, J.; Wu, F. Compromise programming methodology for determining instream flow under multiobjective water allocation criteria. J. Am. Water Resour. Assoc. 2006, 42, 1179–1191. [Google Scholar] [CrossRef]
  23. Wang, Y.; Wang, D.; Rhoads, B.L. Assessment of the flow regime alterations in the middle reach of the Yangtze River associated with dam construction: Potential ecological implications. Hydrol. Process. 2016, 30, 3949–3966. [Google Scholar] [CrossRef]
  24. Yang, Y.E.; Cai, X.M.; Herricks, E.E. Identification of hydrologic indicatorsrelated to fish diversity and abundance-A data mining approach for fishcommunity analysis. Water Resour. Res. 2008, 44, W04412. [Google Scholar] [CrossRef]
  25. Shu, C.; Liu, S.; Mo, X.; Zheng, C.; Zhang, S.; Qiu, J. Estimation of river ecological flow based on Range of Variability Approach (RVA). Ecol. Environ. Sci. 2010, 19, 1151–1155. (In Chinese) [Google Scholar]
  26. Vogel, R.M.; Sieber, J.; Archfield, S.A.; Smith, M.P.; Apse, C.D.; Huber-Lee, A. Relations among storage, yield, and instream flow. Water Resour. Res. 2007, 43, W05403. [Google Scholar] [CrossRef]
  27. Zhang, H.; Zhang, Q.; Singh, V.P.; Gu, L. Variation in ecological flow regimes and their response to dams in the upper Yellow River basin. Environ. Earth Sci. 2016, 75, 938. [Google Scholar] [CrossRef]
  28. Zhang, Q.; Zhang, Z.; Shi, P.; Singh, V.P.; Gu, X.H. Evaluation of ecological instream flow considering hydrological alterations in the Yellow River basin, China. Glob. Planet. Chang. 2017, 160, 61–74. [Google Scholar] [CrossRef]
  29. Gao, B.; Li, J.; Wang, X. Analyzing changes in the flow regime of the Yangtze River using the eco-flow metrics and IHA metrics. Water 2018, 10, 1552. [Google Scholar] [CrossRef] [Green Version]
  30. Li, J.; Wang, Z.; Wu, X.; Guo, S.; Chen, X. Flash droughts in the Pearl River Basin, China: Observed characteristics and future changes. Sci. Total Environ. 2020, 707, 136074. [Google Scholar] [CrossRef] [PubMed]
  31. Wu, X.; Wang, Z.; Zhou, X.; Zeng, Z.; Lai, C.; Chen, X. Variability of annual peak flows in the Beijiang River Basin, South China, and possible underlying causes. Hydrol. Res. 2017, 48, 442–454. [Google Scholar] [CrossRef]
  32. Zhou, H.; Wang, Z.; Wu, X.; Chen, Y.; Zhong, Y.; Li, Z.; Chen, J.; Li, J.; Guo, S.; Chen, X. Spatiotemporal variation of annual runoff and sediment load in the Pearl River during 1953. Sustainability 2019, 11, 5007. [Google Scholar] [CrossRef] [Green Version]
  33. Zhang, Q.; Gu, X.; Singh, V.P.; Chen, X. Evaluation of ecological instream flow using multiple ecological indicators with consideration of hydrological alterations. J. Hydrol. 2015, 529, 711–722. [Google Scholar] [CrossRef]
  34. Lin, K.; Lian, Y.; Chen, X.; Lu, F. Changes in runoff and eco-flow in the Dongjiang River of the Pearl River Basin, China. Front. Earth Sci. 2014, 8, 547–557. [Google Scholar] [CrossRef]
  35. Wu, X.; Wang, Z.; Guo, S.; Liao, W.; Zeng, Z.; Chen, X. Scenario-based projections of future urban inundation within a coupled hydrodynamic model framework: A case study in Dongguan City, China. J. Hydrol. 2017, 547, 428–442. [Google Scholar] [CrossRef]
  36. Wen, X. Analysis of runoff changes in Zhenjiang River basin. Guangdong Water Res. Hydropower 2010, 7, 47–50. (In Chinese) [Google Scholar]
  37. Ge, X.; Zhao, J.; Zhu, Y. Construction of Lechangxia Hydraulic Project and fish protection. Pearl River 2009, 3, 29–32. (In Chinese) [Google Scholar]
  38. Cheng, Z. Flood characteristics and flood combination analysis in the upper reaches of Beijiang River. Guangdong Water Res. Hydropower 2006, 5, 46–49. (In Chinese) [Google Scholar]
  39. Lin, S. Discussion on joint operation of major water conservancy projects in Beijiang River Basin. Guangdong Water Res. Hydropower 2009, 11, 18–21. (In Chinese) [Google Scholar]
  40. Liao, Y.; Cai, X. Assessment of hydrological regime change in Beijiang River basin by change range method. GX Water Res. Hydropower Eng. 2012, 3, 14–17. (In Chinese) [Google Scholar]
  41. Gómez-Balandra, M.A.; Saldaña-Fabela, M.P.; Martínez-Jiménez, M. Indicators of Hydrological Alteration Version 7.1 User’s Manual; The Nature Conservancy: Arlington County, VA, USA, 2009; pp. 1–81. [Google Scholar]
  42. Gao, B.; Yang, D.; Zhao, T.; Yang, H. Changes in the eco-flow metrics of the Upper Yangtze River from 1961 to 2008. J. Hydrol. 2012, 448, 30–38. [Google Scholar] [CrossRef]
  43. Zhu, Y.; Lin, Z.; Zhao, Y.; Li, H.; He, F.; Zhai, J.; Wang, L.; Wang, Q. Flood simulations and uncertainty analysis for the Pearl River basin using the coupled land surface and hydrological model system. Water 2017, 9, 391. [Google Scholar] [CrossRef] [Green Version]
  44. Wang, Y.; Zhang, N.; Wang, D.; Wu, J.; Zhang, X. Investigating the impacts of cascade hydropower development on the natural flow regime in the Yangtze River, China. Sci. Total Environ. 2017, 624, 1187–1194. [Google Scholar] [CrossRef]
  45. Han, J. Analysis of the variation law of rainfall and discharge in Shijiao station of Beijiang River Basin. Northeast Water Conserv. Hydropower 2019, 10, 45–47. (In Chinese) [Google Scholar]
  46. Wu, C.; Huang, G. Changes in heavy precipitation and floods in the upstream of the Beijiang River basin, South China. Int. J. Climatol. 2014, 35, 2978–2992. [Google Scholar] [CrossRef]
  47. Li, R.; Yang, C.; Li, X.; Jiang, T.; Shi, Y.; Gao, Y. Reconstructing the historical pollution levels and ecological risks over the past sixty years in sediments of the Beijiang River, South China. Sci. Total Environ. 2019, 649, 448–460. [Google Scholar] [CrossRef]
  48. Ge, J.; Peng, W.; Huang, W.; Qu, X.; Singh, S.K. Quantitative assessment of flow regime alteration using a revised range of variability methods. Water 2018, 10, 597. [Google Scholar] [CrossRef] [Green Version]
  49. Zheng, Y.; Zhang, G.; Wu, Y.; Xu, Y.; Dai, C. Dam Effects on Downstream Riparian Wetlands: The Nenjiang River, Northeast China. Water 2019, 11, 2038. [Google Scholar] [CrossRef] [Green Version]
  50. Huang, Y.; Huang, B.; Qin, T.; Nie, H.; Wang, J.; Li, X.; Shen, Z. Assessment of Hydrological Changes and Their Influence on the Aquatic Ecology over the last 58 Years in Ganjiang Basin, China. Sustainability 2019, 11, 4882. [Google Scholar] [CrossRef] [Green Version]
  51. Gierszewski, P.J.; Habel, M.; Szmańda, J.; Luc, M. Evaluating effects of dam operation on flow regimes and riverbed adaptation to those changes. Sci. Total Environ. 2020, 710, 136202. [Google Scholar] [CrossRef] [PubMed]
  52. Ma, X.; Su, X. Study on ecological environment water demand and its satisfaction degree in the middle and lower reaches of Weihe River Based on RVA. Agric. Res. Arid Areas 2013, 31, 220–224. (In Chinese) [Google Scholar]
Figure 1. Locations of hydrological and meteorological stations (a) and reservoirs (b) in Beijiang River basin.
Water 12 02008 g001
Figure 2. Prior (green curves) and posterior (pink curves) flow duration curves (FDC) due to the construction of reservoirs. Two black lines mean the 25% and 75% FDCs of the prior flow component (green spots). The ecosurplus means the difference values of the flow component over 75% FDC line, and the ecodeficit means the difference values below 25% FDC line.
Water 12 02008 g002
Figure 3. Yearly variations of anomalous precipitation and eco-flow metrics. Bars show anomalous precipitation and red curves show ecosurplus and blue curves show ecodeficit. The anomalous precipitation is calculated as: P a n o m a l y = P i P ¯ P ¯ , where Panomaly denotes precipitation anomaly, Pi denotes annual or seasonal precipitation in ith year, P ¯ denotes average of annual or seasonal precipitation.
Water 12 02008 g003
Figure 4. Decadal variations of eco-flow indicators in annual or seasonal time scales.
Water 12 02008 g004
Figure 5. Yearly variations of the total seasonal ecosurplus and ecodeficit. The solid curves denote the fitting curves and the gray shaded parts are the 95% confidence intervals.
Water 12 02008 g005
Figure 6. Yearly variations of ecologically relevant hydrologic indicators. X7.day.min denotes the minimum 7-day streamflow, X90.day.max denotes the maximum 90-day streamflow, and Date.min denotes the time when the minimum daily streamflow occurs (from April to March next year). Rise.rate denotes the rise rates, and Reversals denotes the number of hydrologic reversals. The dashed lines indicate the trend line of the construction time of the water reservoirs.
Water 12 02008 g006
Figure 7. Heat maps of correlations between the IHA-32 indexes and eco-flow metrics. The information of the abbreviations in the figure is shown in Table 7.
Water 12 02008 g007
Table 1. Detail information of river basins and corresponding hydrological stations and reservoirs.
River BasinBeijiang RiverZhenjiang RiverWujiang River
Drainage area (km2)4671075547097
Length (km)468211260
Runoff (×109 m3)42.95.916.08
Main reservoir
(other reservoirs)
Feilaixia reservoirJinjiang reservoirLechangxia reservoir
(Changhe reservoir,
Xiniutan reservoir,
Muxi reservoir)
Hydrological station at the outletShijiao StationYangshao StationLishi Station
Data covering period1952–20161954–20181956–2018
Dividing year199919931972
Table 2. Different groups of the Indicators of Hydrological Alterations (IHA) 33-based indicators and different impact on the ecosystem of each groups.
IHA Parameter Group
(Subtotal Number)
Hydrologic ParametersImpacts on the Ecosystem
Magnitude of monthly water conditions (12)Median value for each calendar monthAffect the availability of water (including habitat and water use) by affecting hydrology, oxygen content and water column photosynthesis
Magnitude and durationof annual extreme
water conditions (12)
Annual minima 1-day meansAffect the competitive balance between organisms, anaerobic capacity and so on by affecting the morphological structure of river channels, the ventilation of river sediments, the conditions of natural habitats and the construction of aquatic ecosystems, thereby
Annual minima 3-day means
Annual minima 7-day means
Annual minima 30-day means
Annual minima 90-day means
Annual maxima 1-day means
Annual maxima 3-day means
Annual maxima 7-day means
Annual maxima 30-day means
Annual maxima 90-day means
Zero-flow days
Base flow index
Timing of annual extreme water conditions (2)Julian date of each annual 1 day maximumAffects the species’ behavior mechanism (such as fish spawning) by affecting the compatibility with their life cycle
Julian date of each annual 1 day maximum
Frequency and duration
of high and low pulses (4)
Number of high pulseAffects the stability of sediments and substrates by affecting water stress, thereby affecting the floodplain habitat of aquatic organisms
Number of low pulse
Mean duration of high pulse
Mean duration of low pulse
Rate and frequency of
water condition changes (3)
Rise ratesAffects the drought pressure of the organisms (mainly plants) by affecting the rise and fall of the water levels
Fall rates
Number of hydrologic reversals
Table 3. The changing rates comparing of prior and posterior numerical value based on the IHA indicators (darker shading indicates higher group).
IHA IndicatorsChanging Rates of the IHA Indicators of Prior and Posterior NUMERICAL Value (%)
YangshaoLishiShijiao
April−1.11621.303−6.521
May−4.71915.877−5.164
June−3.804−3.562−3.900
July45.23052.8035.042
August44.55427.8266.188
September9.8193.553−9.722
October27.71216.508−2.388
November17.12318.5319.659
December58.06022.04737.504
January40.78080.73413.567
February28.16615.999−1.231
March8.92448.902−15.830
1-day min−31.394−0.7480.350
3-day min−11.57213.1214.217
7-day min10.80421.0746.160
30-day min33.14834.10719.398
90-day min18.47019.2163.124
1-day max−3.28814.96814.652
3-day max−7.79413.05912.146
7-day max−7.8047.3966.911
30-day max−9.3993.291−2.711
90-day max−5.21610.656−1.973
Base flow2.871−1.5774.598
Date min−6.56010.645−38.251
Date max11.788−7.940−0.062
Low pulse93.95722.826165.308
Low pulse Duration−74.808−59.707−77.624
High pulse8.697−0.44720.676
High pulse Duration6.054−1.595−38.725
Rise rate−16.545−25.61818.103
Fall rate78.17539.21790.607
Reversals68.92169.84173.196
Table 4. Selection of ecologically relevant hydrological indicators (ERHIs) by the principle component analysis method.
Yangshao StationLishi StationShijiao Station
PC1AprilAprilApril
PC290-day maxRise rate 90-day min
PC37-day min30-day minRise rate
PC4Low pulse DurationDate minHigh pulse
PC5High pulse Duration90-day maxDate min
PC6ReversalsReversals90-day max
PC7Fall rateLow pulseHigh pulse Duration
Table 5. The Dundee Hydrological Regime Alteration Method and Do of three stations and hydrological alteration indicators of three stations.
StationsIHA SubgroupsMean Changing (%)Impact PointsTotal PointsDo (%)
MeansCVMeansCV
Yangshao122.5616.803101(2)37.629775
21.0165.27000
32.61413.33600
48.4757.83100
543.5175.06100
Lishi126.71024.886101(2)30.425076
212.23317.69300
31.35213.99200
49.7310.25100
527.81321.71600
Shijiao12.2679.179002(2)36.49904
26.0798.73700
319.15732.76510
417.4094.97200
560.63542.68510
Table 6. The monthly average runoff (Save) and the water demand (Seco) in each station.
MonthYangshao StationLishi StationShijiao Station
SaveSecoSaveSecoSaveSeco
January1.961.091.831.1611.586.54
February2.391.162.500.8314.156.14
March3.710.833.981.0722.093.98
April6.332.916.843.2343.9817.61
May8.432.508.403.0666.5633.58
June9.311.488.271.1671.8125.34
July5.192.654.542.4941.7418.40
August4.312.034.281.9635.6218.17
September3.321.613.250.9525.4713.34
October2.651.542.161.0416.177.58
November2.231.171.960.7714.036.77
December1.981.311.670.7611.687.24
Table 7. The descriptions of abbreviations used in Figure 7.
AbbreviationDescriptionAbbreviationDescription
SprSpringX30.day.minminimum 30-day runoff
SumSummerX90.day.maxmaximum 90-day runoff
AutAutumnDate.mintime of minimum daily runoff occurs
WinWinterDate.maxtime of maximum daily runoff occurs
AunannualLo.pulse.low pulse count
SeaTotal seasonalLo.pulse.Llow pulse duration
EspecosurplusHi.pulse.high pulse count
EdfecodeficitHi.pulse.Lhigh pulse duration
EcochangeTotal seasonal ecosurplus and ecodeficit