Article

Benefit Evaluation of Water and Soil Conservation Measures in Shendong Based on Particle Swarm Optimization and the Analytic Hierarchy Process

1
College of Life Science, Inner Mongolia University, Hohhot 010021, China
2
Technology Research Institute, Shenhua Shendong Coal Group Co., Ltd., Yulin 719315, China
3
Desert Science and Engineering College, Inner Mongolia Agricultural University, Hohhot 010018, China
*
Authors to whom correspondence should be addressed.
Stands for two authors contribute equally.
Water 2020, 12(7), 1955; https://doi.org/10.3390/w12071955
Submission received: 21 May 2020 / Revised: 30 June 2020 / Accepted: 4 July 2020 / Published: 9 July 2020
(This article belongs to the Special Issue Water Resources Management: Advances in Machine Learning Approaches)

Abstract

:
Soil erosion is the main threat to the stability of ecological environment and the harmonious development of society in Shendong Mining Area. The main causes of this threat include the strong interference of natural characteristics and land development. Scientific soil and water conservation measures can coordinate the contradictions among coal economic development, ecological protection, and residents’ prosperity. Based on particle swarm optimization and analytic hierarchy process, the benefit evaluation system of soil and water conservation measures in Shendong Mining Area is established. The weight ratio of three kinds of benefits in Shendong coal mine collapse area is: ecological benefit > social benefit > economic benefit. The conclusion shows that the implementation of the national policy and the effect of mining area management meet the expectation. Therefore, this study provides effective reference and reasonable suggestions for soil and water conservation in Shendong Mining Area. In terms of control measures, bioengineering measures, such as increased coverage of forest and grass as well as reasonable transformation of the landscape pattern of micro landform, can improve the degree of soil erosion control, optimize the land use structure, and improve the land use rate.

1. Introduction

Due to climate change and water shortage, similar to the allocation of water resources in Colombia [1], the sustainable assessment of soil water system in the Netherlands [2], the utilization of water resources in Sri Lanka’s arid areas [3], and other phenomena related to soil and water, conservation deserves wide attention [4]. Especially in the mining process, the effective utilization and management of resources must be faced by decision makers. The conflict between Vietnam and Titan mining gives people a warning: decisions must be made to provide economic, environmental, and ecological conflicts [5]. Only by creating favorable conditions for sustainable land management based on soil and water conservation can the goal of sustainable development be realized [2]. Soil erosion is a global concern, not only because of its importance in agriculture and forestry, but it also affects the performance in a wider range of fields [2], such as ecology, society, and economy [4]. In order to realize the sustainable utilization of soil and water resources, governments and researchers have studied the existing soil and water conservation measures from different measures, different regions, and different stakeholders’ attitudes. In particular, the benefit evaluation of soil and water conservation measures, sustainable watershed management, and analysis of socio-economic factors related to soil and water conservation are important research directions. China has an area of soil erosion of 2.7369 million square kilometers, making it one of the countries with the most serious soil erosion in the world. The Loess Plateau has a soil and water loss area of 213,700 square kilometers, which is one of the most serious soil and water loss areas in China and even the world with the most fragile ecological environment. The Loess Plateau is one of the cradles of human civilization [6,7], and a guarantee for environmental stability and regional sustainable development. At the same time, the region also provides ecosystem services, including water resources storage and soil and water conservation. Especially in the Loess Plateau coal mining area, where water shortage and water storage are difficult [8,9], the development and utilization of human resources to meet the needs of economic development will inevitably have a serious impact on the local ecological environment [10,11,12], which plays the most important role in water resource management [13,14,15,16]. Therefore, the study of soil and water conservation is an important direction of water resource management [1,17,18,19]. In the wide range of activities covered by water management, the loess area, which is strongly influenced by human beings, is more likely to cause serious soil erosion. The red line guide for ecological protection emphasizes the importance of soil and water conservation in the Loess Plateau [20]. In order to control soil erosion in mining subsidence area, technical measures [21,22,23], engineering measures, biological measures [24,25], farming measures, and planning management have been taken for control [6,26,27,28,29,30]. These measures slow down the trend of soil and water loss in mining subsidence area [31,32,33].
In more than 20 kinds of common governance technologies and models, a low-cost and high-efficiency comprehensive governance model should be chosen for Shendong Mining Area. In the future, the model can provide an efficient solution to the soil and water loss control in mining areas and maximize the comprehensive benefits of soil and water conservation measures. However, so far, there has been no research on Shendong coal mine. In particular, the comprehensive benefit evaluation system and model of the subsidence area in Shendong Mining Area have not been established.
The Law of the People’s Republic of China on Soil and Water Conservation stipulates evaluation from four aspects: soil and water conservation, disaster prevention and mitigation, ecological construction, and social progress [34]. However, Shendong Mining Area consists of three municipal administrative regions. The data source of relevant evaluation indexes is unclear, so it is necessary to select the data related to the mining area. At the same time, some scholars have used the observation data of the study area to evaluate the vegetation coverage, terraced landscape [35,36,37], the affected population range, investment scale, etc. Their method is qualitative description or quantitative analysis, but there are some problems such as poor applicability of indicators and imperfect evaluation system. There are obvious regional differences in evaluation indexes of soil and water conservation measures. Researchers need to form an evaluation system supported by multiple objectives and methods according to local economic, ecological, social and technological factors, so as to obtain the best solution for comprehensive benefits of soil and water conservation [38,39].
The evaluation of soil and water conservation measures involves three levels society, economy, ecology and the ultimate evaluation goal is to maximize the comprehensive benefits. Analytic hierarchy process (AHP) has advantages in achieving multi-objective evaluation [40]. A mining area is studied as the research object in this paper, which includes three county-level administrative regions. There are significant differences in the judgment of the importance of some indicators among different administrative regions. Therefore, experts and stakeholders with relevant backgrounds are required to judge in the form of Delphi method [41,42]. In the actual evaluation process, in order to solve the problem of experts’ different understanding of the importance of different indicators, the authors use the particle swarm optimization algorithm. In this way, the weight of each evaluation index that maximizes the comprehensive benefit of the research area can be quickly obtained [43,44,45], so as to judge the influencing factors of water and soil conservation measures in the mining area, provide scientific basis for the formulation of the water and soil conservation plan in the mining area [46,47,48], and promote the sustainable development of the area [49]. In fact, these measures have significant effect on subsidence valley (Figure 1a) and slope (Figure 1b). This study was carried out to evaluate the comprehensive benefits of these measures.

2. Materials and Methods
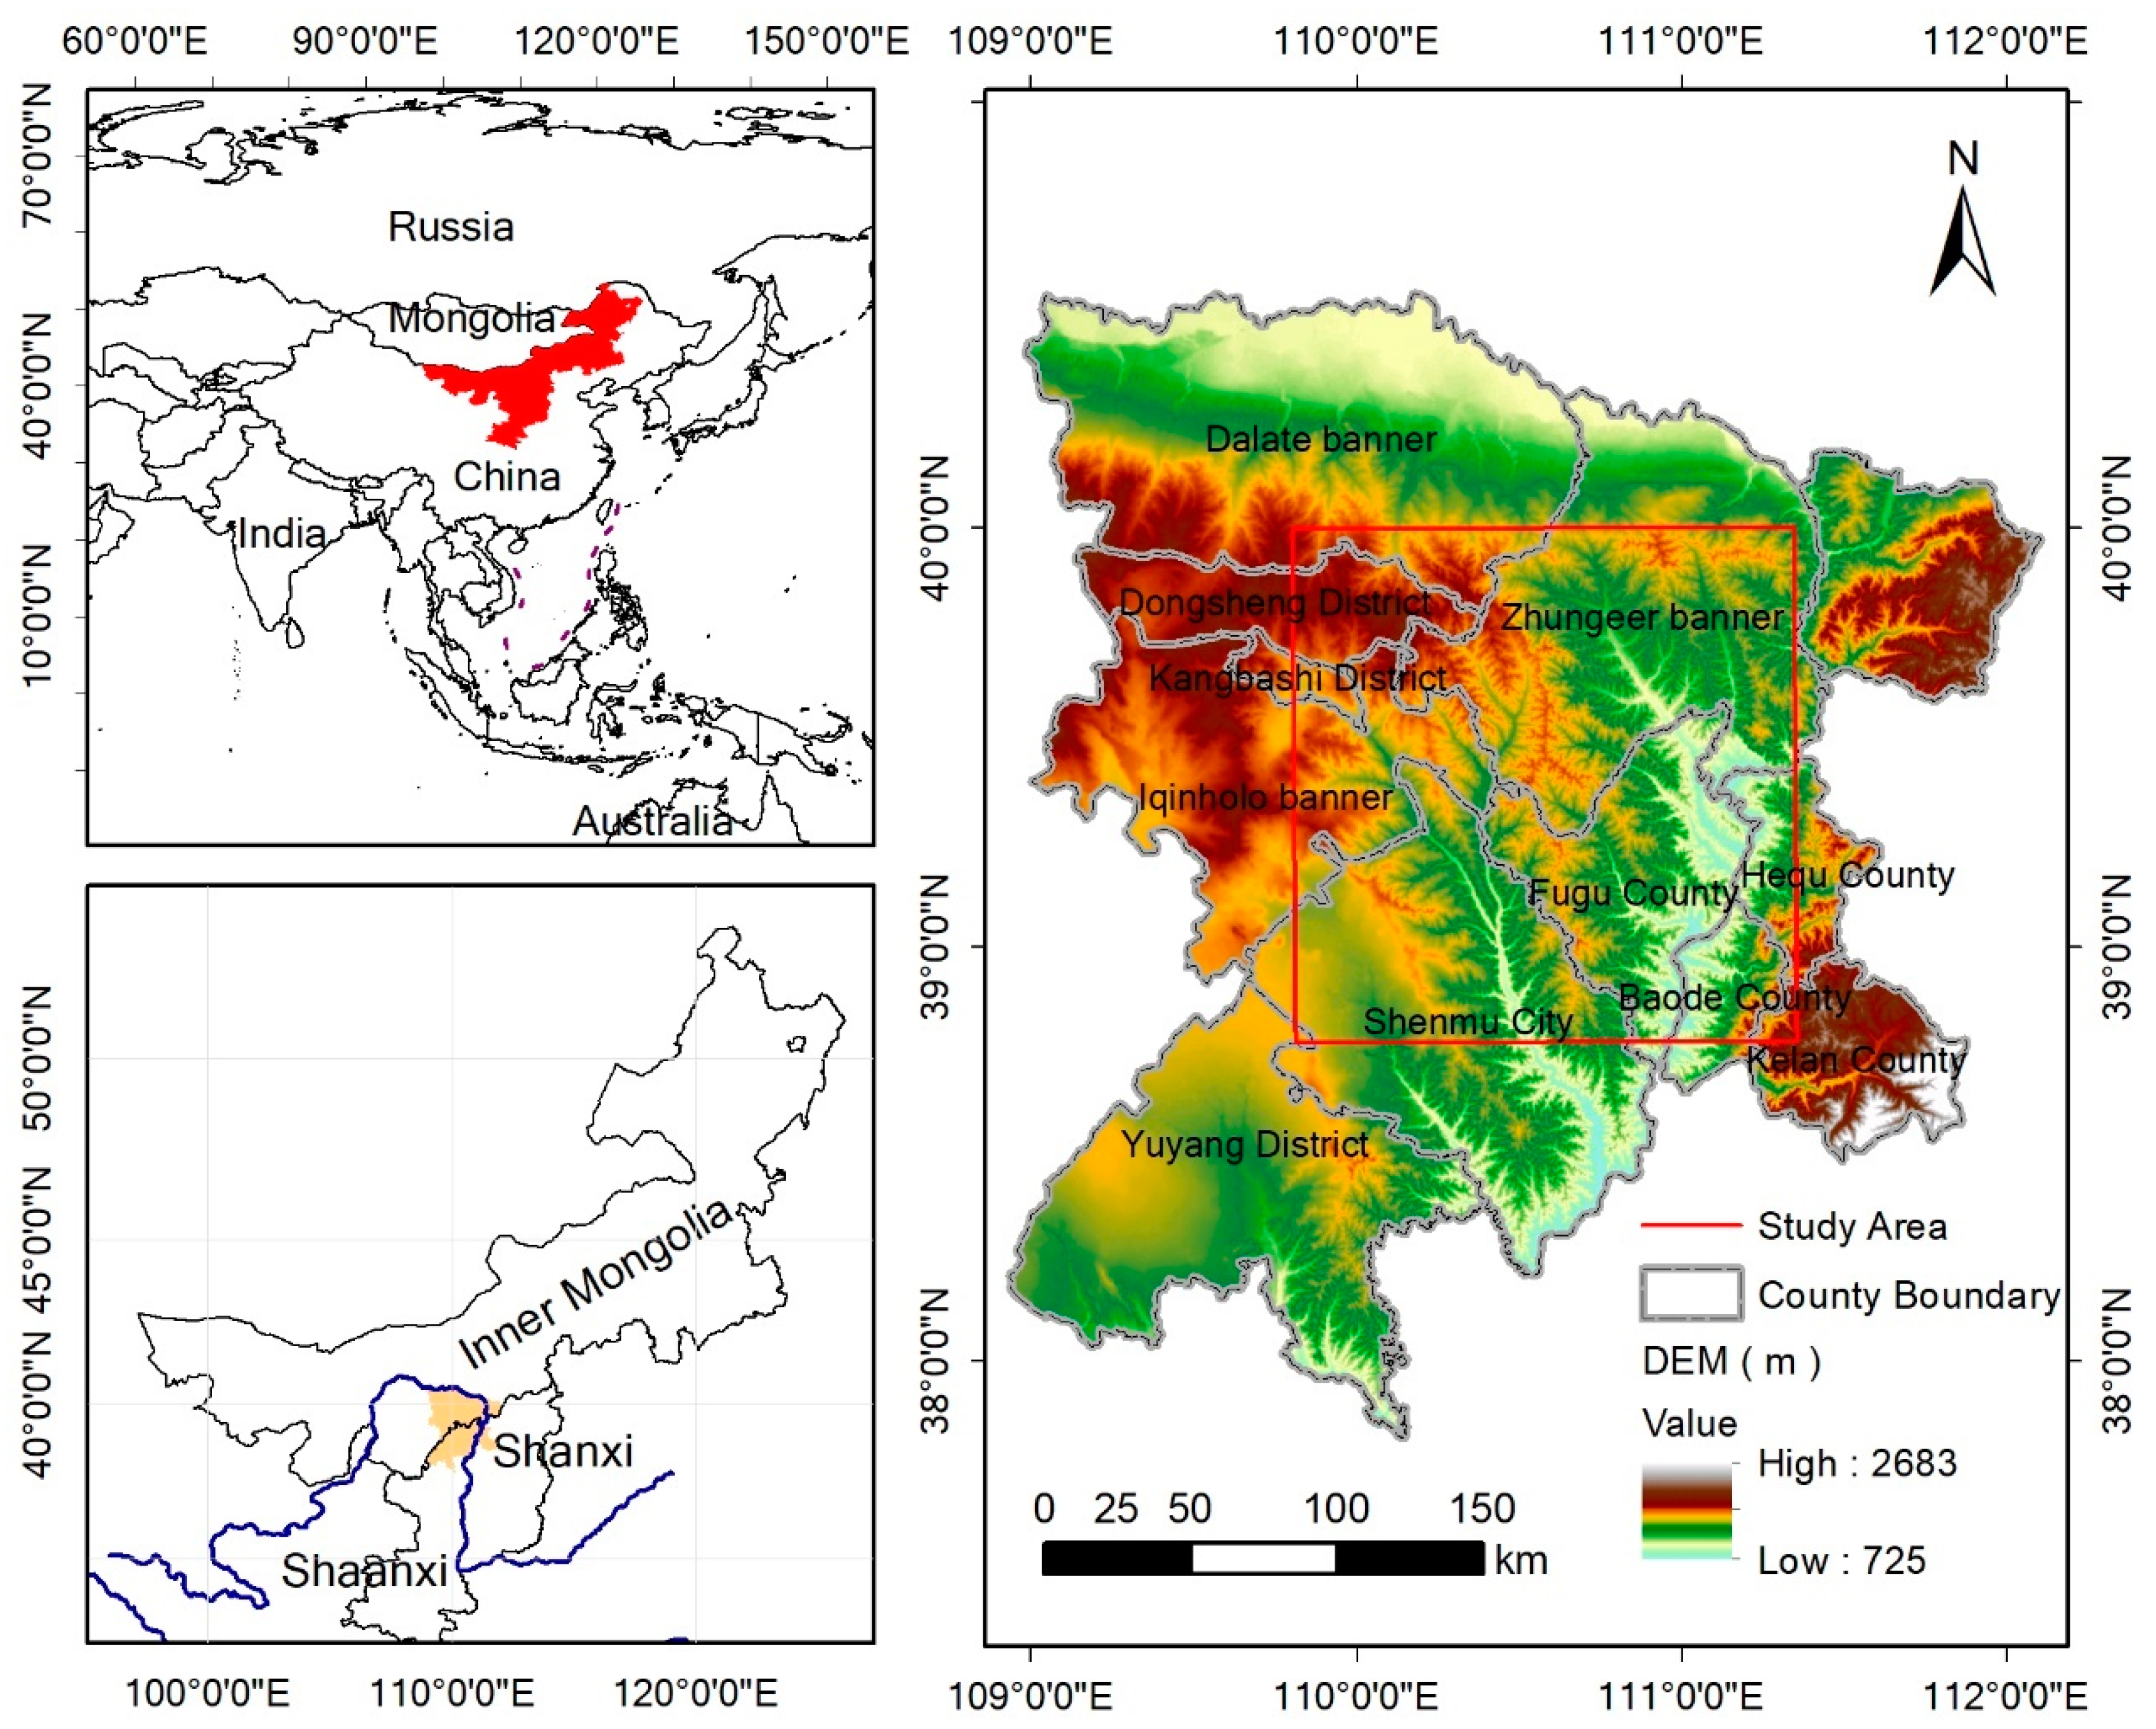
2.1. Study Area

In this study, the authors selected Shendong Mining Area in Inner Mongolia as a case study area (i.e., the area marked with the red box in Figure 2, covering an area of 30,349 km2). Shendong Mining Area is one of the four largest coal fields in the world. The location is characterized by sparse population and advanced coal production technology. There are 17 coal mining areas of Shendong company including Daliuta Coal Mine and Shangwan Coal Mine. The underground mining is adopted, because of its easy formation of surface subsidence. These areas are located in the southeast of Ordos, the north of Shaanxi, and the southeast edge of Maowusu Desert. The study area is located in the triangle area at the junction of Inner Mongolia, Shaanxi and Shanxi, which is high in the northwest and low in the southeast, with an average altitude of 1200 m (Figure 2). The east and northeast portions of the mining area feature loess hilly areas and criss-cross gullies, forming beams, trenches, and tableland. Most mining areas are covered with intermittent quicksand and semi-fixed sand. The climate type is a semi-arid continental climate. The average annual rainfall in Shendong Mining Area is 460 mm, mostly in July and August, in the form of a rainstorm. The annual average evaporation is 4.55–6.72 times of the annual average rainfall. With the exploitation of coal resources, the surface and vegetation cover are strongly disturbed. The terrain of this area is complex, include five kinds of loess landform, and it is a typical hilly and gully area of the Loess Plateau, with undulating hills, dense gullies and broken terrain. Its soil texture is fine, its particles are loose, and its rainfall is concentrated in summer with many rainstorms. The runoff formed by short-term heavy rainfall has strong hydraulic erosion on the surface soil, which causes serious soil erosion. The average erosion rate of the whole Shendong Mining Area is 6534.65 t/(km2·a).

2.2. Data and Processing

This paper uses the Statistical yearbook of national economic and social development of Iqinholo banner, Shemu city, and Baode county from 2014 to 2018 as the basic data set [50,51,52] (I), which help screen the social and economic benefit index of soil and water conservation in Shendong Mining Area. Based on the Monitoring data set of ecological environments in mining area (II, source: monitoring data of Inner Mongolia Agricultural University) and Shendong master data management platform (III, source: Internal production index data set of Shendong company), the ecological benefit data for soil and water conservation in Shendong Coal Mining Subsidence Area were calculated (Table 1). It should be noted that 2014–2018 is the period of the 13th five-year Plan for China’s National economy. During this period, the state took large-scale coal mine construction and comprehensive control of the ecological environment in mining areas as key construction projects, and evaluated the overall benefits of soil and water conservation measures in Shendong Coal Mining Subsidence Area [53], which also reflected the overall benefits of soil and water conservation in other large coal fields in China.

2.3. Methods

2.3.1. Delphi Method

The Delphi method was established in 1950 by the Rand Corporation of the United States. Experts with relevant backgrounds were invited anonymously to solicit their opinions on research matters and phenomena. Its biggest advantage lies in its intuitive design and simplicity, especially in policy equation, program evaluation, and development prediction.
The basic steps of the Delphi method are as follows: (1) Designing a questionnaire. In order to effectively use experts with multiple knowledge backgrounds, the indicators of the questionnaire need to be very comprehensive. (2) Establishing a database of experts. A total of 30–50 experts were selected from relevant research fields or stakeholders, an expert database was established, and more than 20 experts were randomly selected as survey objects. (3) A total of 21 questionnaires were issued and collected. This questionnaire was distributed by email and other means, and the experts were independent of each other. After sorting and summing the data and engaging in a statistical analysis, the questionnaires collected were fed back to the experts anonymously, whose opinions would again be solicited. (4) Through multiple rounds of consultation, the authors could obtain a more unified view of an ideal state and obtain a relatively objective evaluation [42].

2.3.2. Analytic Hierarchy Process (AHP)

AHP [54] is a model used to evaluate decision-making problems [5,55,56,57,58]. This model changes to decompose a decision-making problem into several levels. Each level has a main indicator to reflect the problem. Similarly, each main indicator can also be divided into several secondary indicators [59]. Each level, according to the expert opinion, gives the evaluative weight and score of each index. Then, through a structural quantitative model and evaluation of the impact factors of the decision-making problems, the qualitative problems are quantified, and the real problems are in decision-making [60]. However, there are often subjective abilities and other aspects of the impact in the process of practical application. Moreover, the evaluation factors may not be comprehensively enough, which can be solved by using a particle swarm optimization algorithm. This method iterates the experience and judgments of expert’s step by step to find the optimized evaluation scheme [61]. AHP usually employs the following steps:
Step 1: The construction of a judgment matrix takes A as the goal, ui, and uj (i, j = 1, 2, ..., n) is the factor. Where uij represents the relative importance of ui to uj. The P-U judgment matrix P is composed of uij.
P = [ u 11 u 12 u 21 u 22 u 1 n u 2 n u n 1 u n 2 u nn ]
Step 2: According to the judgment matrix, the eigenvector w corresponding to the maximum eigenvalue λmax is obtained, and the order of importance is calculated as follows:
P w = λ max w
The normalized feature vector w is used to rank the evaluation factors according to their importance to obtain their weight distribution.
Step 3: Through the construction of a consistency test matrix, the authors can judge whether the weight distribution is reasonable. The calculation is as follows:
CR = CI RI
CR is the random consistency ratio of the judgment matrix, and CI is the general consistency index of the judgment matrix, which is given by the following equation:
CI = λ max n n 1
RI is the average random consistency index of the judgment matrix. See Table 1 below for the RI value of the judgment matrix in the order of 1–9 (Table 2) [54].
When the CR of the judgment matrix P is less than 0.1 or λmax = n, CI = 0, P is considered to have satisfactory consistency. Otherwise, the elements in P need to be adjusted to give it satisfactory consistency.
Step 4: In order to obtain the combined weight of the elements of a certain level compared to the overall goal, as well as the relationship between the elements of the level and the elements of the upper level, the authors need to calculate the relative weight of the lowest level elements layer by layer from the top to the bottom and sort them according to priority. Then, the authors calculate the combined weight of each level, and finally get the CR value of the overall sorting of the level according to the weight relationship. If the total ranking consistency CR is less than 0.1, the total ranking consistency test is passed. Otherwise, the authors need to reconsider the model or reconstruct the judgment matrix with a larger consistency ratio CR. Of course, when CR > 0.1, the original matrix does not offer satisfactory consistency test results.
The authors then use the particle swarm optimization (PSO) algorithm to modify the original matrix, so that the CR value passes the consistency test:
CR = wi 1 CI 1 + wi 2 CI 2 + Λ + wi m CI m wi 1 RI 1 + wi 2 RI 2 + Λ + wi m RI m
Step 5: The concluding value of each weight in expert group decision-making is directly equal to the average value of the corresponding weight value of each expert. If the influence factors of each expert are different, the above average value is the weighted average value of each expert. This method is usually recommended to solve group decision-making problems. Since the research content involves different fields, the latter method was adopted in this paper.

2.3.3. Particle Swarm Optimization (PSO)

PSO was proposed by Eberhart and Kennedy in 1995 [62]. Due to the subjective characteristics of the expert scoring used in AHP, the scoring matrix is often inconsistent, or the scoring weight is not the global optimal. Compared with other optimization algorithms, such as the traditional exhaustive method, PSO can describe problems that cannot be expressed by the traditional optimization method as objective functions, which have a wide range. At the same time, because of the nature of PSO’s random search, it is not easy to fall into the local optimum. Finally, the method is in line with the characteristics of fitness probability evolution and ensures the algorithm’s rapidity. Therefore, PSO shows a strong advantage against complex problems. Here, the authors can use particle swarm optimization algorithm to modify the expert scoring matrix [63].
PSO originates from research into the predatory behavior of birds. PSO is an optimization model inspired by this type of group foraging behavior. The specific process is described as follows.

Description 1. Algorithm Description

PSO is initialized as a group of random particles (random solution). Then, the optimal solution is found by iteration. In each iteration, the particles update themselves by tracking two “extreme values” (pbests). After these two optimal values are solved, the particles update their speed and position through the equations below [64]:
V i + 1 = V i + c 1 × rand ( 0 1 ) × ( pbest i x i ) + c 2 × rand ( 0 1 ) × ( gbest i x i ) ,
x i + 1 = x i + V i ,
i = 1, 2, …, M, M is the total number of particles in the population; Vi is the speed of particles; pbest is the individual optimal value; gbest is the global optimal value; rand (0–1) is a random number between (0, 1); xi is the current position of particles, and c1 and c2 are learning factors. Generally, c1 = c2 = 2 is taken in each dimension. Particles have a maximum speed Vmax. If the speed of one dimension exceeds the set Vmax, the speed of one dimension is limited to Vmax.

Description 2. PSO algorithm for the Consistency Check

Based on the weight values in the modified analytic hierarchy process of PSO, the basic is to first construct a judgment matrix P u = ( u ij ) n × n for determining the weight of each evaluation index, and then use the PSO algorithm to perform a consistency check on the judgment matrix Pu’s correction and calculation of weight w i   (   i = 1 ,   ,   n ) , where w i > 0 and i = 1 n w i = 1 . Thus, according to the definition of the judgment matrix Pu, theoretically,
u ik = w i / w k   ( i = 1 , 2 ,   , n ; k = 1 , 2 ,   ,   n )
The matrix Pu has the following properties:
The judgment matrix as the identity matrix: u ii = w i / w i = 1 ;
The judgment matrix is a reciprocal matrix: u ki = w k / w i = 1 / a ik ;
The judgement matrix consistency conditions: u ik u kj = ( w i / w k ) ( w k / w j ) = w i / w j = u ij .
If the discrimination matrix Pu satisfies Equation (8), w i / w j can be accurately calculated, which means that Pu has complete consistency, yielding Equations (9) and (10):
k = 1 n ( u ik w k ) = k = 1 n ( w i / w k ) w k = nw i   i = 1 ,   , n ,
k = 1 n | k = 1 n ( u ik w k nw i )   | = 0
In general, due to the complexity of practical problems, the differences in people’s subjective consciousness, and other factors, the judgment matrix Pu is incompletely consistent and cannot be eliminated. Accordingly, if Pu cannot reach a satisfactory consistency, it is necessary to make some adjustments to Pu until it meets the consistency accuracy requirements required for practical applications. Obviously, the left end of Equation (10) indicates the consistency degree of the judgment matrix Pu. The closer the value on the left side of the Equation is to 0, the higher the consistency degree of the judgment matrix Pu; otherwise, the consistency degree of Pu the lower. In special cases, when Equation (10) holds, the judgment matrix Pu has complete consistency. Therefore, the consistency check problem of Pu is transformed into a linear optimization problem that calculates a constrained minimum:
min CIF ( n ) = k = 1 n | k = 1 n ( u ik w k nw i )   | / n s . t   w k > 0 ,   k = 1 n ,   k = 1 n w k = 1
minCIF ( n ) is the objective function—that is, the fitness function in PSO. The main steps of the consistency check of the PSO algorithm are as follows:
Step 1: Calculate the fitness minCIF ( n ) (Equation (11)) of each particle, set the individual optimal solution pbest of particle i, record the optimal CIF ( n ) as gbest, and sort all particles according to their fitness from small to large.
Step 2: Initialize the position xi and velocity vi of n particles.
Step 3: Calculate the fitness function minCIF ( n ) of each position particle.
Step 4: Update the position and velocity of particle i according to Equations (6) and (7), so the velocity of the particle is less than Vmax.
Step 5: Recalculate the fitness minCIF ( n ) of the new position of each particle.
Step 6: Update the individual optimal solution pbest and global optimal solution gbest of particle i and re-order all particles from small to large according to their fitness.
Step 7: If the termination condition is met, the algorithm stops; otherwise, go to Step 4.
Step 8: Give the revised sorting weight w k = (   w 1 , w 2 ,   ,   w n ) and the consistency parameter CI =   minCIF (   n , w k ) that meet the consistency check.
Based on the judgment matrix of the analytic hierarchy process, this paper uses the particle swarm optimization algorithm to globally modify the judgment matrix and, thus, obtain the ranking weight of each element in the analytic hierarchy process.

2.4. Build a Comprehensive Benefits System

According to the present situation of soil and water conservation in Shendong Coal Mining Subsidence Area and the characteristics of the related data sets, 18 evaluation factors were selected and divided into three levels: ecological benefits, economic benefits, and social benefits (Figure 3). The authors invited 21 experts to distinguish the importance and types of each index, and then ranked and grouped the evaluation indexes. Finally, the consistency score was obtained after multiple rounds of questionnaires [5].
In the table, U represents comprehensive benefit of soil and water conservation, U1 represents economic benefit, and U11 represents slag retention in mining area. The same is applicable below.

3. Results

3.1. Benefit Weight Matrix and Testing

3.1.1. Comprehensive Benefit Weight

According to the above methods and data sets, the discriminant matrix of the comprehensive benefit index was then constructed, and the consistency test was carried out. In this method, if the original matrix does not conform to the consistency test, the particle swarm optimization algorithm was used to construct a modified weight matrix. After normalization of the matrix, the maximum feature weight was calculated, the process determinant was listed, the consistency of the CR was solved, a satisfactory consistency test of the CR was carried out, and the correction process of the other hierarchical weight matrix was the same.
The comprehensive soil and water conservation benefits in the original weight matrix ((Table 3) mix = 3.13561; CR = 0.1304, CR > 0.1, the original matrix) do not meet the statistical requirements. The modified P with PSO, however, has satisfactory consistency (Table 4) λmax = 3.09541, R = 0.09174 < 0.1, CI = 0.0477.

3.1.2. Weight of Ecological Benefits

The modified weight matrix of ecological benefits, λmax = 7.7763; CR = 0.0951 < 0.1; CI = 0.12943, shows satisfactory consistency. According to the weight matrix (Table 5), vegetation reconstruction in Shendong Coal Mining Subsidence Area, terraced landscape, and land use are the main indexes that affect ecological benefits, while gangue and slag discharge have little effect.

3.1.3. Weight of Economic Benefits

The P in the economic benefit-revised weight matrix, λmax = 6.5211, CR = 0.0827 < 0.1, and CI = 0.1042, has satisfactory consistency (Table 6). The area’s per capita GNP (Gross National Product) reflects the economic benefits of the mining area. Under the influence of coal seam thickness and mining area length, the influence of mining intensity on economic benefits is low when evaluating soil and water conservation benefits.

3.1.4. Weight of Social Benefits

The P in the weight matrix of each index, λmax = 6.6074; CR = 0.0964 < 0.1; CI = 0.1215 (Table 7), after social benefit correction, has satisfactory consistency. Improvement of the ecological environment in Shendong Coal Mining Subsidence Area can effectively increase the population capacity of the region and increase the income of local employment personnel through ecological investments, and improve the area’s cultural and educational level at the same time.

3.2. Total Ranking of Soil and Water Conservation Benefits and Group Decision Weights

3.2.1. Total Ranking of Soil and Water Conservation Measures

The geometric average of the corresponding position of the modified matrix and the group decision matrix were then obtained. On the basis of this group matrix, the final group conclusion can be calculated. The ecological benefits, economic benefits, and social benefits of the soil and water conservation measures in Shendong Coal Mining Subsidence Area were tested (CR = 0.0912 < 0.1). The total ranking P has satisfactory consistency. Table 8 provides the decision weights of Shendong Coal Mining Subsidence Area calculated according to the equation. After the analysis of global weight, the authors found that the area needs to pay more attention to the restoration of forest and grass vegetation, strengthen its degree of water and soil loss control, reduce its soil erosion rate through engineering and biological measures, and create a healthier ecological environment to increase the area’s environmental population capacity.

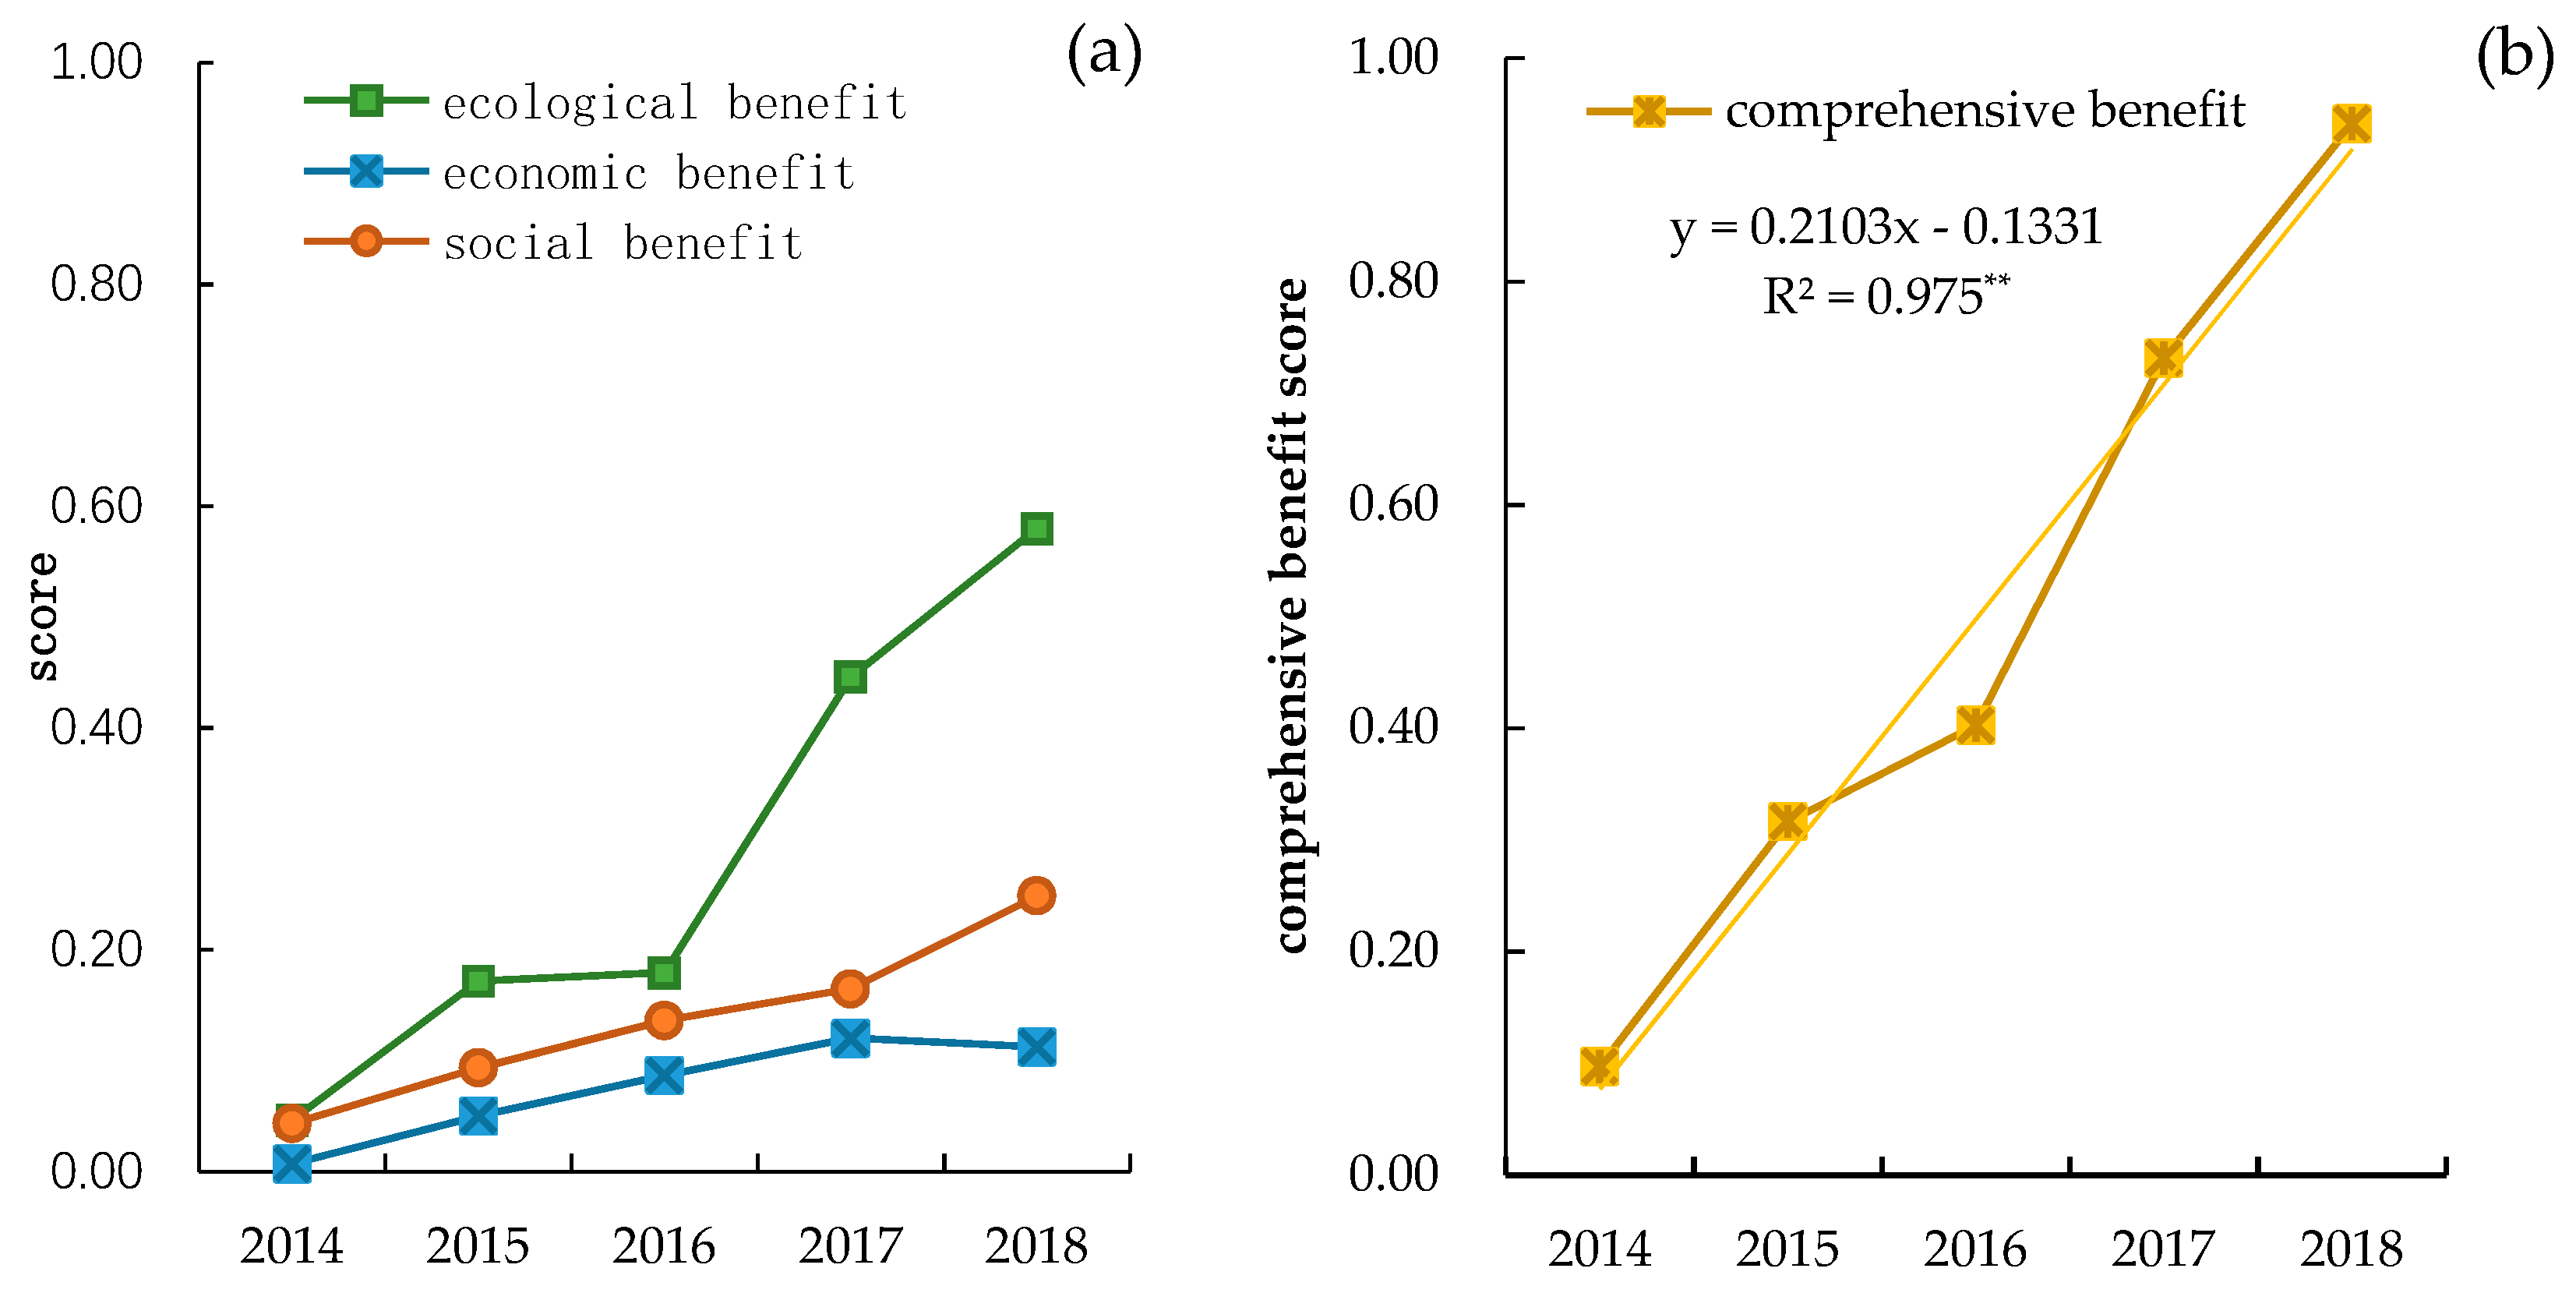
3.2.2. Comprehensive Benefits

The authors next standardized the indicators in Shendong area and eliminated the dimensions (Table 8). Among these dimensions, the lower the value of the soil erosion rate, soil and water loss management, energy consumption per unit of gross national product, and Engel coefficient is, the higher the benefit would be. Therefore, a value of 1 minus the standardized value was used as the score of each index. The global weight of each index was obtained by multiplying the weights of the same level by the comprehensive benefit weight, and the standardized value of each index among the three benefits was multiplied by the global weight. Then, the scores of ecological benefits, economic benefits, and social benefits were obtained (Figure 4a). The comprehensive benefit value of the soil and water conservation measures in Shendong area for each year was obtained by adding three benefit scores (Figure 4b). The comprehensive benefit of soil and water conservation in Shendong Coal Mining Subsidence Area continued to increase from 2014 to 2018, reaching its peak of 0.942 in 2018. The contribution of ecological benefits was 58.9%. The factors of the soil erosion rate, subsidence rate [30,65], forest and grass coverage rate, and soil and water loss management degree in the ecological benefit weights were the main factors that facilitated the ecological benefits [66].

4. Discussion

4.1. Mining Subsidence Area Seriously Affected by Water Erosion

The study area is in the Loess Plateau, which is also the area with frequent rainstorms in summer. The runoff erosion on the slope is serious [67] and forms an important source of sediment in the Yellow River [68]. If the soil erosion is not controlled in time, serious ecological problems could occur [69], such as reduction of cultivated land, land degradation, water shortage and pollution, and reduction of biodiversity. In addition to the above characteristics, the high-intensity coal mining in Shendong Mining Area has changed the surface morphology and vegetation ecology [33,70], and has intensified the phenomenon of soil erosion. Under the large-scale financial and technical support, the soil and water conservation work in Shendong Mining Area has achieved remarkable results [67,71]. Many years of soil and water conservation measures have alleviated the phenomenon of surface soil erosion caused by slope runoff. Therefore, the authors choose Shendong Mining Area as a typical area of soil and water conservation to study, hoping to make a scientific evaluation of the recent ecological and environmental governance work and its benefits.

4.2. Systematicness of Evaluation Indexes of Soil and Water Conservation Benefits

The classification of soil and water conservation measures is an important basis for soil erosion investigation, soil and water conservation planning, the extension of soil and water conservation measures, and benefit evaluation. According to the current situation of soil and water conservation work in the study area, all types of practical measures were not included in the evaluation system, but comprehensive indexes, such as forest and grass coverage [39,72] and the soil erosion rate, were calculated based on afforestation, recommendations, and terrace landscape [35,36,37,57,73]. The evaluation system avoids the overall benefit evaluation because of the particularities of engineering measures. In the evaluation system, there are not only specific indicators for engineering measures, but also indicators that can reflect the effects of such measures [48]. When evaluating the current indicators, the authors added the increase in worker welfare, the improvement of living conditions, and the improvement of workers’ production skills due to the implementation of water and soil conservation projects. In this way, soil and water conservation projects are not only used to reduce soil erosion, but also to strengthen investments in ecological environmental protection through an increase in production efficiency, and to benefit local residents via the implementation of such projects.

4.3. PSO Makes Subjective Evaluation Objective

Based on statistical data and ecological environment research data, this study evaluated the benefits of soil and water conservation in Shendong Coal Mining Subsidence Area. The evaluation system was constructed by using the analytic hierarchy process [29,58,74,75], and the weights of the hierarchy and index were set by the Delphi method [76]. As a subjective evaluation will inevitably produce errors, if not corrected, these errors can be amplified layer by layer, leading to evaluation distortion. PSO algorithm modifies the expert scoring matrix to seek the best weight score, and tests it to gradually obtain the best value for global optimum [75]. The particle swarm optimization algorithm shows obvious advantages when judging whether there is an error or error source. This is because that is characterized by few numbers of parameters to be adjusted, simplicity, easy operation, and fast convergence speed. With the help of computer language, it may solve the repeated detection and correction process. By applying the analytic hierarchy process, the authors could made the evaluation conclusion more objective [60].

4.4. The Research Conclusion of the Evaluation System Is Consistent with the Facts

In Shendong Mining Area, the intensive mining activities will inevitably affect and occupy farmers’ land, and interfere with the original land surface, vegetation, and water in the mining area, resulting in the aggravation of soil erosion. Soil and water conservation in Shendong Mining Area of the Loess Plateau is mainly based on the micro geomorphic landscape transformation of slope reduction [67], which can lead to terraces suitable for planting and the ridges suitable for trees and grass, optimize the original land structure type [66,77]; improve land use efficiency [78] and create degradable biomaterials for slope cover [79], help make the area more conducive to vegetation growth [39,80], and reduce water and soil loss [3,75,78,81,82,83]. An increase in forest and grass coverage not only needs favorable terrain conditions, but also requires appropriate plant species to be used for vegetation rehabilitation, as well as workers with mastery of the corresponding technologies to engage in reclamation. Highly-skilled workers can take advantage of newly increased work opportunities, increase their incomes, and improve the quality of their whole family’s industrial chain. Further, Shendong Mining Area features a relatively closed social composition. Mining workers, workers’ families, local farmers, and other groups all form different industrial chains and sources of life around coal resources, which is significantly different from the phenomena in other regions. This area is not only a production area, but also a living area for these people. Through “ecological restoration and management of coal mine area”, a positive cycle based on the soil and water conservation project was formed, which could improve the population capacity of the environment [84], meet the needs of ecological environment restoration, and promote the sustainable development of regional society and economy [53].

5. Conclusions

In this study, three methods were used to construct a soil and water conservation benefit evaluation system. Besides, the conclusions are in line with the actual situation of the region, which shows that this combination of methods is suitable for comprehensive benefit evaluation. The evaluation results show that ecological benefits are the most important, followed by social and economic benefits. Ecological benefits are mainly gained from the transformation of the micro geomorphic landscape, the construction of terraced fields and dams, the planting of trees and grass, and the adjustment of land use. These measures can effectively prevent and control water and soil loss because reducing the soil erosion rate is the most important work for coal mine soil and water conservation in the Loess Plateau area.
Secondly, the modern production mode and efficient economic output of Shendong Mining Area ensure the investment support of soil and water conservation projects. Therefore, although mining intensity and economic benefits have little direct impact on the water and soil conservation benefits of the mining subsidence area, soil and water conservation investment come from the economic growth rate of Shendong Mining Area in this period. At the same time, the authors found that an increase in benefits officially benefits from the support of economic benefits in the analysis process. Only group enterprises with a large economic scale and a strong sense of social responsibility can support the comprehensive implementation of soil and water conservation in this type of region.
Thirdly, social benefits reflect the social responsibility and social equity of soil and water conservation projects. Especially in areas with poor natural conditions and single local economic infrastructures, the implementation of water and soil conservation projects can effectively promote the employment of residents, increase the area of basic farmland, and increase the income of workers. Soil and water conservation measures with a high level of science and technology can also promote the improvement of workers’ science and technology knowledge in the relatively closed Mining Economic Zone, to help achieve a positive cycle of economic growth.
Finally, through quantitative modelling, this study emphasizes the importance that the construction of soil and water conservation project in Shendong Mining Area is a systematic project, because it can bring land type transformation, vegetation restoration, residents’ income and technical level improvement, and ecological environment improvement into a virtuous cycle mode. This model also provides strong theoretical support for coal enterprises in the Loess Plateau to continue implementing soil and water conservation.

Author Contributions

Y.G. analyzed the modeling and drafted the manuscript. R.M. and M.W. conducted field research and data processing. G.C. and Y.B. supervised the research, designed the research, put forward opinions in the process of analysis and interpretation, and edited the paper. All authors have read and agreed to the published version of the manuscript.

Funding

This research was funded by National Key R & D Project, grant number 2016YFC501107; Inner Mongolia Autonomous Region Science and Technology Project, grant number 201701025; China Shenhua Shendong Science and Technology Innovation Project, grant number 201791548029; Science and Technology Project of Inner Mongolia Natural Resources Department, grant number 2020 (3).

Acknowledgments

We appreciate anonymous reviewers and their valuable comments. Also, we thank MDPI Editors for the editing and comments.

Conflicts of Interest

The authors declare no conflict of interest.

References

  1. Vargas-Pineda, O.I.; Trujillo-González, J.M.; Torres-Mora, M.A. Supply–Demand of Water Resource of a Basin with High Anthropic Pressure: Case Study Quenane-Quenanito Basin in Colombia. Air Soil Water Res. 2020, 13. [Google Scholar] [CrossRef]
  2. Visser, S.; Keesstra, S.; Maas, G.; de Cleen, M.; Molenaar, C. Soil as a Basis to Create Enabling Conditions for Transitions Towards Sustainable Land Management as a Key to Achieve the SDGs by 2030. Sustainability 2019, 11, 6792. [Google Scholar] [CrossRef] [Green Version]
  3. Kumari, M.K.N.; Sakai, K.; Kimura, S.; Yuge, K.; Gunarathna, M.H.J.P. Classification of Groundwater Suitability for Irrigation in the Ulagalla Tank Cascade Landscape by GIS and the Analytic Hierarchy Process. Agronomy 2019, 9, 351. [Google Scholar] [CrossRef] [Green Version]
  4. Keesstra, S.D.; Bouma, J.; Wallinga, J.; Tittonell, P.; Smith, P. The significance of soils and soil science towards realization of the United Nations Sustainable Development Goals. Soil 2016, 2, 111–128. [Google Scholar] [CrossRef] [Green Version]
  5. Dao, M.; Nguyen, A.; Nguyen, T.; Pham, H.; Nguyen, D.; Tran, Q.; Dao, H.; Nguyen, D.; Dang, H.; Hens, L. A Hybrid Approach Using Fuzzy AHP-TOPSIS Assessing Environmental Conflicts in the Titan Mining Industry along Central Coast Vietnam. Appl. Sci. 2019, 9, 2930. [Google Scholar] [CrossRef] [Green Version]
  6. Keesstra, S.; Mol, G.; Leeuw, J.d.; Okx, J.; Molenaar, C. Soil-Related Sustainable Development Goals: Four Concepts to Make Land Degradation Neutrality and Restoration Work. Land 2018, 7, 133. [Google Scholar] [CrossRef] [Green Version]
  7. Chen, F.; Fu, B.; Xia, J.; Wu, D.; Wu, S.; Zhang, Y.; Sun, H.; Liu, Y.; Fang, X.; Qin, B.; et al. Major advances in studies of the physical geography and living environment of China during the past 70 years and future prospects. Sci. China Earth Sci. 2019, 62, 1665–1701. [Google Scholar] [CrossRef]
  8. Wang, J.; Ping, W.; Qian, Q.; Wang, H. The effects of land subsidence and rehabilitation on soil hydraulic properties in a mining area in the Loess Plateau of China. Catena 2017, 159, 51–59. [Google Scholar] [CrossRef]
  9. Zhen, Q.; Zheng, J.; Zhang, X.; Shao, M. Changes of solute transport characteristics in soil profile after mining at an opencast coal mine site on the Loess Plateau, China. Sci. Total Environ. 2019, 665, 142–152. [Google Scholar] [CrossRef] [PubMed]
  10. Sentas, A.; Karamoutsou, L.; Charizopoulos, N.; Psilovikos, T.; Psilovikos, A.; Loukas, A. The Use of Stochastic Models for Short-Term Prediction of Water Parameters of the Thesaurus Dam, River Nestos, Greece. Proceedings 2018, 2, 634. [Google Scholar] [CrossRef] [Green Version]
  11. Li, P.; Xu, G.; Lu, K.; Zhang, X.; Shi, P.; Bai, L.; Ren, Z.; Pang, G.; Xiao, L.; Gao, H. Runoff change and sediment source during rainstorms in an ecologically constructed watershed on the Loess Plateau, China. Sci. Total Environ. 2019, 664, 968. [Google Scholar] [CrossRef]
  12. Liu, Y.; Chen, X.; Liu, J.; Liu, T.; Cheng, J.; Wei, G.; Lin, Y. Temporal and spatial succession and dynamics of soil fungal communities in restored grassland on the Loess Plateau in China. Land Degrad. Dev. 2019, 30, 1273–1287. [Google Scholar] [CrossRef]
  13. Tian, P.; An, Z.; Zhao, G.; Gao, P.; Li, P.; Sun, W.; Mu, X. Assessing sediment yield and sources using fingerprinting method in a representative catchment of the Loess Plateau, China. Environ. Earth Sci. 2019, 78. [Google Scholar] [CrossRef]
  14. Zheng, C.; Wang, Q. Spatiotemporal variations of reference evapotranspiration in recent five decades in the arid land of Northwestern China. Hydrol. Process. 2014. [Google Scholar] [CrossRef]
  15. Turkeltaub, T.; Jia, X.; Zhu, Y.; Shao, M.-A.; Binley, A. Recharge and Nitrate Transport Through the Deep Vadose Zone of the Loess Plateau: A Regional-Scale Model Investigation. Water Resour. Res. 2018, 54, 4332–4346. [Google Scholar] [CrossRef]
  16. Alamanos, A.; Mylopoulos, N.; Loukas, A.; Gaitanaros, D. An Integrated Multicriteria Analysis Tool for Evaluating Water Resource Management Strategies. Water 2018, 10, 1795. [Google Scholar] [CrossRef] [Green Version]
  17. Gebremeskel, G.; Gebremicael, T.G.; Girmay, A. Economic and environmental rehabilitation through soil and water conservation, the case of Tigray in northern Ethiopia. J. Arid Environ. 2018, 151, 113–124. [Google Scholar] [CrossRef]
  18. Dobson, B.; Wagener, T.; Pianosi, F. How Important Are Model Structural and Contextual Uncertainties when Estimating the Optimized Performance of Water Resource Systems? Water Resour. Res. 2019, 55, 2170–2193. [Google Scholar] [CrossRef]
  19. Al-Badaii, F.; Shuhaimi-Othman, M.; Gasim, M.B. Water Quality Assessment of the Semenyih River, Selangor, Malaysia. J. Chem. 2013, 2013, 1–10. [Google Scholar] [CrossRef] [Green Version]
  20. Kuang, X.; Cao, Y.; Luo, G.; Huang, Y. Responses of Melilotus officinalis Growth to the Composition of Different Topsoil Substitute Materials in the Reclamation of Open-Pit Mining Grassland Area in Inner Mongolia. Materials 2019, 12, 3888. [Google Scholar] [CrossRef] [Green Version]
  21. Jia, L.; Zhao, W.; Zhai, R.; Liu, Y.; Kang, M.; Zhang, X. Regional differences in the soil and water conservation efficiency of conservation tillage in China. Catena 2019, 175, 18–26. [Google Scholar] [CrossRef]
  22. Zhao, J.; Yang, Z.; Govers, G. Soil and water conservation measures reduce soil and water losses in China but not down to background levels: Evidence from erosion plot data. Geoderma 2019, 337, 729–741. [Google Scholar] [CrossRef]
  23. Abdulai, A.; Huffman, W. The Adoption and Impact of Soil and Water Conservation Technology: An Endogenous Switching Regression Application. Land Econ. 2014, 90, 26–43. [Google Scholar] [CrossRef]
  24. Guo, X.M.; Ru, H.; He, B.H.; Shen, P.C.; Li, T.Y. Correlation analysis of soil physicochemical properties under different soil and water conservation biological measures in Three Gorges Reservoir Region. Pratacultural Sci. 2016, 33, 555–563. [Google Scholar]
  25. Zheng, K.; Lang, N.J.; Wen, S.L.; Yuan, C.M. Research of Soil and Water Conservation Biological Measures. Res. Soil Water Conserv. 2003, 2, 73–75, 105. [Google Scholar]
  26. Junjia, C.; Zhibiao, C.; Zhiqiang, C.; Jinxiang, H.; Rentao, Z.; Haibin, C.; Tao, J. Effects of Different Soil and Water Conservation Measures on Available Nutrients and Erodibility Characteristics of Purple Soil in Western Fujian. J. Soil Water Conserv. 2019, 33, 47–52. [Google Scholar]
  27. Wang, Y.; Peng, B.; Wei, G.; Elahi, E. Comprehensive Evaluation and Spatial Difference Analysis of Regional Ecological Carrying Capacity: A Case Study of the Yangtze River Urban Agglomeration. Int. J. Environ. Res. Public Health 2019, 16, 3499. [Google Scholar] [CrossRef] [Green Version]
  28. Huang, X.; Wang, L.; Lu, Q. Vulnerability Assessment of Soil and Water Loss in Loess Plateau and Its Impact on Farmers’ Soil and Water Conservation Adaptive Behavior. Sustainability 2018, 10, 4773. [Google Scholar] [CrossRef] [Green Version]
  29. Wang, W.; Sun, Y.; Wu, J. Environmental Warning System Based on the DPSIR Model: A Practical and Concise Method for Environmental Assessment. Sustainability 2018, 10, 1728. [Google Scholar] [CrossRef] [Green Version]
  30. Ma, K.; Zhang, Y.; Ruan, M.; Guo, J.; Chai, T. Land Subsidence in a Coal Mining Area Reduced Soil Fertility and Led to Soil Degradation in Arid and Semi-Arid Regions. Int. J. Environ. Res. Public Health 2019, 16, 3929. [Google Scholar] [CrossRef] [Green Version]
  31. Luan, H.; Lin, H.; Jiang, Y.; Wang, Y.; Liu, J.; Wang, P. Risks Induced by Room Mining Goaf and Their Assessment: A Case Study in the Shenfu-Dongsheng Mining Area. Sustainability 2018, 10, 631. [Google Scholar] [CrossRef] [Green Version]
  32. Cui, G.; Zhang, X.; Zhang, Z.; Cao, Y.; Liu, X. Comprehensive Land Carrying Capacities of the Cities in the Shandong Peninsula Blue Economic Zone and their Spatio-Temporal Variations. Sustainability 2019, 11, 439. [Google Scholar] [CrossRef] [Green Version]
  33. Ma, C.; Cheng, X.; Yang, Y.; Zhang, X.; Guo, Z.; Zou, Y. Investigation on Mining Subsidence Based on Multi-Temporal InSAR and Time-Series Analysis of the Small Baseline Subset—Case Study of Working Faces 22201-1/2 in Bu’ertai Mine, Shendong Coalfield, China. Remote Sens. 2016, 8, 951. [Google Scholar] [CrossRef] [Green Version]
  34. Li, Y.; Hu, T.; Zheng, G.; Shen, L.; Fan, J.; Zhang, D. An Improved Simplified Urban Storm Inundation Model Based on Urban Terrain and Catchment Modification. Water 2019, 11, 2355. [Google Scholar] [CrossRef] [Green Version]
  35. Paliaga, G.; Giostrella, P.; Faccini, F. Terraced landscape as cultural and environmental heritage at risk: An example from Portofino park (Italy). Annales-Anali za Istrske Mediteranske Studije-Series Historia et Sociologia 2016, 26, 513–522. [Google Scholar] [CrossRef]
  36. Paliaga, G.; Luino, F.; Turconi, L.; De Graff, J.V.; Faccini, F. Terraced Landscapes on Portofino Promontory (Italy): Identification, Geo-Hydrological Hazard and Management. Water 2020, 12, 435. [Google Scholar] [CrossRef] [Green Version]
  37. Tarolli, P.; Preti, F.; Romano, N. Terraced landscapes: From an old best practice to a potential hazard for soil degradation due to land abandonment. Anthropocene 2014, 6, 10–25. [Google Scholar] [CrossRef]
  38. Karamage, F.; Zhang, C.; Liu, T.; Maganda, A.; Isabwe, A. Soil Erosion Risk Assessment in Uganda. Forests 2017, 8, 52. [Google Scholar] [CrossRef]
  39. Zhang, X.; Zhao, W.; Wang, L.; Liu, Y.; Feng, Q.; Fang, X.; Liu, Y. Distribution of Shrubland and Grassland Soil Erodibility on the Loess Plateau. Int. J. Environ. Res. Public Health 2018, 15, 1193. [Google Scholar] [CrossRef] [Green Version]
  40. Bai, L.; Wang, H.; Huang, N.; Du, Q.; Huang, Y. An Environmental Management Maturity Model of Construction Programs Using the AHP-Entropy Approach. Int. J. Environ. Res. Public Health 2018, 15, 1317. [Google Scholar] [CrossRef] [Green Version]
  41. Scolozzi, R.; Morri, E.; Santolini, R. Delphi-based change assessment in ecosystem service values to support strategic spatial planning in Italian landscapes. Ecol. Indic. 2012, 21, 134–144. [Google Scholar] [CrossRef]
  42. Ocampo, L.; Ebisa, J.A.; Ombe, J.; Escoto, M.G. Sustainable ecotourism indicators with fuzzy Delphi method—A Philippine perspective. Ecol. Indic. 2018, 93, 874–888. [Google Scholar] [CrossRef]
  43. Cholissodin, I.; Pambudi, M.P.; Dewi, C. Geometric time variant particle swarm optimization with fuzzy—AHP for pomology plant recommendation. In Proceedings of the International Conference on Advanced Computer Science & Information Systems, Bali, Indonesia, 28–29 October 2017; pp. 121–126. [Google Scholar]
  44. Jian-Yue, H.U.; Yan, H.S.; Liu, N.N. Computing Rank Weights in AHP of Simulated Annealing-particle Swarm Optimization Algorithm. Comput. Technol. Dev. 2012, 6, 14–18. [Google Scholar]
  45. Popović, M.J.; Gušavac, B.Š.A.c.; Kati´c, A.S. Multiattribute Methods as a Means for Solving Ecological Problems in Water Resources—Lake Pollution. In Advances in Operational Research in the Balkans; Mladenović, N., Sifaleras, A., Kuzmanović, M., Eds.; Springer: Cham, Switzerland, 2020. [Google Scholar]
  46. Zhang, Y.; Guan, K.; Wu, Z. Study on evaluation model of cross-border e-commerce talent based on AHP-PSO. In Proceedings of the 2016 2nd International Conference on Information Management (ICIM), London, UK, 7–8 May 2016; pp. 1–5. [Google Scholar]
  47. Goyal, R.K.; Kaushal, S.; Sangaiah, A.K. The utility based non-linear fuzzy AHP optimization model for network selection in heterogeneous wireless networks. Appl. Soft Comput. 2018, 67, 800–811. [Google Scholar] [CrossRef]
  48. Jhariya, D.C.; Kumar, T.; Pandey, H.K. Watershed Prioritization Based on Soil and Water Hazard Model Using Remote Sensing, Geographical Information System and Multi-Criteria Decision Analysis Approach. Geocarto Int. 2020, 35, 188–208. [Google Scholar] [CrossRef]
  49. Sentas, A.; Psilovikos, A.; Psilovikos, T. Statistical Analysis and Assessment of Water Quality Parameters in Pagoneri, River Nestos. Eur. Water 2016, 55, 115–124. [Google Scholar]
  50. Zhifeng, P. Inner Mongolia Statistical Yearbook. Available online: http://tj.nmg.gov.cn:18080/datashow/index.htm (accessed on 20 September 2019).
  51. Yongjie, W. Shanxi Statistical Yearbook. Available online: http://tjj.shanxi.gov.cn/tjsj/ (accessed on 20 September 2019).
  52. Ye, Z. Statistical Yearbook of Shaanxi Province. Available online: http://tjj.shaanxi.gov.cn/site/1/html/126/more.htm (accessed on 20 September 2019).
  53. Chen, G.; Wang, M.; Liu, Z.; Chi, W. The Biogeophysical Effects of Revegetation around Mining Areas: A Case Study of Dongsheng Mining Areas in Inner Mongolia. Sustainability 2017, 9, 628. [Google Scholar] [CrossRef] [Green Version]
  54. Teknomo, K. Analytic Hierarchy Process (AHP) Tutorial. Available online: https://people.revoledu.com/kardi/tutorial/AHP/AHP-Resources.htm (accessed on 20 May 2018).
  55. Han, Y.; Wang, Z.; Lu, X.; Hu, B. Application of AHP to Road Selection. ISPRS Int. J. Geo-Inf. 2020, 9, 86. [Google Scholar] [CrossRef] [Green Version]
  56. Abdel-Basset, M.; Mohamed, M.; Smarandache, F. An Extension of Neutrosophic AHP–SWOT Analysis for Strategic Planning and Decision-Making. Symmetry 2018, 10, 116. [Google Scholar] [CrossRef] [Green Version]
  57. Martín-Fernández, S.; Gómez-Serrano, A.; Martínez-Falero, E.; Pascual, C. Comparison of AHP and a Utility-Based Theory Method for Selected Vertical and Horizontal Forest Structure Indicators in the Sustainability Assessment of Forest Management in the Sierra de Guadarrama National Park, Madrid Region. Sustainability 2018, 10, 4101. [Google Scholar] [CrossRef] [Green Version]
  58. Nguyen, T.T.N.; Liu, C.C. A New Approach Using AHP to Generate Landslide Susceptibility Maps in the Chen-Yu-Lan Watershed, Taiwan. Sensors 2019, 19, 505. [Google Scholar] [CrossRef] [PubMed] [Green Version]
  59. He, H.; Hu, D.; Sun, Q.; Zhu, L.; Liu, Y. A Landslide Susceptibility Assessment Method Based on GIS Technology and an AHP-Weighted Information Content Method: A Case Study of Southern Anhui, China. ISPRS Int. J. Geo-Inf. 2019, 8, 266. [Google Scholar] [CrossRef] [Green Version]
  60. Hu, X.; Si, M.; Luo, H.; Guo, M.; Wang, J. The Method and Model of Ecological Technology Evaluation. Sustainability 2019, 11, 886. [Google Scholar] [CrossRef] [Green Version]
  61. Martín, C.J.; Carnero, M.C. Evaluation of Sustainable Development in European Union Countries. Appl. Sci. 2019, 9, 4880. [Google Scholar] [CrossRef] [Green Version]
  62. Kennedy, J.; Eberhart, R. Particle swarm Optimization. In Proceedings of the IEEE International Conference on Neural Networks, Perth, Australia, 27 November–1 December 1995; pp. 1942–1948. [Google Scholar]
  63. Li, Z.K.; Ning, L. Fuzzy analytic hierarchy process inspired particle swarm optimization and its application. In Proceedings of the 29th Chinese Control Conference, Beijing, China, 29–31 July 2010; pp. 5696–5700. [Google Scholar]
  64. Umar, A.; Shi, Z.; Khlil, A.; Farouk, Z.I.B. Developing a New Robust Swarm-Based Algorithm for Robot Analysis. Mathematics 2020, 8, 158. [Google Scholar] [CrossRef] [Green Version]
  65. Xu, Z.; Zhang, Y.; Yang, J.; Liu, F.; Bi, R.; Zhu, H.; Lv, C.; Yu, J. Effect of Underground Coal Mining on the Regional Soil Organic Carbon Pool in Farmland in a Mining Subsidence Area. Sustainability 2019, 11, 4961. [Google Scholar] [CrossRef] [Green Version]
  66. Wang, Y.; Zhang, T.; Yao, S.; Deng, Y. Spatio-temporal Evolution and Factors Influencing the Control Efficiency for Soil and Water Loss in the Wei River Catchment, China. Sustainability 2019, 11, 216. [Google Scholar] [CrossRef] [Green Version]
  67. Jia, L.; Zhao, W.; Fu, B.; Daryanto, S.; Wang, S.; Liu, Y.; Zhai, R. Effects of minimum soil disturbance practices on controlling water erosion in China’s slope farmland: A meta-analysis. Land Degrad. Dev. 2019, 30, 706–716. [Google Scholar] [CrossRef]
  68. Li, Z.; Nie, X.; Chang, X.; Liu, L.; Sun, L.; Wang, X. Characteristics of Soil and Organic Carbon Loss Induced by Water Erosion on the Loess Plateau in China. PLoS ONE 2016, 11, e0154591. [Google Scholar] [CrossRef]
  69. Shi, H.; Shao, M. Soil and water loss from the Loess Plateau in China. J. Arid Environ. 2000, 45, 9–20. [Google Scholar] [CrossRef]
  70. Yong, X.; Bo, Y.; Liu, G.; Liu, P. Topographic differentiation simulation of crop yield and soil and water loss on the Loess Plateau. J. Geogr. Sci. 2009, 19, 331–339. [Google Scholar]
  71. Suo, A.N.; Li, J.C.; Wang, T.M.; Ge, J.P. Effects of land use changes on river basin soil and water loss in loess plateau. J. Hydraul. Eng. 2008, 39, 767–772. [Google Scholar]
  72. Peng, J.; Wu, J.; Yin, H.; Li, Z.; Chang, Q.; Mu, T. Rural Land Use Change during 1986-2002 in Lijiang, China, Based on Remote Sensing and GIS Data. Sensors 2008, 8, 8201–8223. [Google Scholar] [CrossRef] [Green Version]
  73. Schempf, W.M.; Jacobs, D.F. Hardwood Species Show Wide Variability in Response to Silviculture during Reclamation of Coal Mine Sites. Forests 2020, 11, 72. [Google Scholar] [CrossRef] [Green Version]
  74. Lee, H.-S.; Park, E.-Y. Developing a Landscape Sustainability Assessment Model Using an Analytic Hierarchy Process in Korea. Sustainability 2019, 12, 301. [Google Scholar] [CrossRef] [Green Version]
  75. Yu, B.; Wu, S.; Jiao, Z.; Shang, Y. Multi-Objective Optimization Design of an Electrohydrostatic Actuator Based on a Particle Swarm Optimization Algorithm and an Analytic Hierarchy Process. Energies 2018, 11, 2426. [Google Scholar] [CrossRef] [Green Version]
  76. Chan, P.; Lee, M.H. Prioritizing Sustainable City Indicators for Cambodia. Urban Sci. 2019, 3, 104. [Google Scholar] [CrossRef] [Green Version]
  77. Rodrigo-Comino, J.; Keesstra, S.; Cerdà, A. Soil Erosion as an Environmental Concern in Vineyards: The Case Study of Celler del Roure, Eastern Spain, by Means of Rainfall Simulation Experiments. Beverages 2018, 4, 31. [Google Scholar] [CrossRef] [Green Version]
  78. Feng, S.; Hou, W.; Chang, J. Changing Coal Mining Brownfields into Green Infrastructure Based on Ecological Potential Assessment in Xuzhou, Eastern China. Sustainability 2019, 11, 2252. [Google Scholar] [CrossRef] [Green Version]
  79. Cerdà, A.; Rodrigo-Comino, J.; Giménez-Morera, A.; Novara, A.; Pulido, M.; Kapović-Solomun, M. Policies can help to apply successful strategies to control soil and water losses. The case of chipped pruned branches (CPB) in Mediterranean citrus plantations. Land Use Policy 2018, 75, 734–745. [Google Scholar]
  80. Cerdà, A.; Ackermann, O.; Terol, E.; Rodrigo-Comino, J. Impact of Farmland Abandonment on Water Resources and Soil Conservation in Citrus Plantations in Eastern Spain. Water 2019, 11, 824. [Google Scholar] [CrossRef] [Green Version]
  81. Tian, Y.; Liu, B.; Hu, Y.; Xu, Q.; Qu, M.; Xu, D. Spatio-Temporal Land-Use Changes and the Response in Landscape Pattern to Hemeroby in a Resource-Based City. ISPRS Int. J. Geo-Inf. 2020, 9, 20. [Google Scholar] [CrossRef] [Green Version]
  82. Zhao, T.; Zhao, Y.; Li, M.-H. Landscape Performance for Coordinated Development of Rural Communities & Small-Towns Based on “Ecological Priority and All-Area Integrated Development”: Six Case Studies in East China’s Zhejiang Province. Sustainability 2019, 11, 4096. [Google Scholar] [CrossRef] [Green Version]
  83. Du, T.; Vejre, H.; Fertner, C.; Xiang, P. Optimisation of Ecological Leisure Industrial Planning Based on Improved GIS-AHP: A Case Study in Shapingba District, Chongqing, China. Sustainability 2019, 12, 33. [Google Scholar] [CrossRef] [Green Version]
  84. Buta, M.; Blaga, G.; Paulette, L.; Păcurar, I.; Roșca, S.; Borsai, O.; Grecu, F.; Sînziana, P.E.; Negrușier, C. Soil Reclamation of Abandoned Mine Lands by Revegetation in Northwestern Part of Transylvania: A 40-Year Retrospective Study. Sustainability 2019, 11, 3393. [Google Scholar] [CrossRef] [Green Version]
Figure 1. Effect of soil and water conservation measures in Shendong Mining Area. Restoration status of subsidence Valley (a) and slope (b).
Water 12 01955 g001
Figure 2. The location of the mining areas.
Water 12 01955 g002
Figure 3. Evaluation to the comprehensive benefits system of soil and water conservation.
Water 12 01955 g003
Figure 4. Benefit score of soil and water conservation in Shendong Coal Mining Subsidence Area from 2014 to 2018. (a) Three benefit growth curves; (b) Comprehensive benefit growth curve. ** represents statistical significance at a 0.05 level.
Water 12 01955 g004
Table 1. Evaluation index system of soil and water conservation measures.
Indicator LayerComputational EquationData Sources
Slag retention in mining areaIntercepting and discarding an amount of slag every yearIII
Soil erosion rateTotal soil erosion per unit time and areaII
Mining area subsidence rateSurface subsidence area of the mining area/total area of mining areaII
Forest and grass coverage(Forest land area + grassland area)/total area of mining areaII
Soil erosion managementCompleted treatment area/total area of soil erosionII
Coal gangue emissionGangue discharged from 14 coal mines and 11 coal preparation plantsIII
Unit GDP energy consumptionTotal energy consumption (ton of standard coal)/industrial added valueI
Soil conservation measure investmentAnnual investment of projects for soil erosion controlIII
Mining intensityAmount of coal mined per unit area per yearIII
Recovery rateRaw coal/recoverable reserves of coal mineIII
Production and investment ratioOutput value of raw coal/(investment in ecological and safe production)I
Per capita GDPGDP/population (including migrant workers) of the mining areaI
Land utilizationArea of land improvement/total area of land in mining areaII
Environmental population capacityPopulation capacity standard of arid area/usable land areaII
Compulsory education rateNumber of workers graduated from junior high school/total number of workersI
Engel coefficientTotal food expenditure/total personal consumption expenditureI
Per capita basic farmlandBasic farmland area/number of farmers in mining areaI
Labor utilization rateRatio of employment population to total labor population in mining areaIII
Table 2. Random Consistency Index (RI).
n123456789
RI000.520.891.121.261.361.411.46
Table 3. Primitive weight matrix of comprehensive benefits.
Benefit U1U2U3
U11.0003.0003.000
U20.3331.0000.333
U30.3333.0001.000
Table 4. Revised weight matrix of comprehensive benefits.
Benefit U1U2U3wi
U13.04242.97650.58870.5887
U210.38870.14230.1423
U32.572510.2690.269
Table 5. Revised weight matrix of ecological benefits.
Indicator U11U12U13U14U15U16wi
U1110.24470.35650.27630.17930.5190.0461
U124.085913.93290.21210.27322.99980.1512
U132.80540.254310.31620.36543.02390.1011
U143.61944.71453.162910.55364.0050.2829
U155.5783.66022.73651.806314.93010.3588
U161.92671/30.33070.24970.202810.0599
Table 6. Economic benefit modified weight matrix.
Indicator U21U22U23U24U25U26wi
U2110.27924.0220.3670.28410.24620.0711
U223.581215.03981.98660.46020.33730.1708
U230.24860.198410.27271/90.2630.0347
U242.72480.50343.667110.75650.20730.1233
U253.52012.173191.321910.42030.2355
U264.06232.96453.80194.82392.37910.3645
Table 7. Revised matrix of social benefit weights.
Indicator U31U32U33U34U35U36wi
U3110.18360.48582.95370.52472.05950.1188
U325.447213.07142.01792.02213.13590.3583
U332.05870.325612.13091.04592.17820.1784
U340.33860.49560.469310.45660.33070.07
U351.90570.49450.95612.190310.63980.1523
U360.48550.31890.45913.02421.56310.1222
Table 8. Weight table for group decision-making in Shendong Coal Mining Subsidence Area.
Benefit LayerIndicator LayerIndex CodeGlobal WeightPeer WeightSynthesize
Ranking
20142015201620172018
Ecological Benefit (U1)The Quantity of Slag in Mining AreaU110.02710.0461130.100.900.000.401.00
Soil erosion rateU120.0890.151240.000.820.230.961.00
Subsidence Rate of Mining AreaU130.05950.101150.000.320.770.791.00
Forest and Grass CoverageU140.16660.282920.000.200.340.491.00
Soil Erosion ControlU150.21120.358810.210.000.250.881.00
Coal Gangue DischargeU160.03530.059990.000.630.131.000.75
Economic Benefits (U2)Energy Consumption Per Unit GDPU210.01010.0711170.140.000.290.571.00
Energy Consumption Per Unit GDPU220.02430.1708140.000.170.700.741.00
Mining IntensityU230.00490.0347180.000.300.450.601.00
Percentage RecoveryU240.01750.1233160.330.000.500.831.00
Investment RatioU250.03350.2355100.000.270.450.821.00
GDP Per CapitaU260.05190.364560.000.690.791.000.43
Social Benefit (U3)Land Use RateU310.0320.1188120.000.060.640.801.00
Environmental Population CapacityU320.09640.358330.000.200.600.601.00
Compulsory Education Popularization RateU330.0480.178470.000.200.560.861.00
Engel CoefficientU340.01880.07150.120.070.000.761.00
Basic Farmland Per CapitaU350.0410.152381.001.000.500.000.50
Labor Utilization RateU360.03290.1222110.000.620.320.781.00

