Article

Historical Evolution of Sources and Pollution Levels of Heavy Metals in the Sediment of the Shuanglong Reservoir, China

1
School of Agricultural Engineering and Food Science, Shandong University of Technology, Zibo 255049, China
2
School of geography science, Nanjing Normal University, Jiangsu 210046, China
3
School of Resources and Environmental Engineering, Shandong University of Technology, Zibo 255049, China
*
Author to whom correspondence should be addressed.
Water 2020, 12(7), 1855; https://doi.org/10.3390/w12071855
Submission received: 10 June 2020 / Revised: 20 June 2020 / Accepted: 25 June 2020 / Published: 28 June 2020
(This article belongs to the Section Water Quality and Contamination)

Abstract

:
In this study, the concentrations of seven heavy metals (Cr, Ni, Cu, Zn, As, Hg, and Pb) and Pb isotope in a sediment core from the Shuanglong reservoir, Southwestern China, were investigated. Based on the constant rate of supply (CRS) model, the age span of a 60 cm sediment sample was determined to range from the years 1944 to 2015. Combined with chronology and heavy metal content, the evolution of the sources and pollution levels of heavy metals showed a changing trend composed of various stages. The sources of heavy metals transitioned from natural origins in 1944–1964 to industrial origins in 1965–2004. The subsequent reduction in heavy metal content was mainly due to the vigorous implementation of environmental protection policies from 2005 to 2012. In recent years (2013–2015), the heavy metal content has increased due to frequent human activity. Principal component analysis (PCA), correlation analysis, and the coefficient of variation (CV) analysis indicated that Cr, Ni, Cu, Zn, and As were derived from natural processes, Pb mainly came from automobile manufacturing, and Hg was mainly from industrial sources. The values of the geo-accumulation index (Ig), single pollution index (Pi), and single potential ecological risk index (Er) showed that the contamination of Hg and Pb was slight to moderate. Moreover, the values of the potential ecological risk index (RI), pollution load index (PLI), and Nemerow index (PN) indicated that the Shuanglong reservoir is under low ecological risk.

1. Introduction

Reservoirs are artificial freshwater ecosystems where pollutants can accumulate in the sediment through multiple pathways, including surface runoff, underground runoff, and atmospheric deposition. Therefore, reservoir sediments are large pools of environmental pollutants and important archives for recording environmental changes in the watershed [1,2,3]. Heavy metals in sediments may have a variety of sources, including rock weathering, traffic exhaust, domestic sewage, chemical fertilizers and pesticides, and wastewater and other wastes from industrial and mining activities [4,5,6]. Heavy metals are characterized by high toxicity, difficult degradation, bio-accumulation and amplification. When heavy metals enter reservoirs, some dissolve in water and others accumulate in sediments. When the external environment changes, heavy metals in sediments are easily released into the water, causing secondary pollution and serious ecological harm to organisms and aquatic systems [7]. Thus, it is of great significance to study the influence of human activities and natural processes on the migration and fate of heavy metals [8,9].
The Dianchi watershed is located in the central Yunnan–Guizhou plateau and southwest Kunming, which is the most developed and densely populated area in Yunnan Province. In the last 30 years, unreasonable land use has seriously affected the soil quality in the region and has become the dominant factor of nonpoint source pollution in the Dianchi watershed [10]. The Shuanglong reservoir belongs to the Dongda River small basin of the Dianchi watershed and is mainly used for surface drinking-water supply, as well as irrigation, breeding, power generation, and flood control. Compared with sediments in large basins, sediments in small basins are more sensitive to changes in the surrounding environment, and can therefore be used to reconstruct paleo-environmental information over long timescales (102–103 years) and short timescales (100 years). Additionally, compared with large watersheds, small watersheds are capable of tending to human activities and natural factors. Accordingly, the disturbed small watersheds contribute more to the downstream aquatic environment than large ones [11]. Recently, with the rapid development of urbanization, industrialization, and agriculturalization, the accumulation of heavy metals in the sediment of the Shuanglong reservoir has caused harm to the aquatic ecosystem. Moreover, heavy metals can enter the human body through the food chain and thereby threaten human health. Therefore, the control and treatment of heavy metal pollution in reservoirs, especially typical water-supply reservoirs in small basins, is urgently needed.
The sources and pollution levels of heavy metals in sediments must be understood in order to protect aquatic ecosystems. Chassiot et al. (2019) [12] found that the contamination levels of Ag, Cr, Cu, Hg, and Pb were severe in sediments of the Saint Charles River and the Joseph-Samson reservoir by using enrichment factors (EF), the geo-accumulation index (Ig), and the metallic pollution index (MPI). Combining the historical literature and multivariate statistics (e.g., principal component analysis/factor analysis (PAC/FA)), it was found that Pb and Ag exhibited different patterns, suggesting that the pollution source was anthropogenic activities. Furthermore, Christophoridis et al. (2019) [13] showed that human activities and natural processes could affect the input of heavy metals. The more concentrated the human population, the higher the degree of heavy metal pollution in sediments. Thus, the heavy metal content in sediments can reflect the development of local society. In recent years, the pollution factor (CF), pollution load index (PLI), single potential ecological risk index (Er), potential ecological risk index (RI), single pollution index (Pi), EF, and Ig have been widely used to evaluate the pollution level of heavy metals in sediments [14,15,16,17]. Additionally, the Nemerow index (PN) has also been used to evaluate the pollution level of the soil environment. This index has mainly been applied for the spatial analysis of heavy metals in sediments, however, few studies have used PN to analyze pollution levels in sediment cores at continuous depths [18]. Besides, many studies have focused on the nutrient salts, organic matter, and heavy metals in sediments of the Dianchi watershed [19,20], and sufficient reference data on heavy metals are not available for small basins, especially in typical water-supply reservoirs. Therefore, the main objectives of this study were to (1) analyze the profile distribution of heavy metals (Cr, Ni, Cu, Zn, As, Hg, and Pb) in the sediment of typical water-supply reservoirs in a small watershed, (2) assess the contamination levels of heavy metals in the sediment using multiple assessment indices (Ig, PLI, Pi, Er, RI, and PN), (3) infer the source of heavy metals using statistical analysis (principal component analysis (PCA), correlation analysis, and coefficient of variation (CV) analysis) and historical data in order to provide a valuable tool to improve the management of aquatic environments and implement water and soil conservation.

2. Materials and Methods

2.1. Study Area

The Shuanglong reservoir is a typical water-supply reservoir which was built in 1956. It is located in Jinning County, Kunming, China, and belongs to the Dianchi watershed. The reservoir has a total watershed area of 54 km2, a storage capacity of 1216 m3, and a maximum water depth of 19 m. The terrain of the reservoir area is relatively flat, with a length of 1.5 km and a width of 80–100 m. The Shuanglong drainage network is one of the main water systems which flows into Dianchi Lake. Generally, the rainy season is from June to October, which accounts for about 75% of the annual rainfall, and the maximum annual rainfall is 1243.8 mm. The watershed belongs to a subtropical monsoon climate. The soil types are dominated by red soil, purple soil, and paddy soil. The agricultural land is mainly used for planting corn, beans, and rice. Early development and serious anthropogenic destruction have resulted in the scarcity of native vegetation, with the major vegetation types currently being Yunnan pine forest, shrub initiation, and shrub-grassland.

2.2. Sample Collection

Three sediment cores (SR1, SR2, and SR3), each with a length of 60 cm, were collected from the Shuanglong reservoir in August 2017 using a gravity core sampler (Figure 1). Samples were stored at ultra-low temperature (−50 °C). Subsequently, the sediment cores were divided into 1 cm intervals and then placed in sealed bags for freeze-drying. After the pretreatment, core SR3, which was located far away from Dongda River, was selected for further analysis, since the inflowing rivers will affect the heavy metal concentration of the sediment.

2.3. Sample Analysis

2.3.1. Isotopic Determination and Dating

The pre-treated sediment samples were ground and passed through a 100-mesh sieve before being placed in plastic containers. After the sample had been sealed for 20 days, the radioactivity of 210Pb was measured with an HPGe γ-ray detector (EG&ORTEC, GWL-120-15, Oak Ridge, TN, USA) with a determination time of 40,000 s. The 226Ra activity was detected by its emitted γ-rays at an energy of 351.9 keV for its daughter isotope 214Pb, the 210Pb activity was calculated from the peak area of 46.5 keV, and the 210Pb excess (210Pbex) was calculated by subtracting the 226Ra activity from the 210Pb activity.
The dating methods for the sediment cores based on 210Pbex activity mainly included the constant initial concentration (CIC) model and the constant rate of supply (CRS) model. The 210Pbex activity is relatively volatile in the Dianchi watershed, presumably due to anthropogenic activities in recent decades. Thus, the CRS model was adopted to establish the chronological sequence of the sedimentary cores [21]. The equation of the CRS model is as follows
T m = λ 1 ln ( A 0 A m 1 )
where T m is the year corresponding to the mass depth m, λ is the decay constant of 210Pb (0.03114 y−1), A 0 is the 210Pbex accumulation of the whole sediment core (Bq/cm2), and A m is the 210Pbex accumulation below the mass depth m (Bq/cm2).

2.3.2. Determination of Heavy Metals

Sediment samples (ca. 0.1 g) were digested in polyethylene containers containing a mixture of HClO4, HCl, and HF (2.5 mL: 7.5 mL: 2 mL). The digested samples were then analyzed using inductively coupled plasma mass spectrometry (Agilent, 7500ce, Tokyo, Japan) to obtain the concentrations of heavy metals (Cr, Ni, Cu, Zn, and Pb) in the sediment. All samples were analyzed thrice in the digesting procedure to obtain analytical precision and accuracy [17]. Concentrations of As and Hg were determined using an atomic fluorescence spectrometer (CAGS, XGY-1011A, Langfang, Hebei, China). Each sample was tested with three repetitions and the average value was used as the final measurement value.

2.3.3. Determination of Physicochemical Parameters of Sediment

Sediment samples (ca. 10 g) were placed in beakers (50 mL). Then, distilled water (25 mL) was added and the mixture was stirred with a glass rod for 30 min to disperse the soil completely. Subsequently, the pH was measured with a calibrated acidimeter and the pH value was read after 15–20 min. The total organic carbon (TOC) was determined as the difference between the total carbon (TC) and inorganic carbon (IC). The measurements were made using a total organic carbon analyzer (Shimadzu, TOC-LCCSH, Tokyo, Japan).

2.4. Statistical Analysis

All experimental data were preliminarily processed using the Microsoft Excel 2017 software, and Pearson correlation analysis and PCA were performed using the SPSS 20.0 software (IBM, Armonk, NY, USA). The ArcGIS 10.2 (Esri, Redlands, CA, USA) and Ai 2018 software (Adobe, San Jose, CA, USA) was used to draw figures and charts.

2.5. Pollution Indices

2.5.1. Geo-accumulation Index ( I g )

The geo-accumulation index was first proposed by Muller (1969) [22], then of the Institute of Sediment Research, University of Heidelberg, Germany. It is an evaluation index that is widely used to study heavy metal pollution in modern sediments [23]. The formula for its calculation is as follows
I g = log 2 C i / 1.5 B i
where C i is the measured content of heavy metal i in the sediment, B i is the geochemical background content of heavy metal i (Yunnan soil background values, Table 1). According to the values of Ig, the pollution levels are divided into seven grades (Table 2).

2.5.2. Single Pollution Index (Pi) and Pollution Load Index (PLI)

The single pollution index can be used to determine the heavy metals that have the greatest impact on the sedimentary environment. The pollution load index has been used to assess the ecological risks caused by the accumulation of heavy metals in sediments [24]. These indices were calculated as follows
P i = C i / B i
P L I = ( i = 1 n P i ) 1 / n
where n is the number of investigated elements. The pollution level of heavy metals in sediments were classified following the classification shown in Table 2.

2.5.3. Potential Ecological Risk Index (RI)

The potential ecological risk index, which was first put forward by Hakanson (1980) [25], takes into account not only the impact of heavy metals on the ecology, but also the impact of the bio-toxicity level of heavy metals [26]. The calculation formula is
R I = i = 1 n E r i = i = 1 n T r i × P i
where Er is a single potential ecological risk index, and T r i is the toxic response coefficient of heavy metal i (Table 1).

2.5.4. Nemerow Index (PN)

The Nemerow index was used to comprehensively evaluate the composite pollution condition of different heavy metals in sediments [18]. The index was calculated using the following equation
P N = [ ( P h 2 + P h m a x 2 ) / 2 ] 1 / 2
where P h is the average single pollution index of the investigated elements at the depth of h, and P h m a x is the maximum single pollution index among the heavy metals investigated at the depth of h.

3. Results and Discussion

3.1. Core Chronology

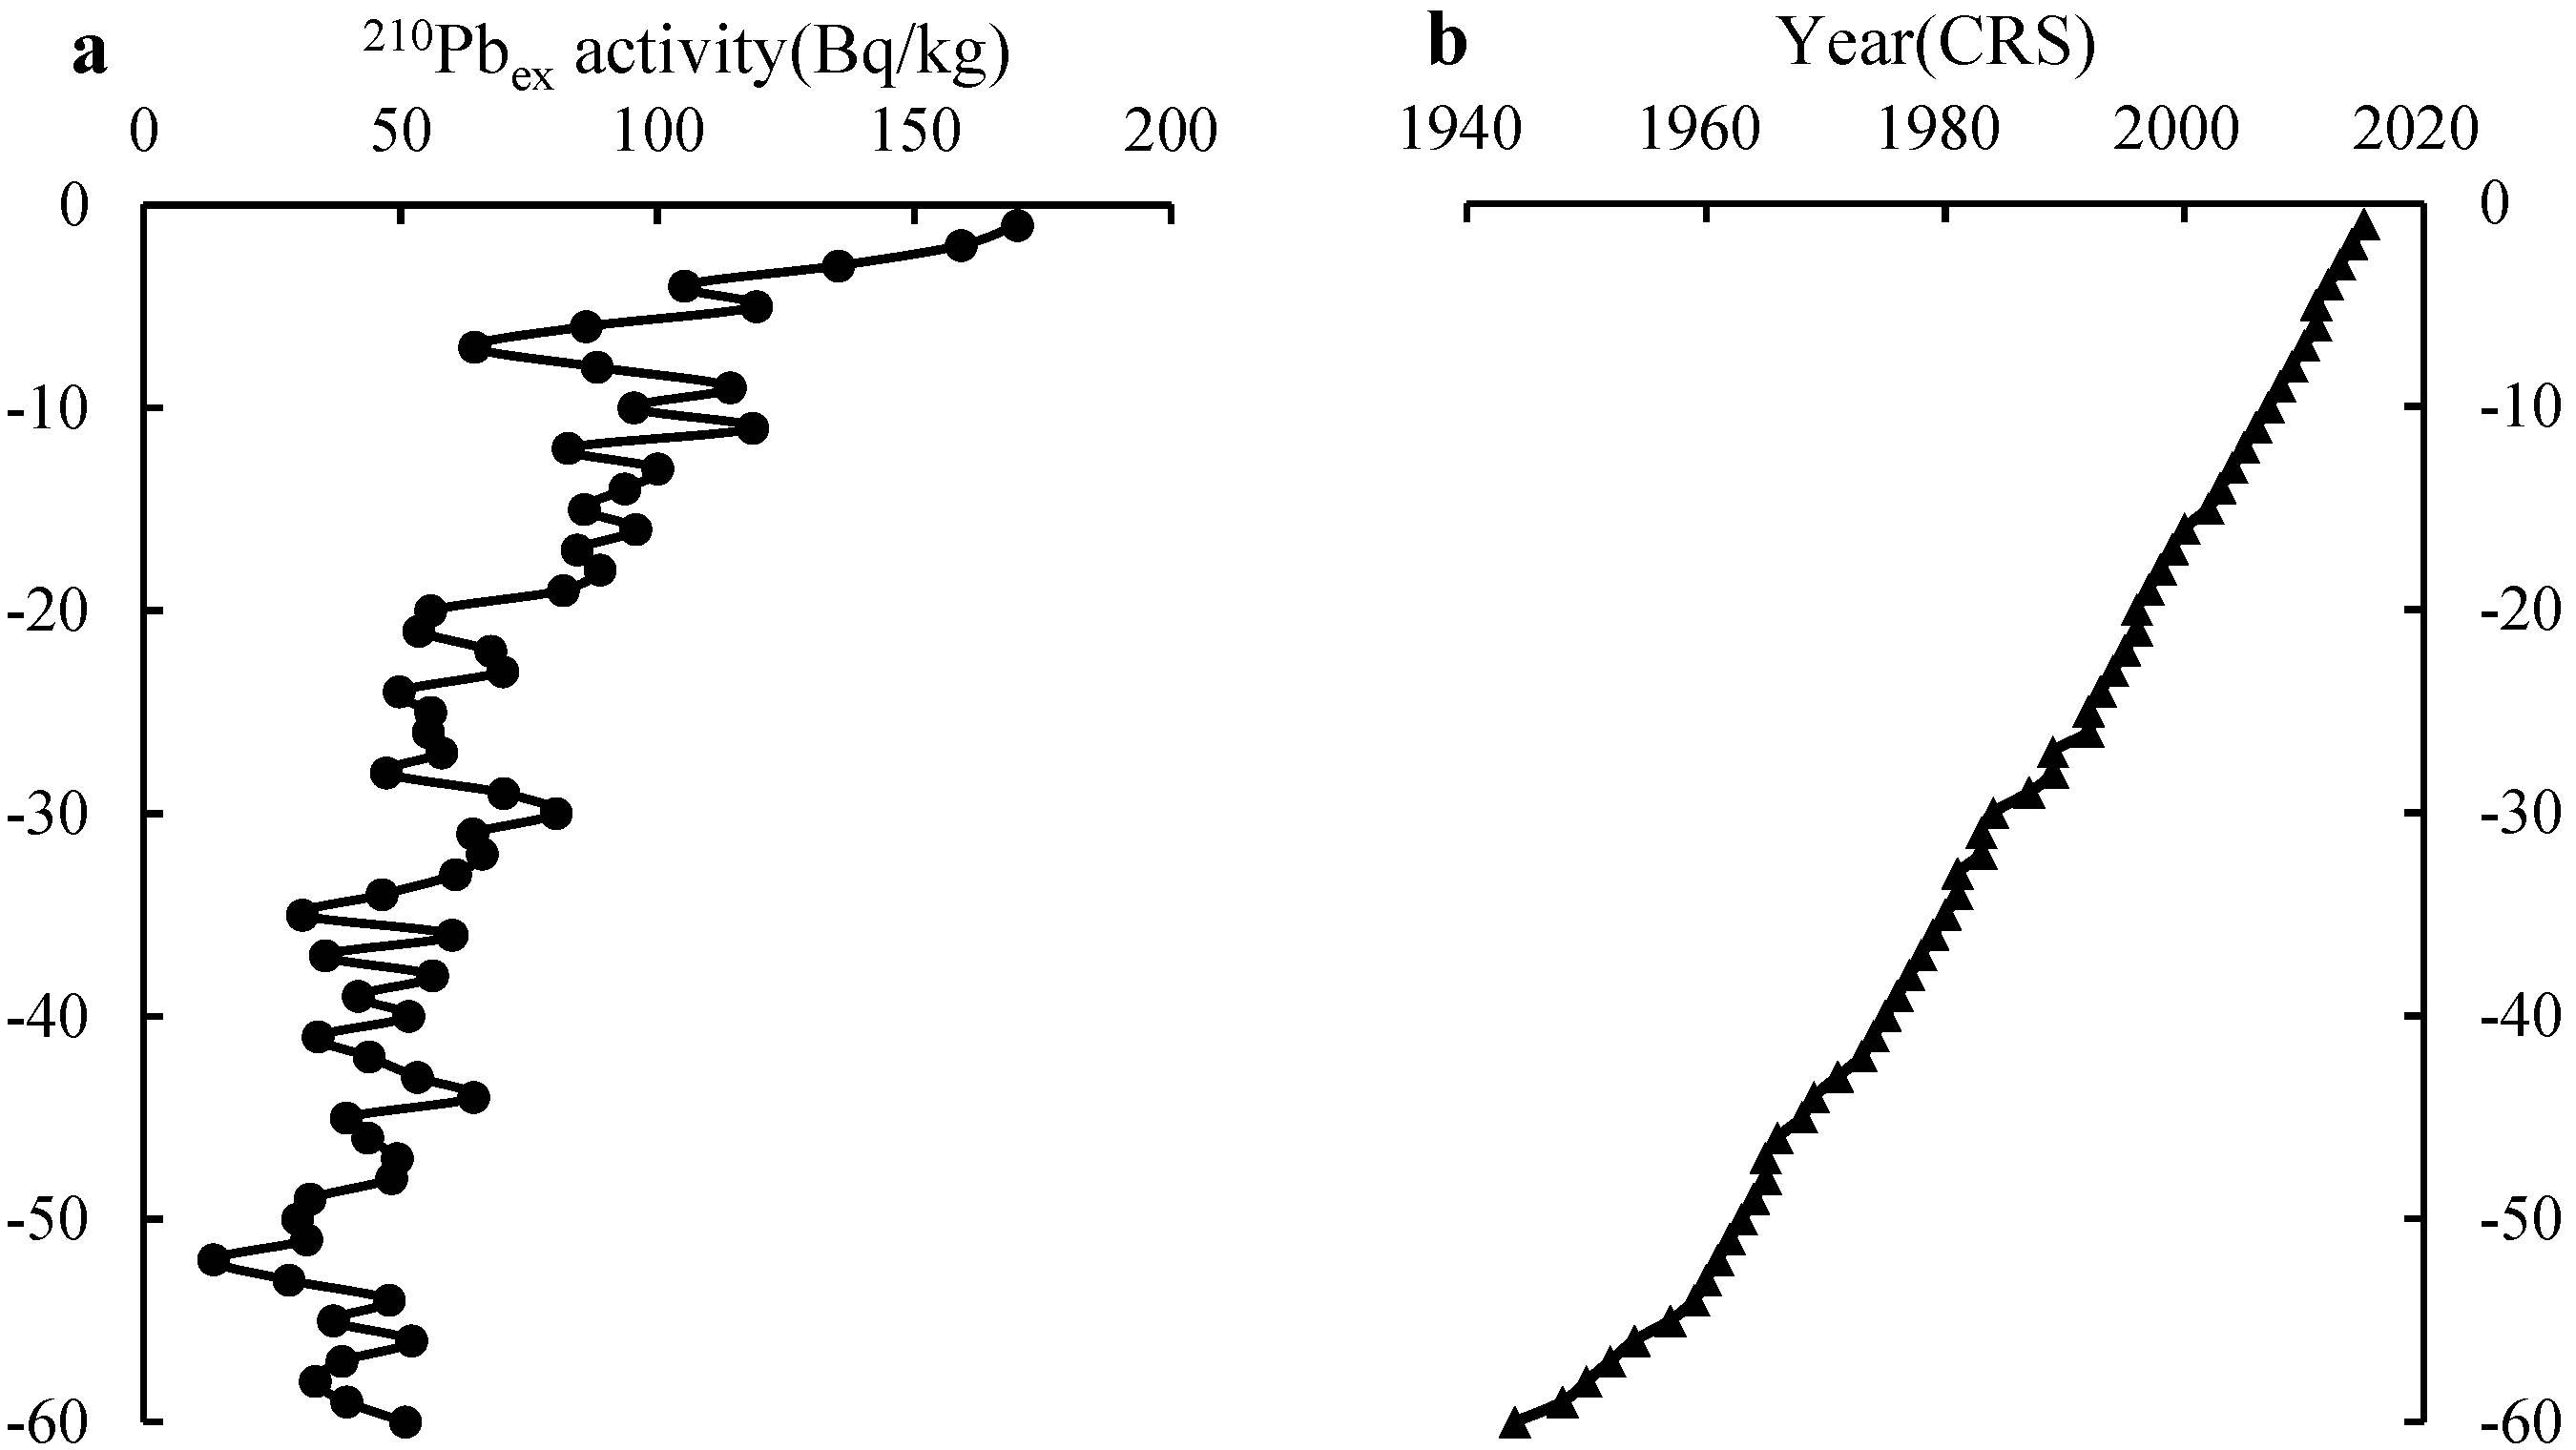
The 210Pbex activities were found to decrease exponentially with depth, ranging from 13.65 to 169.99 Bq/kg, and the sediment core was found to cover the period of 1944–2015 (Figure 2). Around the time of the founding of the People’s Republic of China in 1949, the use of motor vehicles and the level of productivity were low. After the completion of the Shuanglong reservoir in 1956, the reservoir could effectively intercept the flow loss in the upstream of Dianchi. Thus, the 210Pbex activities of −60~−51 cm were relatively low. From the period 1959 to 1961, the 210Pbex activities increased, which is mainly attributed to the policy of ”sacrificing agriculture for industry“ and the ”Great Leap Forward“. These social phenomena resulted in severe damage to the land structure and reduced vegetation coverage [27]. Hence, soil erosion was particularly prone to occur. Therefore, it was considered reasonable to define the core depth of −52 cm as 1961 by CRS model. Since 1980, with China’s ”Reform and Opening“, a large number of factories, such as insecticide factories, paper mills, and smelters, have emerged around the Dianchi, resulting in the discharge of wastewater and residues containing large amounts of heavy metals and, as a result, the 210Pbex activities have increased significantly. Therefore, the core depth of −35 cm was defined as 1980 [28]. In 1984, the Chinese state set up the Ministry of Ecology and Environment, which stipulated that attention should be paid not only to economic laws but also to natural laws. Meanwhile, in 1988, the Kunming government enacted a regulation for the protection of the Dianchi watershed to strengthen the management [29]. Thus, since the 210Pbex activities decreased for a short time at −30~−20 cm, a core depth of −30 cm was defined in 1984.

3.2. Heavy Metals in Vertical Profile

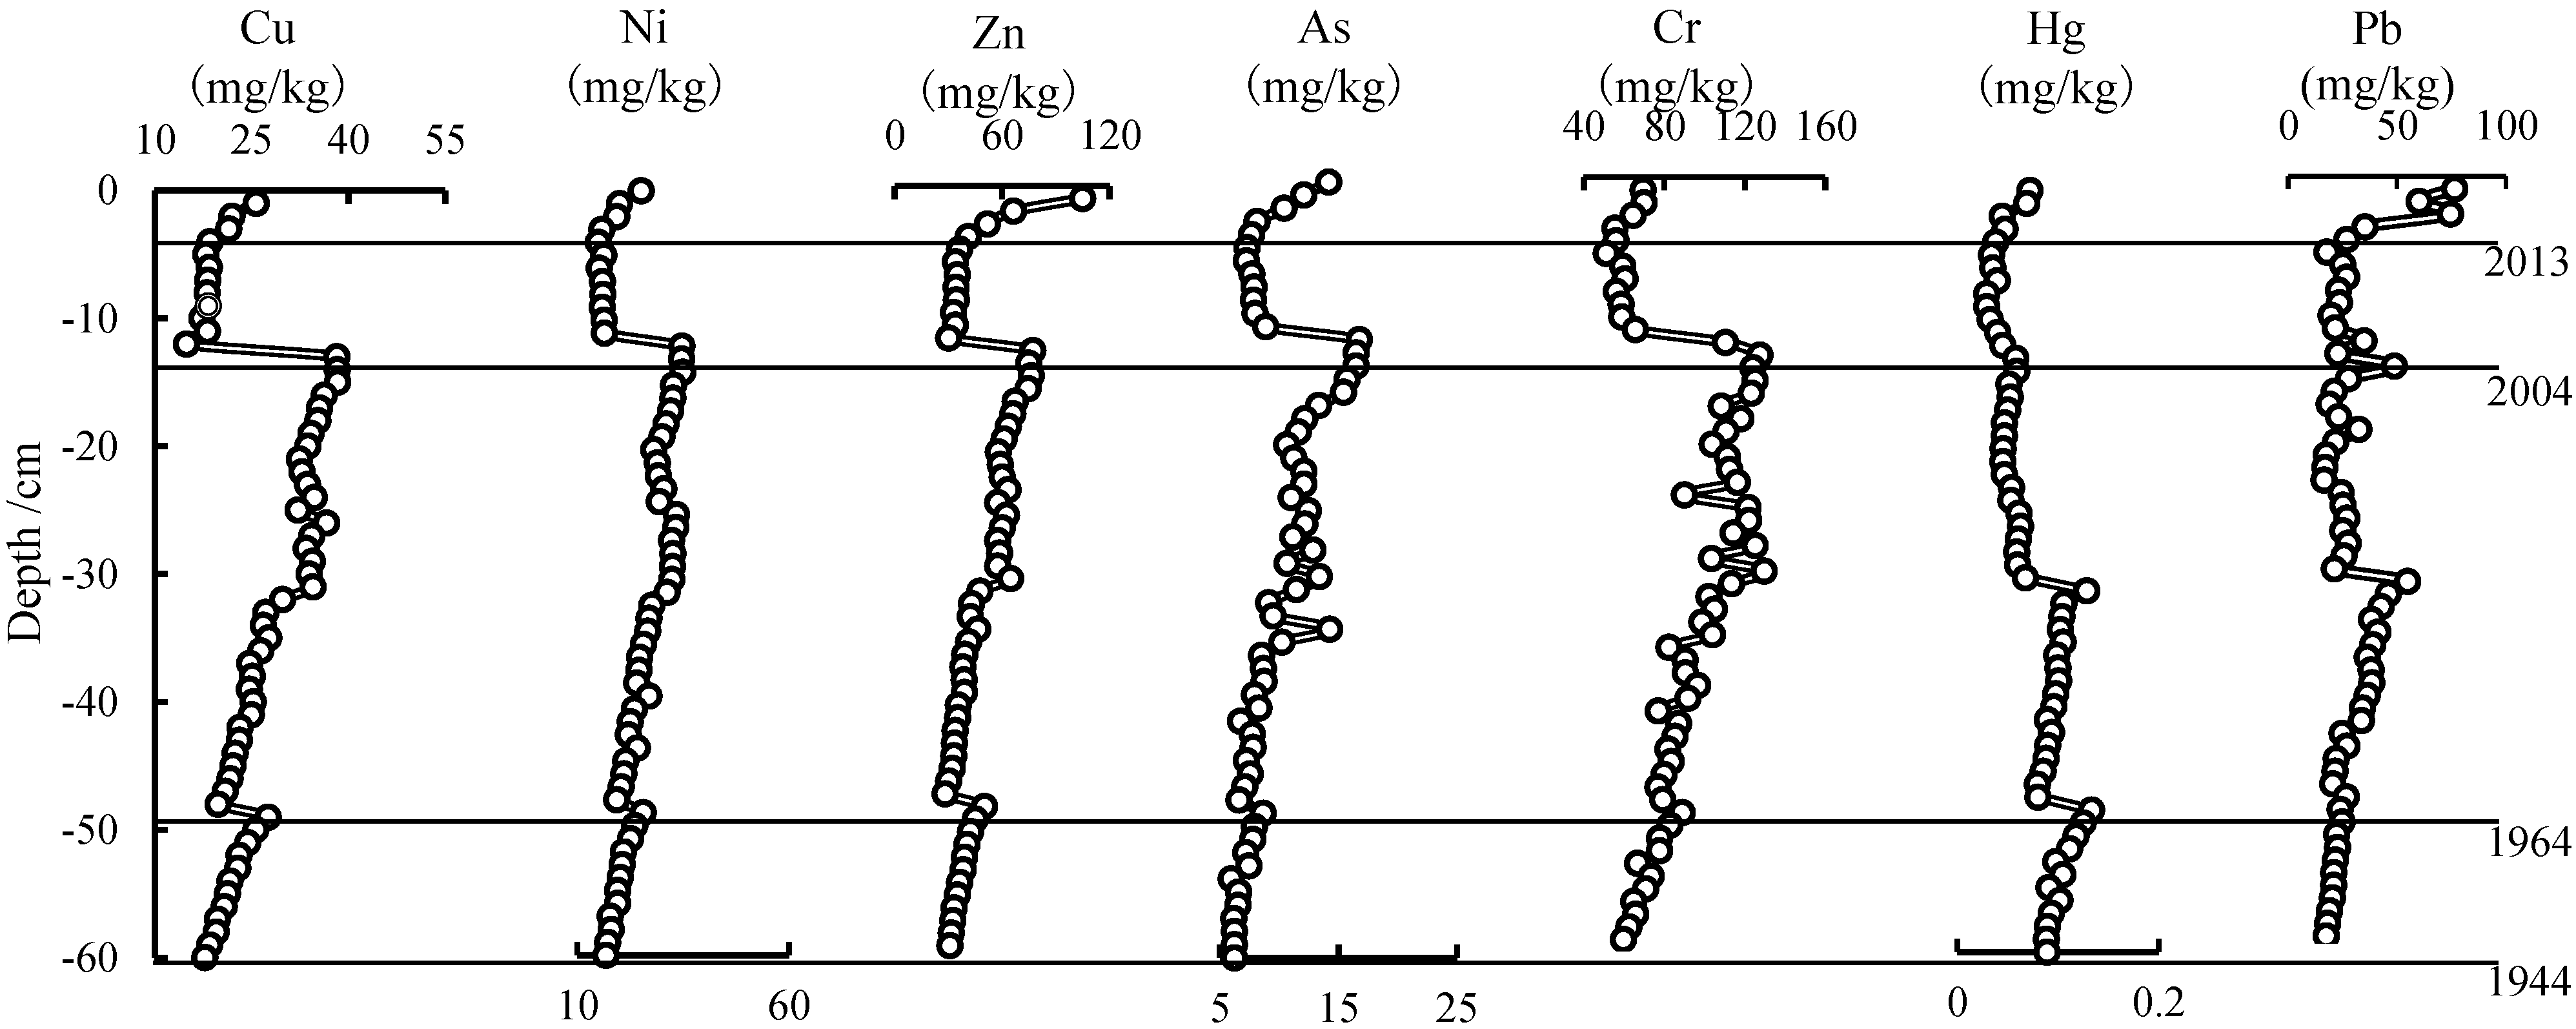
The concentrations of Cu, Ni, Zn, As, Cr, Hg, and Pb varied from 14.90–38.29, 14.92–34.93, 28.02–104.90, 5.95–16.76, 51.20–129.70, 0.03–0.13, and 16.47–76.54 mg/kg, respectively (Figure 3). From bottom to top, the concentrations first increased, then declined, and finally increased again. According to the chronology, the changes in the heavy metal contents are divided into the following four stages:
(1)
1944–1964 (−60~−49 cm). This stage covers the earliest years of the People’s Republic of China. The heavy metal content was generally low and rising, and the contents of As, Cr, and Hg fluctuated slightly;
(2)
1965–2004 (−48~−13 cm). This stage exhibited a wide range of heavy metal contents. Most elements’ content increased as a result of the implementation of the ”Great Leap Forward“ and ”Reform and Opening“, with the overall concentrations of Cu, Ni, Zn, As, and Cr being higher than in the first stage. With increasing time, the Hg content first increased and then decreased. During the 1970s, serious incidents of Hg pollution occurred in Northeast China and Hebei Province due to the extensive exploitation of Hg ore and the usage of Hg in industrial processes [30]. Thus, the relevant departments have strengthened the prevention and management of Hg pollution. Furthermore, before the 1980s, Pb concentrations increased as a result of soil erosion caused by the widespread destruction of forests in the Dianchi watershed during the Cultural Revolution. Later, as land use was rationalized, Pb pollution decreased;
(3)
2005–2012 (−12~−4 cm). During this stage, in China, the living standards significantly improved, the area of green land and environmental investment gradually increased, land-use patterns were rationalized, and environmental policies and regulations achieved specific effects [31]. For instance, in January 2005, the first wave of environmental protection events was officially launched, during which 30 illegal engineering projects were stopped. Moreover, many industrial policies were promulgated to promote the sustainable development of eco-industrial parks and implement the basic national policy of resource conservation and environmental protection [16]. Moreover, eight sewage treatment plants were built in the Dianchi watershed. Thus, measures for the control of pollution sources and contaminant treatment were vigorously implemented, so that the concentration of heavy metals was significantly reduced in the reservoir. Furthermore, in the 1990s, the reconstruction and expansion of urban roads promoted the increase in the number of motor vehicles in operation, which increased the Pb emissions [32,33];
(4)
2013–2015 (−3~−1 cm). In this stage, the increase in per capita income led to large changes in lifestyle, and the rise of tourism in Yunnan drove the development of scenic spots and economies around the Shuanglong reservoir. This, combined with the effects of the vast tributaries that flow through urban areas, industrial enterprises, and agricultural areas, led to an increase in the content of seven heavy metals.
According to the Consensus-Based Sediments Quality Guidelines (CBSQGs) index of the US Environmental Protection Agency (EPA), there are two thresholds for each heavy metal, namely the Thresholds Effect Concentration (TEC) and the Probable Effect Concentration (PEC) (TEC-adverse effects are not expected to occur, while PEC-adverse effects are expected to occur frequently) (Table 1) [34]. The results showed the following: in the first stage, the sediments in the Shuanglong reservoir were mainly from natural processes, and the contents of the seven elements was lower than the TEC, indicating that the sediments were not polluted. In the second stage, due to industrial development, the content of most heavy metals was higher than the TEC and lower than the PEC, that is, the Shuanglong reservoir was polluted. In the third stage, as a result of environmental protection policies, the pollution level returned to the pollution-free state that was observed in the first stage. In the fourth stage, due to the need for economic growth, it was difficult to further promote governance work, and the heavy metal content increased.

3.3. Sources of Heavy Metal Pollution

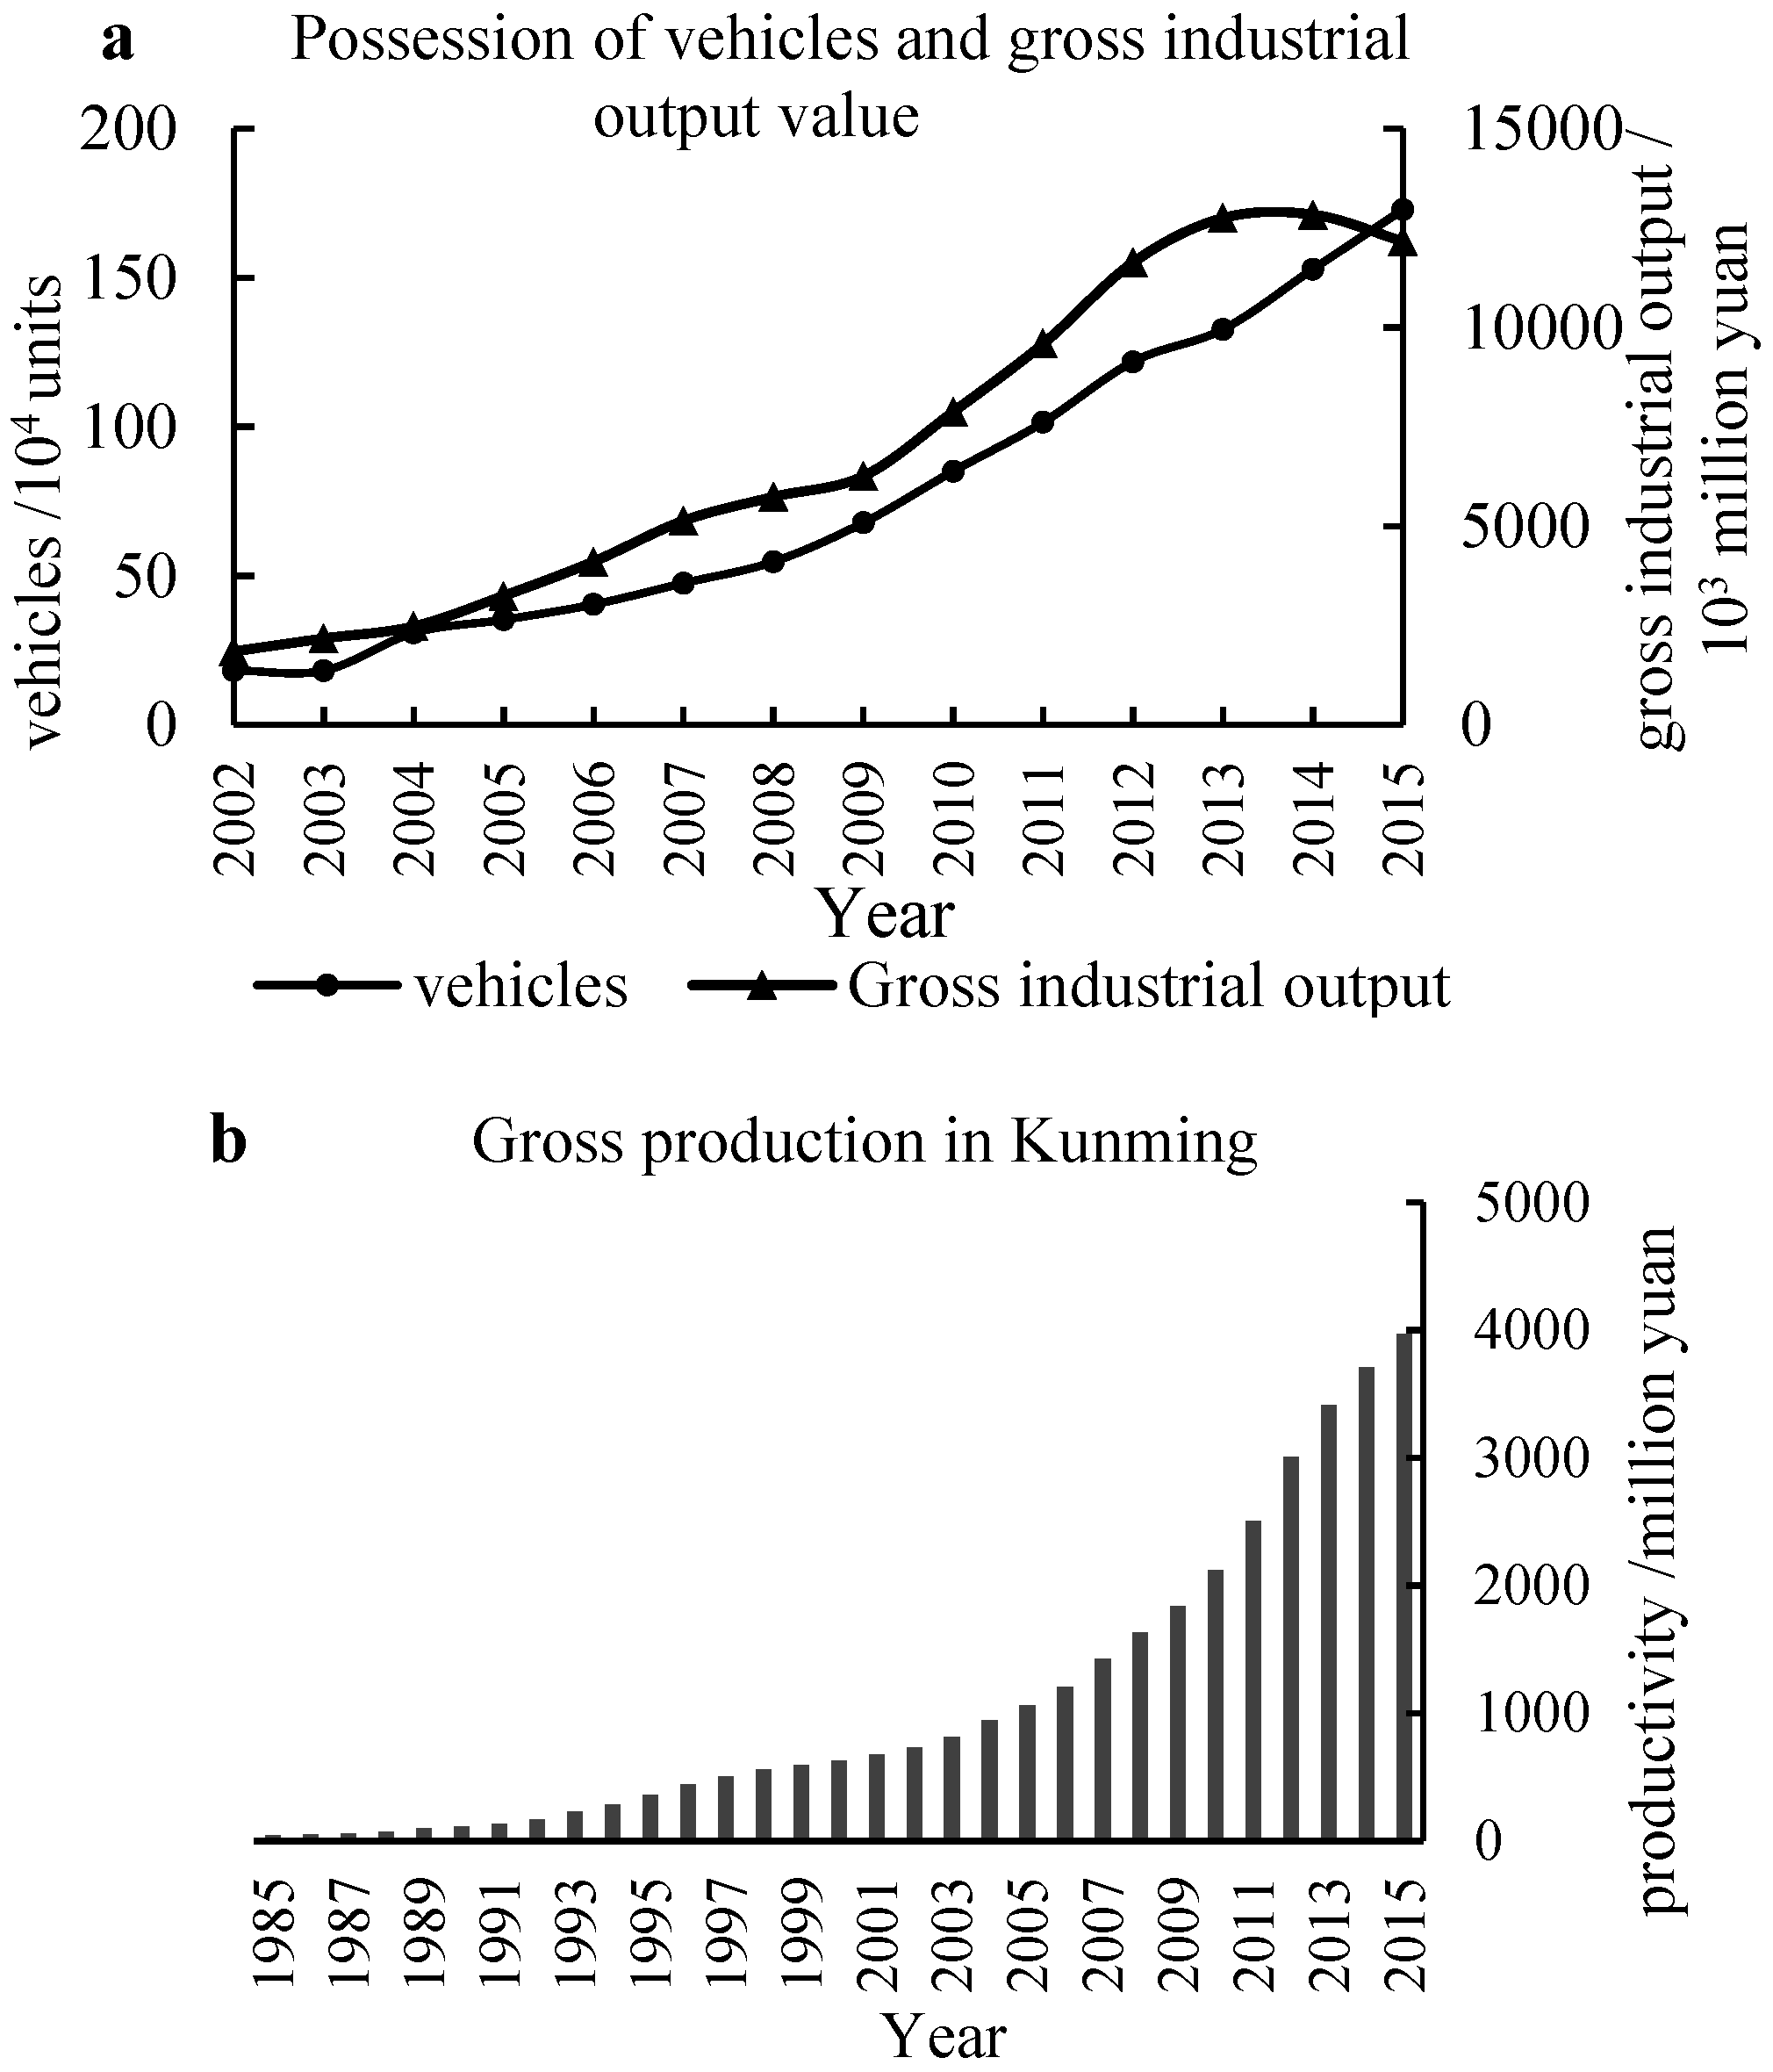
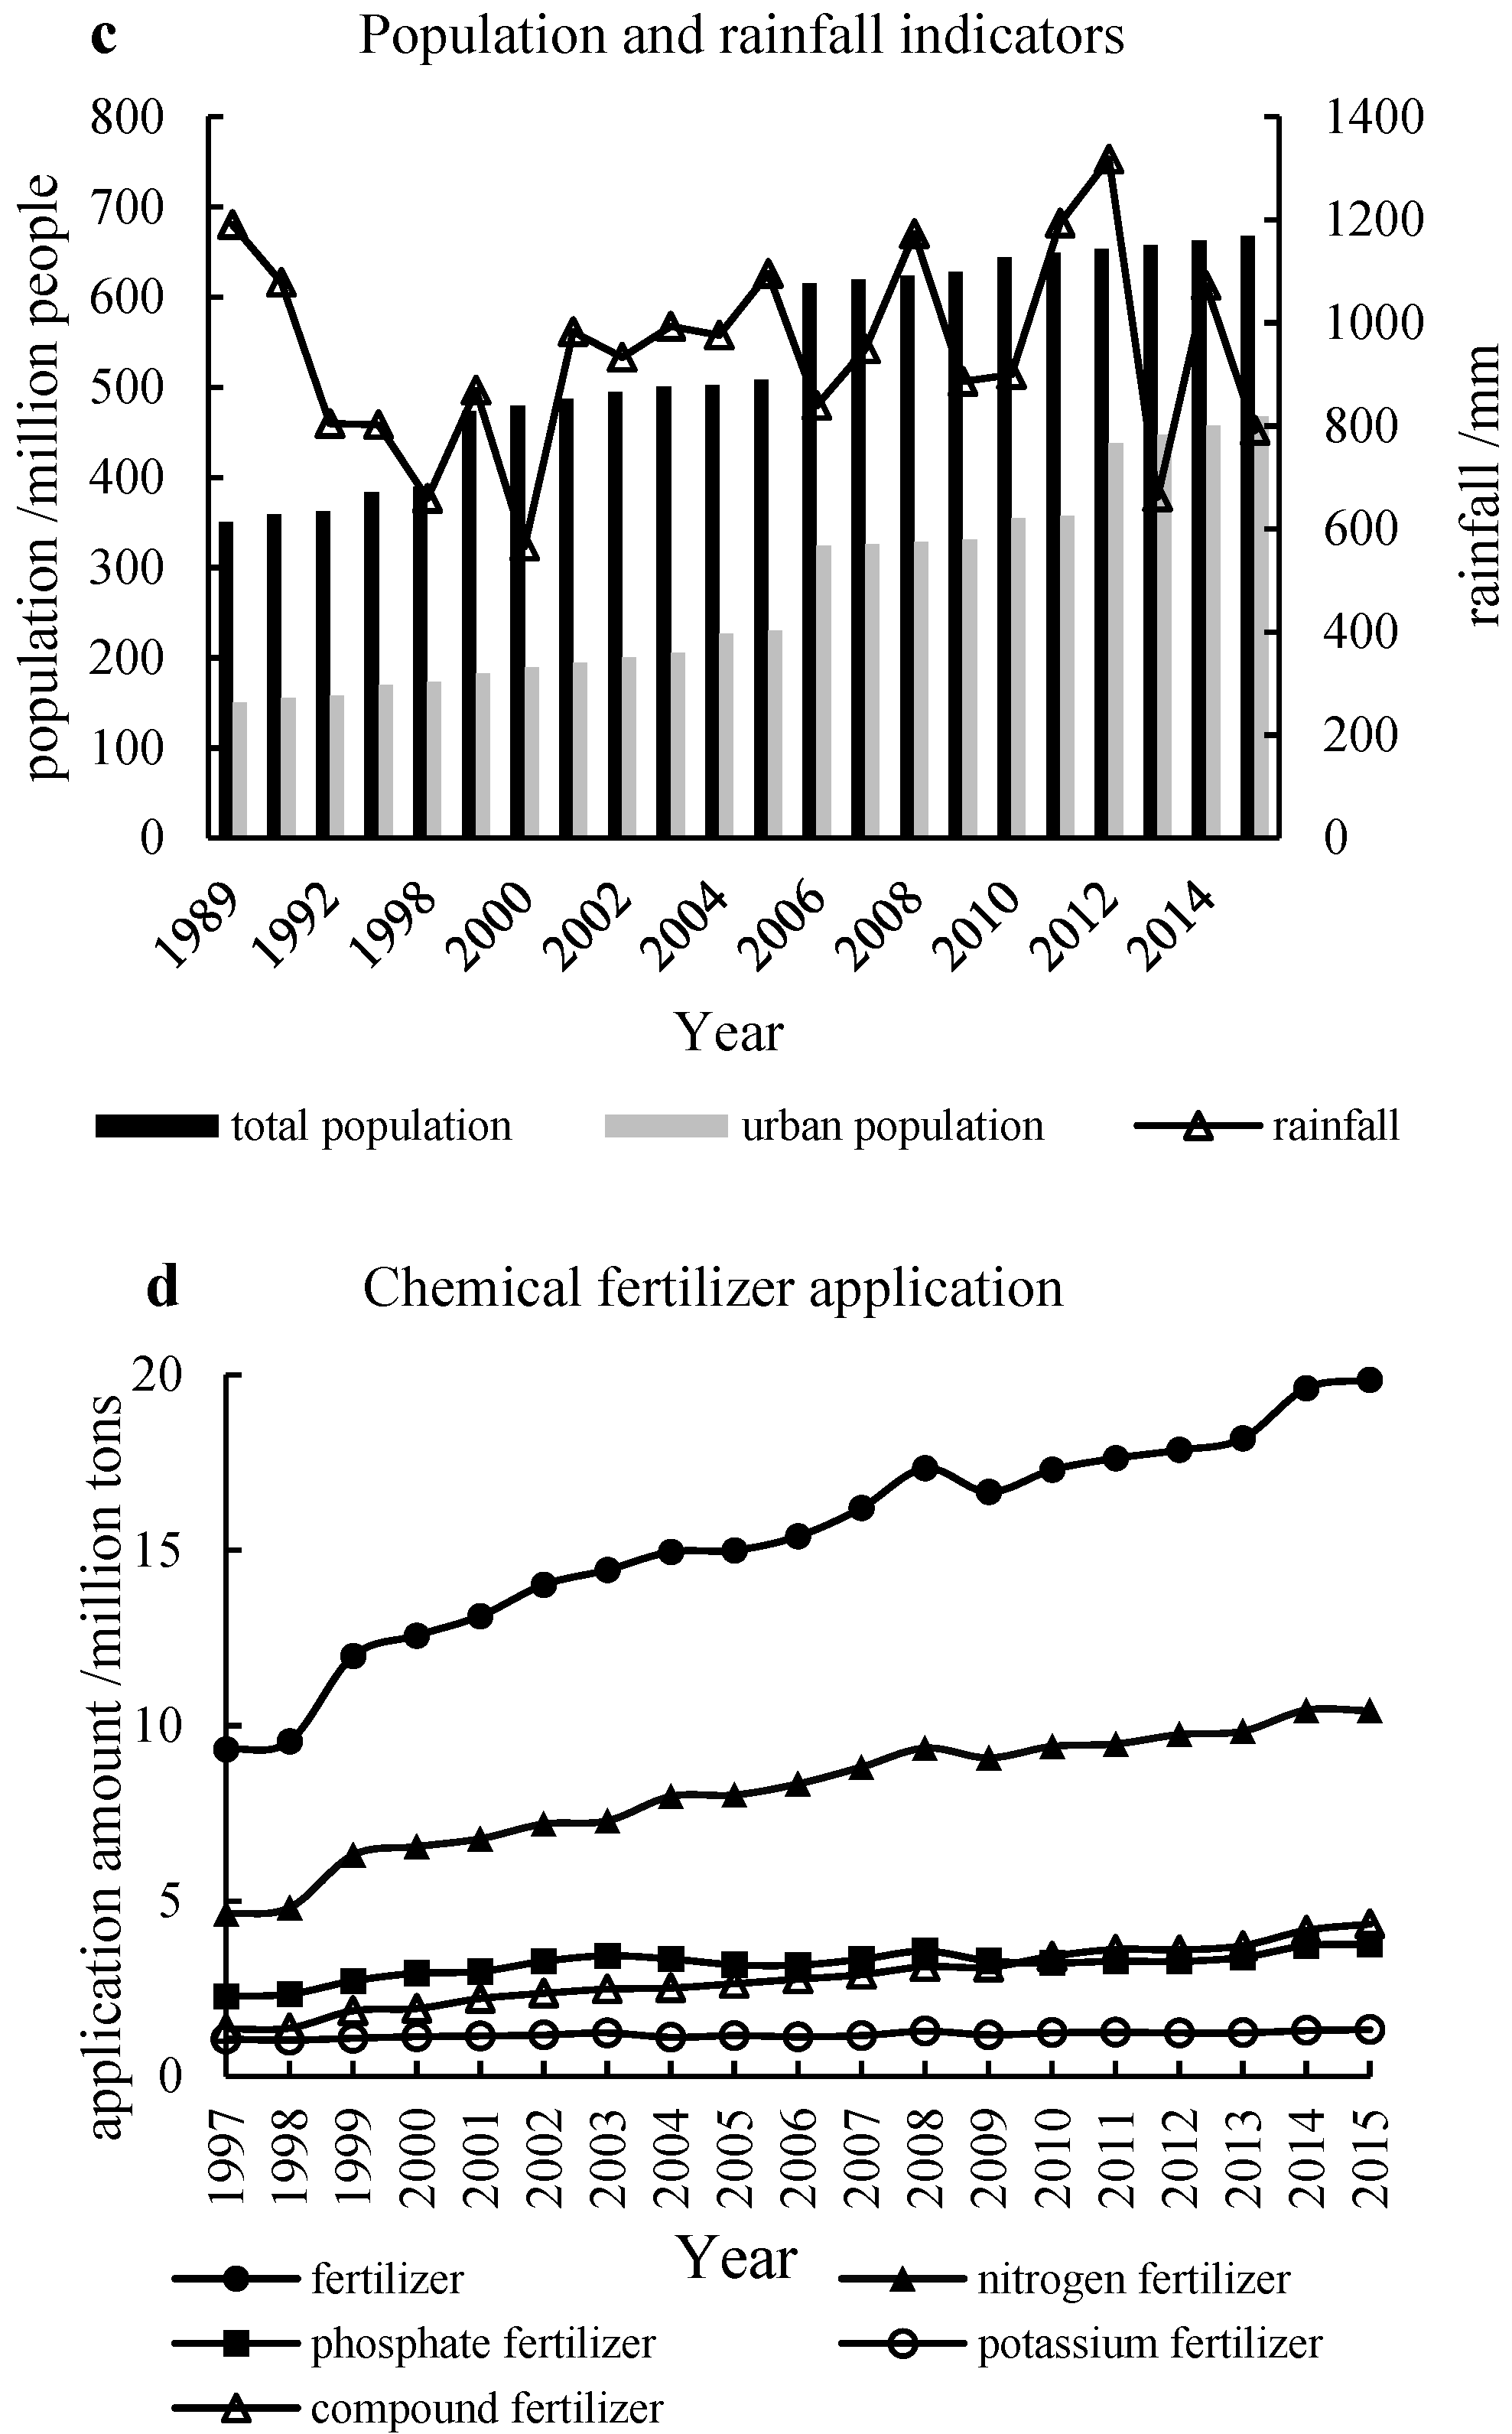
The sources of heavy metals in sediments are complex, however they mainly stem from two pathways: one is natural sources, and the other is anthropogenic sources [35]. PCA, correlation analysis, and CV analysis were used to estimate the sources of heavy metal contamination in the sediment. The three-dimensional spatial load graph of substantial metal factors and TOC in the sediment deposits of the Shuanglong reservoir directly showed the discrete degree of pollutants (Figure 4). Among the studied heavy metals, Cr, Ni, Cu, Zn, and As were relatively concentrated, suggesting that these heavy metals may have originated from the same pollution source and had a similar transport route. Meanwhile, Pb and Hg were discrete and far from each other, indicating that they were controlled by different pollution sources. The results showed that the extracted three principal components (PC1, PC2, and PC3) gave good expressions to the initial eight variables, and that these three principal components could explain 92.382% of the total variance, which can reflect the primary pollution sources of the sediment core. The contribution of PC1 was the highest of the three principal components (55.230%), and Cr, Ni, Cu, Zn, and As were found to have relatively high positive loads on PC1. The contents of Cr, Ni, Cu, Zn, and As showed extremely significant correlations with each other (P < 0.01, Table 3), with the correlation coefficient ranging from 0.636 to 0.977. The concentrations of Ni, Cu, Zn, and As were generally lower than the background values (Table 1). Meanwhile, the concentrations of Zn and Cu in the sediment of the Shuanglong reservoir were lower than those in most drinking water reservoirs in China and foreign countries [36,37]. This result suggests that the changes in the contents of seven heavy metals are mainly due to natural processes, such as rock weathering, erosion, and leaching. PC2 represented 23.977% of the information of the initial variables, and the load of Pb was 0.773, which was little correlated with the other six heavy metals. The Pb contents of the surface sediment were generally higher than the background value. Previous studies have verified that the development of the automobile industry plays a key role in the accumulation of Pb in sediments. This can be attributed to the widespread use of Pb in the automotive industry as a raw material to produce lubricating oil, airbag detonators, sensors, and glass and alloy materials, and to the fact that lead particles can be discharged into the soil through vehicle exhaust [38]. In the last decade, the number of vehicles in Kunming has been increasing (in 2015, the number of vehicles in Kunming was over 1.72 million), which has led to the continued release of Pb (Table 3 and Figure 5a). The correlation coefficient between vehicles and Pb reached 0.802 (P < 0.01, Table 3). The positive load of TOC was 0.948, indicating that TOC has a high affinity to heavy metals in sediments. This is due to the fact that TOC can affect the ecological toxicity, environmental migration, and geochemical behavior of heavy metals in sediments. On the one hand, humus has a high surface activity and can therefore increase the content of heavy metals in sediments through adsorption [39]. On the other hand, the degradation of TOC releases metal ions [16]. Meanwhile, TOC can also change the pH value, and the increase in TOC will promote mineralization and decomposition, which produce CO2 and organic acids and thereby lead to a decrease in pH [40]. The results suggested that pH is negatively correlated with the heavy metal content (Table 3). Accordingly, the high positive loads of Pb and TOC in PC2 can be concluded to represent the contributions of the automobile industry and the influence of TOC on heavy metal sources. PC3 represented 13.175% of the information of the initial variables. Additionally, the load of Hg was 0.934, and Hg content was unrelated to the other six metal elements: between 2014 and 2015 and before the 1990s, the concentrations of this metal were higher than the background value in Yunnan soil, and Hg accumulation in the Shuanglong reservoir was relatively large. Hg contamination may have been derived from mineral exploration, smelting, and the production of mercury-containing products such as polyvinyl chloride (PVC), cement, chemical fertilizer, pesticides, batteries, fluorescent lamps, thermometers, sphygmomanometers, etc. [41]. Meanwhile, improper emissions from the above production processes have led to the enrichment of Hg in the sediment [42]. This finding is similar to the findings of Bonotto (2018) [43] for the Madeira River basin, Portugal; Drevnick (2016) [44] for western North America; and Zhang (2019) [45] for Chao Lake, China. Therefore, the concentration of Hg in the sediment of the Shuanglong reservoir was closely related to the level of industrial development, and Hg had an extremely significant positive correlation with gross industrial output (P < 0.01, Table 3). Due to the continuous development of industrialization in recent years, the content of Hg in the sediments increased year by year (Table 3 and Figure 5a). It can be concluded that PC3 was the factor that was most indicative of industrial pollution. The CV analysis further verified that Hg and Pb were mainly controlled by anthropogenic activities, while Zn, As, Cu, Cr, and Ni were derived from natural processes. This is because the CV values of Hg and Pb are significantly higher than those of the other five studied heavy metals (Table 1).
The Dianchi watershed is the center of the economic development of Kunming, and contributes the majority of its GDP. The Shuanglong reservoir is a part of the Dianchi watershed, and therefore the GDP data of Kunming can be used to represent the economic development of the reservoir region. This GDP data can be used to analyze the impact of social activities on the sources of heavy metals in the sediment of the Shuanglong reservoir [46]. Economic development and the expansion of urbanization can promote the increase in Hg and Pb (Table 3 and Figure 5b,c). Steel, nonferrous metallurgy, electric power, and the chemical industry represent the majority of the industrial output of Yunnan Province [47]. These industries are characterized by high energy consumption and high pollution discharge, and most of them are concentrated in major urban areas, thus placing severe ecological pressure on the Shuanglong reservoir region. The expansion of the population has increased the food requirements, and hence the fertilizer rate has increased continuously (Figure 5d). However, the results suggest that, of the studied heavy metals in the sediment of the Shuanglong reservoir, only Hg and Pb had a significant positive correlation with crop fertilization (Table 3). These observations suggest a strong relationship between heavy metal contamination and economic development. Besides, rainfall was found to be negatively correlated with Hg and Pb contents and positively correlated with the contents of the other five studied heavy metals. It was further verified that anthropogenic activities were the dominant source of Hg and Pb, while the other five heavy metals mainly originated from natural inputs (Table 3 and Figure 5c). This result is consistent with the finding of Mil-Homens (2013) [48] for sediments in the central Portuguese Margin.

3.4. Assessment of Heavy Metal Contamination

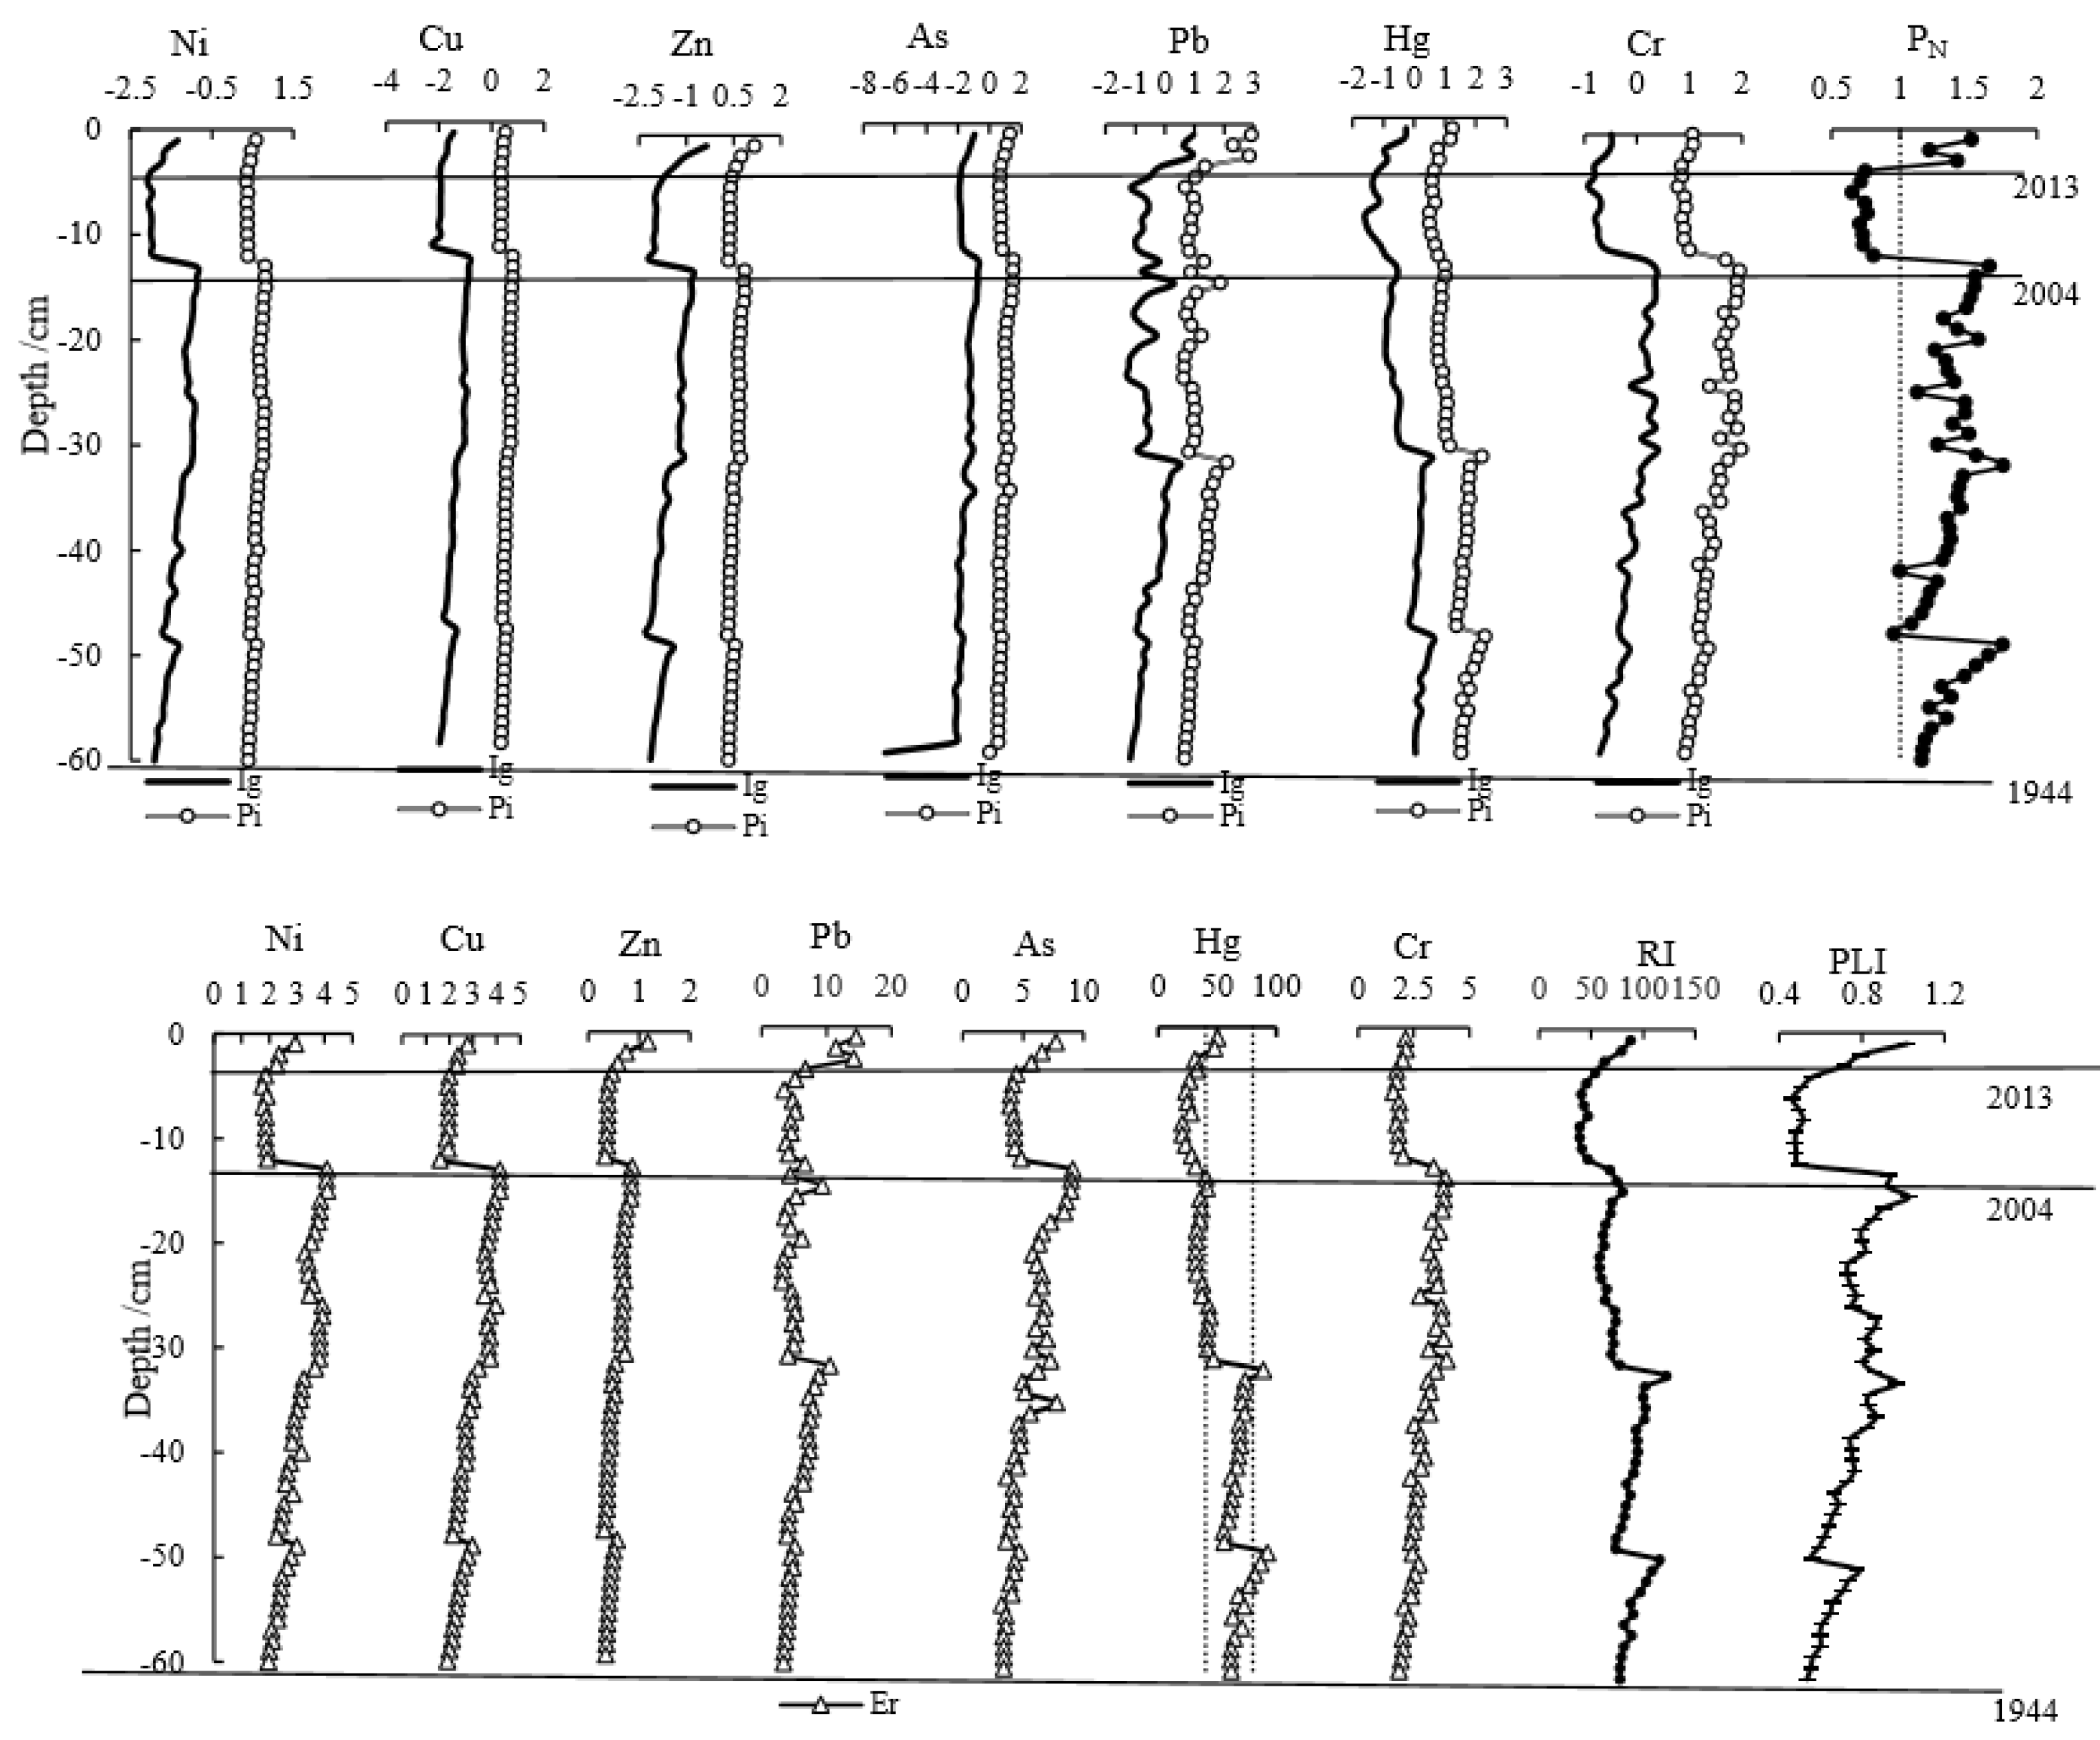
In this study, the Ig, Pi, and Er values of Ni, Cu, Zn, and As were generally less than 0, 1, and 40, respectively (Figure 6), indicating that these heavy metals displayed little or no enrichment and were almost unaffected by human activities. According to the Ig and Pi values, Cr showed a low ecological risk in the Shuanglong reservoir. However, the above analysis of heavy metal sources suggests that Cr mainly comes from natural processes, since the pollution level of Cr was low during the study period. The Ig, Pi, and Er values of Pb and Hg changed in a similar manner. The analysis of the Ig and Pi values showed that Pb pollution was mainly concentrated at depths of −1~−5 cm and −32~−43 cm. Moderate Pb contamination was observed in the surface sediment layer, which can be explained by a sharp increase in demand for vehicles as a means of transportation in 2001. Hg pollution was slight to moderate at depths of −1~−2 and −26~−60 cm. This is probably due to the fact that, in the 1980s, the Dianchi watershed contained a high concentration of industrial activity, resulting in the aggravation of Hg enrichment in the sediment of the Shuanglong reservoir. Thus, Pb and Hg are likely to have had adverse biological effects on the reservoir. These metals are particularly toxic to human beings [49], and therefore automobile manufacturing and other industries must be subjected to priority regulation in the Shuanglong reservoir.
The RI, PLI, and PN were used to comprehensively evaluate the pollution levels of multiple heavy metals in the aquatic system of the Shuanglong reservoir. It was found that these three pollution assessment indices have the same profile changes. At depths of −60 to −12 cm (1944–2004), the indices generally showed an upward trend, which was interpreted to be related to the development of industry and agriculture. Moreover, there were obvious troughs in the indices at depths of −13 to −4 cm (2005–2012), which was attributed to the vigorous implementation of environmental protection policies. Furthermore, at depths of −3 to −1 cm (2013–2015), the indices rose again, indicating that frequent human activities aggravated soil erosion near the reservoir. The RI and PLI values indicated that the sediment had a low level of contamination during the research period (except at a depth of −1 cm), whereas the PN values showed that the sediment was slightly contaminated in some stages: for example, from 1944 to 2004, the PN values were generally between 1 and 2, indicating slight contamination; from 2005 to 2012, the values were less than 1, indicating an alarming level of contamination in the reservoir; while between 2013 and 2015, the PN values were between 1 and 2, the sediments were slightly polluted. The level of pollution inferred from PN was higher than the levels inferred from RI and PLI. This is due to the fact that the calculation of PN takes into account the maximum pollution factor (Phmax), which was obtained from Pi in its calculation. Therefore, future studies should investigate how to choose a reasonable pollution assessment method in different research areas. In addition, this study only considered the additive effect of composite pollutants, while other joint effects (synergistic effect, antagonistic effect, and independent effect) need future research. The results of different pollution assessment indices showed that the pollution level of the Shuanglong reservoir was low in this study area.
In summary, using different pollution assessment methods, it was found that the ecological risks of Ni, Cu, Zn, As, and Cr were relatively lower in the whole deposition process, followed by Pb and Hg. The ecological risk posed by sediment in the Shuanglong reservoir (a typical water supply reservoir) was found to be low.

4. Conclusions

Heavy metals (Cr, Ni, Cu, Zn, As, Hg, and Pb) in a sediment core from the Shuanglong reservoir, as a typical water−supply reservoir, were investigated. Four stages of the lacustrine environment in the Shuanglong reservoir were identified using the CRS model. In the first stage, the heavy metals in sediments mainly came from natural processes. In the second stage, industrial development led to an increase in the contents of most heavy metals and moderate sediment pollution. In the third stage, under the support of an environmental protection policy, the pollution level was restored. In the fourth stage, heavy metal contents increased, which was likely a consequence of frequent human activities. The results showed that the changes in human activities can influence the changes in heavy metals in the sediment. According to PCA, correlation analysis, and CV analysis, the sources of heavy metals were divided into three main categories. The first category is Ni, Cu, Zn, As, and Cr, which were principally derived from natural processes. The second category is Pb, which is ascribed to the development of automobile manufacturing. The third category is Hg, which mainly came from industrial sources. Meanwhile, the possession of vehicles and gross industrial output, gross production, urban population, total population, rainfall and crop fertilization proved that human activities were closely related to the accumulation of Pb and Hg in the sediment. The Ig, Pi, and Er values of Ni, Cu, Zn, As, and Cr indicated no or weak pollution in the sediment, whereas that of Pb and Hg in some stages showed slight or moderate pollution. The results of comprehensive pollution evaluation indices (RI, PLI, and PN) showed that the pollution level of the Shuanglong reservoir was low in this study area. The study suggests that effective measures should be taken to control the emissions of heavy metals from the automotive industry and other industries to reduce Pb and Hg pollution, so as to further guarantee the sustainable development of the water environment and the safety of human life.

Author Contributions

Conceptualization, H.Y.; Funding acquisition, M.L. and X.N.; Investigation, H.T.; Methodology, A.L.; Supervision, Y.W.; Writing—original draft, Z.Z.; Writing—review and editing, X.N. All authors have read and agreed to the published version of the manuscript.

Funding

This work was supported by the National Natural Science Foundation of China (41703099; 41771348; 41877122).

Acknowledgments

The authors are thankful to analytical testing center of Shandong University of Technology. The authors are also thankful to Jiawen Zheng for his assistance in collecting samples for support.

Conflicts of Interest

The authors declare no conflict of interest.

References

  1. Schneider, L.; Maher, W.; Potts, J.; Batley, G.; Taylor, A.; Krikowa, F.; Charition, A.; Zawadzki, A.; Heijnis, H.; Gruber, B. History of metal contamination in Lake Illawarra, NSW, Australia. Chemosphere 2015, 119, 377–386. [Google Scholar] [CrossRef]
  2. Wu, S.S.; Han, R.M.; Yang, H.; Wang, Q.J.; Bi, F.Z.; Wang, Y.H. A century−long trend of metal pollution in the Sheyang River, on the coast of Jiangsu (China), reconstructed from sedimentary record. Chem. Ecol. 2017, 33, 1–17. [Google Scholar] [CrossRef]
  3. Nguyen, T.T.H.; Zhang, W.G.; Li, Z.; Li, J.; Ge, C.; Liu, J.Y.; Bai, X.X.; Feng, H.; Yu, L.Z. Assessment of heavy metal pollution in Red River surface sediments, Vietnam. Mar. Pollut. Bull. 2016, 113, 513–519. [Google Scholar] [CrossRef] [PubMed]
  4. Singh, K.P.; Malik, A.; Sinha, S.; Singh, V.K.; Murthy, R.C. Estimation of source of heavy metal contamination in sediments of Gomti River (India) using principal component analysis. Water Air Soil Pollut. 2005, 166, 321–341. [Google Scholar] [CrossRef]
  5. Ali, M.M.; Ali, M.L.; Islam, M.S.; Rahman, M.Z. Preliminary assessment of heavy metals in water and sediment of Karnaphuli River, Bangladesh. Environ. Nanotechnol. Monit. Manag. 2016, 5, 27–35. [Google Scholar] [CrossRef] [Green Version]
  6. Chen, H.Y.; Chen, R.H.; Teng, Y.G.; Wu, J. Contamination characteristics, ecological risk and source identification of trace metals in sediments of the Le’an River (China). Ecotoxicol. Environ. Saf. 2016, 125, 85–92. [Google Scholar] [CrossRef] [PubMed]
  7. Reddy, M.S.; Basha, S.; Sravan Kumar, V.G.; Joshi, H.V.; Ramachandraiah, G. Distribution, enrichment and accumulation of heavy metals in coastal sediments of Alang−Sosiya ship scrapping yard, India. Mar. Pollut. Bull. 2004, 48, 1055–1059. [Google Scholar] [CrossRef]
  8. Wang, X.L.; Zhang, L.; Zhao, Z.H.; Cai, Y.J. Heavy metal pollution in reservoirs in the hilly area of southern China: Distribution, source apportionment and health risk assessment. Sci. Total Environ. 2018, 634, 158–169. [Google Scholar] [CrossRef]
  9. Wang, G.; Li, J.; Sun, W.; Xue, B.; Yinglan, A.; Liu, T. Non−point source pollution risks in a drinking water protection zone based on remote sensing data embedded within a nutrient budget model. Water Res. 2019, 157, 238–246. [Google Scholar] [CrossRef]
  10. Xiong, Y.Q.; Wu, F.C.; Fang, J.D.; Fang, J.D.; Wang, L.F.; Li, Y.; Liao, H.Q. Organic geochemical record of environmental changes in Lake Dianchi, China. J. Paleolimnol. 2010, 44, 217–231. [Google Scholar] [CrossRef]
  11. Dearing, J.A.; Jones, R.T. Coupling temporal and spatial dimensions of global sediment flux through lake and marine sediment records. Glob. Planet. Chang. 2003, 39, 147–168. [Google Scholar] [CrossRef]
  12. Chassiot, L.; Francus, P.; Coninck, A.D.; Lajeunesse, P.; Cloutier, D.; Labarre, T. Spatial and temporal patterns of metallic pollution in Québec City, Canada: Sources and hazard assessment from reservoir sediment records. Sci. Total Environ. 2019, 673, 136–147. [Google Scholar] [CrossRef] [PubMed]
  13. Christophoridis, C.; Bourliva, A.; Evgenakis, E.; Papadopoulou, L.; Fytianos, K. Effects of anthropogenic activities on the levels of heavy metals in marine surface sediments of the Thessaloniki Bay, Northern Greece: Spatial distribution, sources and contamination assessment. Microchem. J. 2019, 149, 104001. [Google Scholar] [CrossRef]
  14. Ganugapenta, S.; Nadimikeri, J.; Chinnapolla, S.R.R.B.; Ballari, L.; Madiga, R.; Nirmala, K.; Tella, L.P. Assessment of heavy metal pollution from the sediment of Tupilipalem Coast, southeast coast of India. Int. J. Sediment Res. 2018, 33, 294–302. [Google Scholar] [CrossRef]
  15. Nazneen, S.; Singh, S.; Raju, N.J. Heavy metal fractionation in core sediments and potential biological risk assessment from Chilika lagoon, Odisha state, India. Quat. Int. 2019, 507, 370–388. [Google Scholar] [CrossRef]
  16. Yang, G.H.; Song, Z.G.; Sun, X.L.; Chen, C.L.; Ke, S.; Zhang, J.B. Heavy metals of sediment cores in Dachan Bay and their responses to human activities. Mar. Pollut. Bull. 2020, 150, 110764. [Google Scholar] [CrossRef] [PubMed]
  17. Tang, H.J.; Ke, Z.X.; Yan, M.T.; Wang, W.J.; Nie, H.Y.; Li, B.X.; Zhang, J.P.; Xu, X.G.; Wang, J. Concentrations, Distribution, and Ecological Risk Assessment of Heavy Metals in Daya Bay, China. Water 2018, 10, 780. [Google Scholar] [CrossRef] [Green Version]
  18. Mazurek, R.; Kowalska, J.B.; Gąsiorek, M.; Zadrożny, P.; Wieczorek, J. Pollution indices as comprehensive tools for evaluation of the accumulation and provenance of potentially toxic elements in soils in Ojców National Park. J. Geochem. Explor. 2019, 201, 13–30. [Google Scholar] [CrossRef]
  19. Zhang, Y.; Meng, W.; Guo, C.S.; Xu, J.; Yu, T.; Fan, W.H.; Li, L. Determination and partitioning behavior of perfluoroalkyl carboxylic acids and perfluorooctanesulfonate in water and sediment from Dianchi Lake, China. Chemosphere 2012, 11, 1292–1299. [Google Scholar] [CrossRef] [PubMed]
  20. Fang, J.D.; Wu, F.C.; Xiong, Y.Q.; Li, F.S.; Du, X.M.; An, D.; Wang, L.F. Source characterization of sedimentary organic matter using molecular and stable carbon isotopic composition of n−alkanes and fatty acids in sediment core from Lake Dianchi, China. Sci. Total Environ. 2014, 473–474, 410–421. [Google Scholar] [CrossRef]
  21. Last, W.M.; Smol, J.P. Tracking Environ−Mental Change Using Lake Sediments, Volume 1: Basin Analysis, Coring, and Chronological Techniques; Kluwer Academic Publishers: Dordrecht, The Netherlands, 2001; pp. 171–196. [Google Scholar]
  22. Muller, G. Index of geo−accumulation in sediments of the Rhine River. J. Geol. 1969, 2, 108–118. [Google Scholar]
  23. Hou, D.K.; He, J.; Lv, C.W.; Ren, L.M.; Fan, Q.Y.; Wang, J.H.; Xie, Z.L. Distribution characteristics and potential ecological risk assessment of heavy metals (Cu, Pb, Zn, Cd) in water and sediments from Lake Dalinouer, China. Ecotoxicol. Environ. Saf. 2013, 93, 135–144. [Google Scholar] [CrossRef] [PubMed]
  24. Tomlinson, D.L.; Wilson, J.G.; Harris, C.R.; Jeffrey, D.W. Problems in the assessment of heavy−metals in estuaries and the formation of a pollution index. Helgoländer Meeresunters. 1980, 33, 566–575. [Google Scholar] [CrossRef] [Green Version]
  25. Hakanson, L. An ecological risk index for aquatic pollution control a sediment ecological approach. Water Res. 1980, 14, 975–1001. [Google Scholar] [CrossRef]
  26. Sun, C.Y.; Zhang, Z.X.; Cao, H.N.; Xu, M.; Xu, L. Concentrations, speciation, and ecological risk of heavy metals in the sediment of the Songhua River in an urban area with petrochemical industries. Chemosphere 2019, 219, 538–545. [Google Scholar] [CrossRef]
  27. Zhang, L.; Sovacool, B.K.; Ren, J.Z.; Ely, A. The Dragon awakens: Innovation, competition, and transition in the energy strategy of the People’s Republic of China, 1949−2017. Energy Policy 2017, 108, 634–644. [Google Scholar] [CrossRef]
  28. Wan, D.J.; Song, L.; Mao, X.; Yang, J.S.; Jin, Z.D.; Yang, H.D. One−century sediment records of heavy metal pollution on the southeast Mongolian Plateau: Implications for air pollution trend in China. Chemosphere 2019, 220, 539–545. [Google Scholar] [CrossRef]
  29. Wu, S.Z.; Huang, D.S.; Liu, Z.C.; Shen, X.Y.; Yuan, Q.D. 40 Years Evolution of the Relationship Between Environmental Protection and Economic Development in China. Environ. Prot. 2018, 46, 14–20. (In Chinese) [Google Scholar]
  30. Zhang, L.; Wong, M.H. Environmental mercury contamination in China: Sources and impacts. Environ. Int. 2007, 33, 108–121. [Google Scholar] [CrossRef]
  31. Zhou, J.X.; Wang, J.; Wang, P.F.; Hua, Y.; Liu, B.; Li, J. Wavelet Analysis of Water Quality Changes in Dianchi Lake during the past 7a. Procedia Earth Planet. Sci. 2012, 5, 280–288. [Google Scholar] [CrossRef] [Green Version]
  32. Cherry, C.R.; Yang, H.T.; Jones, L.R.; He, M. Dynamics of electric bike ownership and use in Kunming, China. Transport Policy 2016, 45, 127–135. [Google Scholar] [CrossRef] [Green Version]
  33. Jia, P.Q.; Zhang, W.B.; Liu, Q.G. Lake fisheries in China: Challenges and opportunities. Fish. Res. 2013, 140, 66–72. [Google Scholar] [CrossRef]
  34. Macdonald, D.D.; Ingersoll, C.G.; Berger, T.A. Development and evaluation of consensus−based Sediment Quality guidelines for freshwater ecosystems. Arch. Environ. Contam. Toxicol. 2000, 39, 20–31. [Google Scholar] [CrossRef] [PubMed]
  35. Gu, Y.G.; Gao, Y.P. An unconstrained ordination− and GIS−based approach for identifying anthropogenic sources of heavy metal pollution in marine sediments. Mar. Pollut. Bull. 2019, 146, 100–105. [Google Scholar] [CrossRef] [PubMed]
  36. Lee, P.K.; Kang, M.J.; Yu, S.Y.; Ko, K.S.; Ha, K.; Shin, S.C.; Park, J.H. Enrichment and geochemical mobility of heavy metals in bottom sediment of the Hoedong reservoir, Korea and their source apportionment. Chemosphere 2017, 184, 74–85. [Google Scholar] [CrossRef] [PubMed]
  37. Deng, M.H.; Yang, X.E.; Dai, X.; Zhang, Q.; Malik, A.; Sadeghpour, A. Heavy metal pollution risk assessments and their transportation in sediment and overlay water for the typical Chinese reservoirs. Ecol. Indic. 2020, 112, 106166. [Google Scholar] [CrossRef]
  38. Duzgoren−Aydin, N.S.; Li, X.D.; Wong, S.C. Lead contamination and isotope signatures in the urban environment. Environ. Int. 2004, 30, 209–217. [Google Scholar] [CrossRef]
  39. Qiao, Y.M.; Huang, C.J. A study on concentration and distribution characteristics of heavy metals in surface sediment of the Shantou Estuary in China. Acta Oceanol. Sin. 2009, 31, 106–116. [Google Scholar]
  40. Wang, S.R.; Jin, X.C.; Bu, Q.Y.; Zhou, X.N.; Wu, F.C. Effects of particle size, organic matter and ionic strength on the phosphate sorption in different trophic lake sediments. J. Hazard. Mater. 2006, 128, 95–105. [Google Scholar] [CrossRef]
  41. Men, C.; Liu, R.M.; Wang, Q.R.; Guo, L.J.; Shen, Z.Y. The impact of seasonal varied human activity on characteristics and sources of heavy metals in metropolitan road dusts. Sci. Total Environ. 2018, 637–638, 844–854. [Google Scholar] [CrossRef]
  42. Xu, H.; Zhu, Y.; Wang, L.; Lin, C.; Jang, C.; Zhou, Q.; Yu, B.; Wang, S.X.; Xing, J.; Yu, L. Source contribution analysis of mercury deposition using an enhanced CALPUFF−Hg in the central Pearl River Delta, China. Environ. Prot. 2019, 250, 1032–1043. [Google Scholar] [CrossRef] [PubMed]
  43. Bonotto, D.M.; Wijesiri, B.; Vergotti, M.; da Silveira, E.G.; Goonetilleke, A. Assessing mercury pollution in Amazon River tributaries using a Bayesian Network approach. Ecotoxicol. Environ. Saf. 2018, 166, 354–358. [Google Scholar] [CrossRef] [PubMed]
  44. Drevnick, P.E.; Cooke, C.A.; Barraza, D.; Blais, J.M.; Coale, K.H.; Cumming, B.F.; Curtis, C.J. Spatiotemporal patterns of mercury accumulation in lake sediments of western North America. Sci. Total Environ. 2016, 568, 1157–1170. [Google Scholar] [CrossRef] [PubMed]
  45. Zhang, H.X.; Huo, S.L.; Yeager, K.M.; Xi, B.D.; Zhang, J.T.; Wu, F.C. A Historical Sedimentary Record of Mercury in a Shallow Eutrophic Lake: Impacts of Human Activities and Climate Change. Engineering 2019, 5, 296–304. [Google Scholar] [CrossRef]
  46. Wang, Y.H.; Yang, H.; Zhang, J.X.; Xu, M.N.; Wu, C.B. Biomarker and stable carbon isotopic signatures for 100−200year sediment record in the Chaihe catchment in southwest China. Sci. Total Environ. 2015, 502, 266–275. [Google Scholar] [CrossRef]
  47. Yunnan Provincial Bureau of Statistics. Available online: http://www.stats.yn.gov.cn/ (accessed on 16 June 2019).
  48. Mil−Homens, M.; Blum, J.; Canário, J.; Caetano, M.; Costa, A.M.; Lebreiro, S.M.; Trancoso, M.; Richter, T.; De Stigter, H.; Johnson, M.; et al. Tracing anthropogenic Hg and Pb input using stable Hg and Pb isotope ratios in sediments of the central Portuguese Margin. Chem. Geol. 2013, 336, 62–71. [Google Scholar] [CrossRef] [Green Version]
  49. Gmochowska, W.; Pietranik, A.; Tyszka, R.; Ettler, V.; Mihaljevič, M.; Długosz, M.; Walenczak, K. Sources of pollution and distribution of Pb, Cd and Hg in Wrocław soils: Insight from chemical and Pb isotope composition. Geochemistry 2019, 79, 434–445. [Google Scholar] [CrossRef]
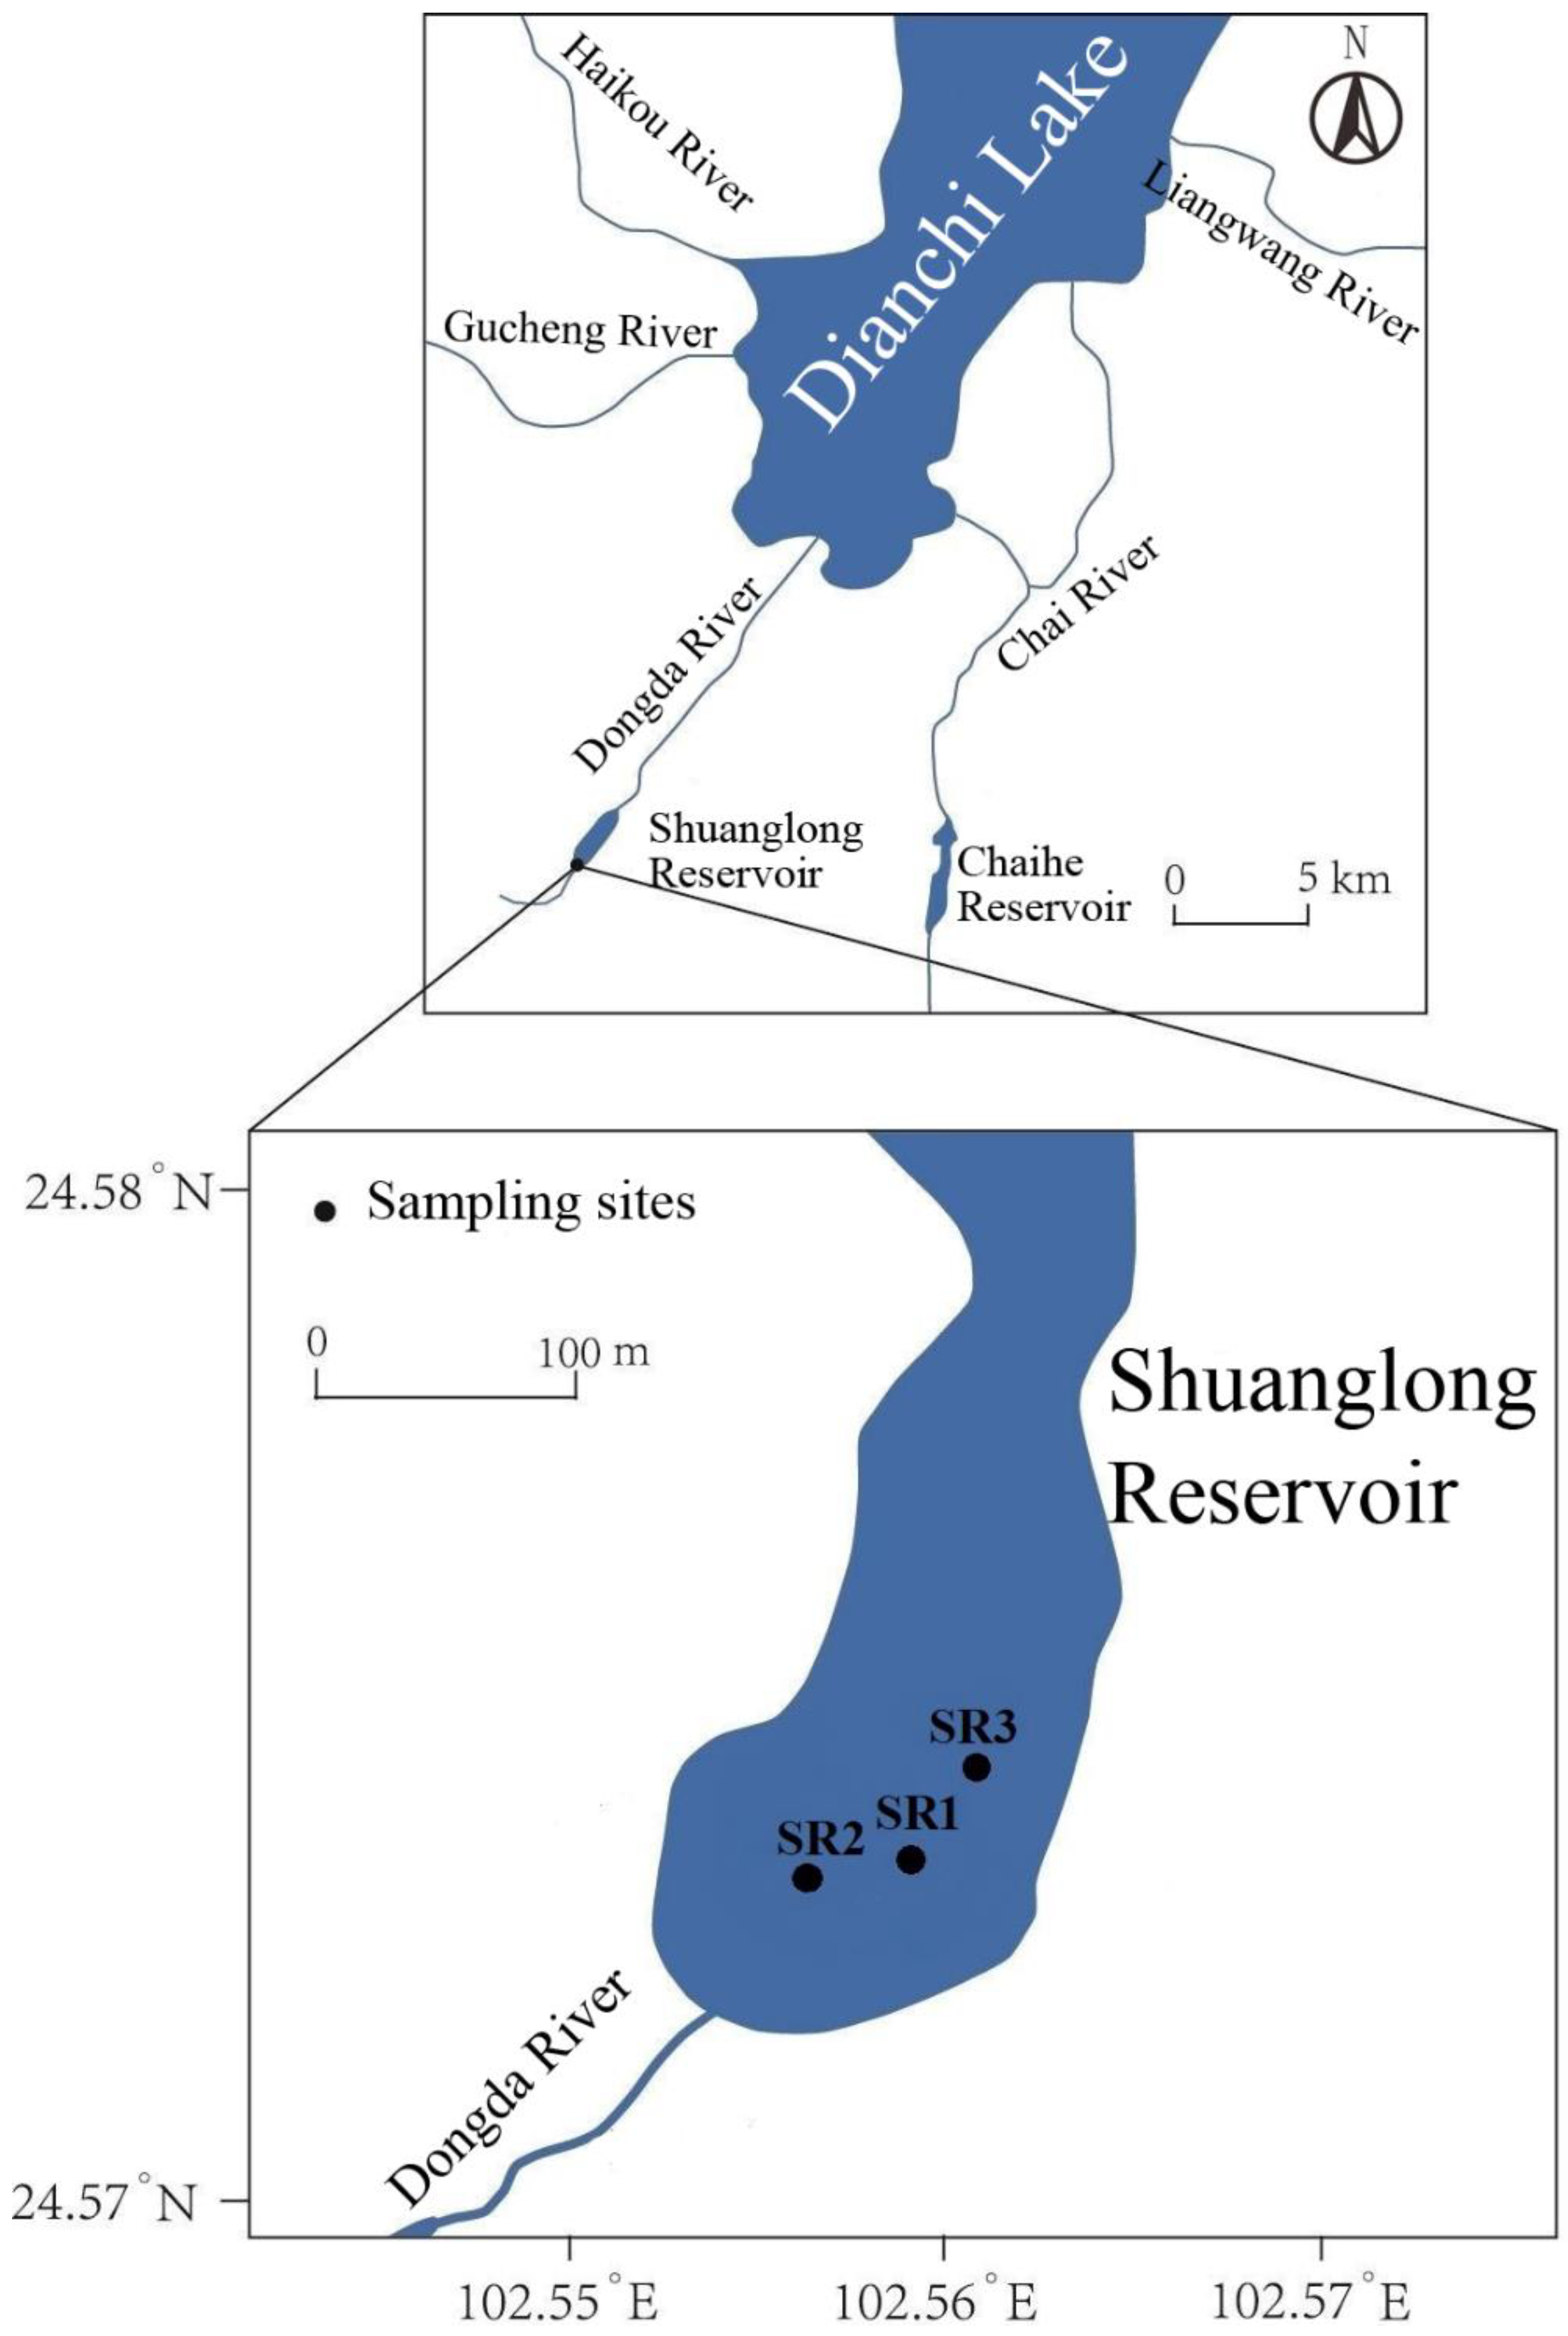
Figure 1. Distribution of sample points in the Shuanglong reservoir.
Water 12 01855 g001
Figure 2. (a) Profile distributions of unsupported 210Pb activity (210Pbex) in the core SR3. (b) 210Pb-derived chronology from the core SR3 in the Shuanglong reservoir.
Water 12 01855 g002
Figure 3. Heavy metal concentrations in the sediment core.
Water 12 01855 g003
Figure 4. Three-dimensional spatial load graph of heavy metal and total organic carbon (TOC) in the sediment of the Shuanglong reservoir.
Water 12 01855 g004
Figure 5. The possession of vehicles and gross industrial output (a), gross production (b), total population, urban population and rainfall (c), and crop fertilization (d) in Kunming over time.
Water 12 01855 g005aWater 12 01855 g005b
Figure 6. The profiles of the geo−accumulation index (Ig), single pollution index (Pi), Nemerow index (PN), potential ecological risk index (RI), and pollution load index (PLI) in the sediment core.
Water 12 01855 g006
Table 1. Soil background values, toxic response coefficients, Consensus-Based Sediments’ Quality Guidelines, and coefficient of variation of heavy metals in the sediment of the Shuanglong reservoir.
Heavy MetalsAsCrCuHgNiPbZn
Background values (mg/kg)18.465.246.30.05842.526.289.7
T r i 102540551
TEC   ( mg / kg ) a31.6022.70121.009.7943.400.1835.80
PEC   ( mg / kg ) b149.0048.60459.0033.00111.001.06128.00
Coefficient of variation (CV)0.310.260.260.380.250.440.34
a Thresholds’ effect concentration (TEC), adverse effects are not expected to occur; b Probable effects concentration (PEC), adverse effects are expected to occur frequently.
Table 2. Pollution levels of heavy metal based on different pollution indices in the sediment of the Shuanglong reservoir.
Rank Ig   Pollution Level P N Pollution Level E r i Pollution Level P i   Pollution Level RI Pollution LevelPLIPollution Level
0 ( - , 0 ) clean( 0 , 0.7)clean ( 0 , 40)low ( 0 , 1 ] clean(0,150)low( - ,1]Clean
1 [ 0 , 1 ) slight[0.7,1)warn[40 , 80)moderate [ 1 , 2 ) slight[150 , 300)moderate(1, + ) Pollution
2 [ 1 , 2 ) moderate [ 1 , 2 )slight[80 , 160)considerable[2 , 3 ) medium[300 , 600)considerable
3 [ 2 , 3 ) medium [ 2 , 3 )moderate[160 , 320)heavy(3, + )heavy [ 600, + )serious
4 [ 3 , 4 ) considerable ( 3 , + )heavy [ 320, + ) serious
5 [ 4 , 5 ) heavy
6 [ 5 , + ) serious
Table 3. Results of the correlation analysis among the heavy metals and other indicators in the sediment of the Shuanglong reservoir.
CrNiCuZnAsHgPb
Cr1.000
Ni0.957 **1.000
Cu0.937 **0.977 **1.000
Zn0.636 **0.748 **0.795 **1.000
As0.754 **0.802 *0.829 **0.866 **1.000
Hg0.1580.2130.1780.0730.0621.000
Pb0.0100.1010.0320.343 **0.292 *0.1531.000
pH−0.240−0.290 *−0.337 **−0.533 **−0.625 **−0.296−0.305 *
TOC−0.193−0.078−0.0360.533 **0.337 **−0.1990.647 **
Vehicles−0.368−0.196−0.198−0.383−0.0020.898 **0.802 **
Gross Industrial output−0.660 **−0.564 *−0.553 *−0.064−0.3880.791 **0.674 **
Gross production−0.736 **−0.641 **−0.641 **−0.033−0.2650.0320.596 **
Urban population−0.771 **−0.675 **−0.681 **−0.164−0.4160.803 **0.631 **
Fertilizer−0.755 **−0.668 **−0.670 **−0.191−0.4490.907 **0.544 *
Nitrogen fertilizer−0.795 **−0.721 **−0.720 **−0.265−0.514 *0.859 **0.498 *
Phosphate fertilizer−0.573 *−0.483 *−0.503 **−0.067−0.2380.874 **0.500 *
Potassium fertilizer−0.507 *−0.386−0.376−0.080−0.1800.828 **0.599 **
Compound fertilizer−0.729 **−0.626 **−0.626 **−0.112−0.4110.901 **0.612 **
Rainfall0.3190.3220.2700.2320.274−0.337−0.147
* Correlation is significant at the 0.05 level (2−tailed); ** Correlation is significant at the 0.01 level (2−tailed).