Water Resource Systems Analysis for Water Scarcity Management: The Thames Water Case Study


Abstract
1. Introduction
2. Materials and Methods
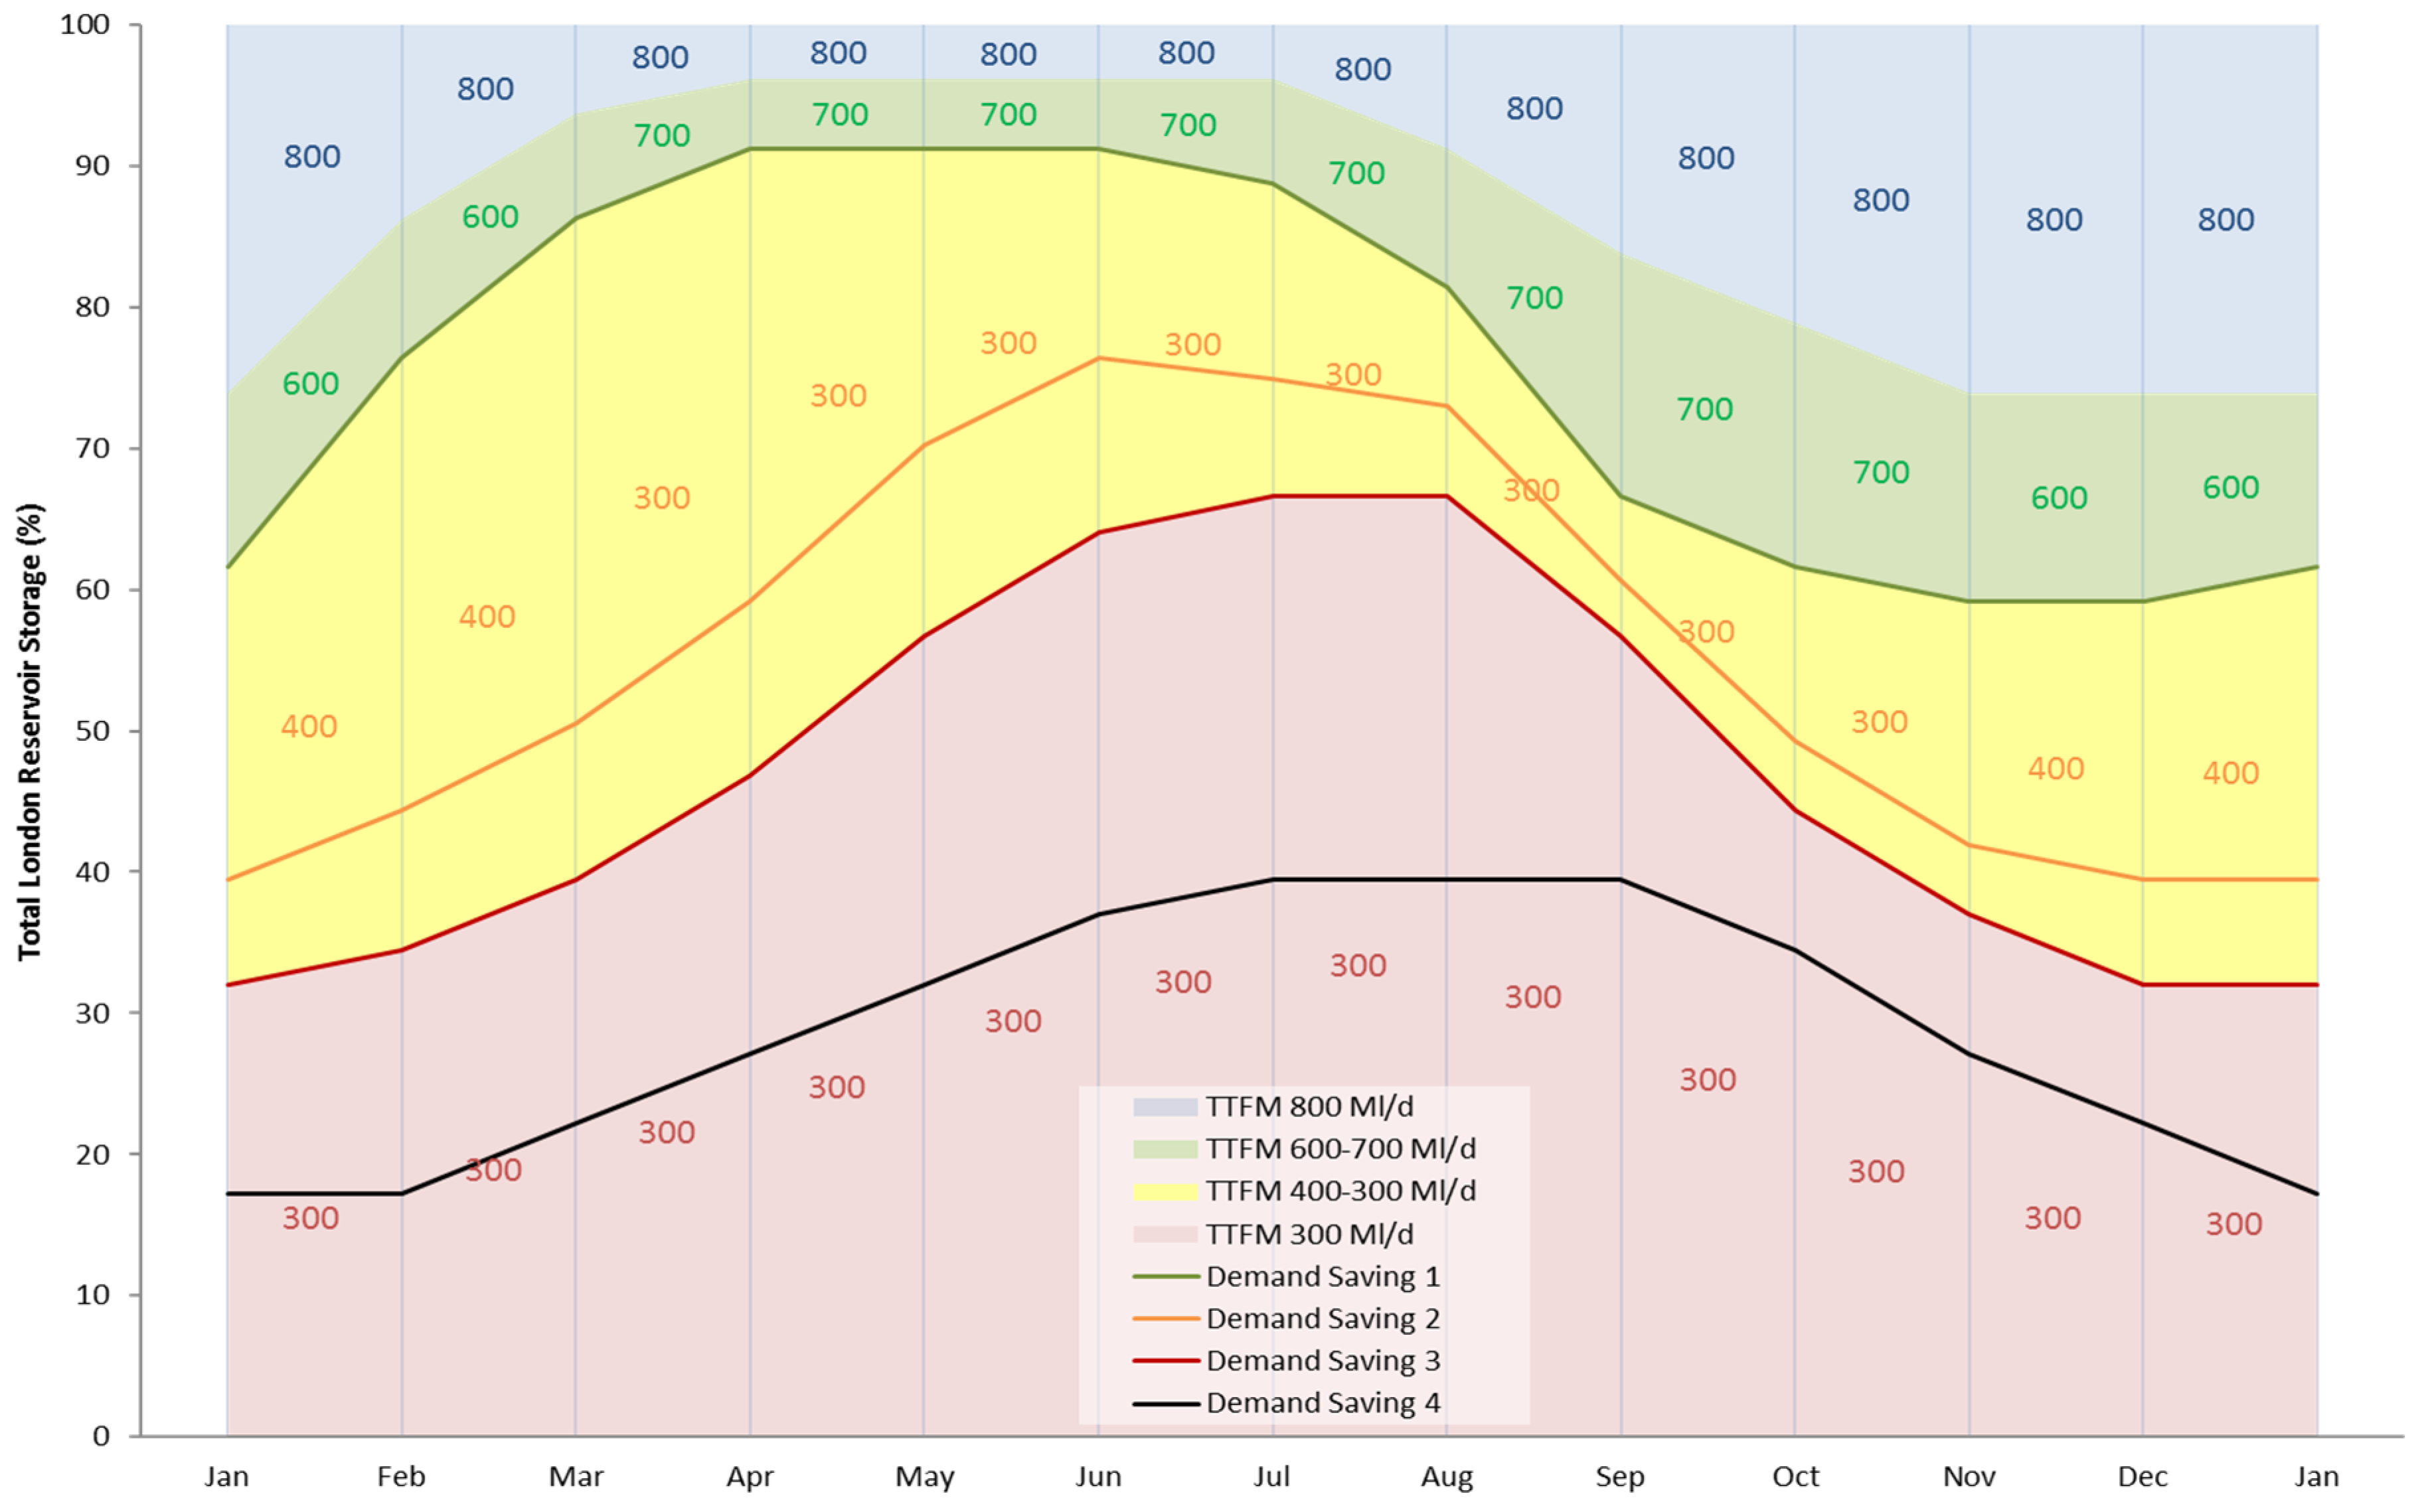
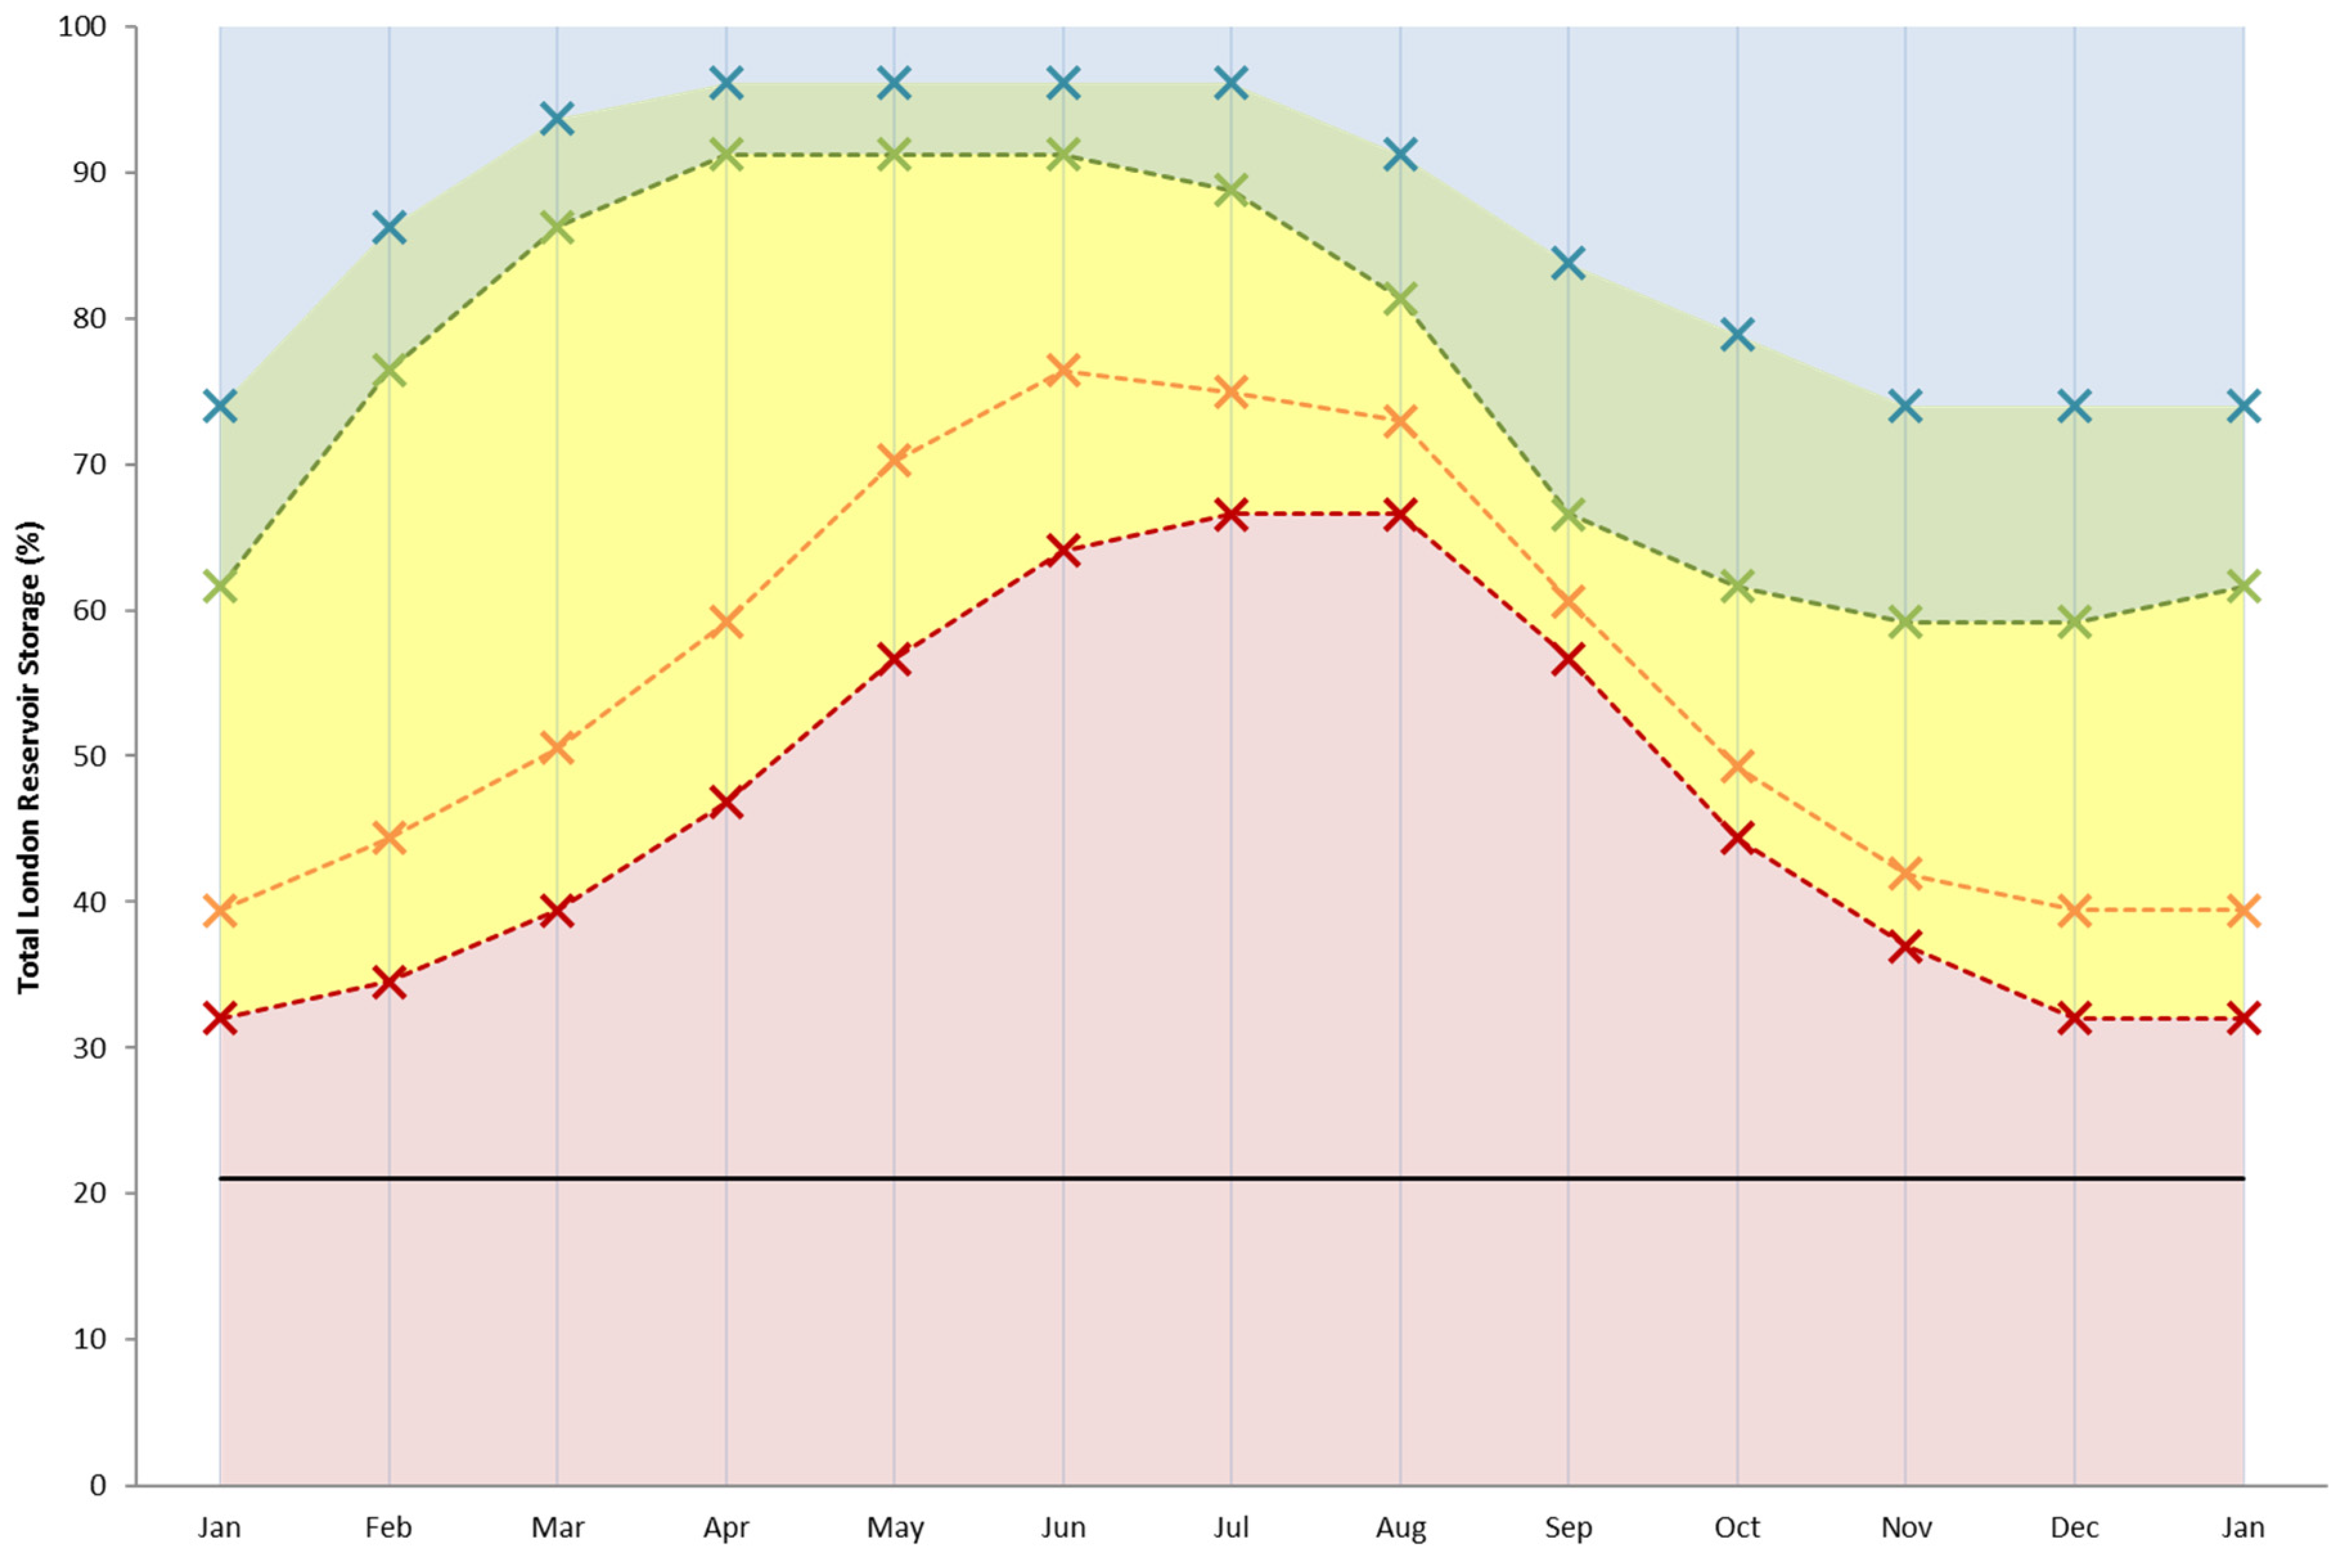
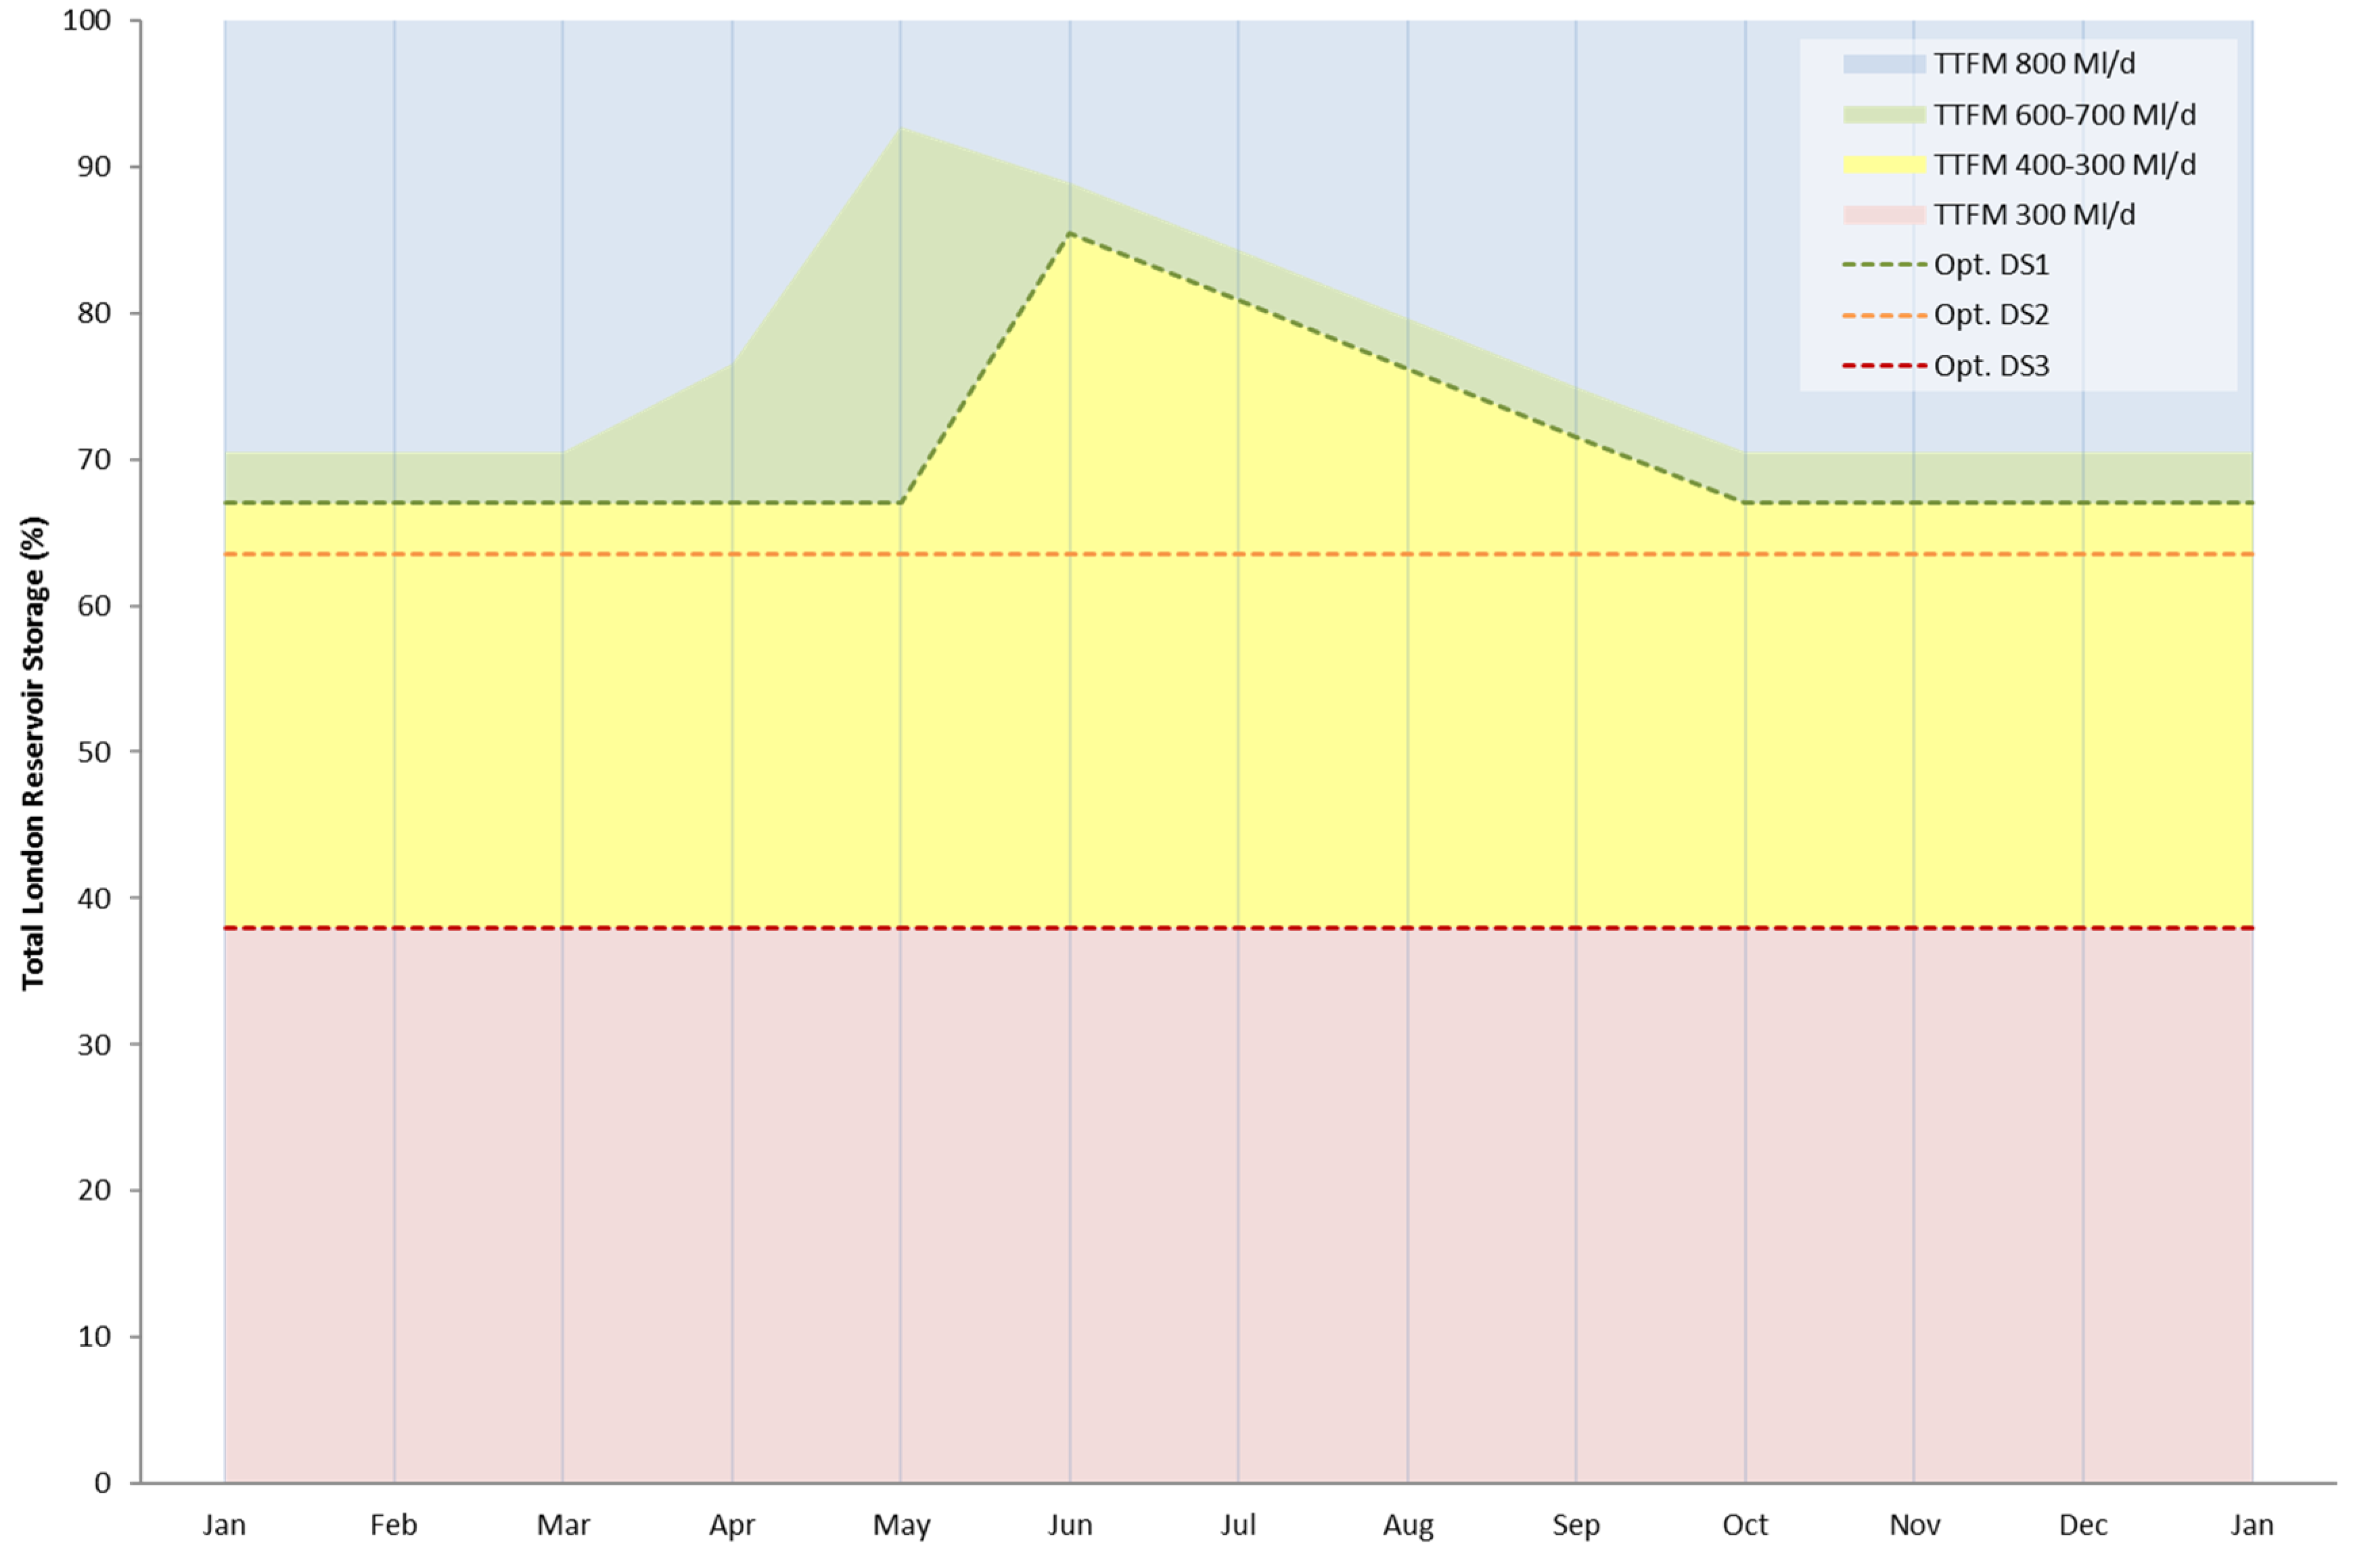
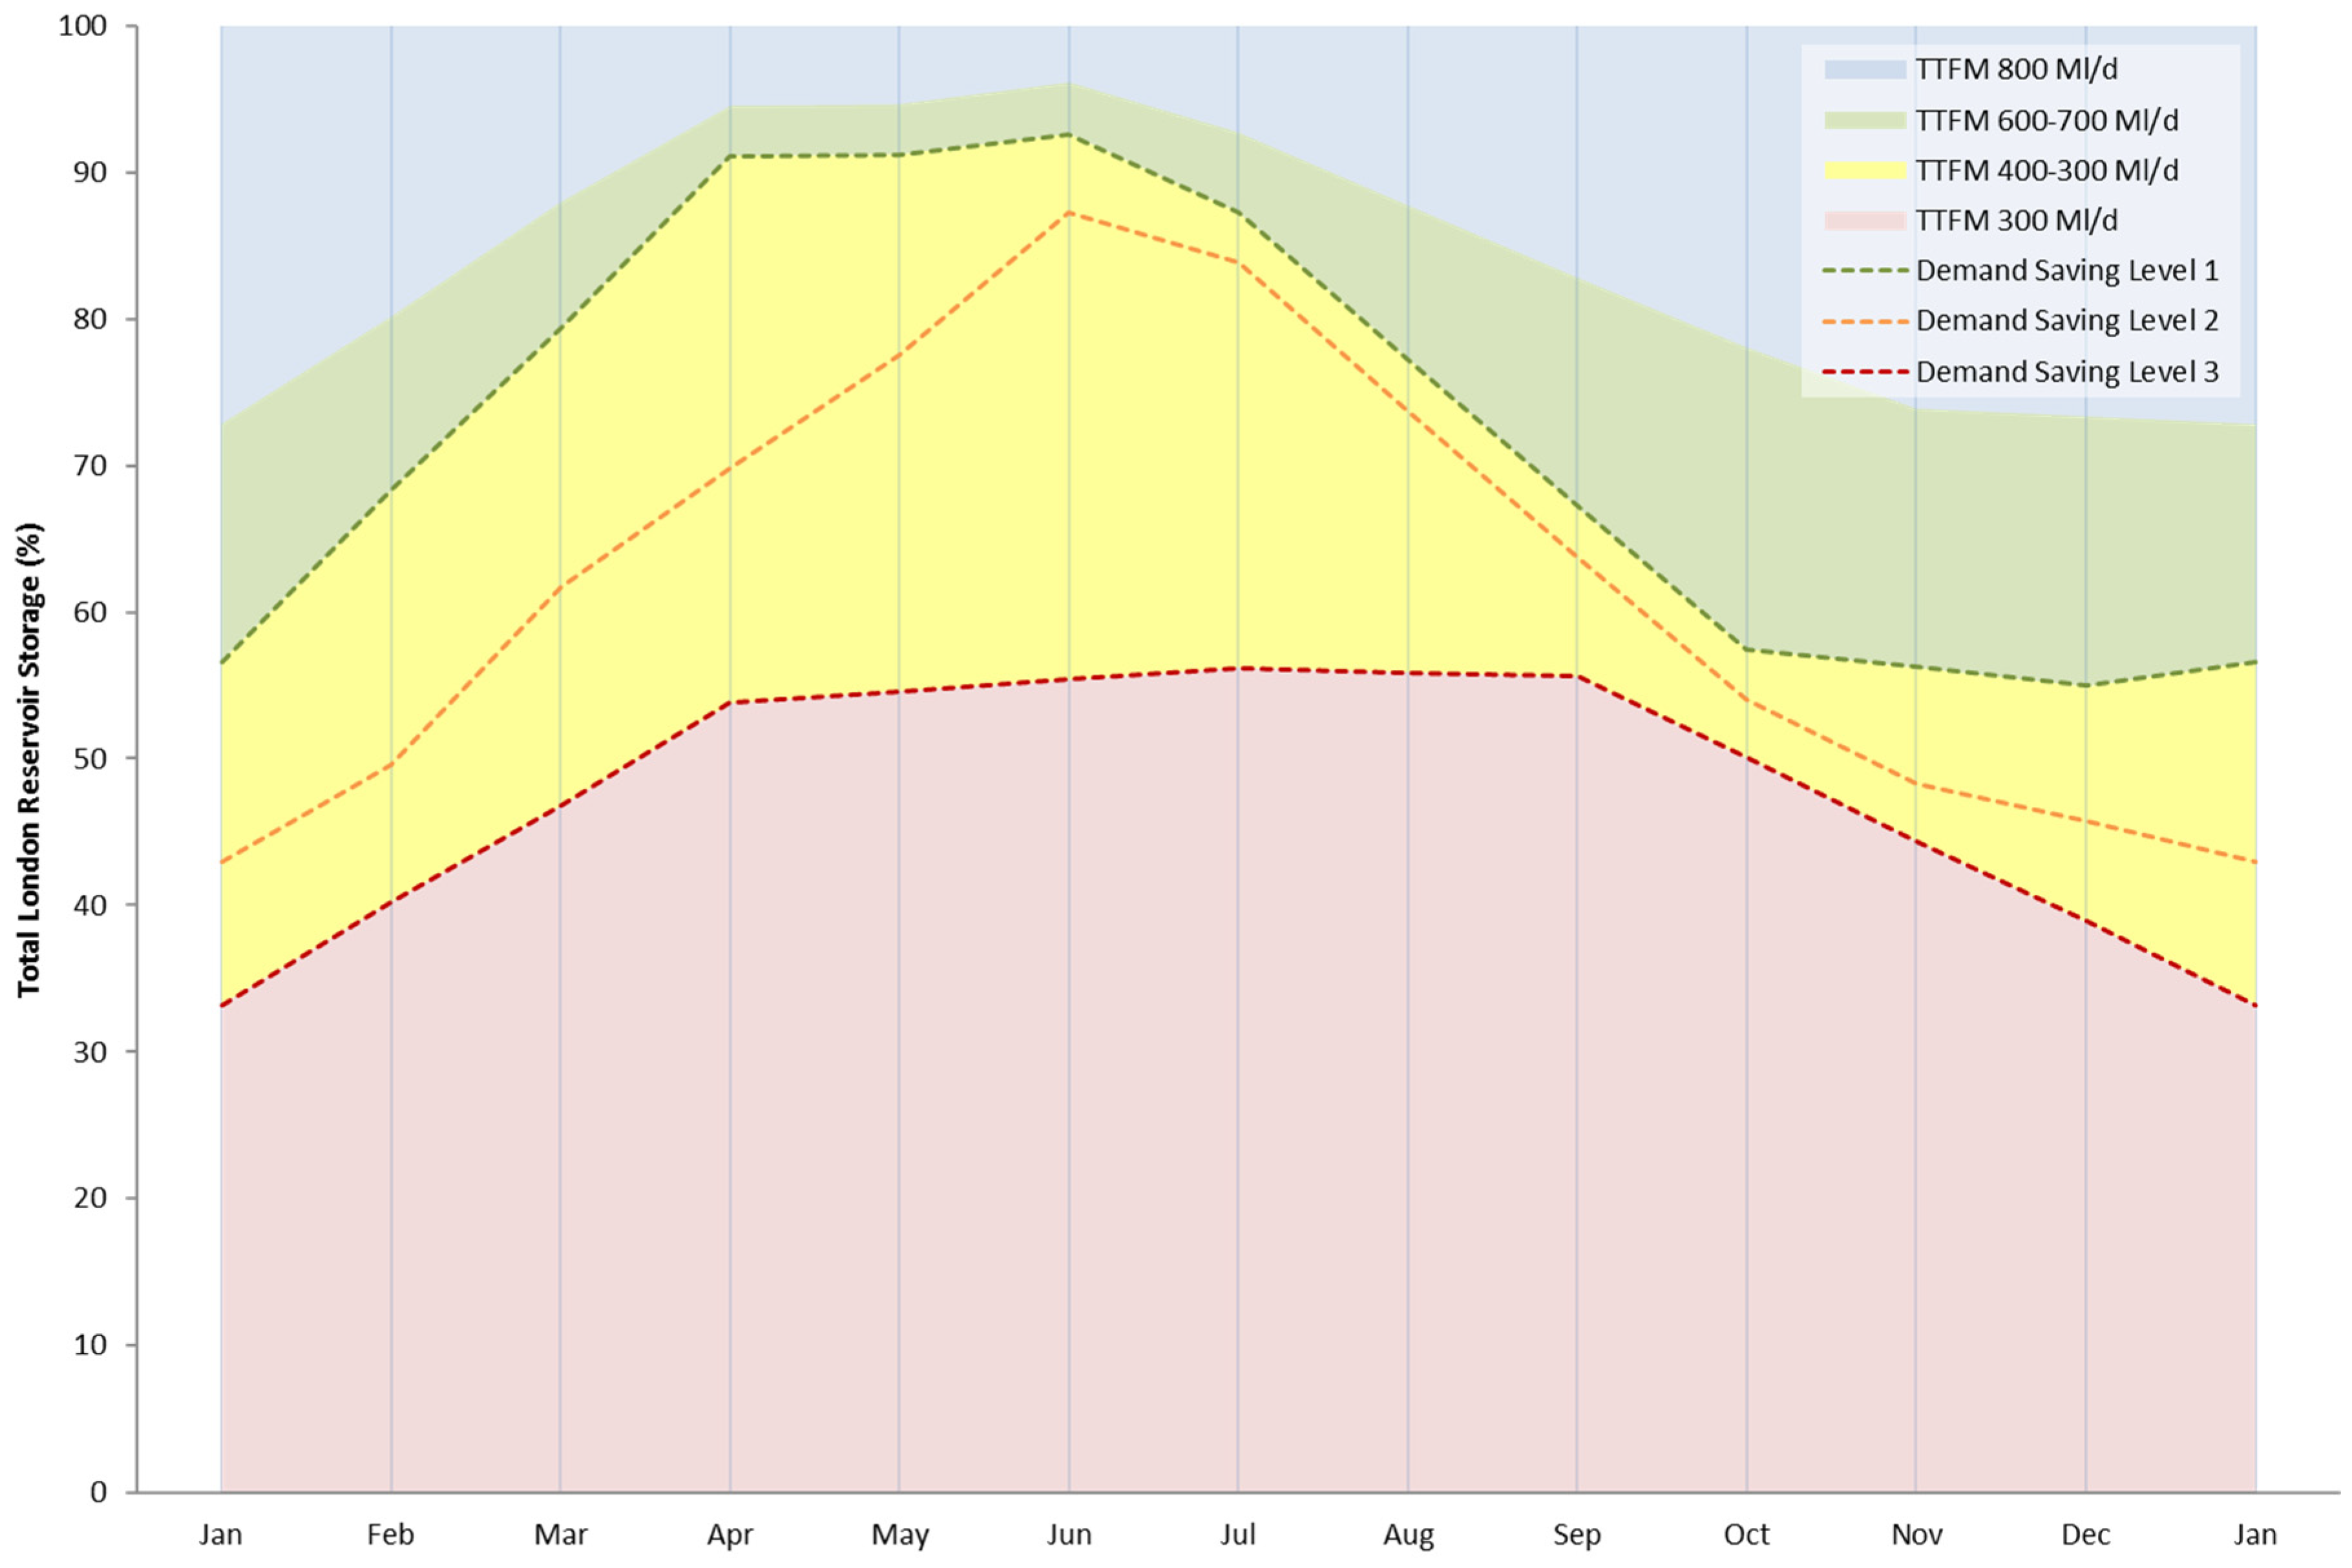
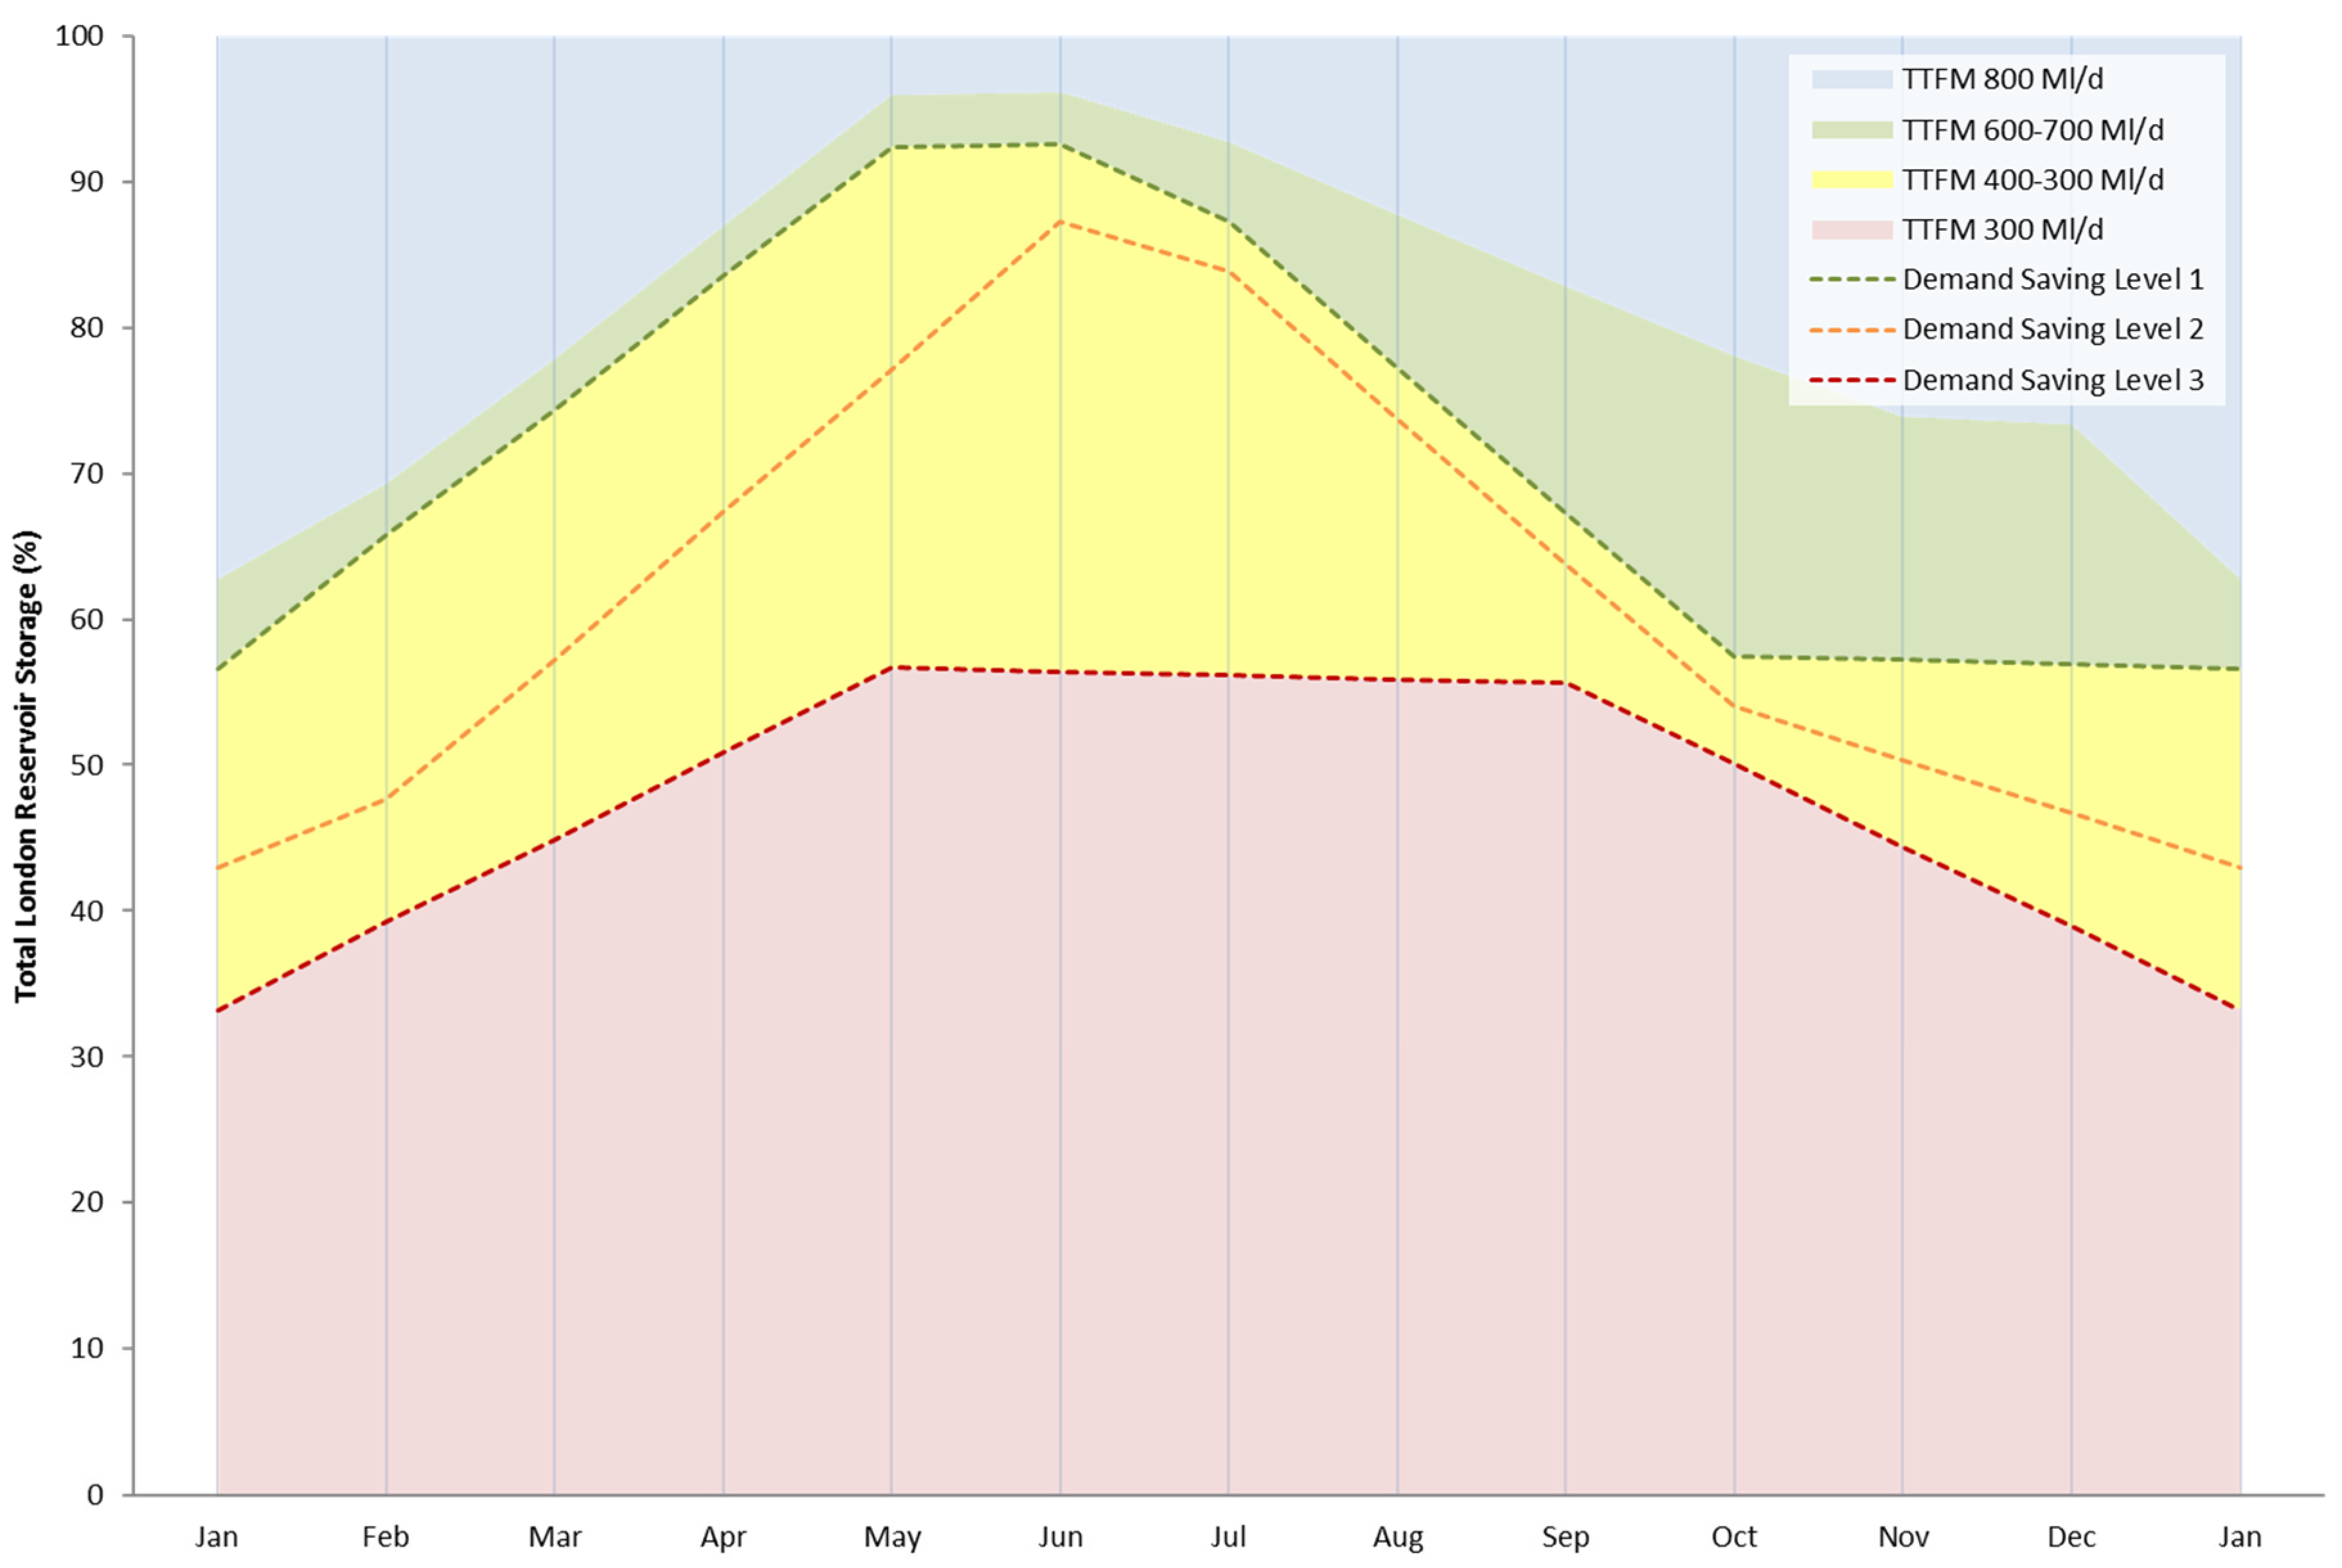
2.1. Lower Thames Control Diagram
- Level 1: intensive media campaign.
- Level 2: sprinkler/unattended hosepipe ban and enhanced media campaign.
- Level 3: temporary use ban, ordinary drought order (non-essential use ban).
- Level 4: emergency drought order (e.g., standpipes and rota cuts).
2.2. Constraints
- Level 1 events should occur at a frequency of no more than 1 in 5 years.
- Level 2 events should occur at a frequency of no more than 1 in 10 years.
- Level 3 events should occur at a frequency of no more than 1 in 20 years.
- Level 4 events are considered unacceptable and thus any solution must not allow such an event.
2.3. Aquator Model
2.4. Genetic Algorithm Optimisation
3. Results
4. Discussion
5. Conclusions
Author Contributions
Funding
Acknowledgments
Conflicts of Interest
References
- Brown, C.M.; Lund, J.R.; Cai, X.; Reed, P.M.; Zagona, E.A.; Ostfeld, A.; Hall, J.; Characklis, G.W.; Yu, W.; Brekke, L. The future of water resources systems analysis: Toward a scientific framework for sustainable water management. Water Resour. Res. 2015, 51, 6110–6124. [Google Scholar] [CrossRef]
- Vojinović, Z.; Abbott, M.B. Twenty-five years of hydroinformatics. Water 2017, 9, 59. [Google Scholar] [CrossRef]
- Freeman, D.M. Wicked water problems: Sociology and local water organizations in addressing water resources policy. J. Am. Water Resour. Assoc. 2000, 36, 483–491. [Google Scholar] [CrossRef]
- Reed, P.M.; Kasprzyk, J. Water resources management: The myth, the wicked, and the future. J. Water Resour. Plan. Manag. 2009, 135, 411–413. [Google Scholar] [CrossRef]
- Simonović, S.P. Reservoir systems analysis: Closing gap between theory and practice. J. Water Resour. Plan. Manag. 1992, 118, 262–280. [Google Scholar] [CrossRef]
- Labadie, J.W. Optimal operation of multireservoir systems: State-of-the-art review. J. Water Resour. Plan. Manag. 2004, 130, 93–111. [Google Scholar] [CrossRef]
- Quinn, J.D.; Reed, P.M.; Giuliani, M.; Castelletti, A. What is controlling our control rules? Opening the black box of multireservoir operating policies using time-varying sensitivity analysis. Water Resour. Res. 2019, 55, 5962–5984. [Google Scholar] [CrossRef]
- Macian-Sorribes, H.; Pulido-Velazquez, M. Inferring efficient operating rules in multireservoir water resource systems: A review. Wiley Interdiscip. Rev. Water 2020, 7, e1400. [Google Scholar] [CrossRef]
- Loucks, D.P. Managing water as a critical component of a changing world. Water Resour. Manag. 2017, 31, 2905–2916. [Google Scholar] [CrossRef]
- Water UK. Water Resources Long Term Planning Framework (2015–2065); Water: London, UK, 2016. [Google Scholar]
- Water Resources Act. 1991. Available online: http://www.legislation.gov.uk/ukpga/1991/57/contents (accessed on 15 May 2020).
- The Water Use (Temporary Bans) Order. 2010. Available online: http://www.legislation.gov.uk/uksi/2010/2231/contents/made (accessed on 15 May 2020).
- Thames Gateway Water Treatment Works. Available online: https://www.thameswater.co.uk/help-and-advice/water-quality/where-our-water-comes-from/thames-gateway-water-treatment-works (accessed on 15 May 2020).
- Thames Water. Water Resources Management Plan. 2015–2040; Thames Water Utilities Ltd.: Reading, UK, 2014. [Google Scholar]
- Flood and Water Management Act. 2010. Available online: http://www.legislation.gov.uk/ukpga/2010/29/contents (accessed on 15 May 2020).
- Hydro-Logic Aquator. 2020. Available online: https://hydro-int.com/en-gb/products/hydro-logic-aquator (accessed on 15 May 2020).
- Vamvakeridou-Lyroudia, L.S.; Morley, M.S.; Bicik., J.; Green, C.; Smith, M.; Savić, D.A. AquatorGA: Integrated Optimisation for Reservoir Operation using Multiobjective Genetic Algorithms. In Integrated Water Systems: Proceedings 10th International Conference Computing and Control for the Water Industry; Boxall, J., Maksimović, Č., Eds.; Taylor & Francis: Sheffield, UK, 2010; pp. 493–500. [Google Scholar]
- Deb, K.; Tiwari, S. Omni-Optimizer: A Generic Evolutionary Algorithm for Single and Multi-Objective Optimization. Eur. J. Oper. Res. 2008, 185, 1062–1087. [Google Scholar] [CrossRef]
- Thames Water. Water Resources Management Plan. 2019. Section 4: Current and Future Water Supply—April 2020; Thames Water Utilities Ltd.: Reading, UK, 2019; p. 47. [Google Scholar]
- Loftus, A.; March, H. Financializing desalination: Rethinking the returns of big infrastructure. Int. J. Urban Reg. Res. 2016, 40, 46–61. [Google Scholar] [CrossRef]
- Hughes, S.N.; Willis, D.J. The fish communities of the River Thames: Status, pressures and management. In Management and Ecology of River Fisheries; Cowx, I.G., Ed.; Wiley-Blackwell: Oxford, UK, 2008; pp. 55–70. [Google Scholar]
- van der Voorn, T.; Svenfelt, A.; Bjornberg, K.E.; Faure, E.; Milestad, R. Envisioning carbon-free land use futures for Sweden: A scenario study on conflicts and synergies between environmental policy goals. Reg. Environ. Chang. 2020, 20, 1–10. [Google Scholar] [CrossRef]


| LTCD Version | Deployable Output (Ml/day) | % Change |
|---|---|---|
| Baseline | 2285 1 | n/a |
| Optimised: simple) | 2144 | −6.2% |
| Optimised: complex | 2308 | 1.0% |
| Optimised: increased storage | 2335 | 1.2% |
© 2020 by the authors. Licensee MDPI, Basel, Switzerland. This article is an open access article distributed under the terms and conditions of the Creative Commons Attribution (CC BY) license (http://creativecommons.org/licenses/by/4.0/).
Share and Cite
Morley, M.; Savić, D. Water Resource Systems Analysis for Water Scarcity Management: The Thames Water Case Study. Water 2020, 12, 1761. https://doi.org/10.3390/w12061761
Morley M, Savić D. Water Resource Systems Analysis for Water Scarcity Management: The Thames Water Case Study. Water. 2020; 12(6):1761. https://doi.org/10.3390/w12061761
Chicago/Turabian StyleMorley, Mark, and Dragan Savić. 2020. "Water Resource Systems Analysis for Water Scarcity Management: The Thames Water Case Study" Water 12, no. 6: 1761. https://doi.org/10.3390/w12061761
APA StyleMorley, M., & Savić, D. (2020). Water Resource Systems Analysis for Water Scarcity Management: The Thames Water Case Study. Water, 12(6), 1761. https://doi.org/10.3390/w12061761