1. Introduction
Floods are considered to be the most common and frequent natural hazards [
1]. In recent decades, flood hazards have increased throughout the world. The severity of a flood is directly related to several factors, including population growth in urban areas and expansion in economic and social infrastructure. Furthermore, changes in land-use play an important role in the hydrological behavior of drainage basins, the hydrological cycle, and the morphology of wadis, which lead to an increase in flood hazard [
2]. A wadi is a natural watercourse depression on the earth’s surface, which is dry except during periods of rainfall.
The occurrence of extreme climate changes around the world have a major impact on the frequency of occurrence of floods, as well as their dynamics, rapidness, and destructivity [
3]. Climate changes affect the amount of water falling into the wadi network and, consequently, the amount of runoff. Other geographical factors also affect the severity of the floods, including the topography, geomorphology, and morphometry.
In recent years, flood hazard maps have represented a major and strategic component of flood mitigation. Flood hazard maps aim to provide residents with information on probable damages and potential disaster prevention [
4]. Flood hazard maps are considered nonstructural representations for the mitigation of the potential impacts of floods. These maps can be produced in various forms, such as maps for flood tracking, emergency action plans, flood information, and flood hazard reduction, as well as for various other purposes [
5].
Mapping of natural hazards and hazard analysis along road pathways and railway tracks involves several criteria [
6,
7]. Geographic information system (GIS) and remote sensing (RS) technologies have made significant contributions to the analysis of natural hazards [
8,
9,
10]. Over the past few decades, researchers have developed various methods and models for natural hazard mapping, including GIS-RS [
11,
12,
13], frequency rate [
14,
15], analytical hierarchy process [
16], fuzzy logic [
17], logistic regression [
18], artificial neural networks [
19,
20,
21], weights-of-evidence [
22], multicriteria decision [
23], support vector machine models [
24], adaptive neuro-fuzzy inference system (ANFIS) [
25,
26], biogeography-based optimization [
27], decision tree [
28], multivariate adaptive regression splines [
29], and hydraulic modeling techniques, which are considered essential tools for flood hazard management and mitigation [
30,
31,
32].
This study combines the multicriteria analysis based on geographic information systems (GIS-MCDA) approach and the analytic hierarchy process (AHP). Multicriteria analysis (MCA) is considered an important tool in the analysis of complex decision problems, which often involve noncomparable criteria or data [
33]. The AHP is the most common method for multicriteria decision-making [
34,
35].
Olga et al. [
36], Nerantzis et al. [
37], and Somaiyeh and Mehran [
38] discussed the mapping of flood hazard using multicriteria analysis integrated with GIS, RS, and the AHP, respectively. These various studies identified six factors which affect the occurrence of floods, including the cumulative runoff, distance from the water drainage network, elevation, land-uses, rainfall density, and geology.
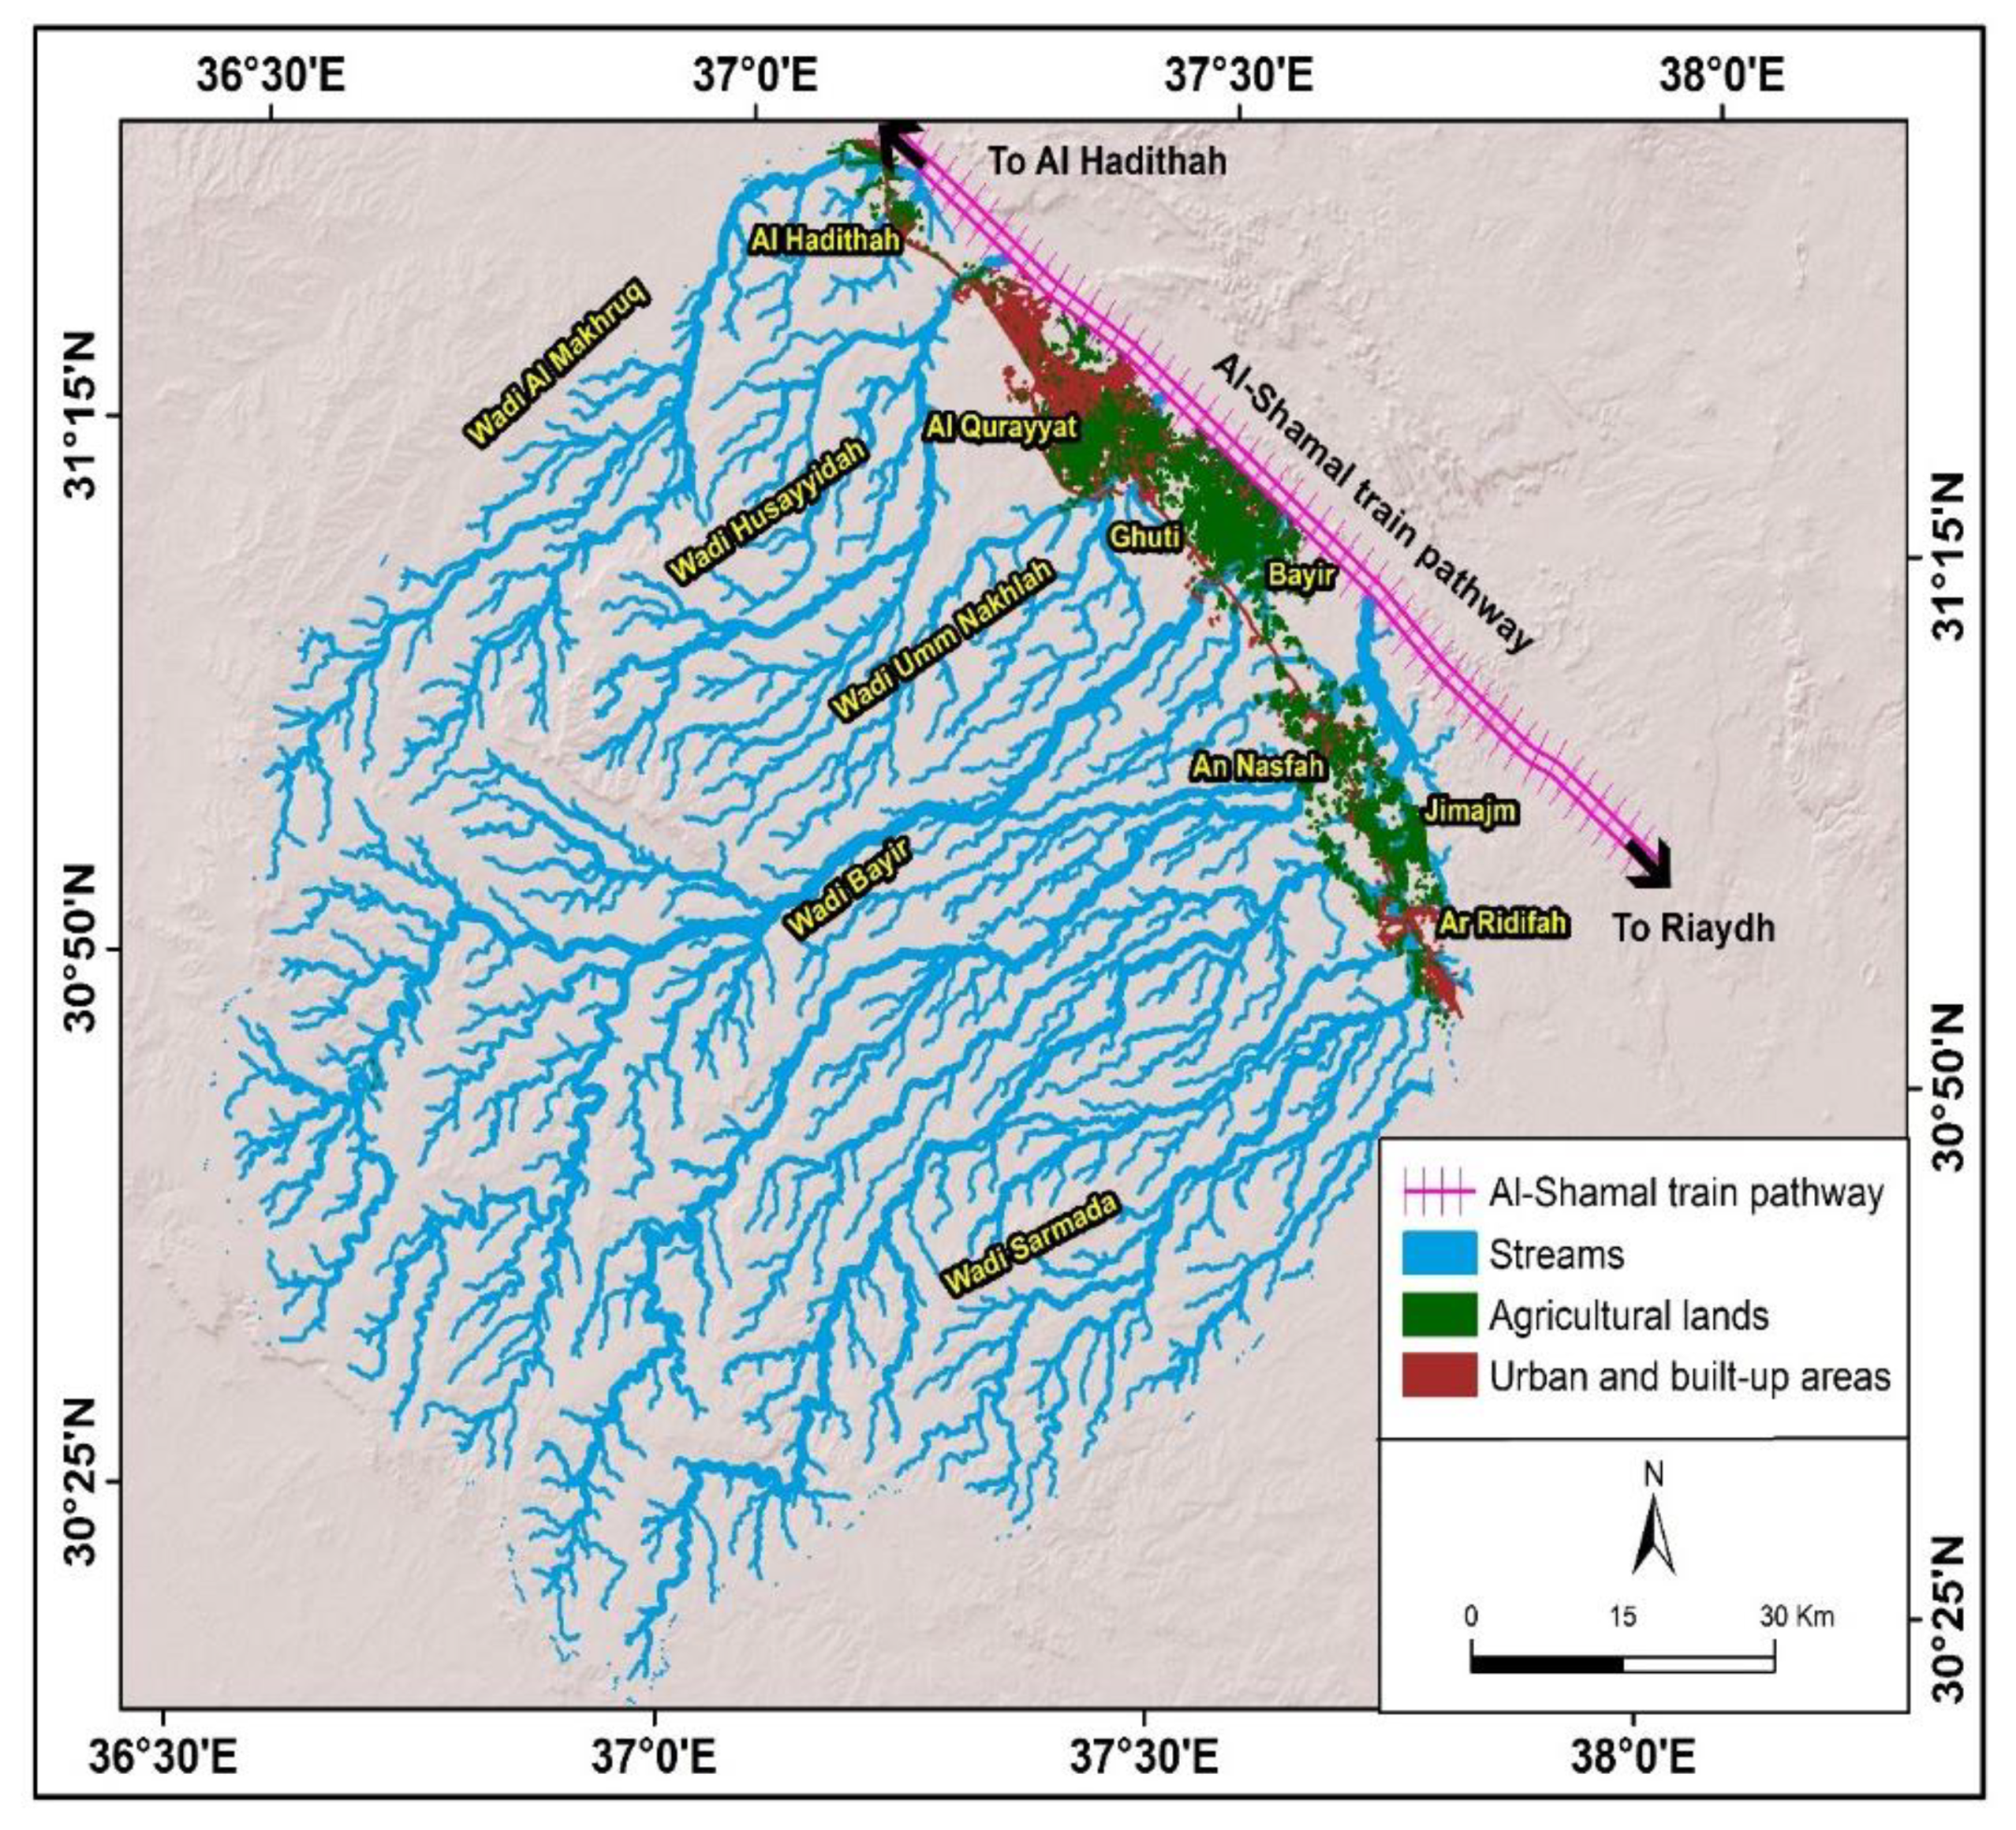
The main concern of this study is to shed light on the flood hazards in the study area, concentrating on the impacts of five main wadis (from west to east and from north to south), namely: Wadi Al-Makhrouk, which influences Hadithah village to the north of Qurayyat city and strikes the railway in the north; Wadi Haseidah Al-Gharbiyeh, which affects the north of Al-Qurayyat city; Wadi Haseidah, Umm Nakhleh, which influences the southern part of Al-Qurayyat city; Wadi Bayer, which threatens the villages of Bayer and Ghati, and covers the railway track part facing them; and, finally, Wadi Sarmada, which impacts on the villages of Al-Nasifah, Skullim, and Al-Rudaifa.
The flow of these wadis have severe negative impacts, resulting in the occurrence of frequent annual floods.
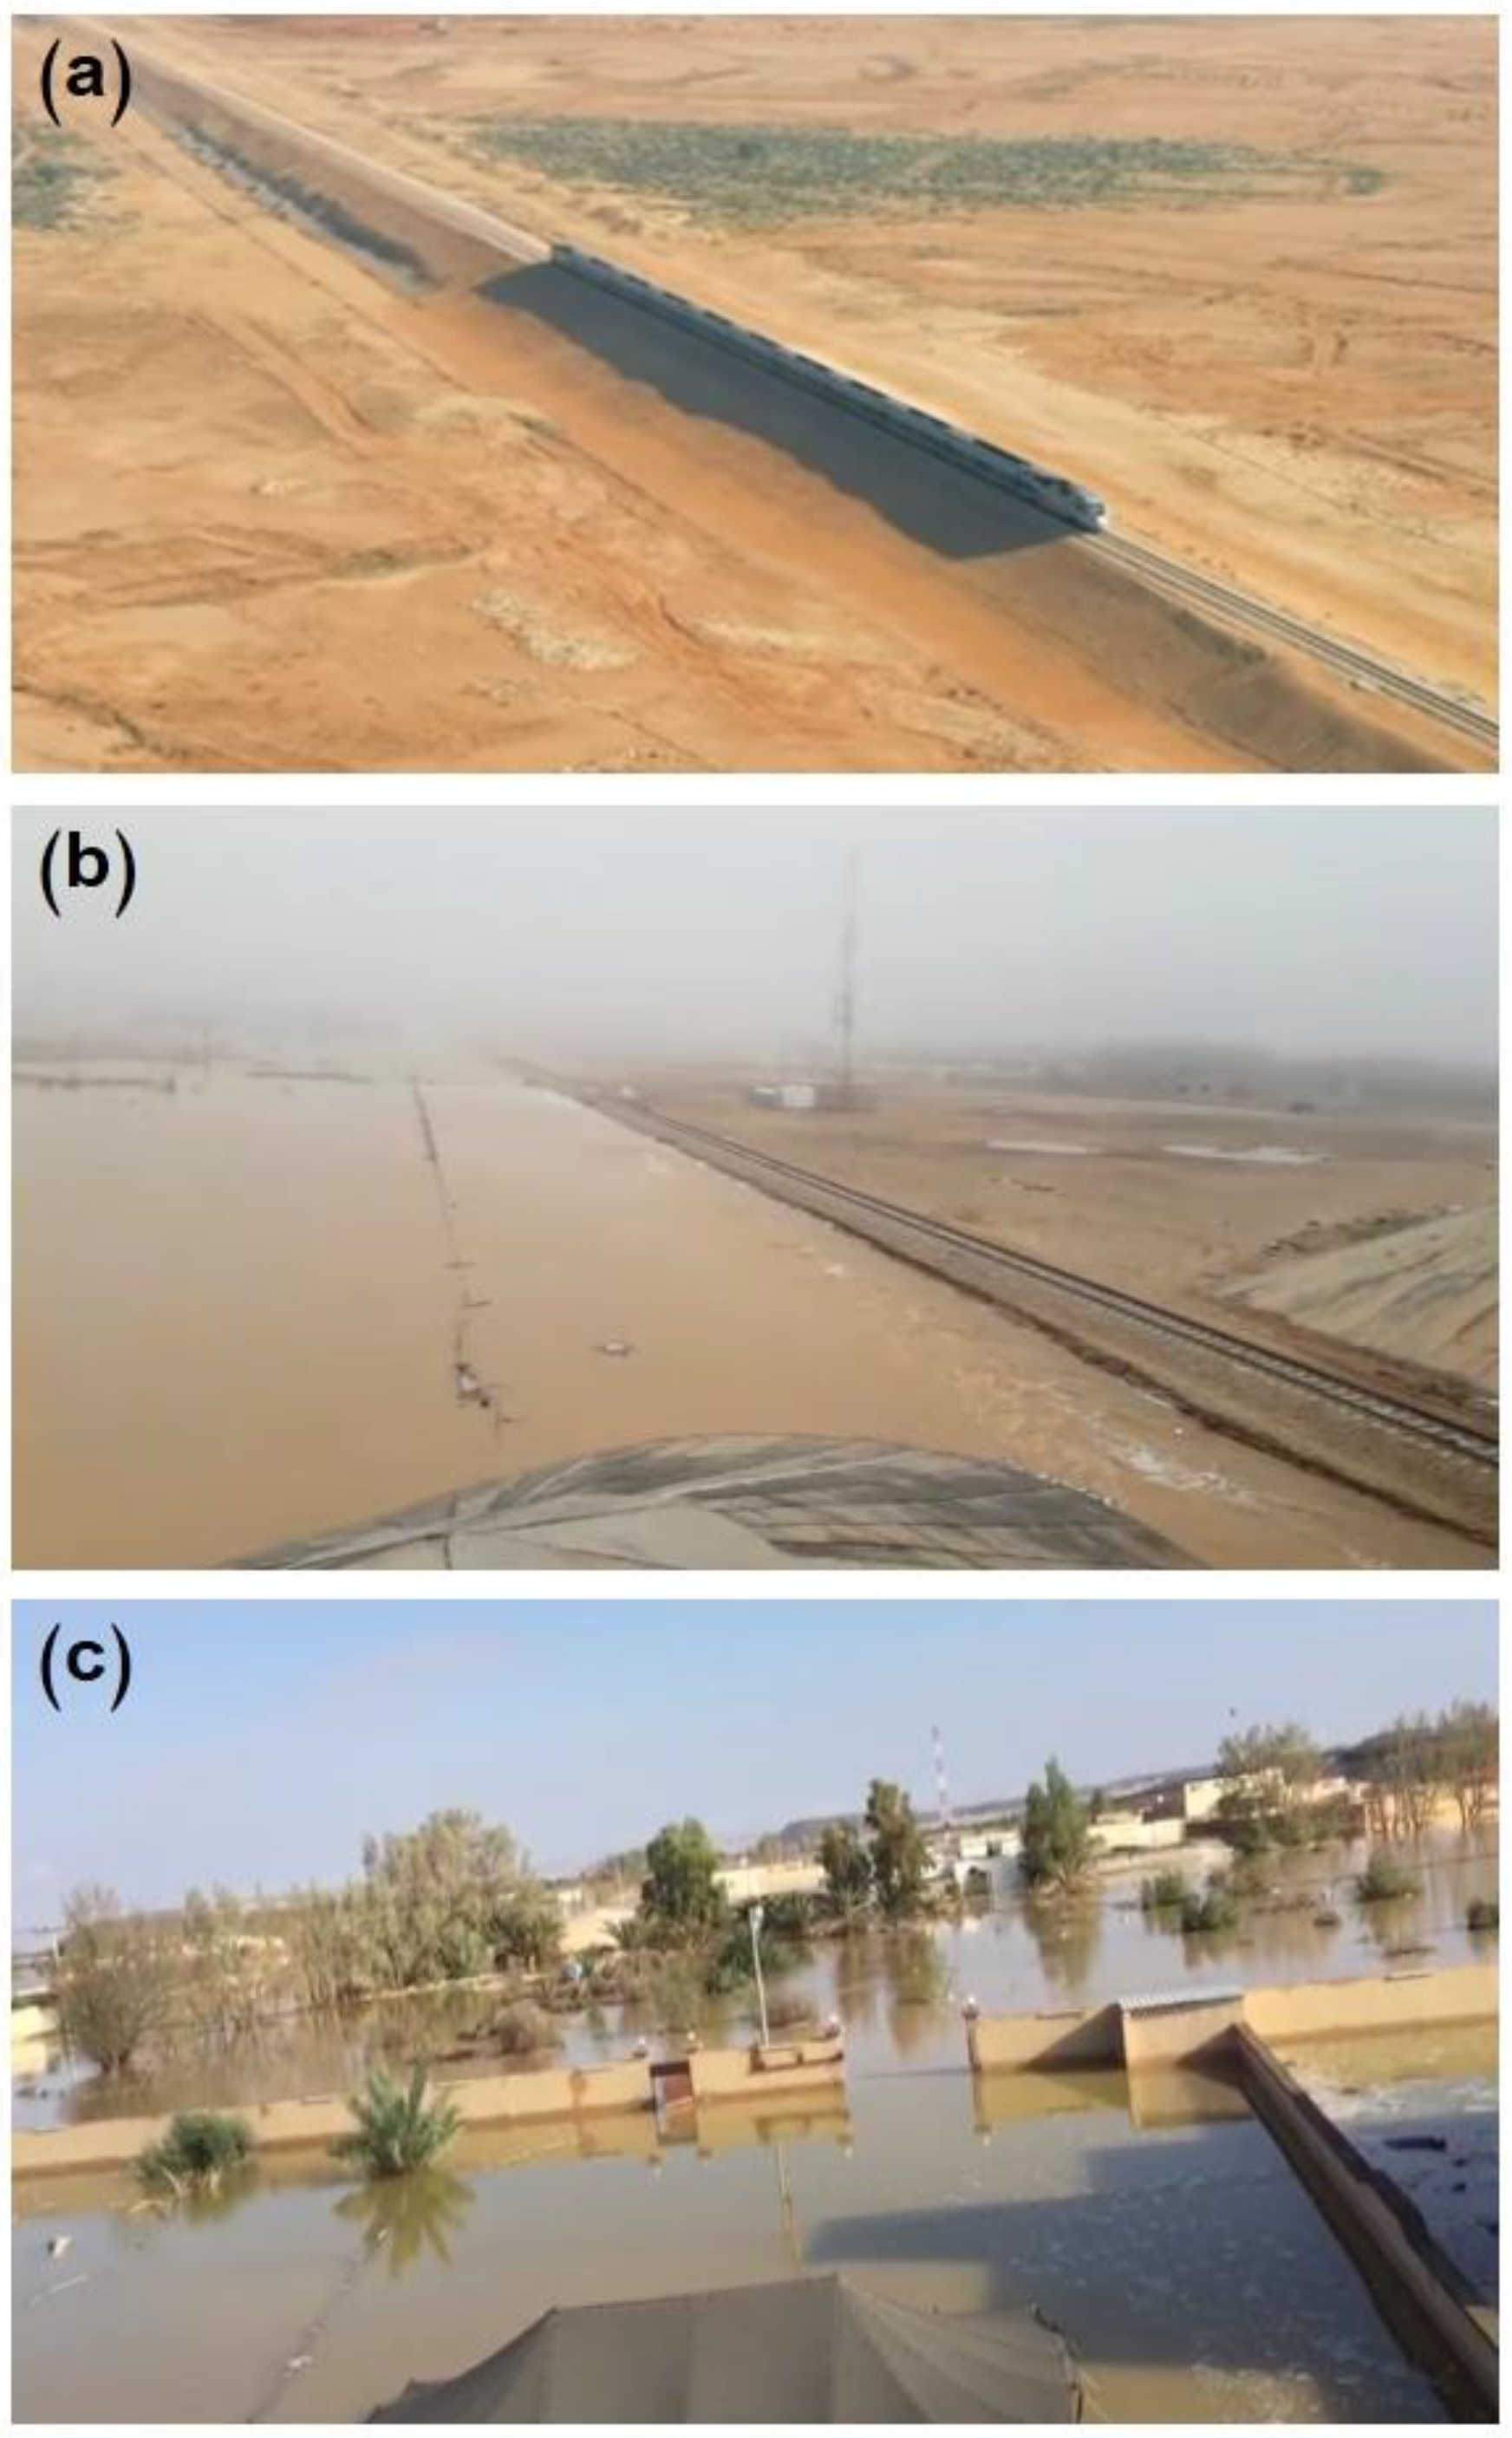
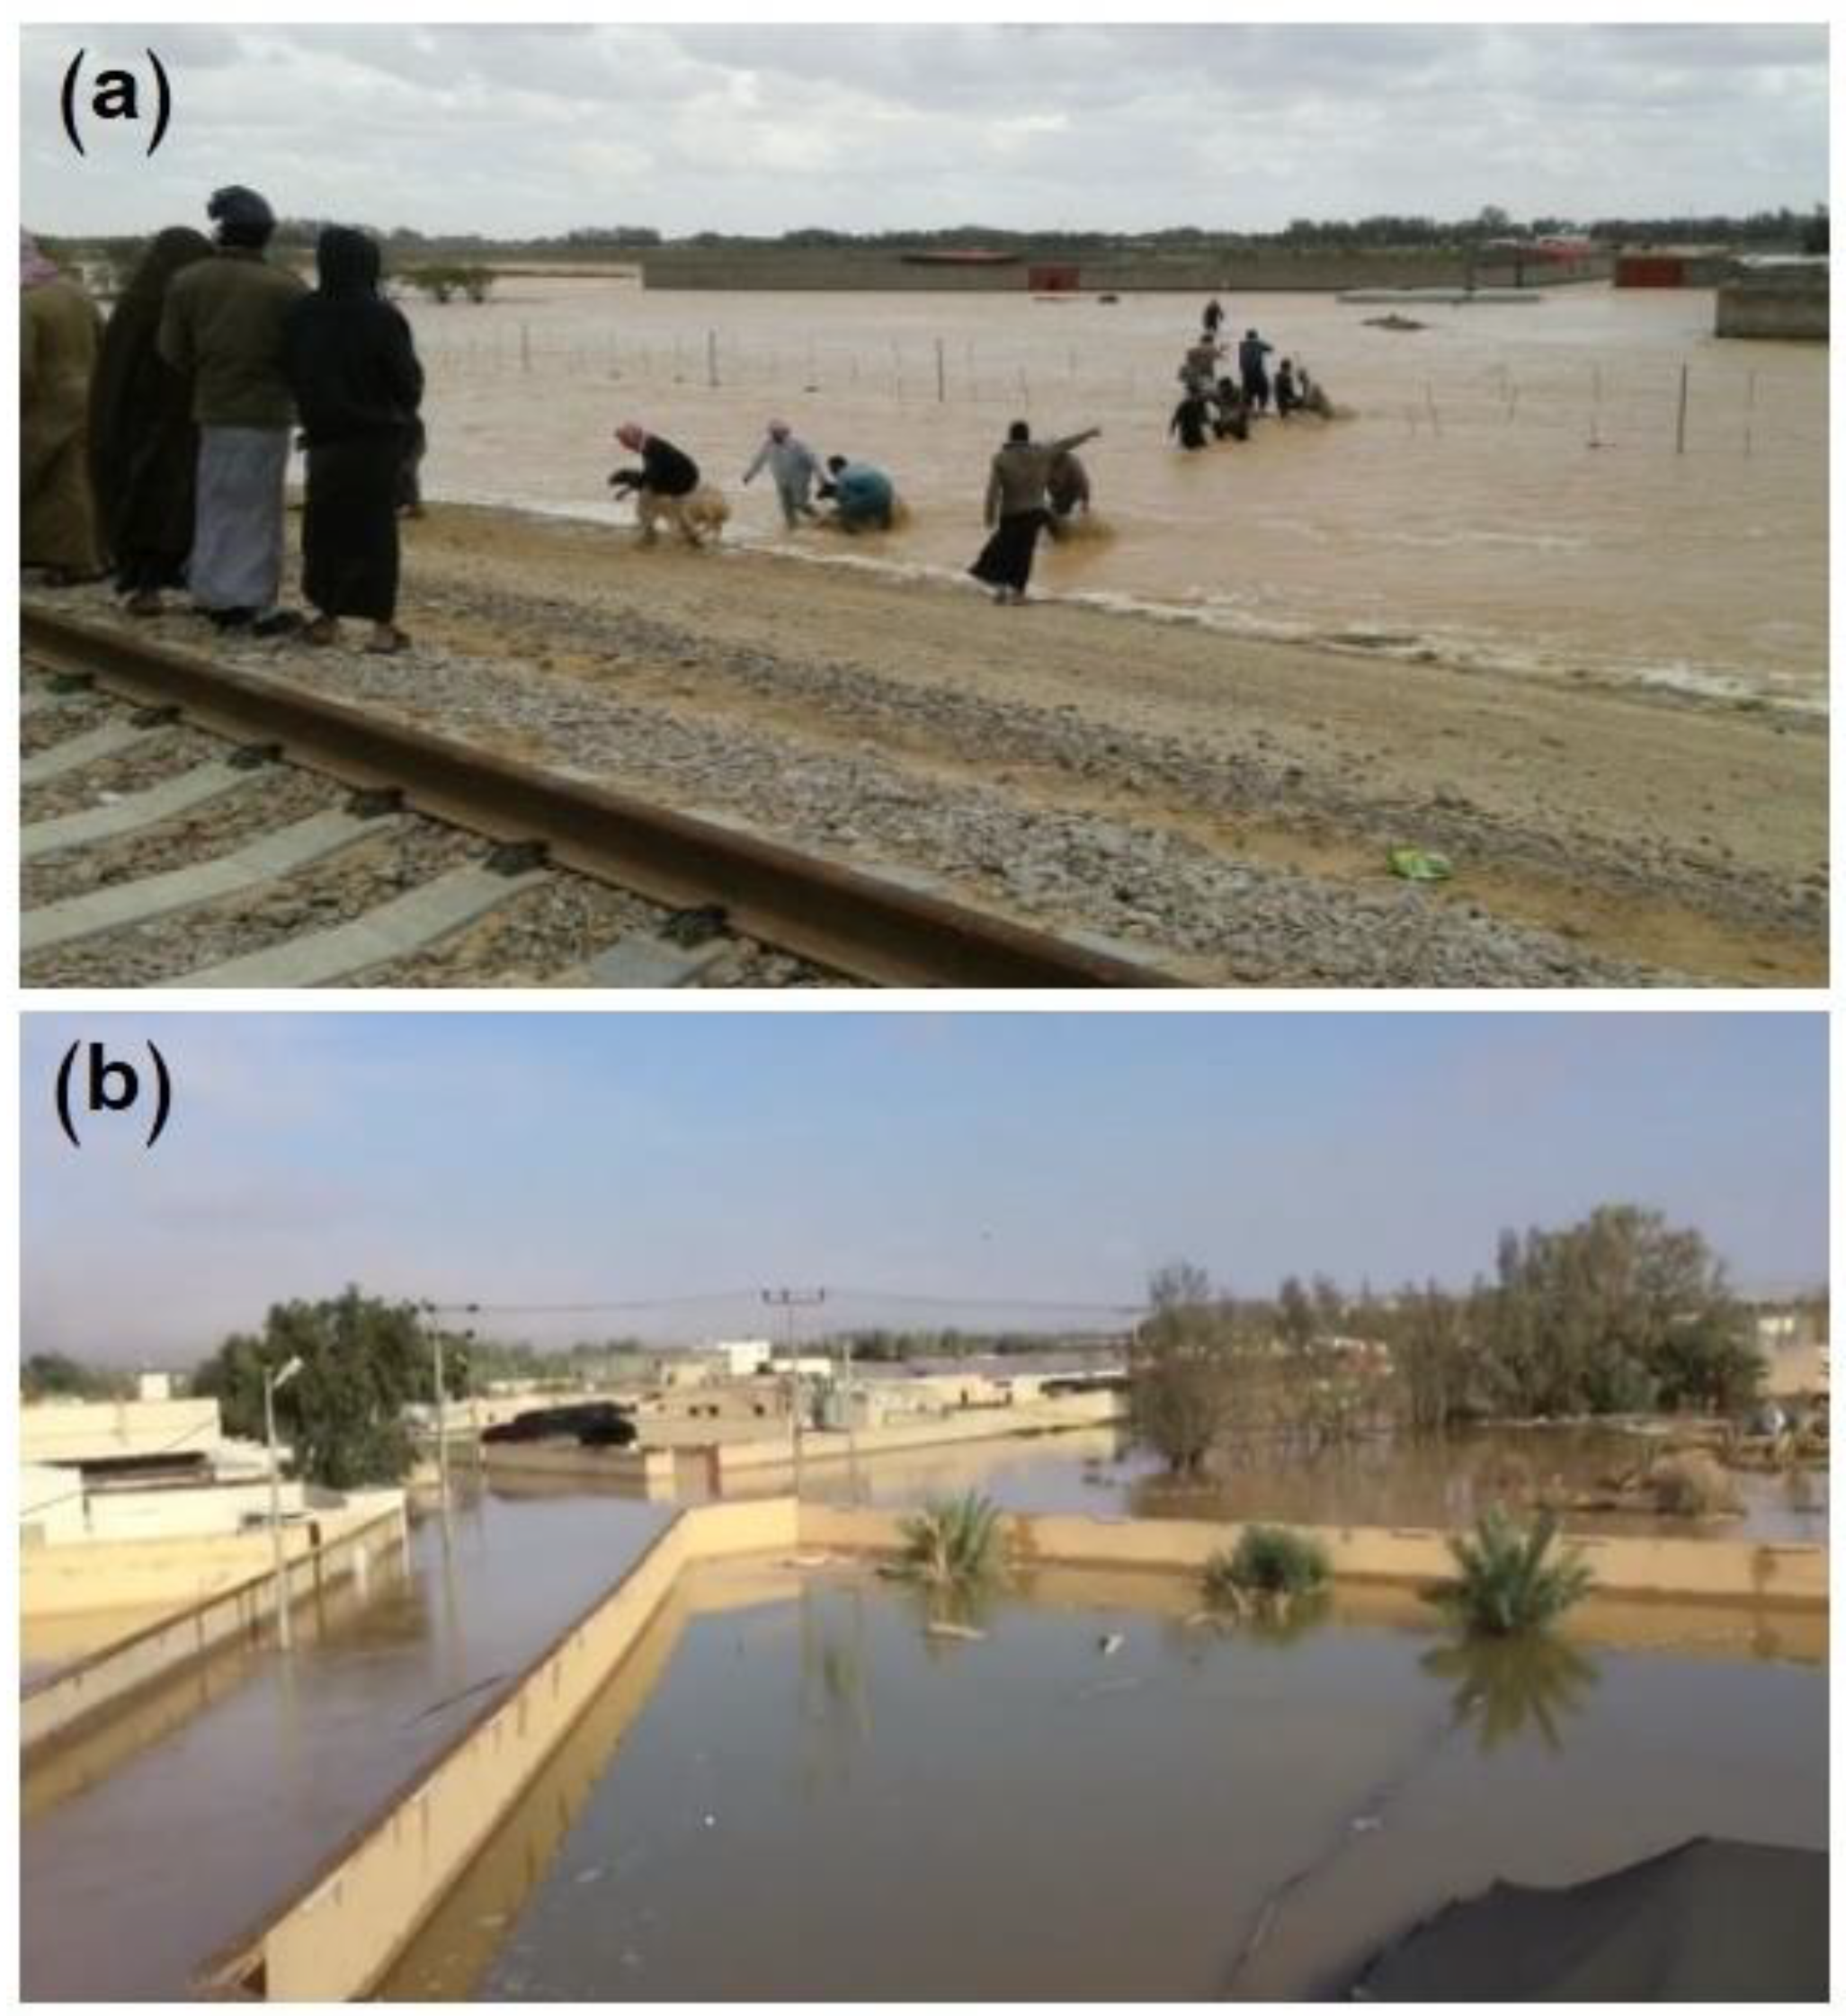
Table 1 presents the records of historical flooding events which occurred in the study area. The floods that occurred on 10 November 2018 were the most severe, which resulted in halting traffic completely, the flooding of houses and schools, and the partial destruction of Al-Qurayyat hospital. The Ghati, Bayer, and Hadithah villages were flooded and their people were displaced, as can be seen in
Figure 1.
The topographical nature of the drainage basins of the study area worsens the flood impacts. The study area is characterized by its varied topographic features and slopes, which intersect with the dense networks of dry wadis. These characteristics negatively affect the study area and make it permanent vulnerable to flood hazards, in addition to the increased unplanned urban growth centralized in the pathways and estuaries of dry wadis, which are considered to be the most vulnerable to flood hazards. The construction of the train pathway in 2017 and its crossing near the cities and villages of Al-Qurayyat led to changes in the land-use, the morphology of the wadis, and increased the flood hazard in the region. The importance of this study lies in the scarcity of applied studies which address flood hazards in the drainage basins of the northern region in the Kingdom of Saudi Arabia (KSA). Furthermore, this study determines the negative impacts of floods in Al-Qurayyat city and in the railway of the Al-Shamal train pathway facing it. Although railways are of strategic and economic importance in KSA, most of these railways are subject to geomorphological, hydrological, and flood hazards due to the varied climates and topographies that they pass through. Only two studies have focused on railways in KSA, where the first study addressed the relationship between the effect of land-use changes and the increase of flood hazard due to the Riyadh–Dammam train in the Eastern region in the time period from 2011–2017 [
2]; meanwhile, the second study concentrated on the Al-Shamal train pathway in Riyadh and examined the impacts of some of the morphological characteristics of the region on it [
39]. The main aims of this study can be summarized in five items: (1) evaluate the flood hazard on the Al-Shamal train pathway in the Al-Qurayyat region using multicriteria decision analysis based on geographic information systems (GIS-MCDA) and hierarchical analysis (AHP); (2) identify areas vulnerable to flood hazard along the northern railway track and the hazard levels for each part thereof; (3) predict the urban areas, agricultural lands, and infrastructure prone to possible future flood hazards and the degree of hazard in each; (4) reduce the flood hazard and adapt to serve future planning and decision-making in the study area; and (5) propose suitable strategic solutions to mitigate and protect against the negative impacts which are expected due to flood hazards in the study area.
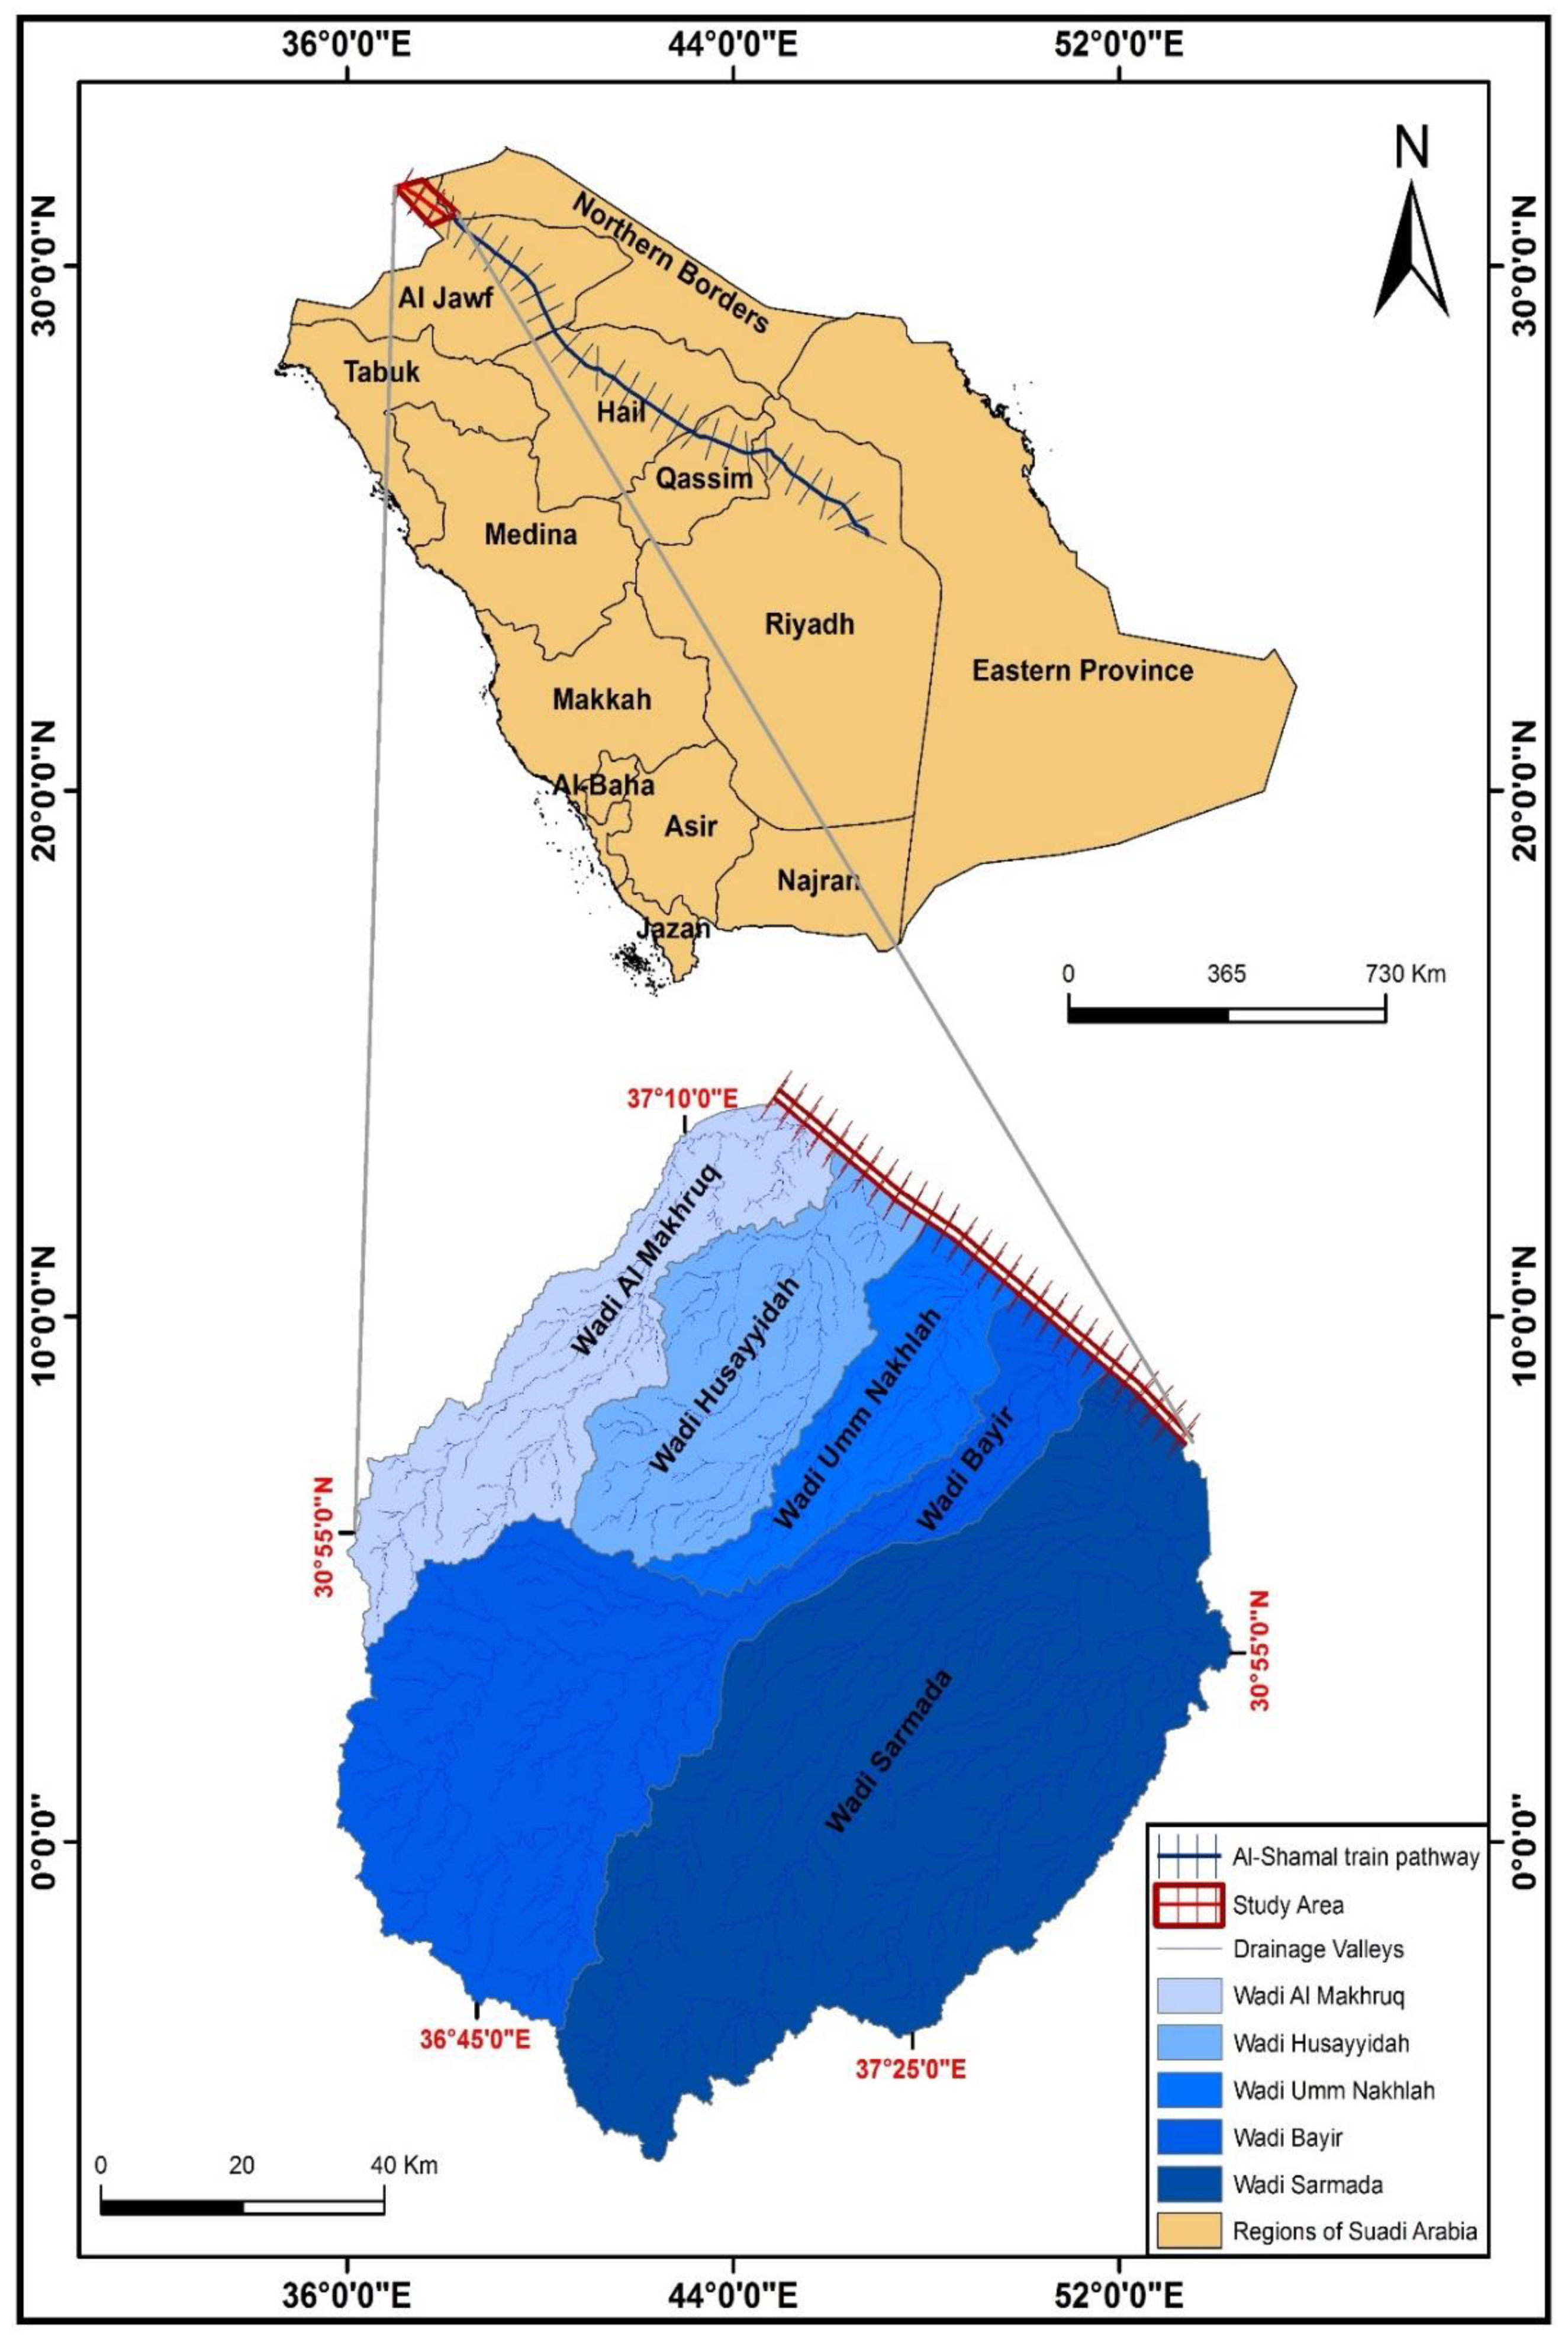
2. The Study Area
The administrative boundary of the study area is in the north of the Al-Jawf region, which is located in the north of KSA. The main drainage basins that affect Al-Qurayyat city and the Al-Shamal train pathway facing it are located on the international border between the KSA and the Hashemite Kingdom of Jordan. Al-Qurayyat city is about 1200 km from the capital of Riyadh, about 310 km from Sakaka city (the headquarters of the Emirate of Al-Jawf region), and about 350 km from Arar city (the headquarters of the Emirate of the northern region). The study area is bounded to the north and west by the Hashemite Kingdom of Jordan, to the east by Tarif Governorate, and to the south by the Al-Jawf region, as shown in
Figure 2.
The study area is considered an ideal drainage environment for the drainage basins located in the southeast of the Hashemite Kingdom of Jordan, especially the main drainage basins mentioned in this study. The drainage basins (wadis Al-Makhrouk, Haseidah Al-Gharbiyeh, Haseidah Umm Nakhleh, Bayer, and Sarmada) affecting Al-Qurayyat city and the Al-Shamal train pathway, from the north to the south, are located between the latitudes of 30°16′9.75” and 31°31′33.01” N, and the longitudes of 36°30′45.71” and 37°48′52.18” E. The study area is shown in
Figure 3.
3. Methodology and Data Processing
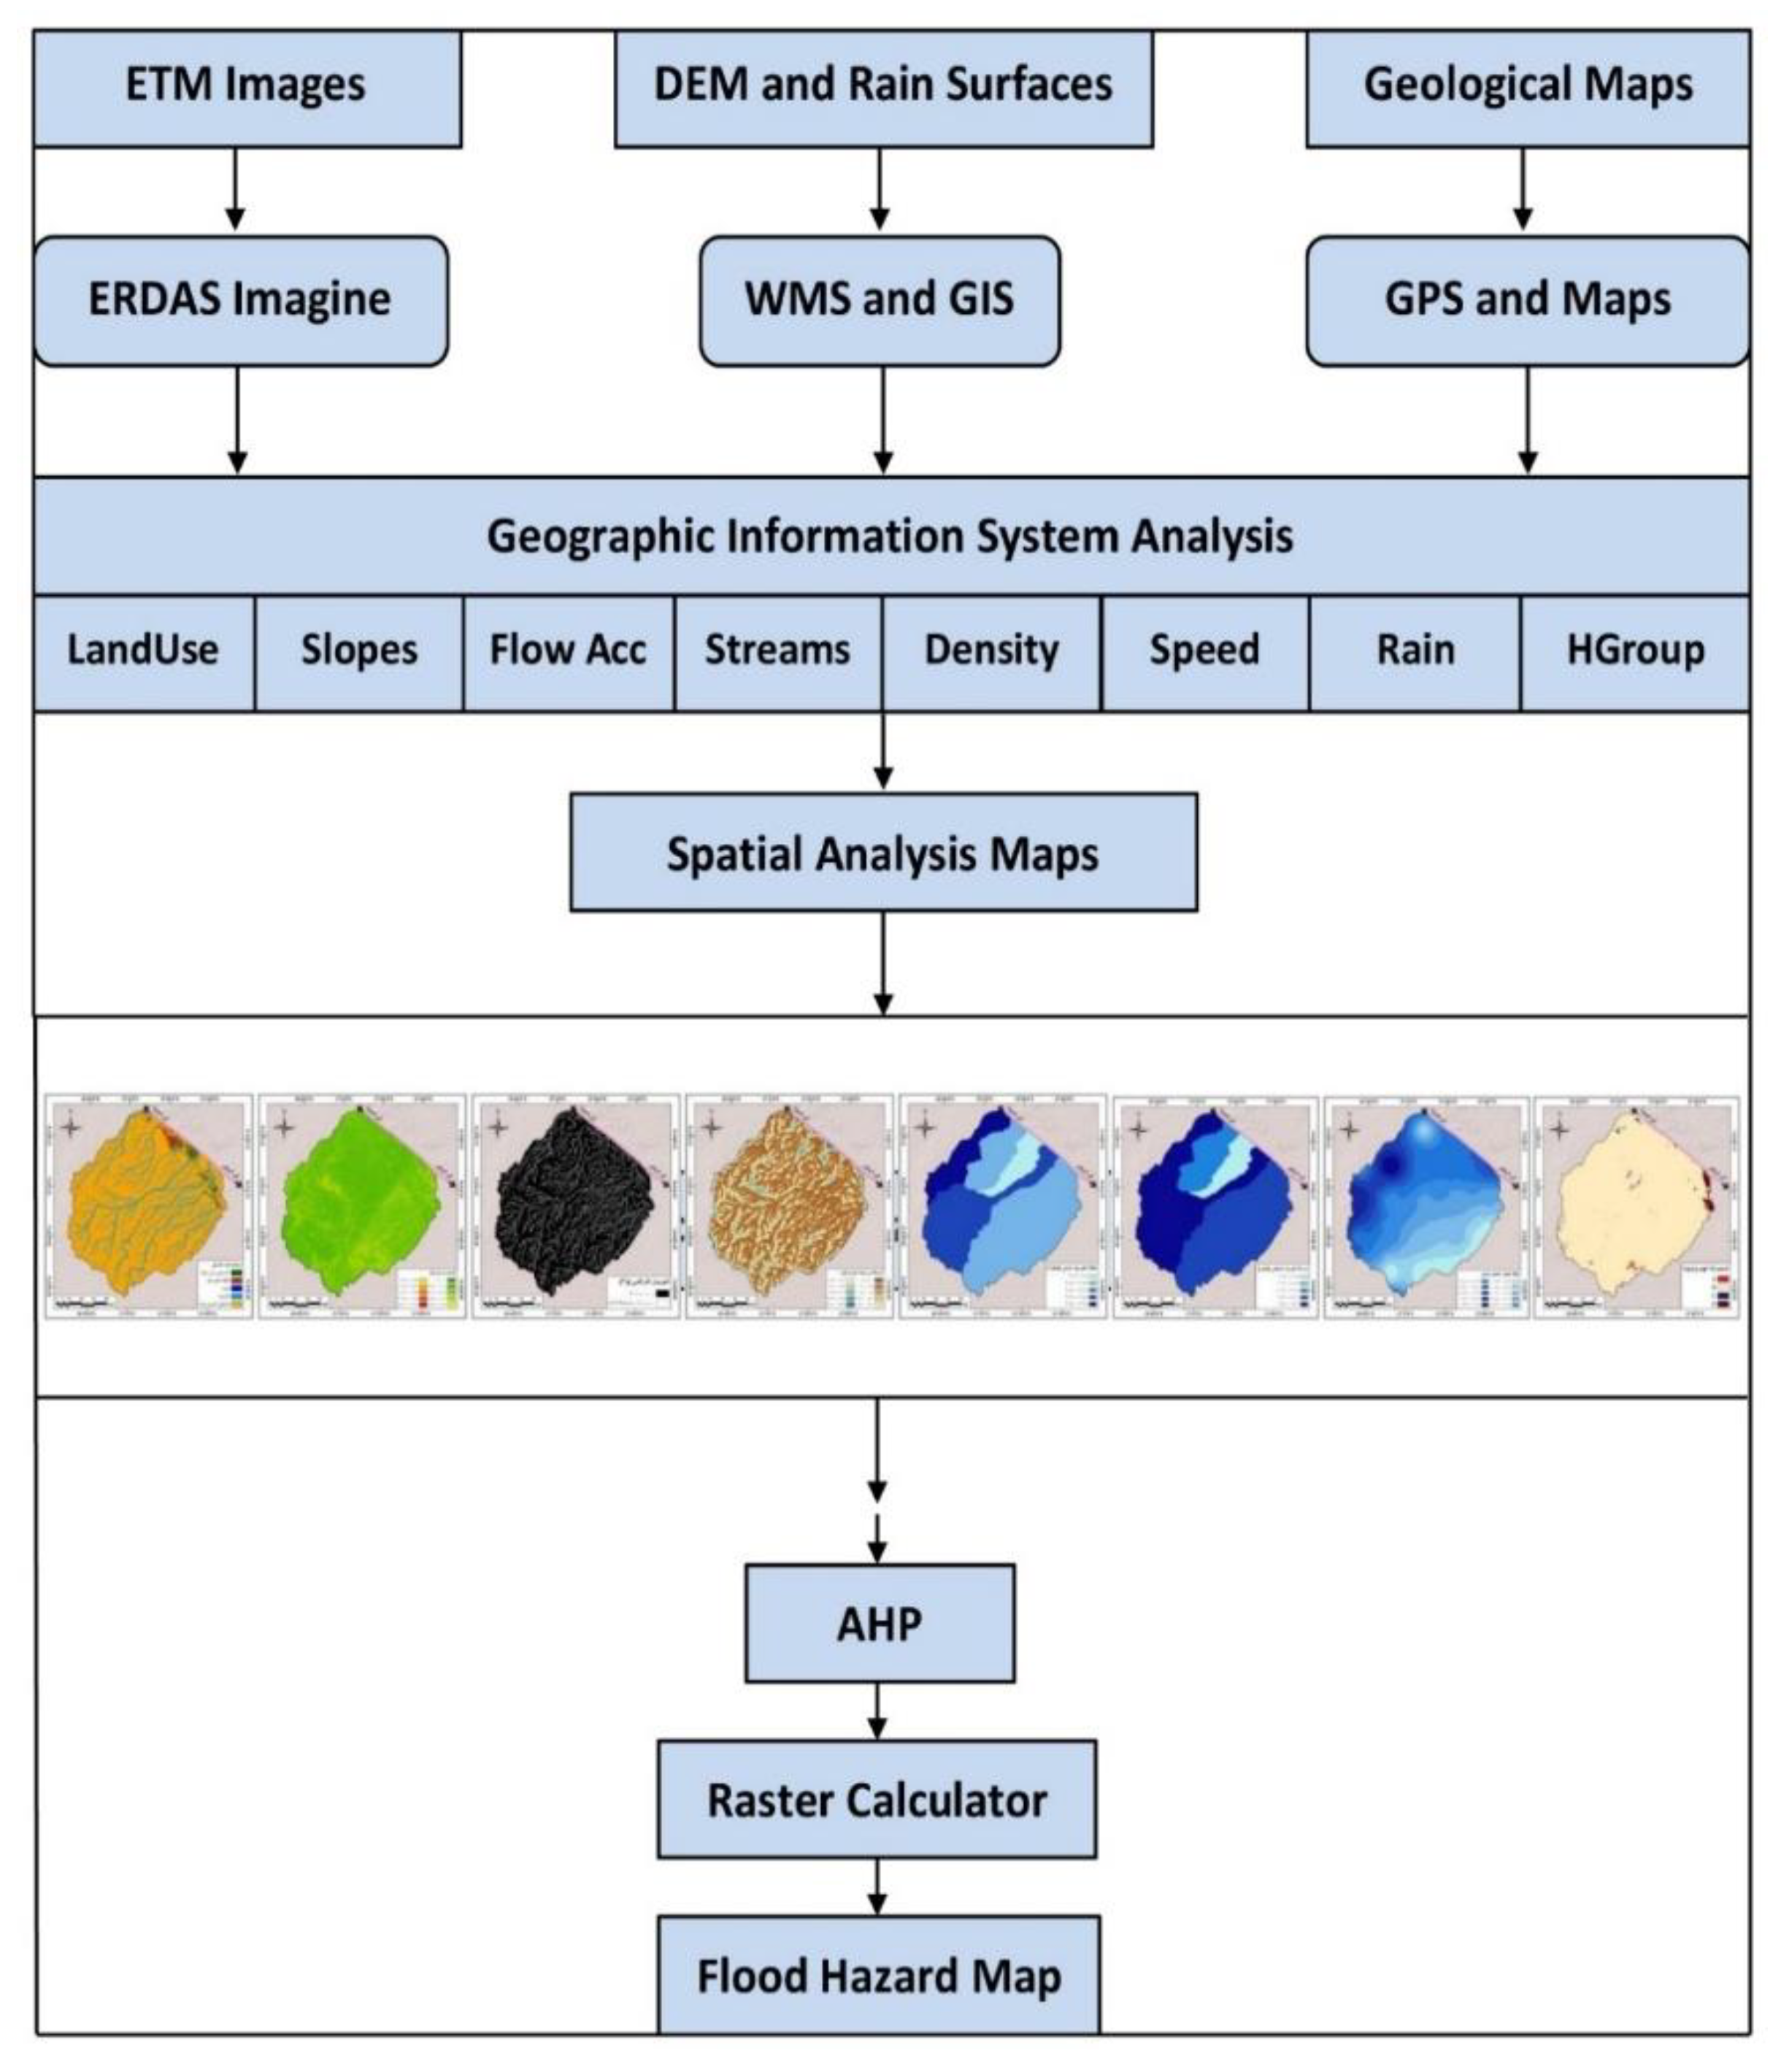
The key goal of using MCDA is to “study the selection of a number of multiple criteria and conflicting objectives”. The MCDA method permits the assessment of a region based on multiple objectives and criteria and supports decision-making in the flood hazard assessment process.
Figure 4 presents the methodology steps which are followed to obtain the final flood hazard map.
3.1. Data Collection
Multiple data types and sources were used to conduct the multicriteria analysis, in order to determine the degree of flood hazard. All data were standardized for integration within the GIS environment.
Table 2 shows the collected data used for the study and presents their characteristics, including the spatial resolution and sources. A digital elevation model (DEM) with spatial resolution of 12.5 m was downloaded freely from
http://vertex-retired.daac.asf.alaska.edu, in addition to topographic maps (of scale 1:50,000) obtained from the Survey Public Authority. Landsat 8 OLI/TIRS satellite images with 30 m spatial resolution were acquired in January 2020, downloaded freely from
http://earthexplorer.usgs.gov. A geological map (of scale 1:250,000) was obtained from the Saudi Geological Survey. Rainfall rate (mm day
−1) data were downloaded from the NASA Godard Earth Sciences Data and Information Service Center (GES DISC GSFC).
3.2. Derivation of the Study Criteria Layers
The collected data were used to extract the flow accumulation, stream order, and drainage basins through hydrological analysis. The slope was derived through surface analysis of the DEM. Land cover was extracted from Landsat 8 OLI/TIRS images.
The hydrological soil groups in the study area were determined, according to the soil classification groups in the Soil Conservation Service (SCS) method, by analyzing the geological map. The runoff speed was derived from the DEM using a hydraulic modeling program (HEC-RAS).
Figure 5 and
Figure 6 show the MCDA criteria used in the study.
3.3. Processing and Classifying of Criteria Layers
The processing and classification of criteria layers used in this study are summarized below:
3.3.1. Standardization of Criteria Layers
All derived raster layers, including flow accumulation, slopes, rainfall density, and land cover were standardized using a raster calculator in map algebra in ArcGIS, where the Euclidean distance was implemented, using the wadi network vector layer, in order to determine the distance from the wadi network. The other vector layers, including drainage density, runoff speed, and the hydrological group, were converted to raster mode in ArcGIS.
3.3.2. Reclassification of Criteria Layers
The eight extracted criteria layers were reclassified in ArcGIS, in order to determine the degree of severity and to create the hazard maps. The reclassify tool (in the spatial analysis toolbox in ArcGIS) was applied to determine and define the hazard classes and ranks for each criterion. Hazard classes and ranks were assigned for each criterion using the experience of the authors and extensive previous studies. For example, the distance from wadis criterion was classified as: a distance between 0 to 0.28 km from the wadis had the highest hazard (rank = 10), while a distance between 3.37 to 5.51 km from the wadis had the lowest hazard (rank = 1). Furthermore, with respect to the flow accumulation criterion, the class with the lowest flow had the lowest hazard and was assigned rank = 1, and vice versa.
Table 3 shows the hazard ranks for each criterion.
3.3.3. Application of AHP
AHP is an important tool in multicriteria decision-making. AHP is a mathematical theory of measurement developed by Thomas Saaty and which has been proven successful in many different fields, including management and economics. AHP is the best hierarchical framework to derive the importance of each criterion, in relation to the other criteria corresponding to it.
Table 4 illustrates the importance of AHP criteria, as presented by Thomas Saaty.
The production of a flood hazard map using AHP can be summarized in five stages, as presented below:
i. First Stage: Calculate the Importance Values of the Criteria
In this stage, the importance (priority) values of each criterion relative to the other criteria are established, according to the previous table. The assignment of the importance values in this study involved evaluating each criterion against all other criteria at a hierarchical level.
Table 5 shows the comparison between the eight criteria in this study and the assigned importance values.
ii. Second Stage: Calculate the Percentage of Importance Values
The percentage of importance values are calculated between every two criteria (criterion in row and criterion in a column) using Equation (1):
where:
is the percentage of importance value between two criteria,
is the importance value between two criteria (one a row and the other a column), and
is the total of the standardized columns. The relative weight value of each of the row criteria is determined by Equation (2):
where:
is the value of the relative weight of the standardized rows,
is the sum of percentages of importance values for a criterion row, and
is the final value of
for all rows.
Table 6 shows the percentages of importance values using the AHP.
iii. Third Stage: Create the Weight Values Matrix
Table 7 and
Table 8 show the matrices of the weight values, according to the priority values between the criteria.
where: is the largest eigenvalue of the matrix
iv. Fourth Stage: Calculate Consistency index (Consistency Verification)
A matrix is said to be consistent if, for each two values that are reciprocal to each other, the multiplication of the two values is equal to one, and if the elements in the column are the reciprocal of the elements in the corresponding row. The consistency index is calculated using Equation (3):
where:
is the largest eigenvalue of the matrix (as seen in the previous table), which is always greater than or equal to the number of rows or columns; and n is the number of criteria.
The “CI” value is more acceptable if it is closer to zero. The closer the CI value is to zero, the more confidence we can have in the consistency index. To the contrary, the farther the CI value from zero, the more inconsistent. The consistency ratio is calculated using Equation (5):
where:
R is the random index, according to the number of criteria; its value is determined from
Table 9.
From the previous table, the value of the random index in this case was (
R) = 1.4, as we used eight criteria in this study. The consistency ratio was
= 2% = 0.02, which is an acceptable percentage, as the consistency ratio was within 0.1 (10%). A consistency ratio exceeding 0.1 indicates an inconsistency (contradiction).
Table 10 demonstrates the weights of the criteria using the AHP.
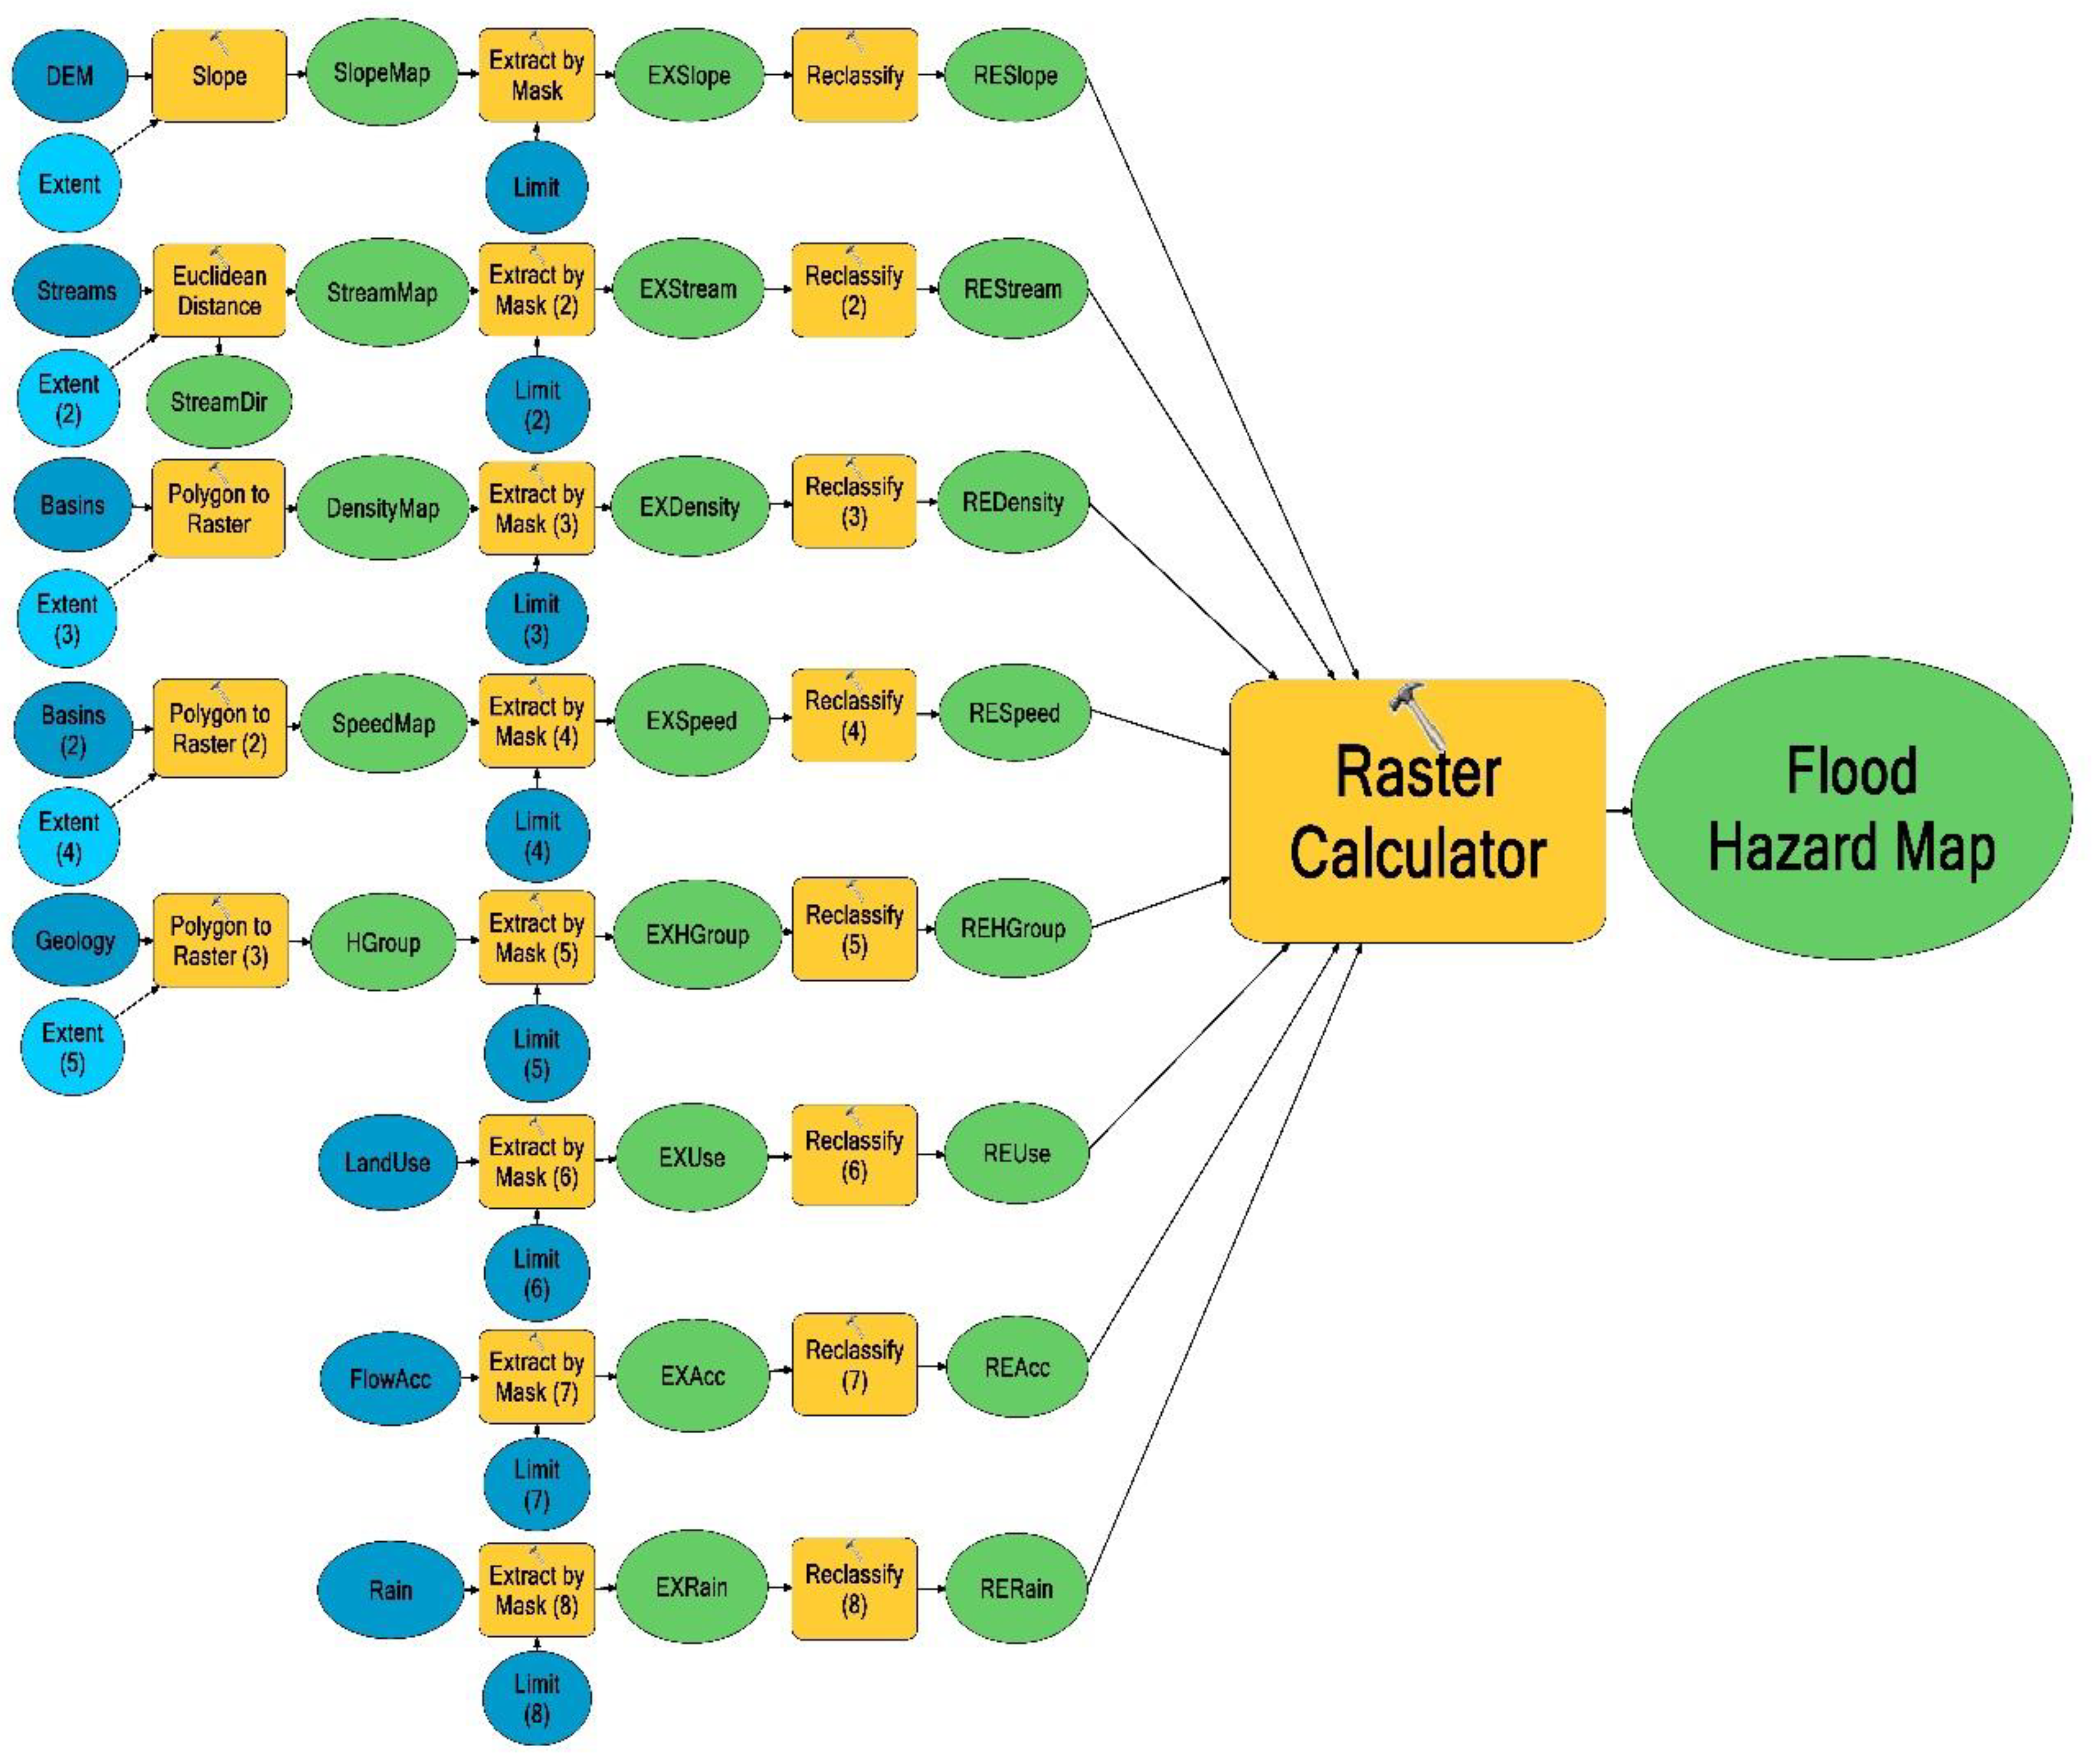
v. Final Stage: Production of the Flood Hazard Map
This stage is the prefinal part of the study, which involves the creation of the structural model constructed within the ArcGIS environment to extract all the needed criteria automatically by adding the required ArcGIS modules to get the flood hazard map [
40]. The model included the following: (1) the distance maps were generated to produce the proximity distance between different criteria by using the ArcCatalog, the Spatial Analysis toolbox, and the Euclidean Distance. (2) The slope criterion was used to create a slope-surface map. (3) All criteria maps were reclassified to define the categories of spatial suitability for each criterion. (4) As a subsequent step, all criteria layers were clipped using the ‘Extract by mask’ tool to match the boundary of the study area. (5) Then, the Raster Calculator was applied to overlay all the criteria layers according to the obtained AHP weights specified for each criterion (weighted overlay). (6) The final step was to run the structure model to get the flood hazard map in five classes: very high, high, moderate, low, and very low. The structural model of flood hazard on the Al-Shamal train pathway created by integrating GIS-MCDA and AHP is presented in
Figure 7.
4. Results and Discussion
4.1. Analysis of Criteria Affecting the Flood Hazard of the Al-Shamal Train Pathway
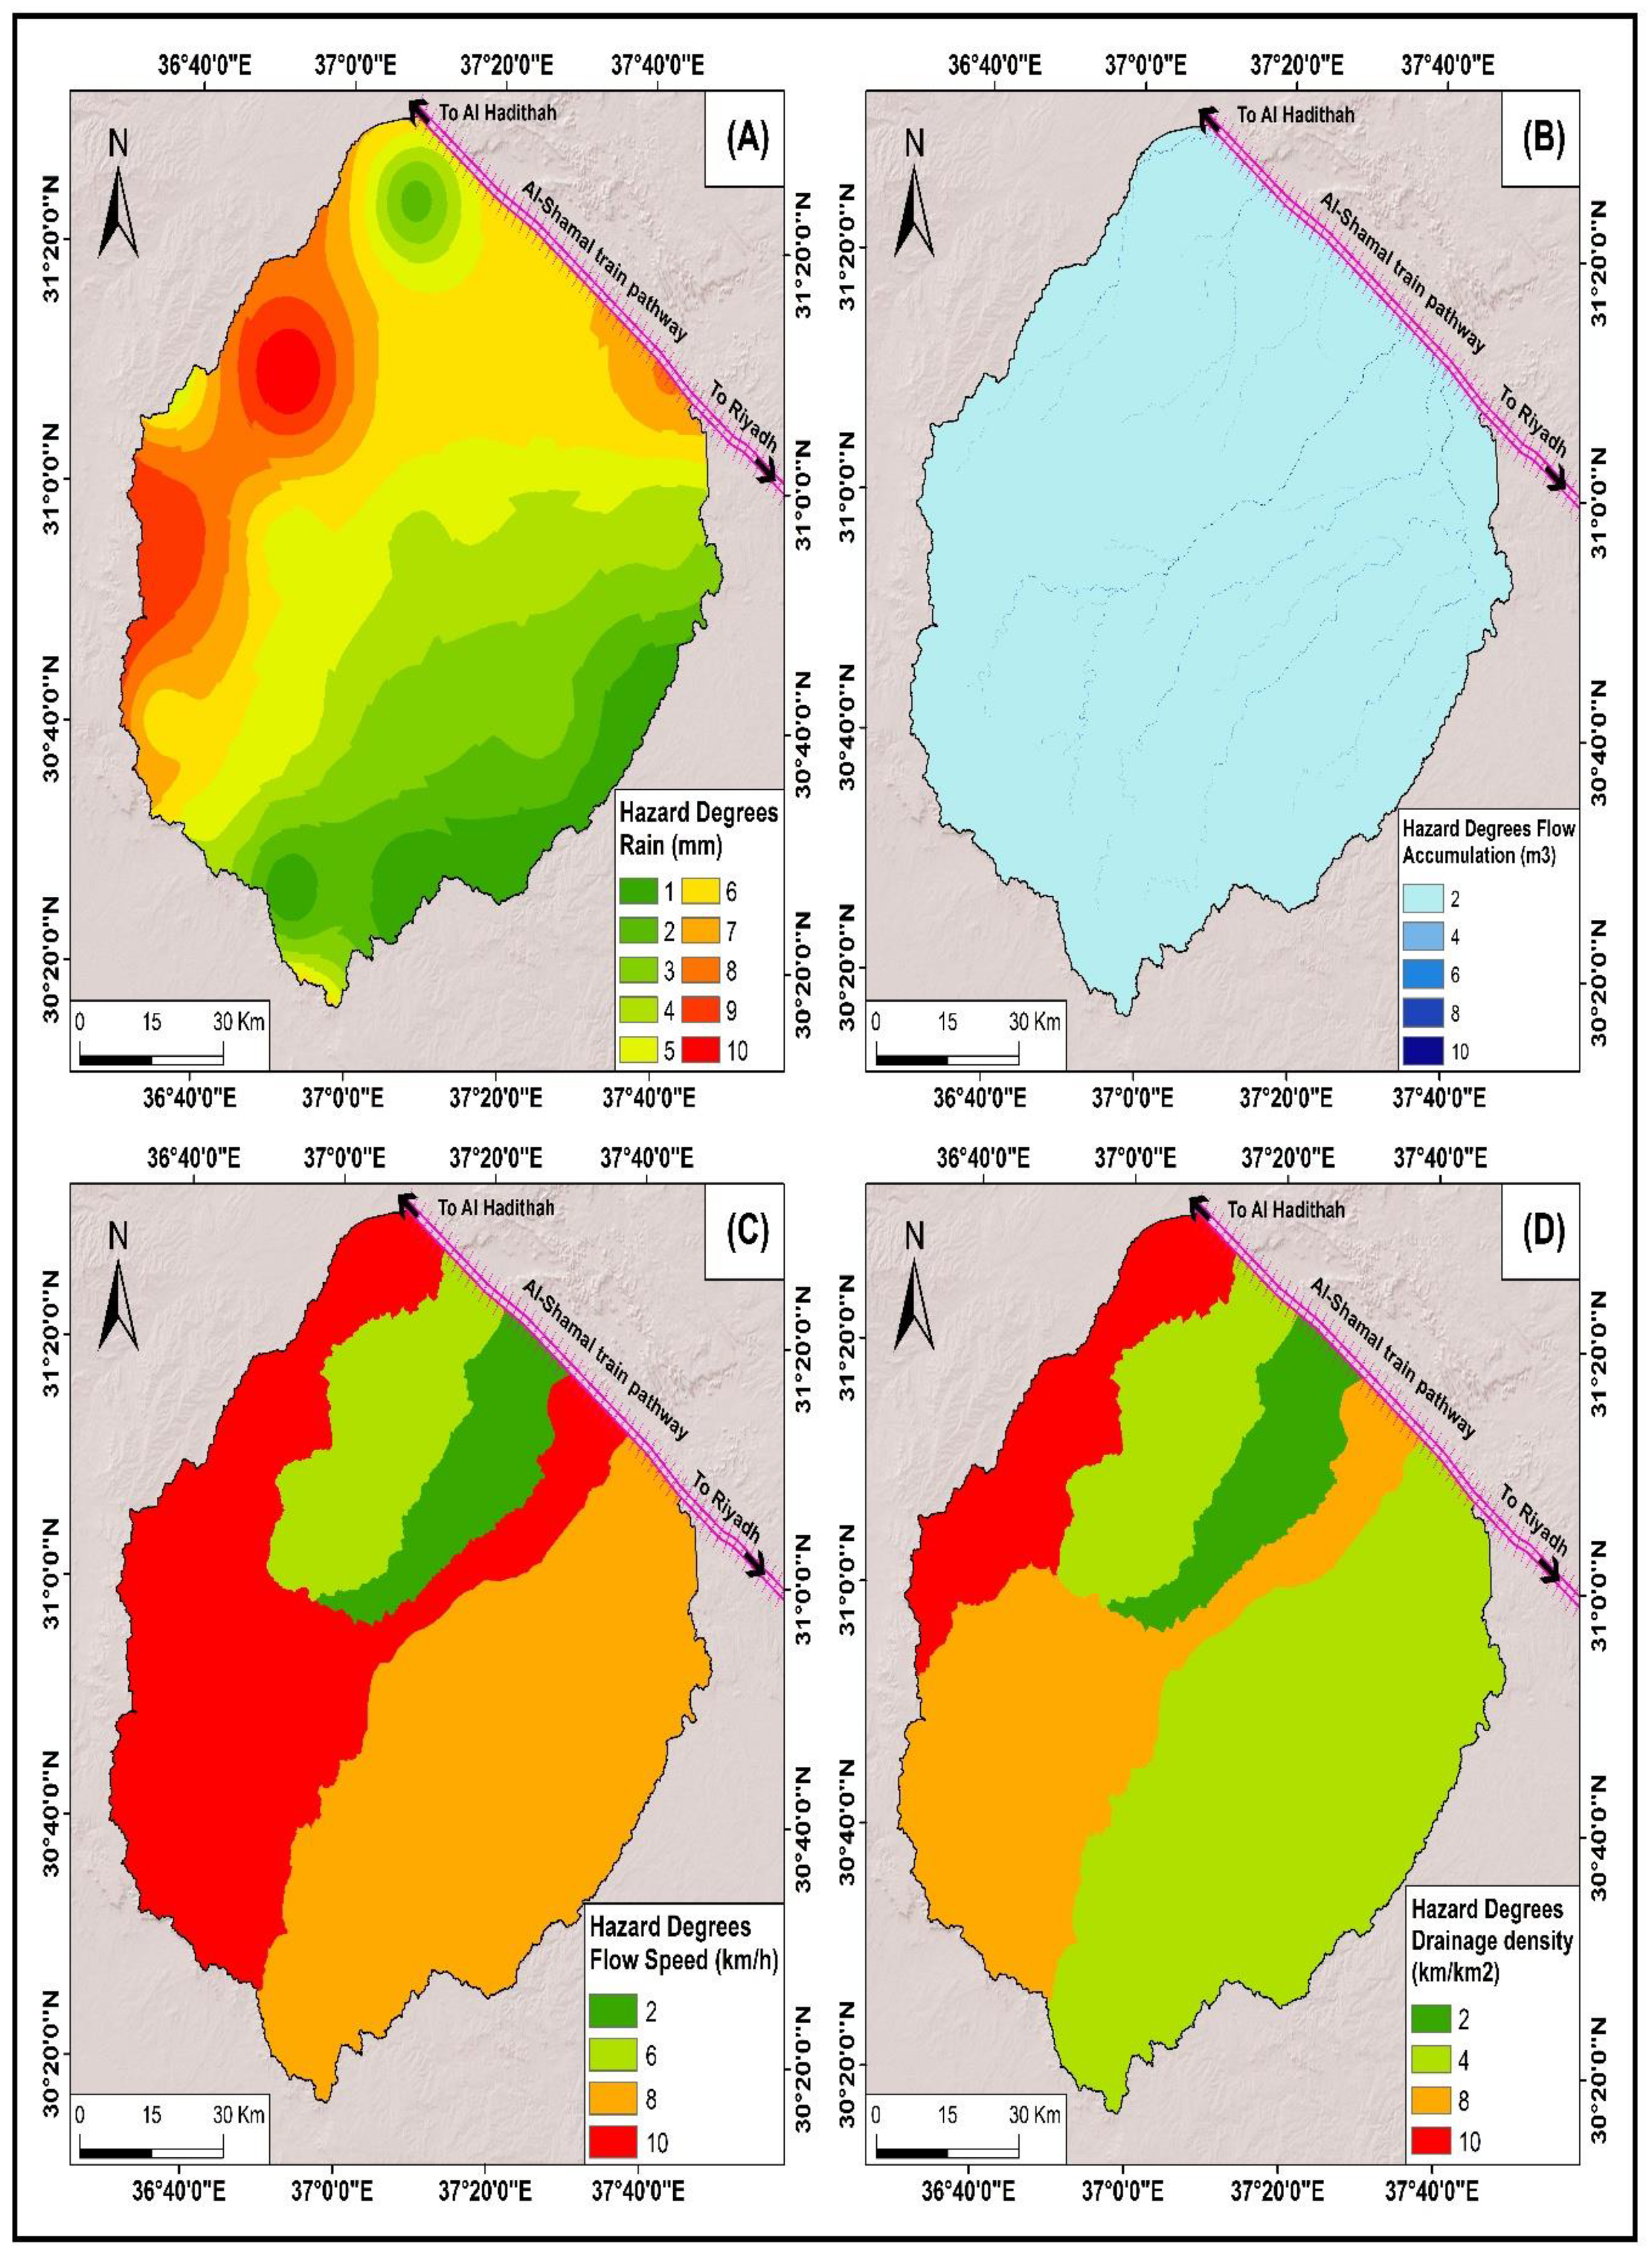
The eight criteria affecting the occurrence of floods along the Al-Shamal train pathway in the study area were distance from the wadi network, slope, land cover, hydrological soil groups, flow accumulation, rainfall density, drainage density, and runoff speed. By studying and analyzing these criteria, the extent of the impact and the spatial distribution of floods were determined. More details of the analysis of these criteria are presented below.
4.1.1. Distance from the Wadi Network
The water runoff flow in the wadis constitutes a major factor in the occurrence of a floods, where floods occur due to the immersion of the wadi network in a drainage basin. Such inundation increases in areas near the wadis (which are more vulnerable to floods) and decreases in areas far from them (which are less vulnerable to floods) [
36,
41,
42,
43]. In this study, the distance from the wadi network was divided into ten classes, where the closest class to the wadi network was less than 0.28 km. This class was the most vulnerable and concentrated around the five wadi networks in the study area. The least vulnerable areas were at a distance of more than 3.37 km, which were concentrated in the estuaries of the Bayer and Al-Makhrouk wadis, as shown in
Table 11 and
Figure 8 and
Figure 9.
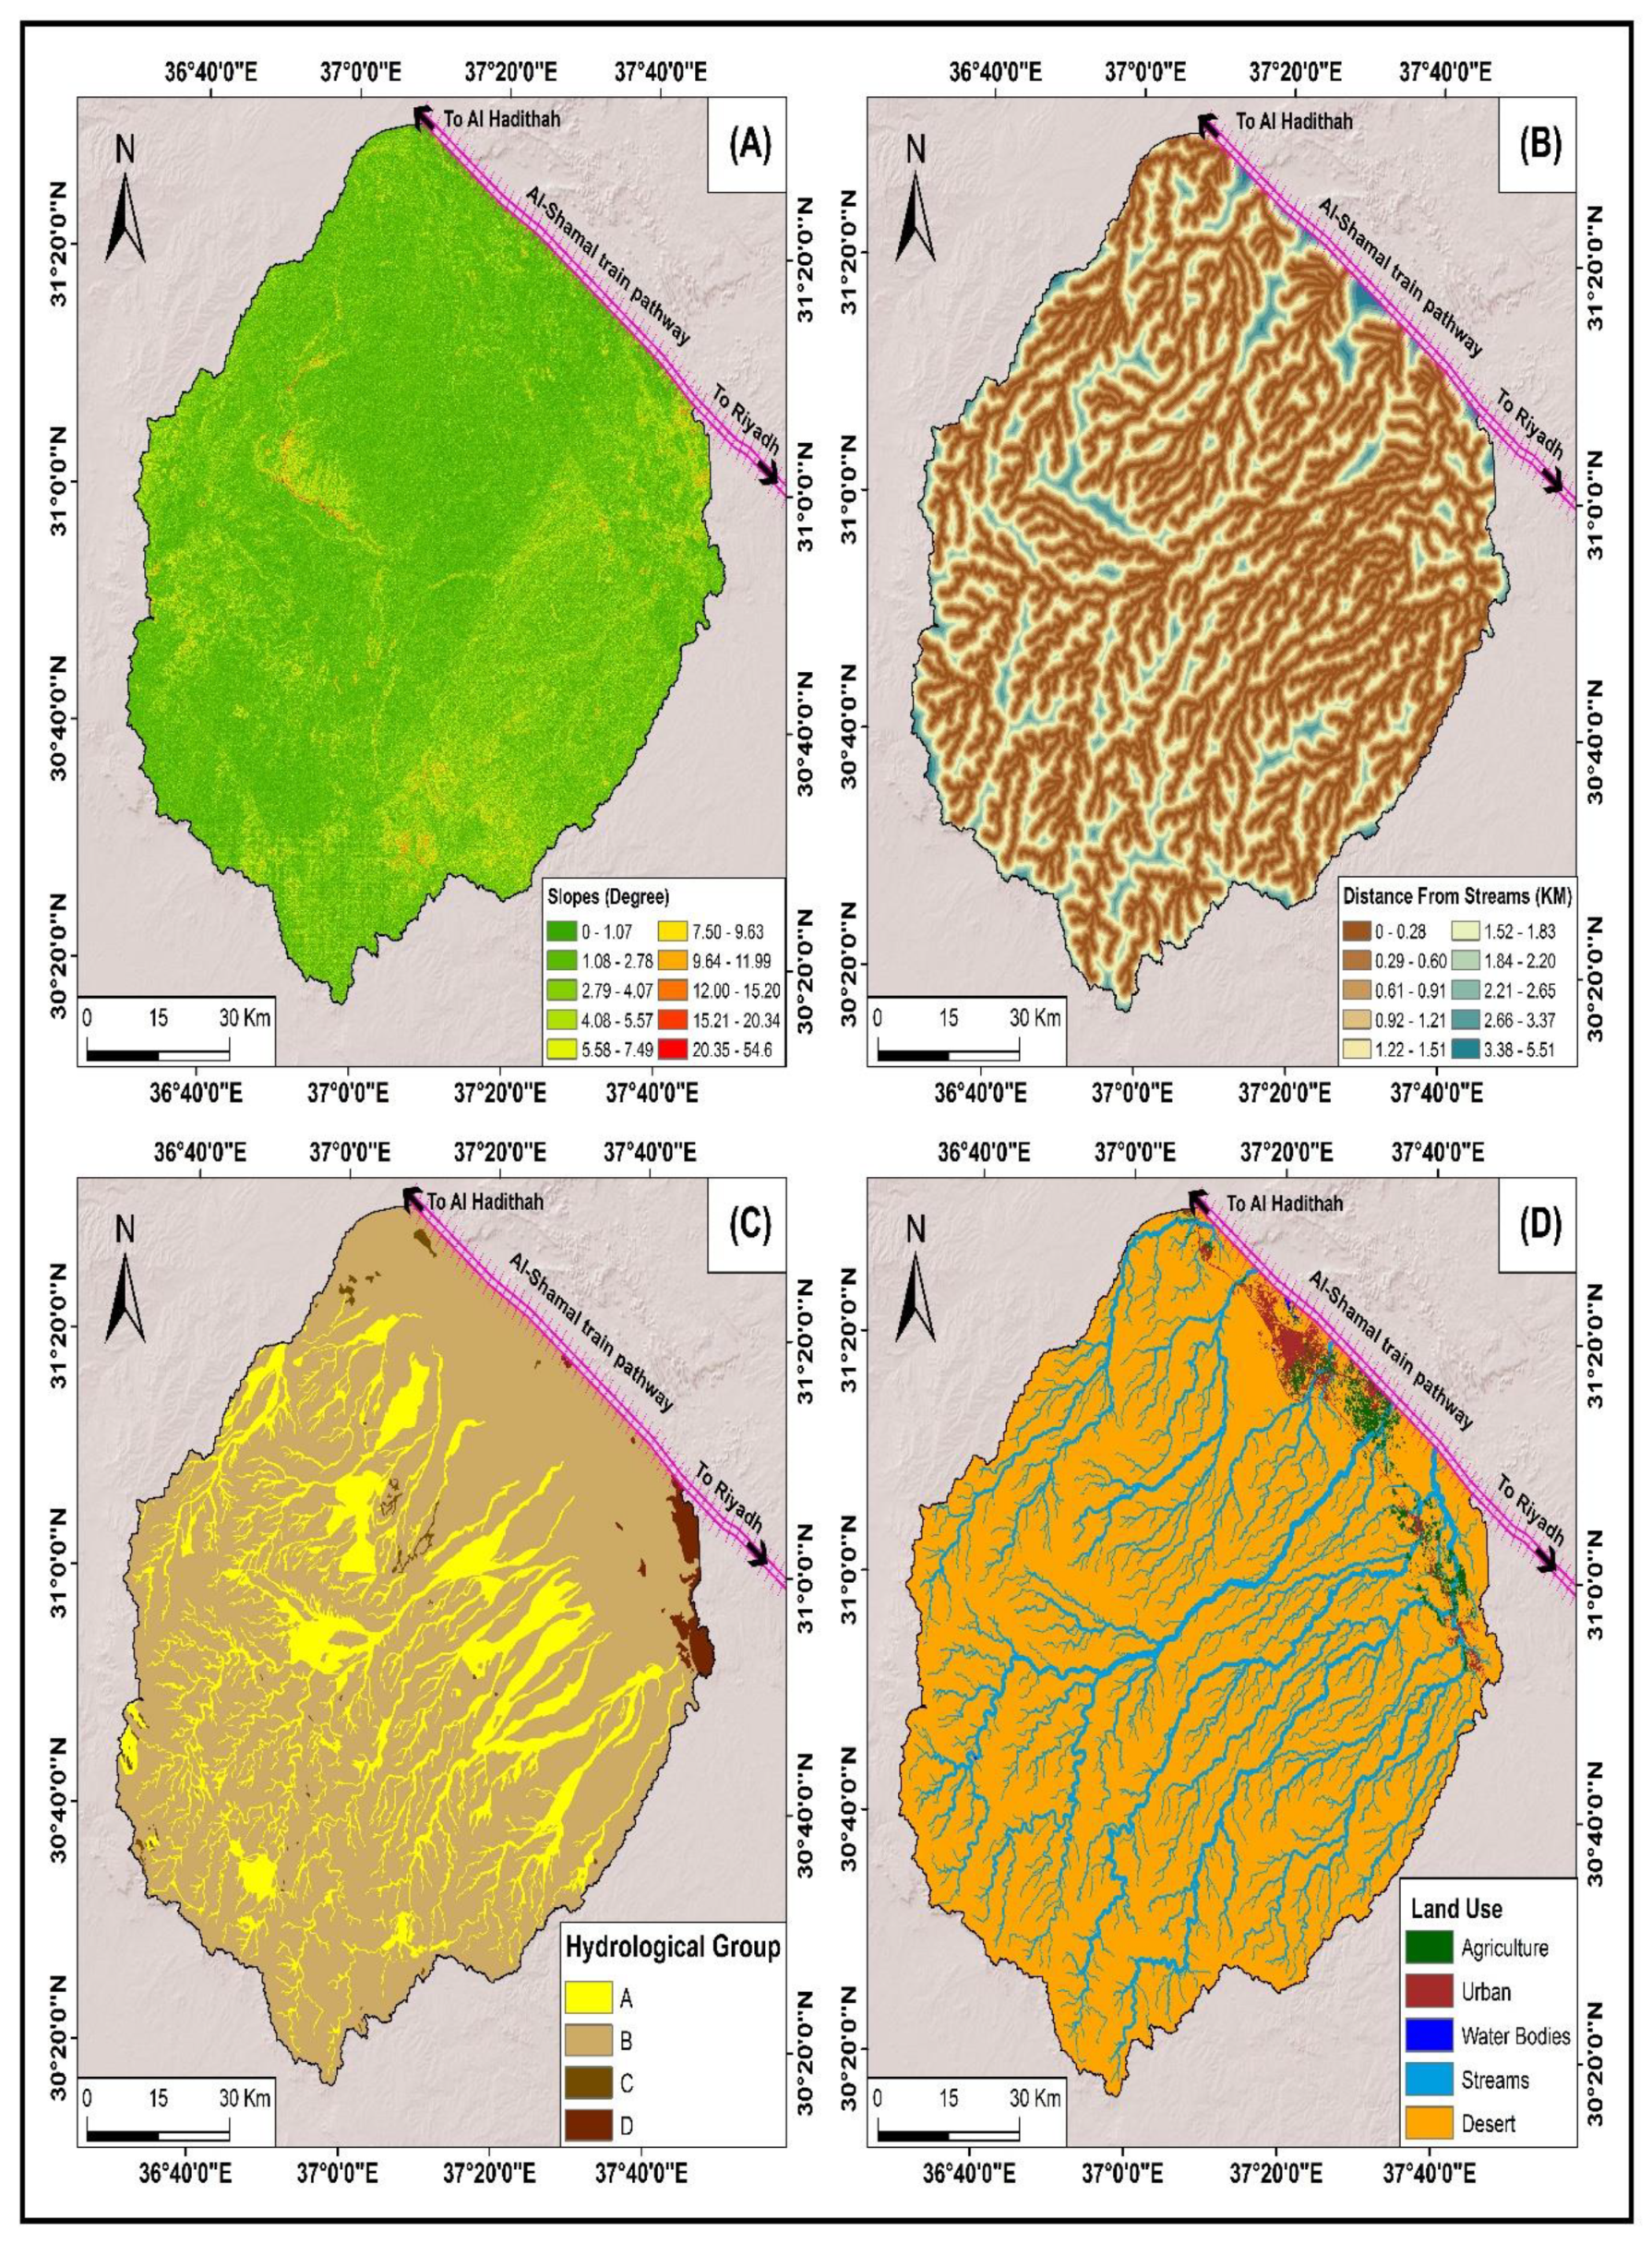
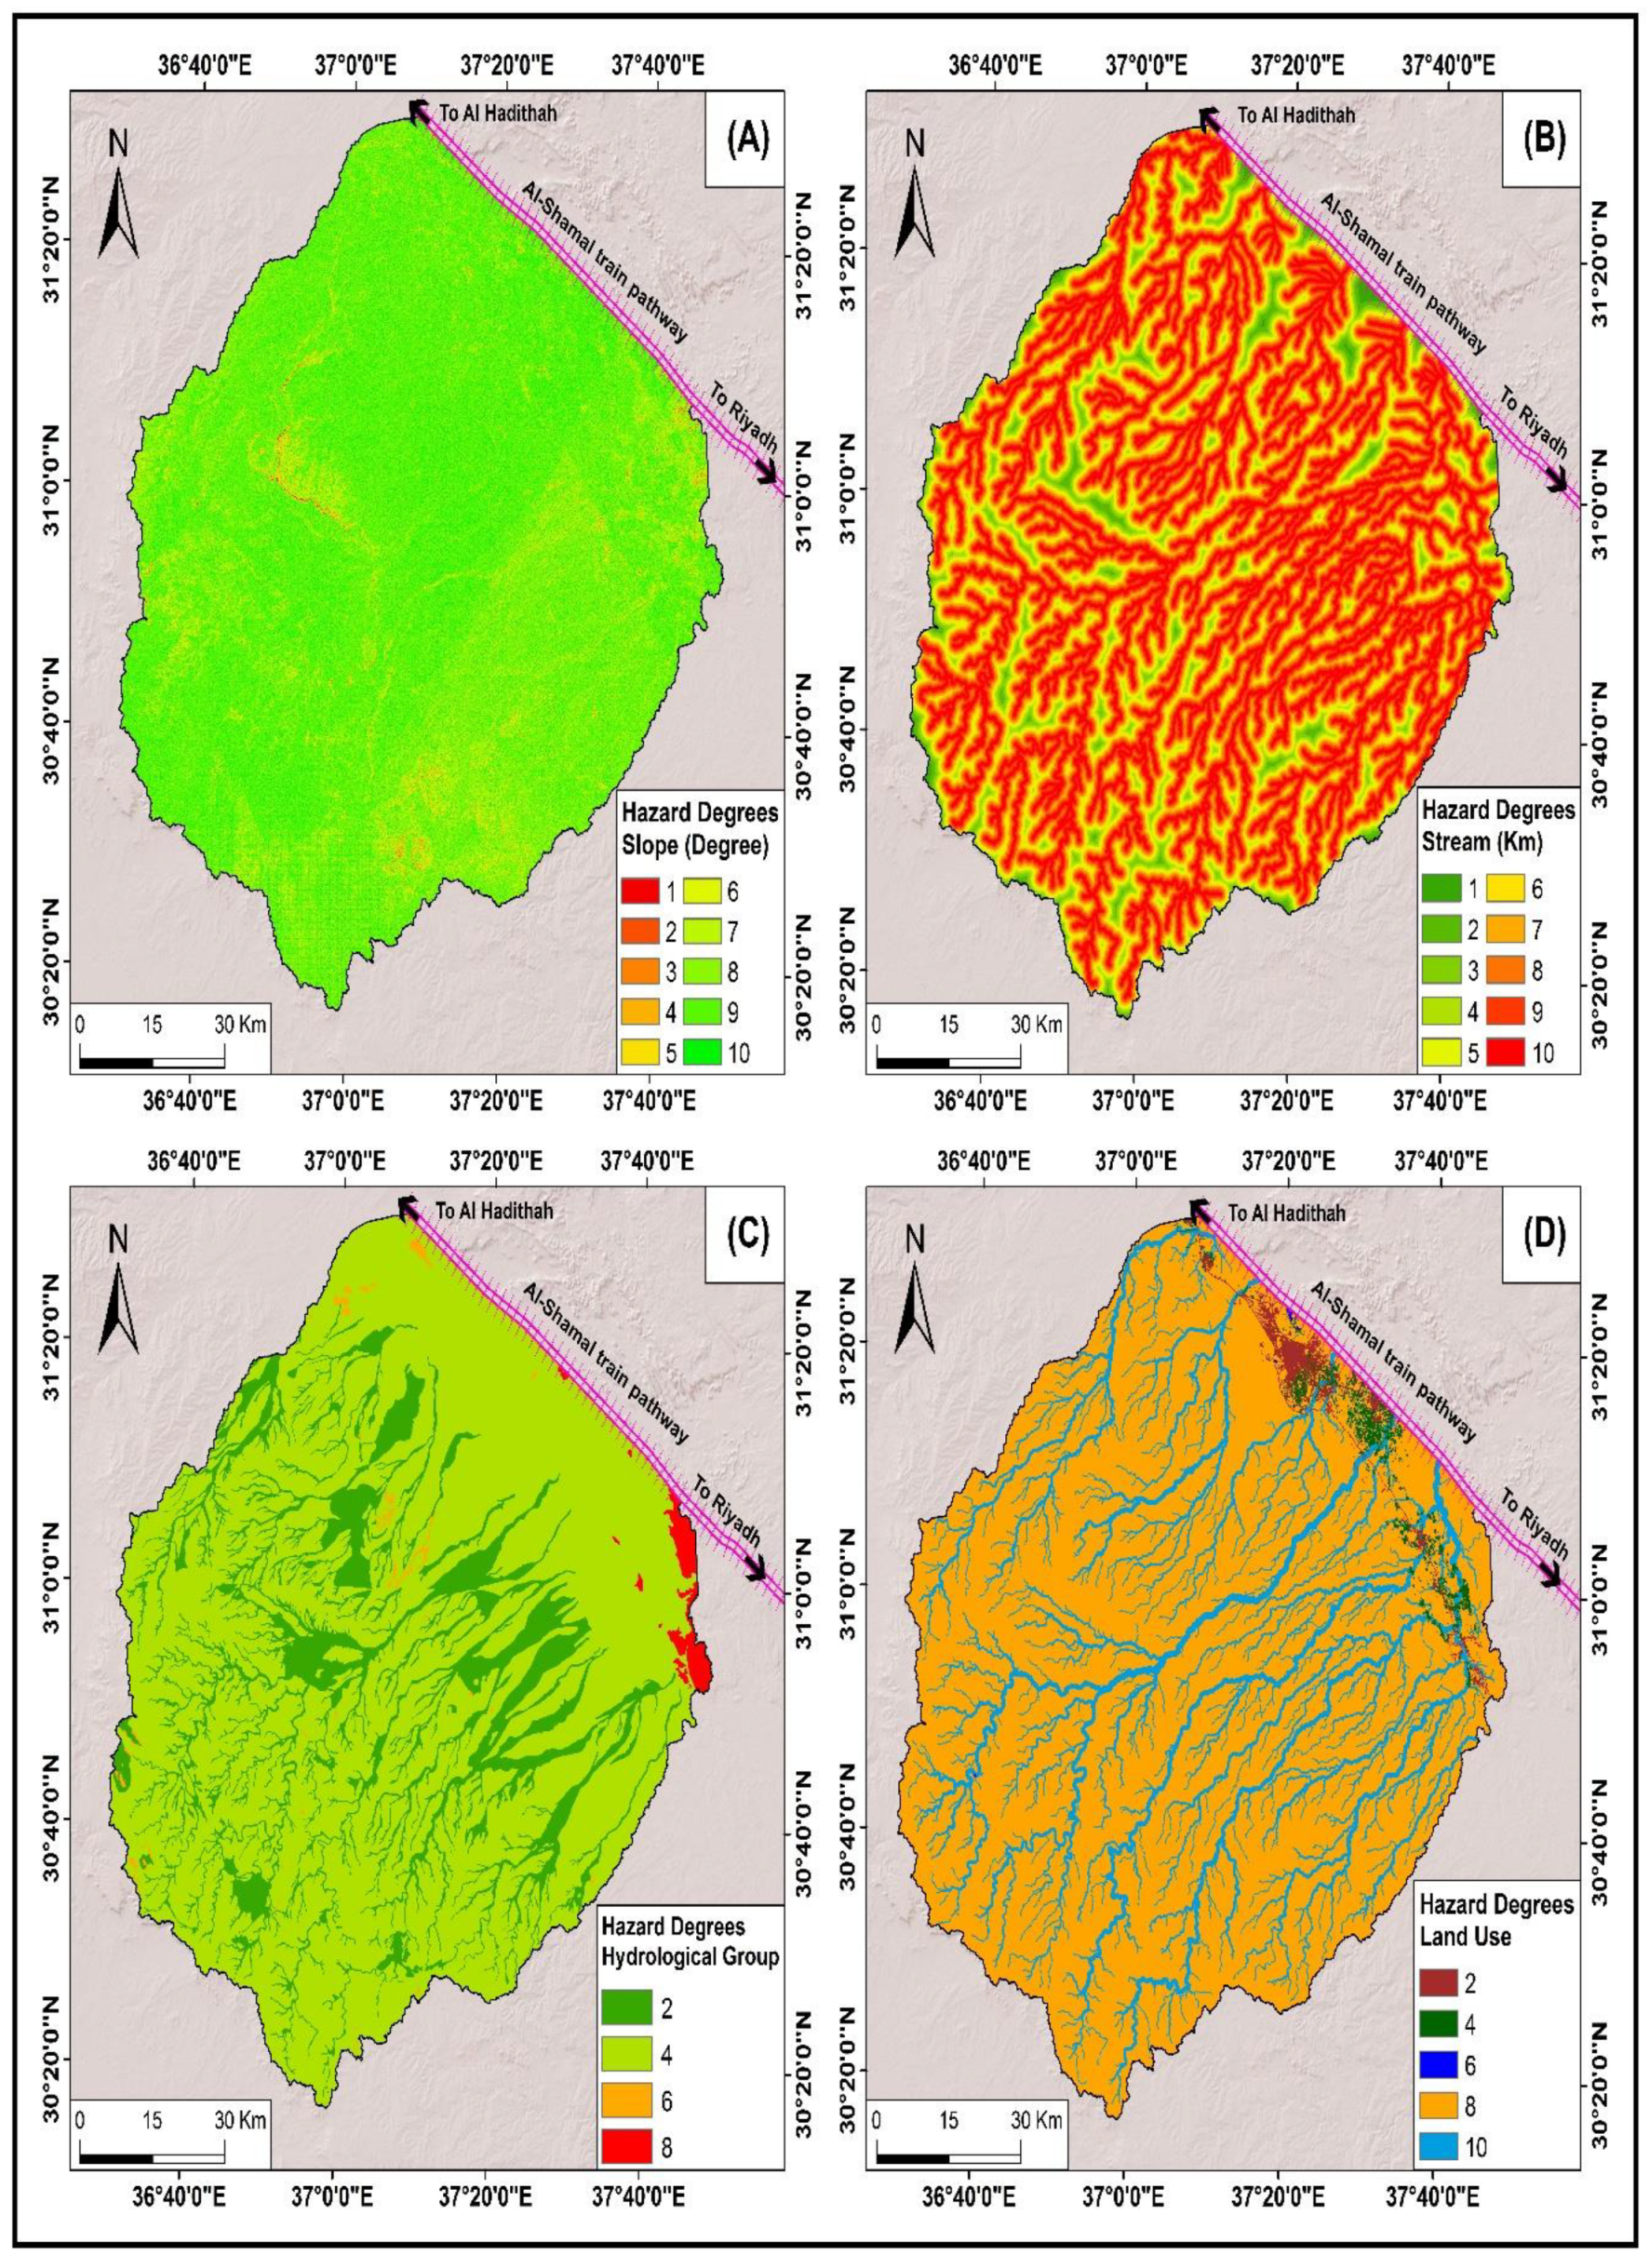
4.1.2. Slope
There is a strong positive correlation between the slope of the surface and the runoff speed. Regions with low inclines are exposed to high runoff speeds, causing the occurrence of severe floods [
36,
42,
43,
44]. The slope criterion was divided into ten classes. Areas with a slope less than 1.07° (the lowest slope) were considered to have the highest hazard, which were concentrated in the northern and western parts of the study area, in the Sarmada, Haseidah Al-Gharbiyeh, and Haseidah Umm Nakhleh drainage basins; while areas with a slope greater than 20.34° (the highest slope) were considered to be the least vulnerable to floods, which were concentrated in the center of the study area, around the wadi networks of the Bayer and Al-Makhrouk drainage basins, as shown in
Table 12 and
Figure 8.
4.1.3. Land Cover
The land cover determines the areas which are vulnerable to flood hazards. Urban areas and agricultural lands are considered less vulnerable to floods (the lowest hazard), as they obstruct and consequently decrease the runoff speed, in addition to the presence of branched irrigation and drainage channels in such areas. In contrast, wadis, swamps, and desert areas are the most vulnerable to floods and have the highest hazard [
36,
42,
43,
44].
The land cover criterion was divided into five classes. The urban areas and agricultural lands concentrated in Al-Qurayyat city to the north of the study area were considered the least vulnerable to floods (lowest hazard). Wadis, swamps, and desert areas, representing the majority of the study area, had the highest flood hazard, as shown in
Table 13 and
Figure 8.
4.1.4. Hydrological Soil Groups
The hydrological soil group signifies the ability of specific soil types to reduce flood hazards. The hydrological group criterion in this study was divided into four groups: A, B, C, and D. Group A represents deep sandy soils with very high intrusion rates, which minimize the flood hazard. The hydrological group (B) includes relatively fine-grained soils with moderate intrusion rates. The hydrological group (C) includes fine-grained soils with low intrusion rates. The hydrological group (D) indicates cohesive soil with very fine grains and very low intrusion rates, which increase the flood hazard [
45,
46]. Groups A and B constitute low flood hazard and covered a large part of the study area. Groups C and D represent high flood hazard and were mostly situated in the northeast and in scattered areas in the center of the study area. The areas of the four hydrological soil groups are shown in
Table 14 and
Figure 8.
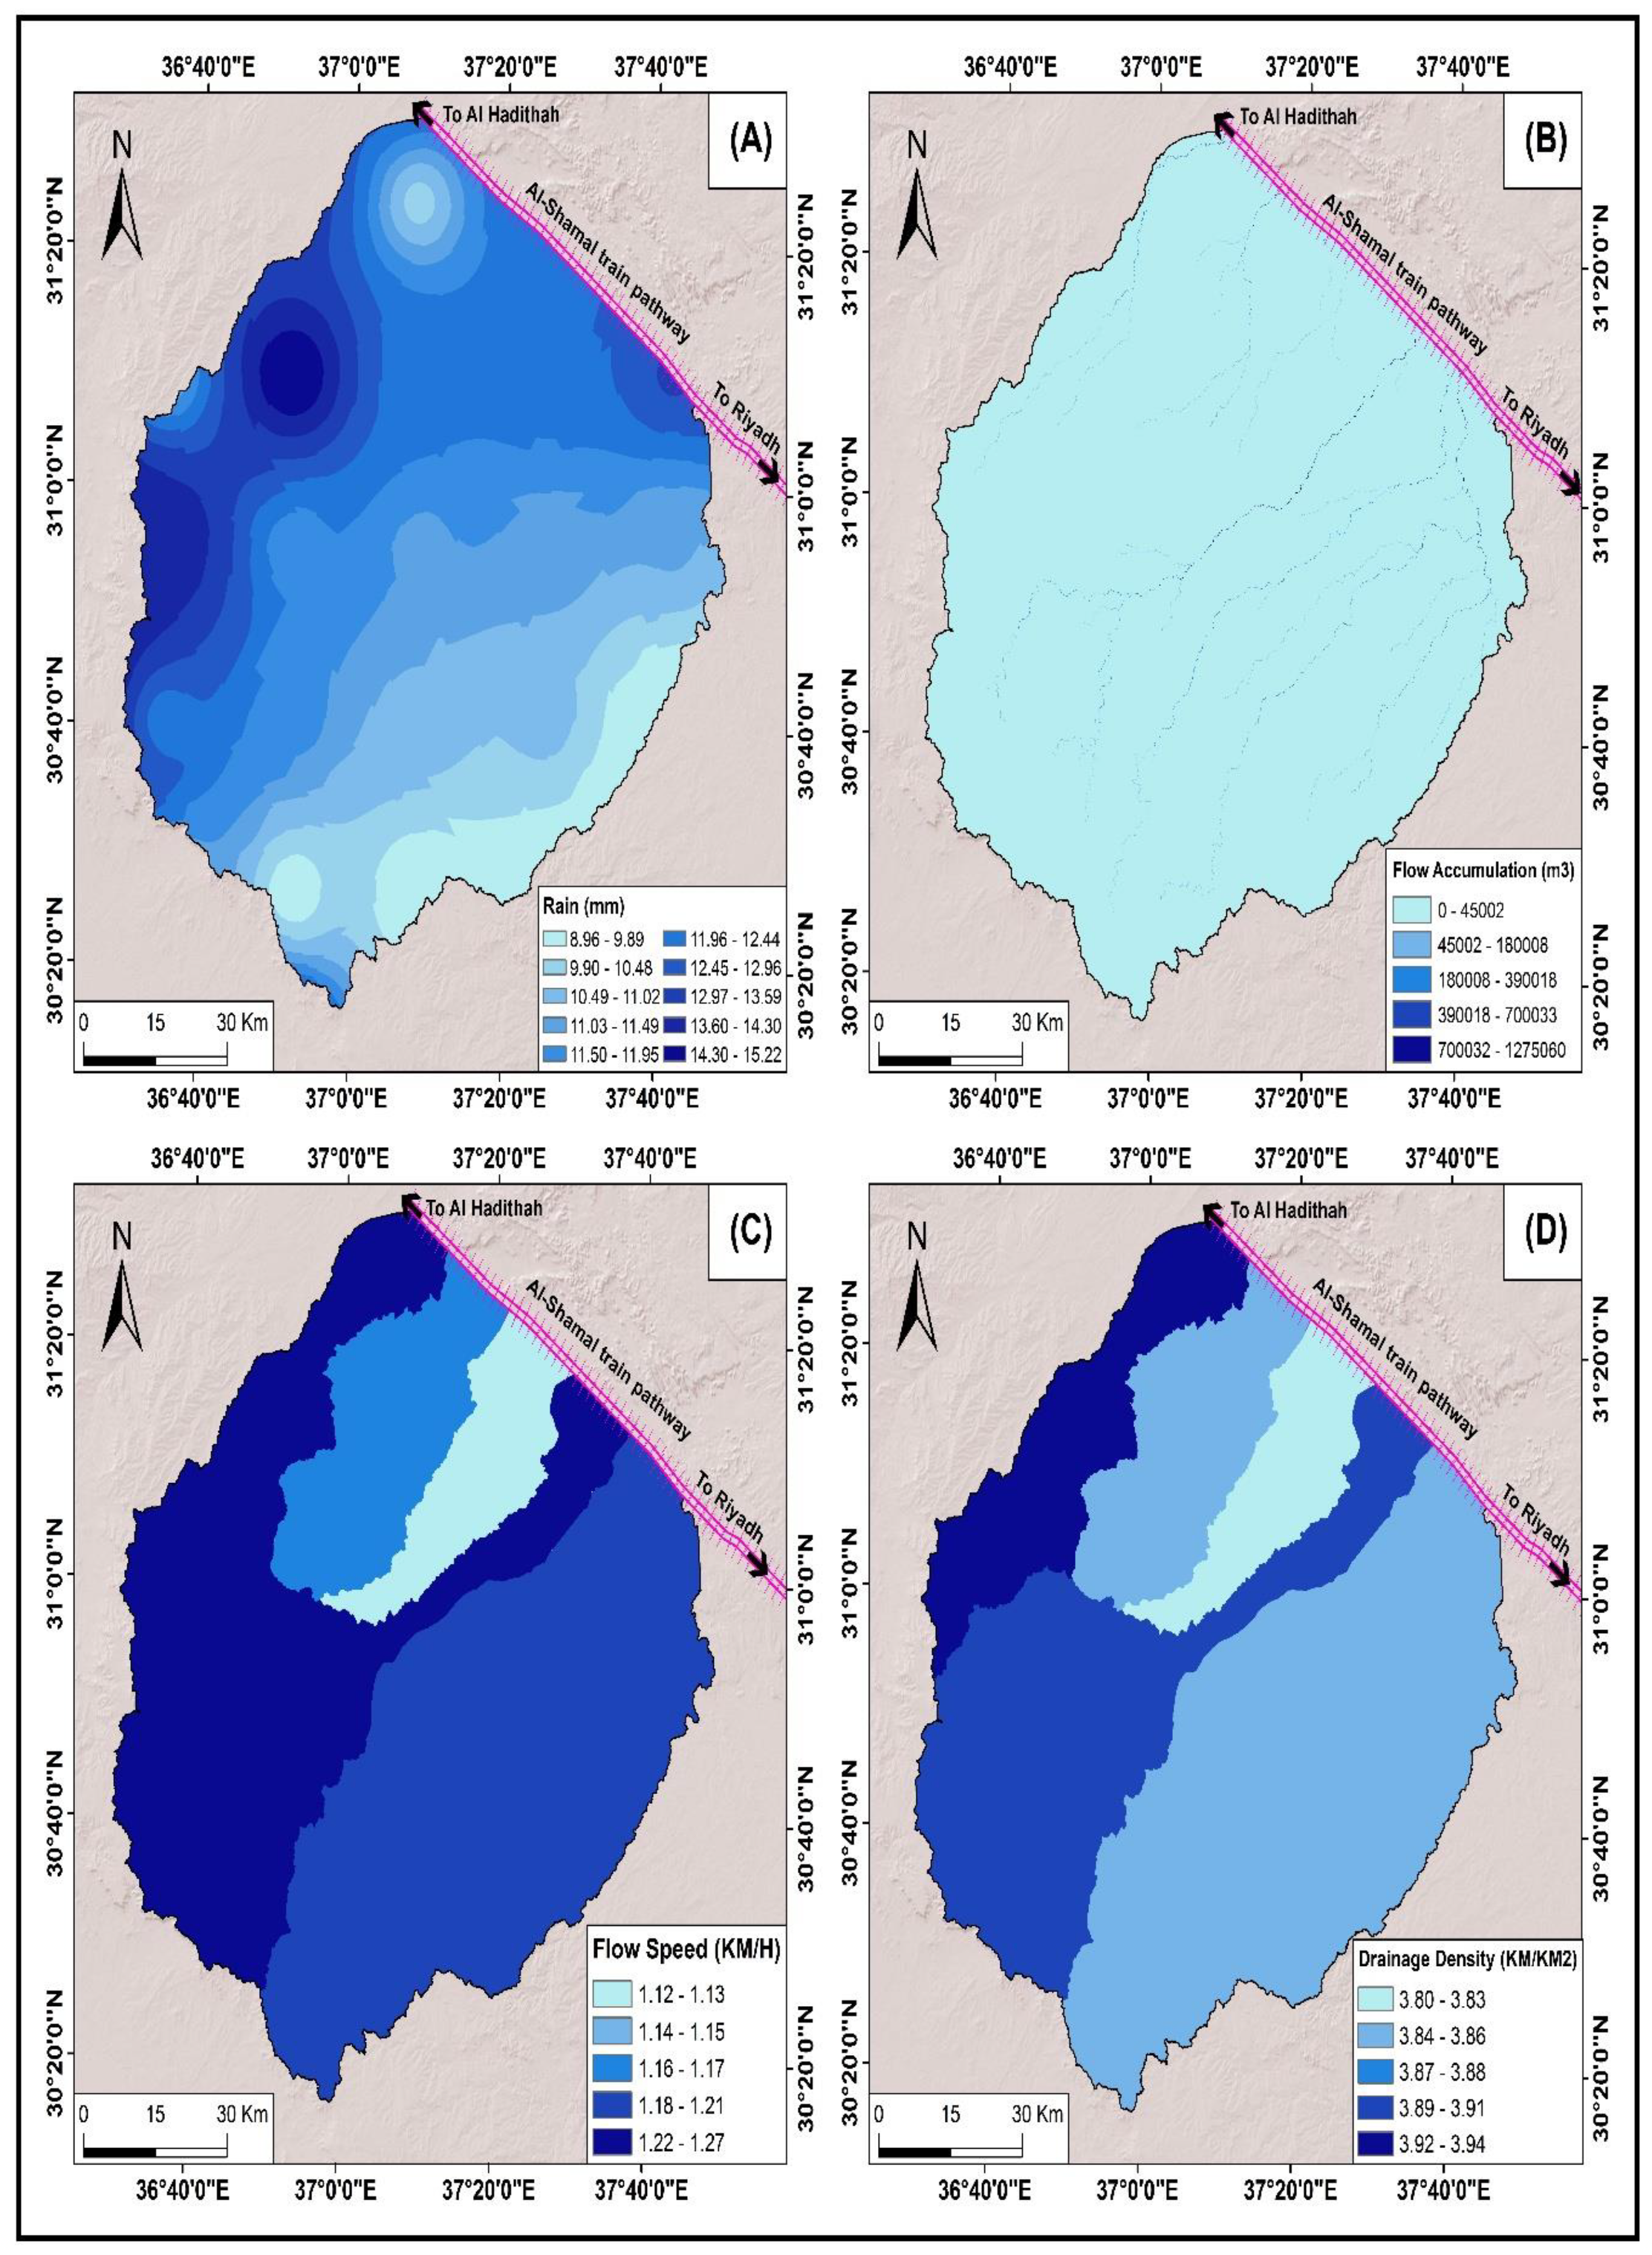
4.1.5. Flow Accumulation
Flow accumulation is one of the most important criteria in determining areas vulnerable to flood hazard. High values of flow accumulation indicate potential high flood hazard, whereas low values indicate low flood hazard [
36,
37]. The flow accumulation map of the study area was divided into five categories: (1) the first flow accumulation class (greater than 700,033 m
3) had the highest flood hazard and was concentrated in the estuaries of the large wadis located in Bayer and Sarmada; (2) the second flow accumulation class (390,018–700,033 m
3) was situated in the estuaries of the Bayer, Sarmada, Al-Makhrouk, and Haseidah Al-Gharbiyeh wadis; (3) the third flow accumulation class (180,008–390,018 m
3) was located in some tributaries of all wadis, except for that of Umm Nakhla; (4) the fourth flow accumulation class (45,002–180,008 m
3) was concentrated in some tributaries of all wadis; and (5) the fifth flow accumulation class (less than 45,002 m
3) represented the land between the wadis. The areas of the flow accumulation categories are shown in
Table 15 and
Figure 10.
4.1.6. Rainfall Density
Rain is the main element for flood occurrence, where areas with high rainfall density are the most vulnerable to floods and areas with low rainfall density are the least susceptible to floods [
35,
36,
47].
The rainfall density criterion was divided into ten classes. The class corresponding to rainfall greater than 14.3 mm had the highest flood hazard, which was concentrated in the west of the study area. The rainfall density class with less than 8.96 mm had the lowest flood hazard, which was concentrated in the southeast of the study area, as shown in
Table 16 and
Figure 10.
4.1.7. Drainage Density
Drainage density is one of the factors affecting the flood risk, as areas with high drainage density are more susceptible to floods and, therefore, have higher flood hazard than areas with less drainage density [
45,
46]. The drainage density criterion was divided into five classes, where areas with a drainage density greater than 3.91 km/km
2 had the highest flood hazard, which was represented in the Al-Makhrouk basin in the west of the study area. Areas with a drainage density of less than 3.8 km/km
2 represented the lowest flood hazard, which was located in Haseidah Umm Nakhleh basin (whose estuary ends at Al-Qurayyat city), as shown in
Table 17 and
Figure 10.
4.1.8. Runoff Speed
Runoff speed is one of the factors influencing the severity of a flood, as areas with high runoff speed are the most susceptible to flood hazard, while areas with low runoff speed are the least susceptible to flood hazard [
45]. The runoff speed criterion was divided into five classes, where runoff with a speed greater than 1.21 km/h indicated the highest flood hazard class, which was situated in the Bayer basin and in the center and west of the study area. The runoff speed class with a speed less than 1.12 km/h had the lowest flood hazard, which was located in the Haseidah Umm Nakhleh basin (whose estuary ends in Al-Qurayyat city) in the northeast of the study area, as presented in
Table 18 and
Figure 10.
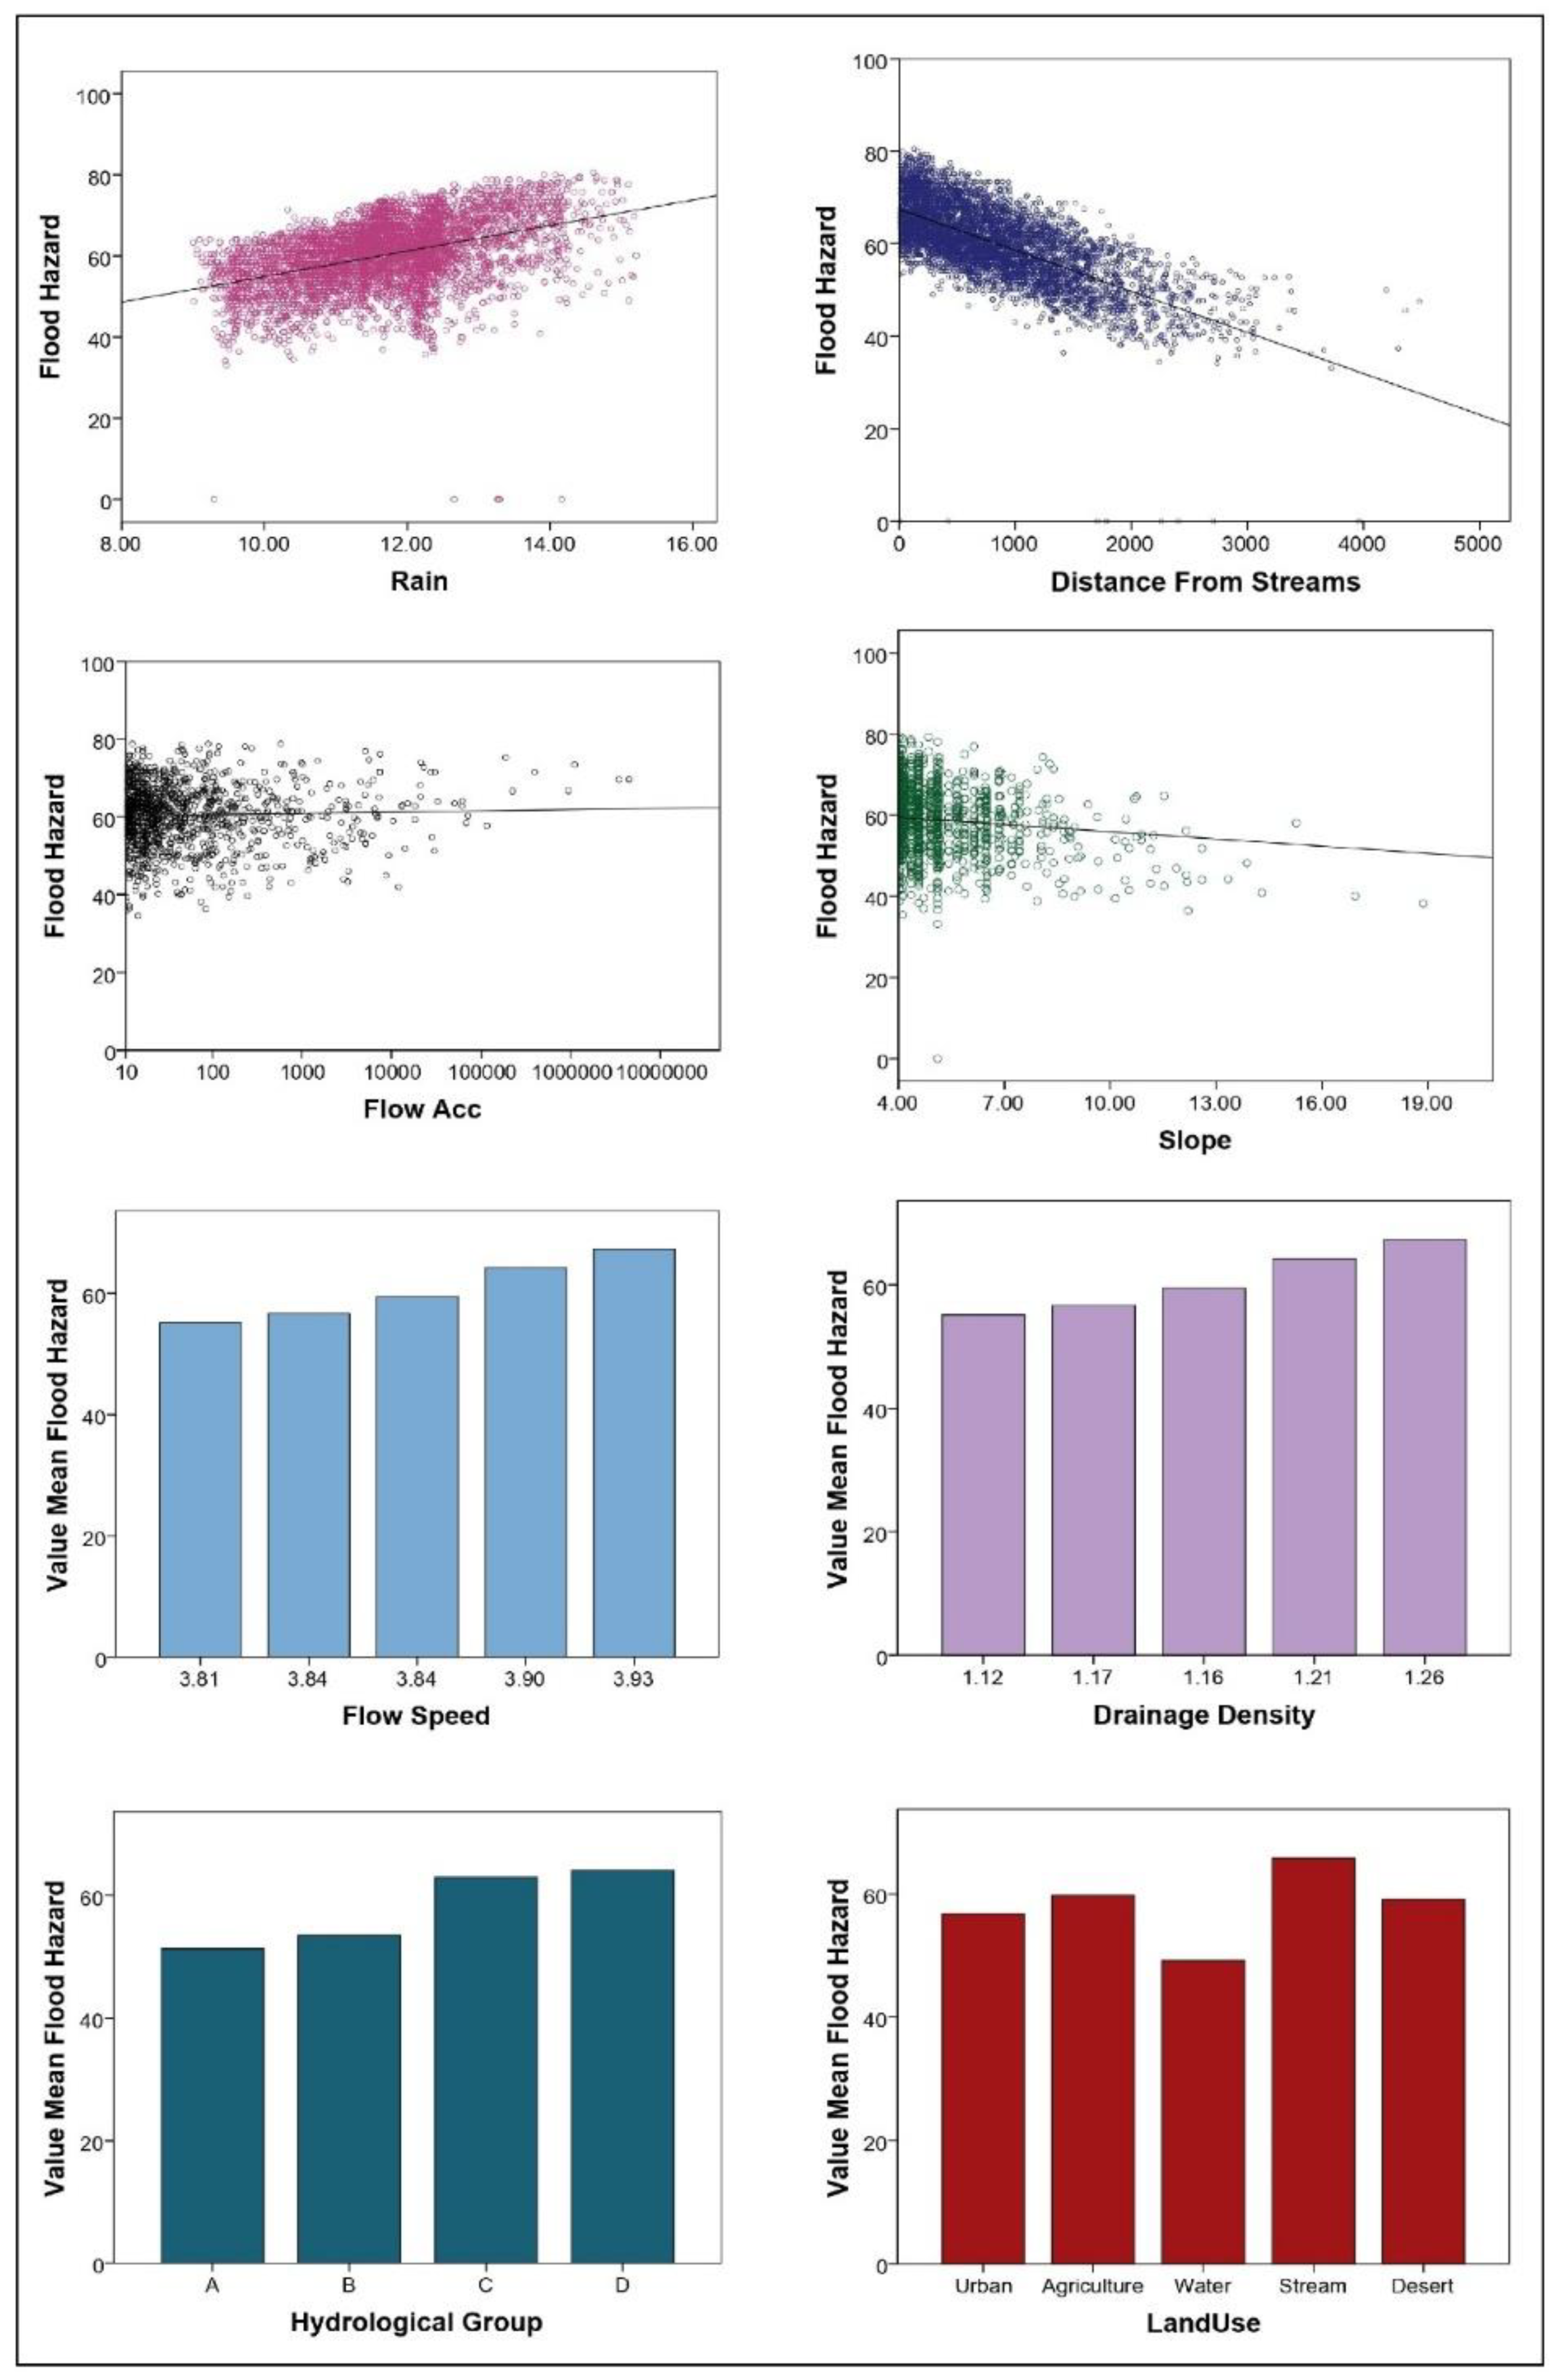
Figure 11 shows the correlation relationships between each of the eight criteria which affect the occurrence of floods and the degree of flood hazard. There was a positive relationship between the degree of flood hazard and some criteria affecting the occurrence of floods. These criteria were the flow accumulation, rainfall density, drainage density, and runoff speed, where the degree of hazard increased with an increase in the value of these criteria. Meanwhile, there were negative relationships between the degree of flood hazard and some other criteria; namely, slope and distance from the wadi network, where the degree of severity of the flood hazard decreased with an increase in the value of these criteria. Overall, the wadi network and desert areas had high hazard and the hydrological group (D) had the highest hazard.
4.2. Analysis of the Flood Hazard
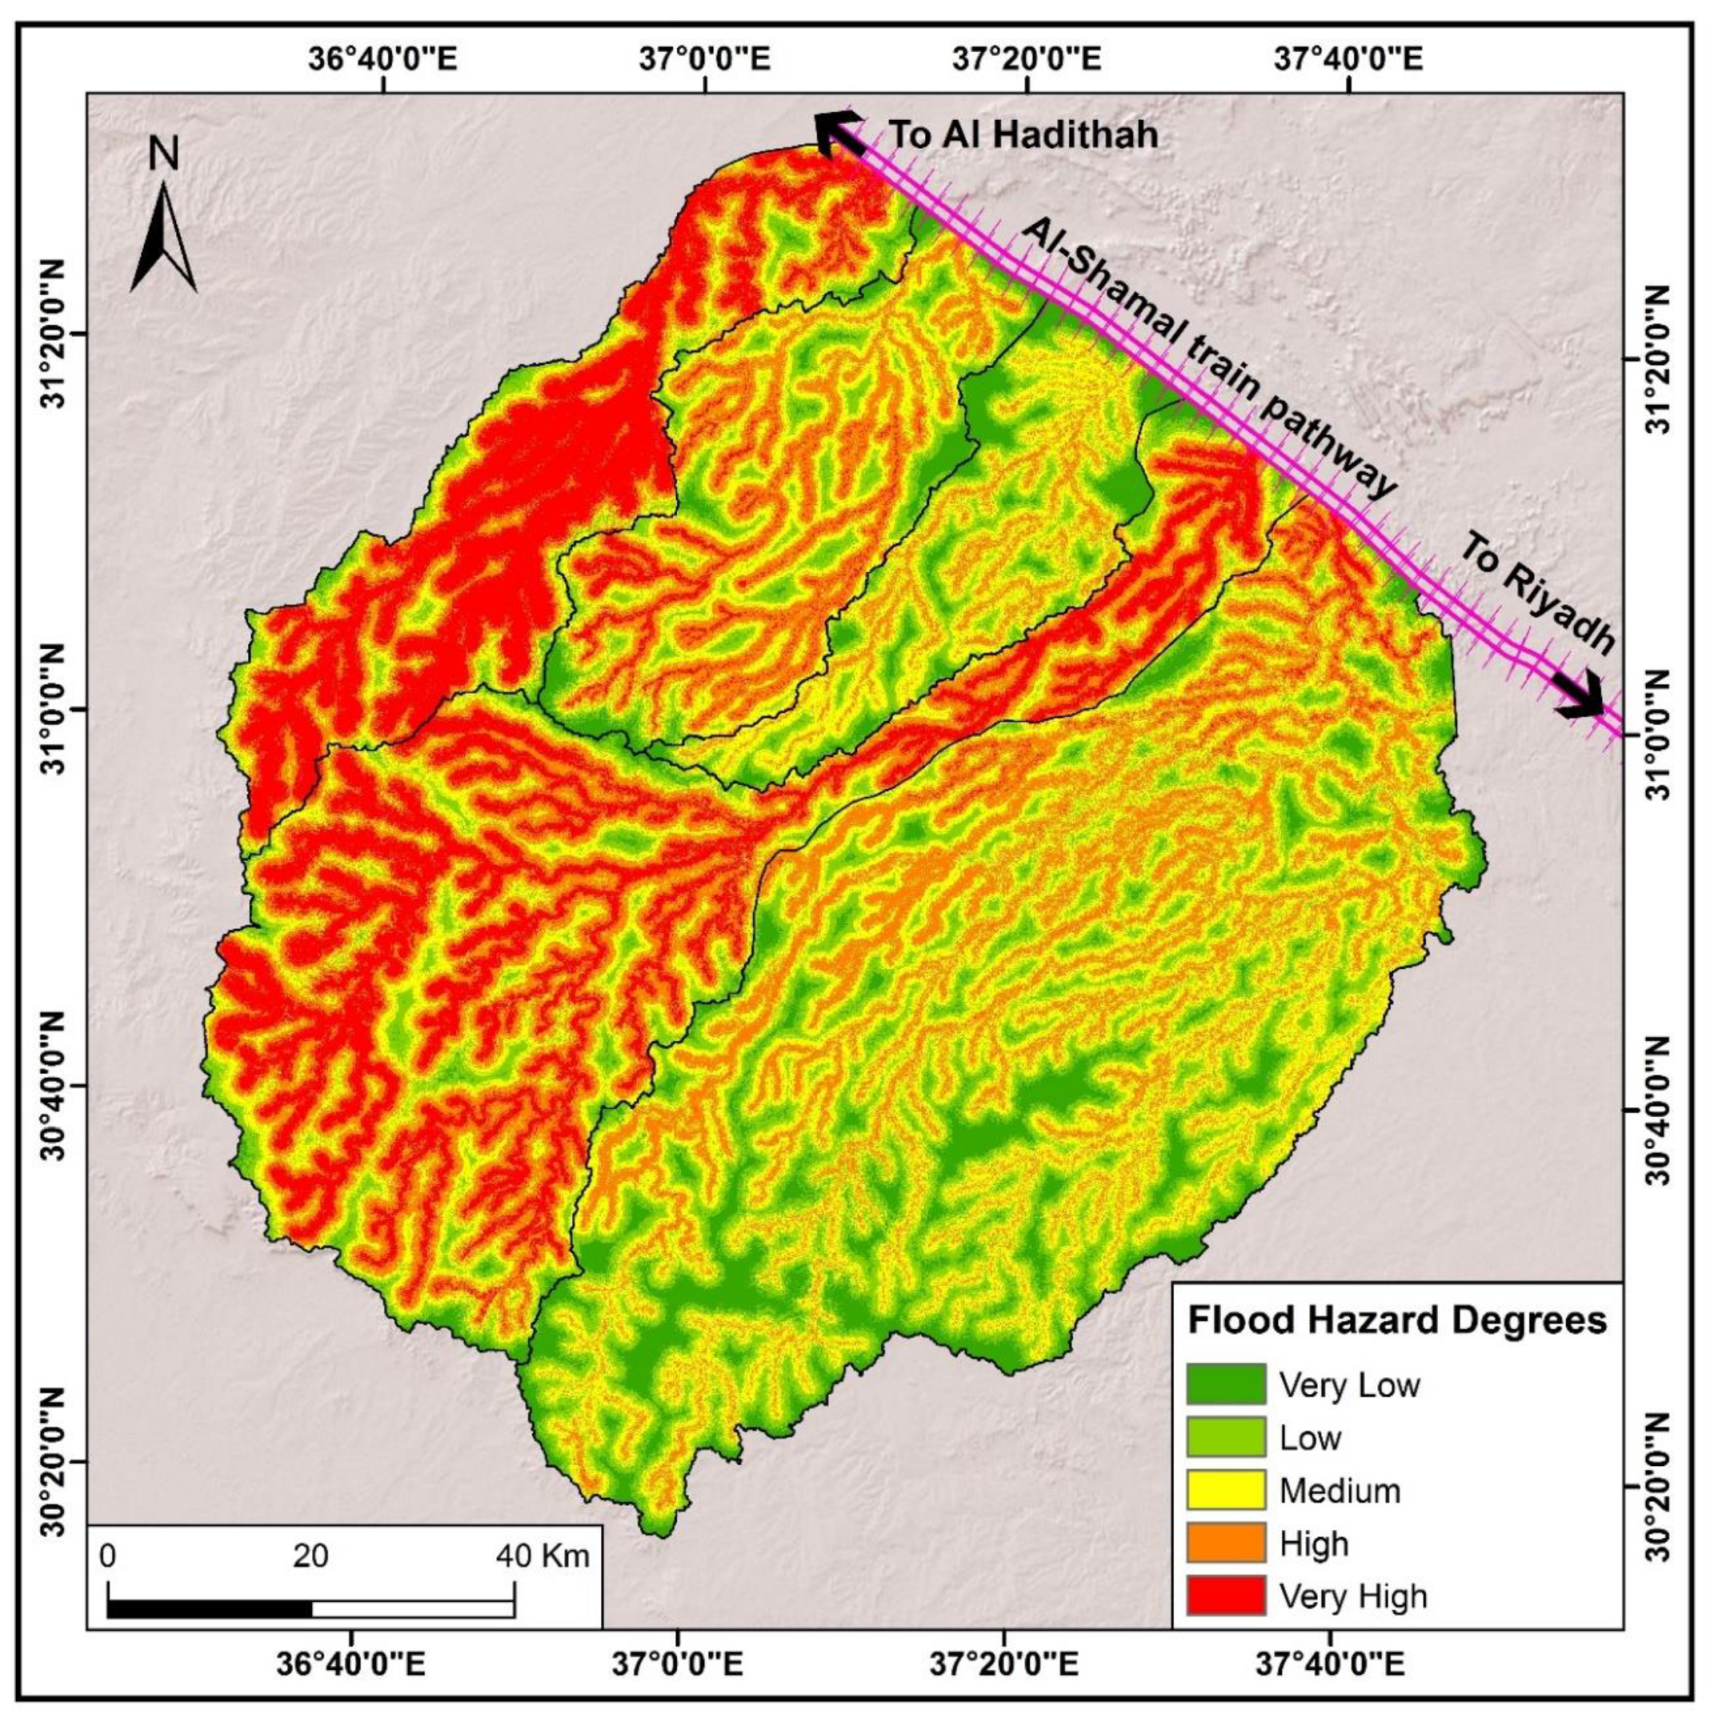
Five classes of flood hazard were identified for the Al-Shamal train pathway in Al-Qurayyat city in 2020, as illustrated in
Figure 12 and
Table 19.
4.2.1. Very High Hazard Areas
The very high flood hazard areas were concentrated around the dry wadis of the Bayer basin, which mediates the main drainage basin and the estuary of which ends at the agricultural lands to the southeast of Al-Qurayyat city; the Al-Shamal train railway; and the Al-Makhrouk basin, in the west of the main basin (its estuary ends at the north railway track). The percentage of hazard in these areas ranged between 68.2% and 91.2%, and the area of the high flood hazard zone was about 1744.22 km2; that is, 15.84% of the total area of the basin.
4.2.2. High Hazard Areas
The high flood hazard areas were situated around the dry wadis in the Hsaidah Al-Gharbiah basin, whose estuary ends at the north railway. The hazard percentage in these areas was between 61.6% and 68.2%, with a total area of nearly 3172.4 km2; that is, 28.81% of the total area of the basin.
4.2.3. Moderate Hazard Areas
The areas exposed to moderate flood hazards were located around the dry wadis in the Sarmada basin, which ends at the northern railway. The percentage of hazard in these areas ranged between 55.6% and 61.6%, with an area reaching 3184.52 km2; that is, 28.92% of the total area of the basin.
4.2.4. Low Hazard Areas
The low hazard areas were concentrated around the dry wadis in the Umm Nakhleh basin, whose estuary ends at Al-Qurayyat city and the northern railway. The total area was 2050.34 km2; that is, 18.62% of the total area.
4.2.5. Very Low Hazard Areas
The very low flood hazard areas were concentrated in the lands between the wadi networks of the Hsaidah Um Nakhla and Sarmada basins, the hazard percentage in these areas being between 24% and 48.5%, with an area of about 860 km2; that is, 7.81% of the total area.
4.3. Flood Hazards in the Urban and Agricultural Areas
The flood hazard map in
Figure 13 reveals that the urban areas exposed to very high, high, medium, low, and very low flood hazards were 4.44, 24.79, 56.3, 32.65, and 13.97 km
2, respectively, with percentages of 3.36%, 18.76%, 42.61%, 24.71%, and 10.57%, respectively, of the total urban area in the study area (which was nearly 132.14 km
2). The higher flood hazards in the urban areas were concentrated in Ghati village, which is part of the major estuary of the Bayer wadi; the middle of the basin of Hadithah village (the major estuary of Al-Makhrouq wadi in the west of the basin Al-Qurayyat city). Al-Qurayyat city was subject to potential flood hazards with a moderate degree of severity, especially as it is considered part of the major estuary for the Haseidah wadi, in addition to the high hazard from the urban expansion between the center of the city and the Al-Qurayyat airport, which is considered part of the main estuary of the Hassidah Umm Nakhleh wadi.
Figure 13 and
Table 20 show that the agricultural lands in the study area exposed to very high, high, moderate, low, and very low flood hazard had areas of 18.38, 41.49, 37.29, 19.1, and 12.8 km
2, respectively, comprising 14.24%, 32.15%, 28.89%, 14.8%, and 9.92%, respectively, of the total agricultural land in the study area (for a total of 129.06 km
2). The very high flood hazards in the agricultural lands were concentrated around the village of Ghati, which is considered part of the main estuary of the Bayer basin. Very high flood hazards also existed in the south of the village of Ghati and around Hadithah village (major estuary of the Al-Makhrouk wadi in the west of the drainage basin).
Figure 14 illustrates the degree of flood hazard in urban areas and agricultural lands, in addition to the displacement of residents of the villages of Bayer and Ghati.
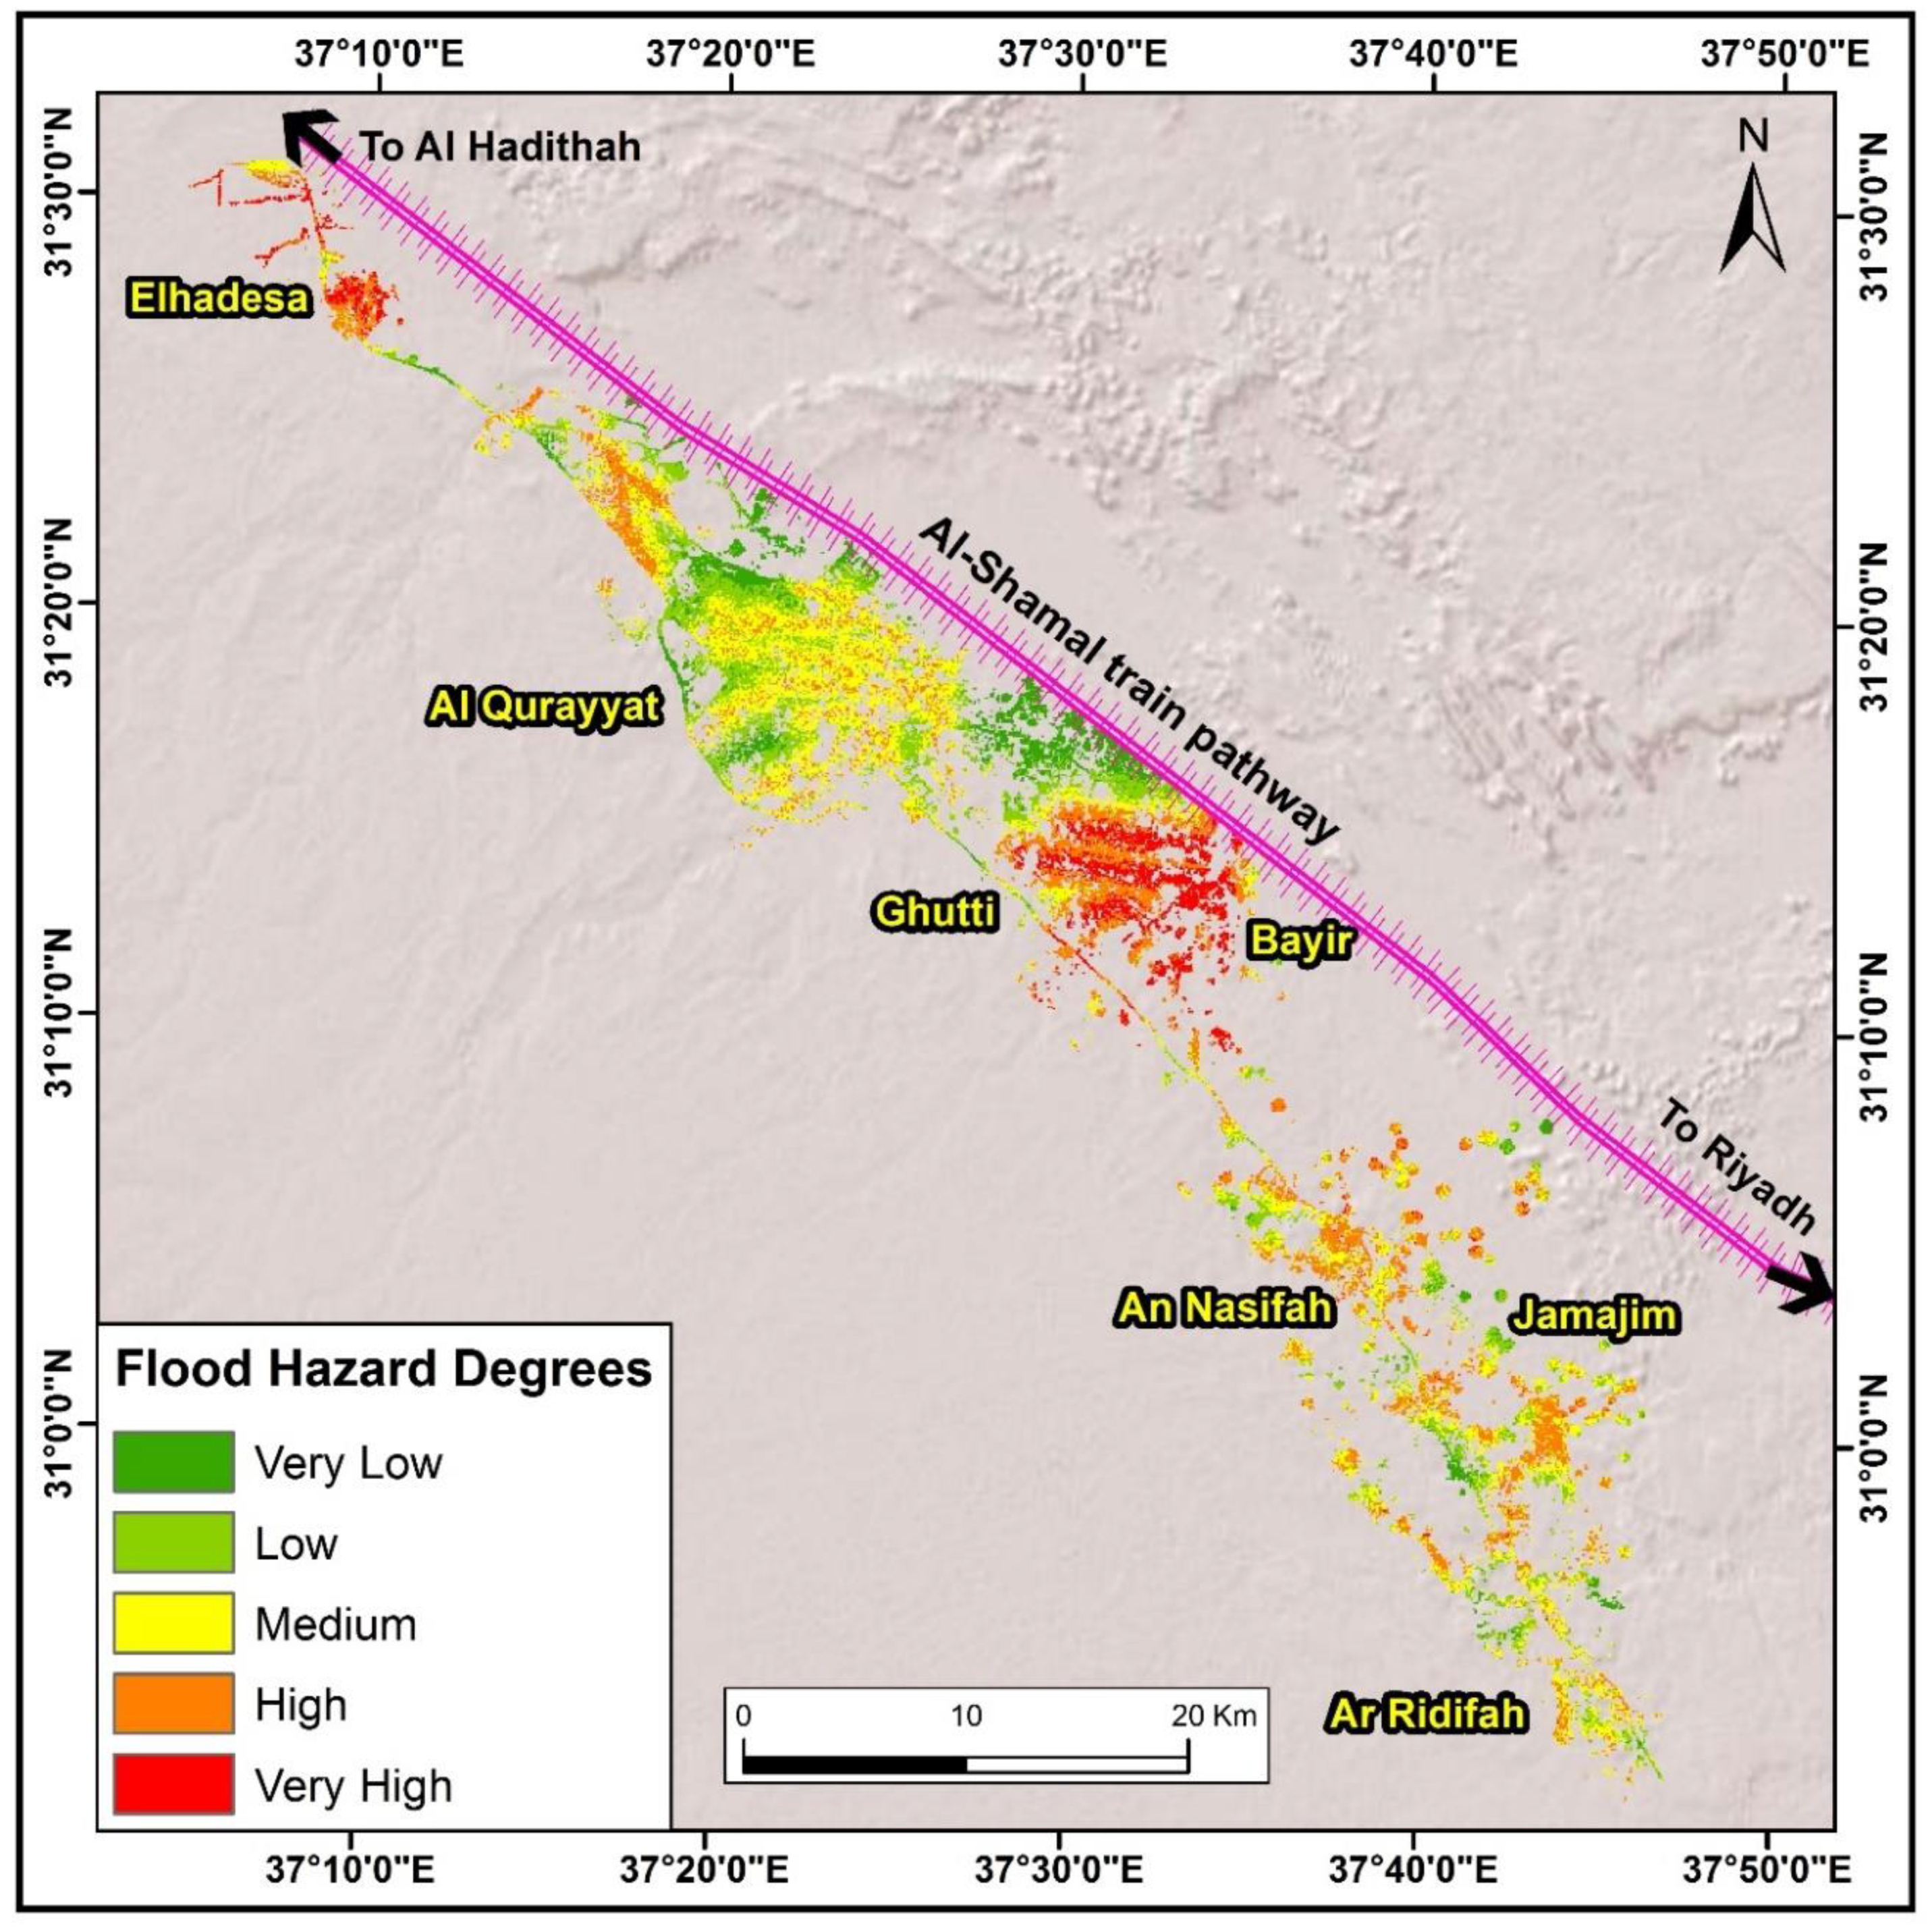
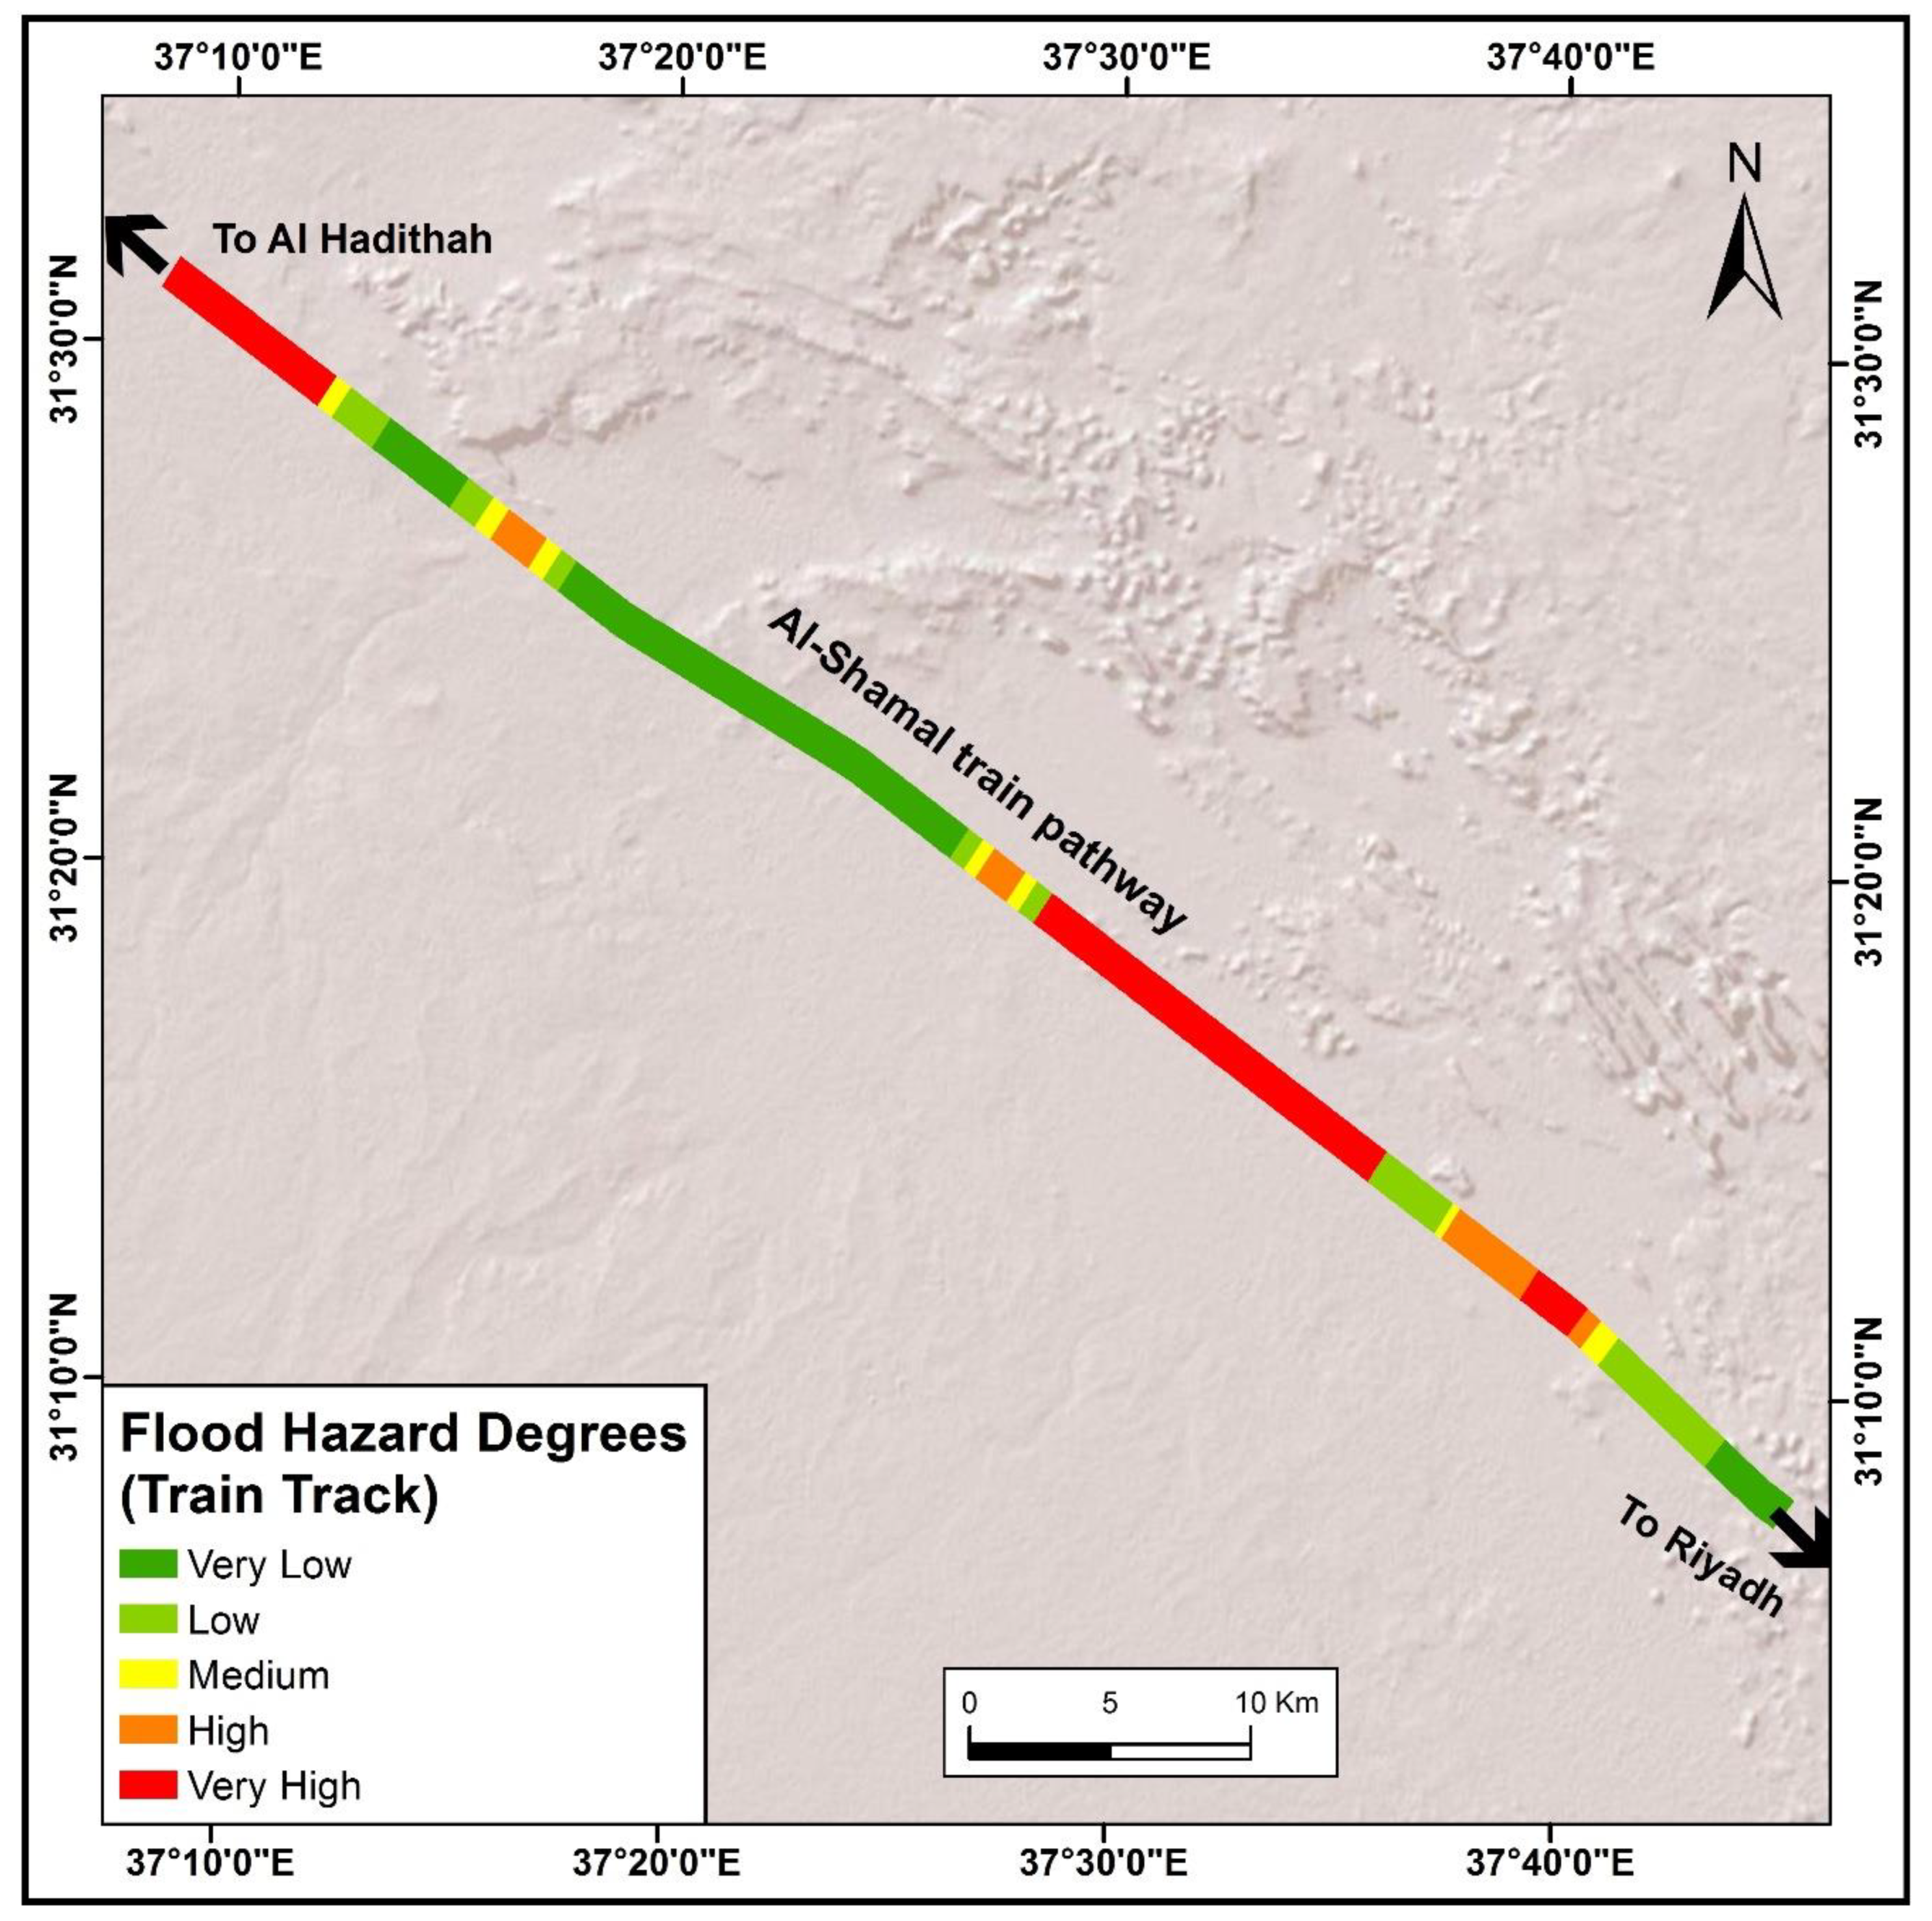
4.4. Degrees of Floods Hazards along the Al-Shamal Train Pathway
Inspection of the flood hazard map showing the degree of severity on the Al-Shamal train pathway in the study area reveals that (1) the lengths of the sections exposed to very high, high, medium, low, and very low flood hazards corresponded to 6.96, 12.24, 6.54, 15.24, and 31.64 km, respectively; a percentage of 9.59%, 16.86%, 9.01%, 20.99%, and 43.55%, respectively, of the total pathway length; (2) the sections exposed to very high and high flood hazards were concentrated in front of Wadis Bayer, Al-Makhrouk, and Haseidah Umm Nakhleh at the villages of Ghati, Bayer, Hadithah, and Al-Nasifah; (3) the sections exposed to low and very low flood hazards were concentrated in the areas between the estuaries of the wadis, particularly in the section between Al-Qurayyat city and Al-Qurayyat airport in the northwest of the city and the city of Ghati to the southeast of the city.
Table 21 and
Figure 15 illustrate the degrees of severity on the Al-Shamal train pathway in the study area.
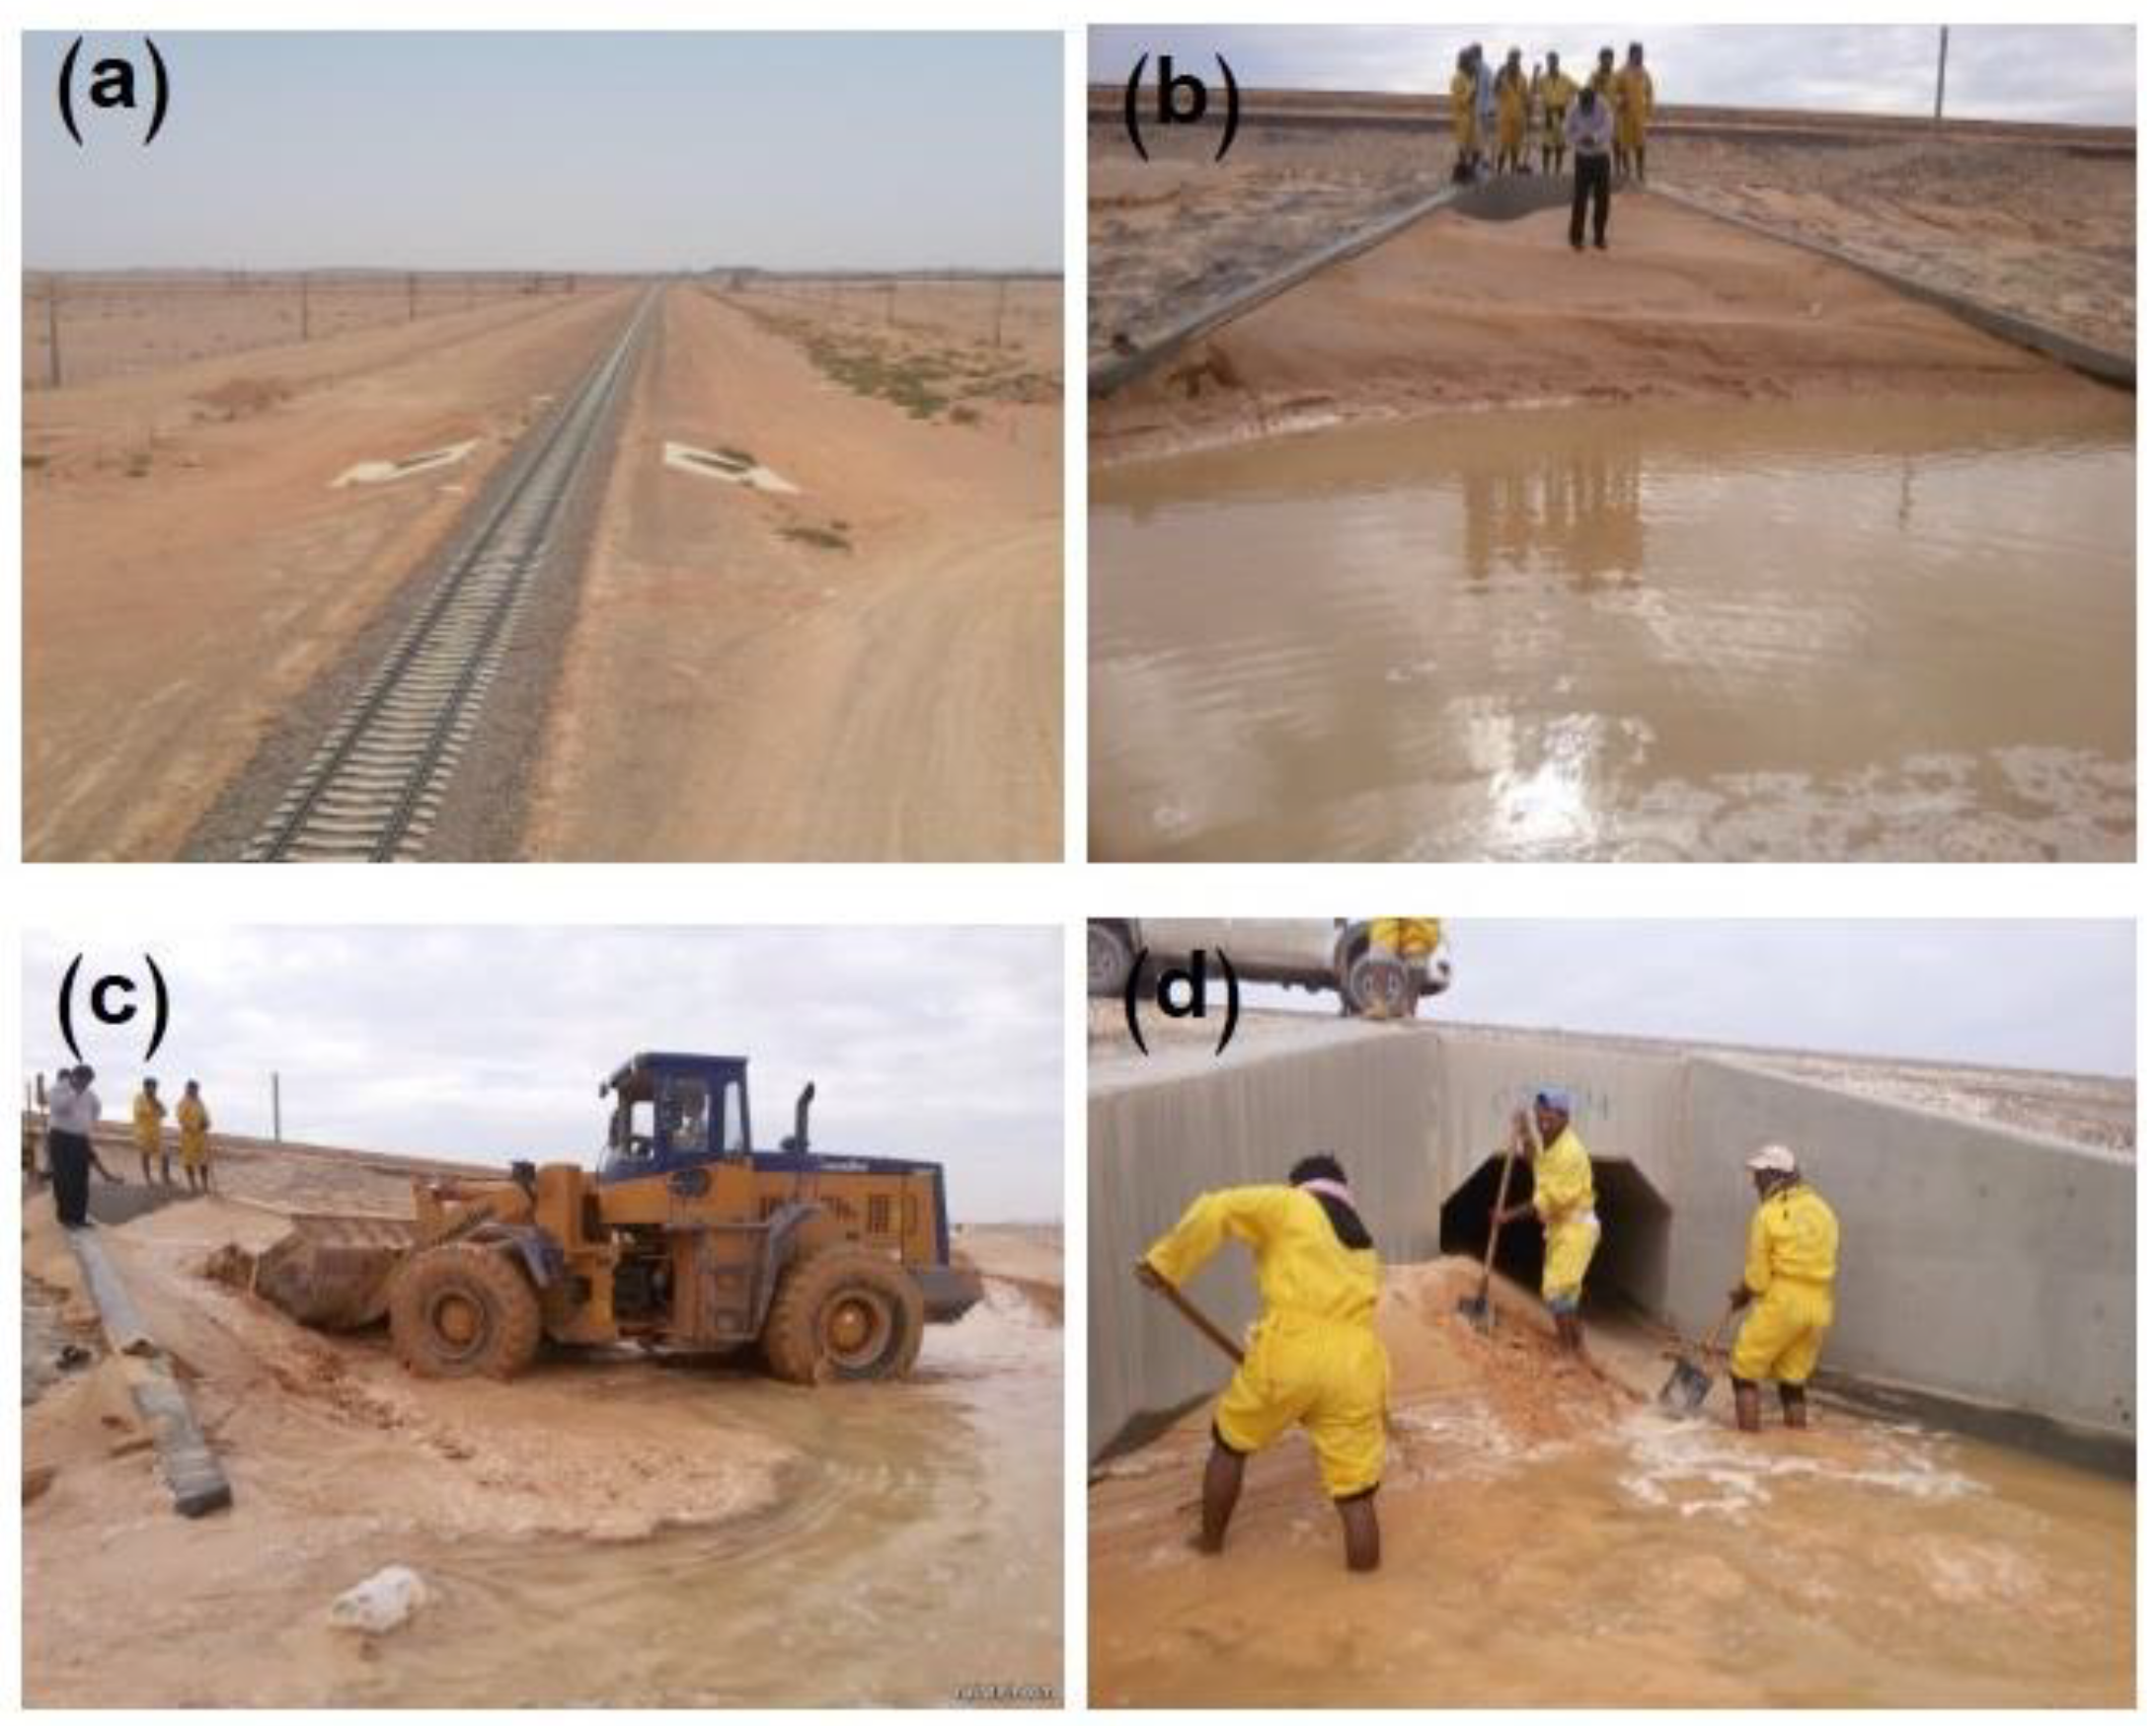
Figure 16 shows a field visit to inspect the water drainage installations at the bottom of the Al-Shamal train pathway in the study area.
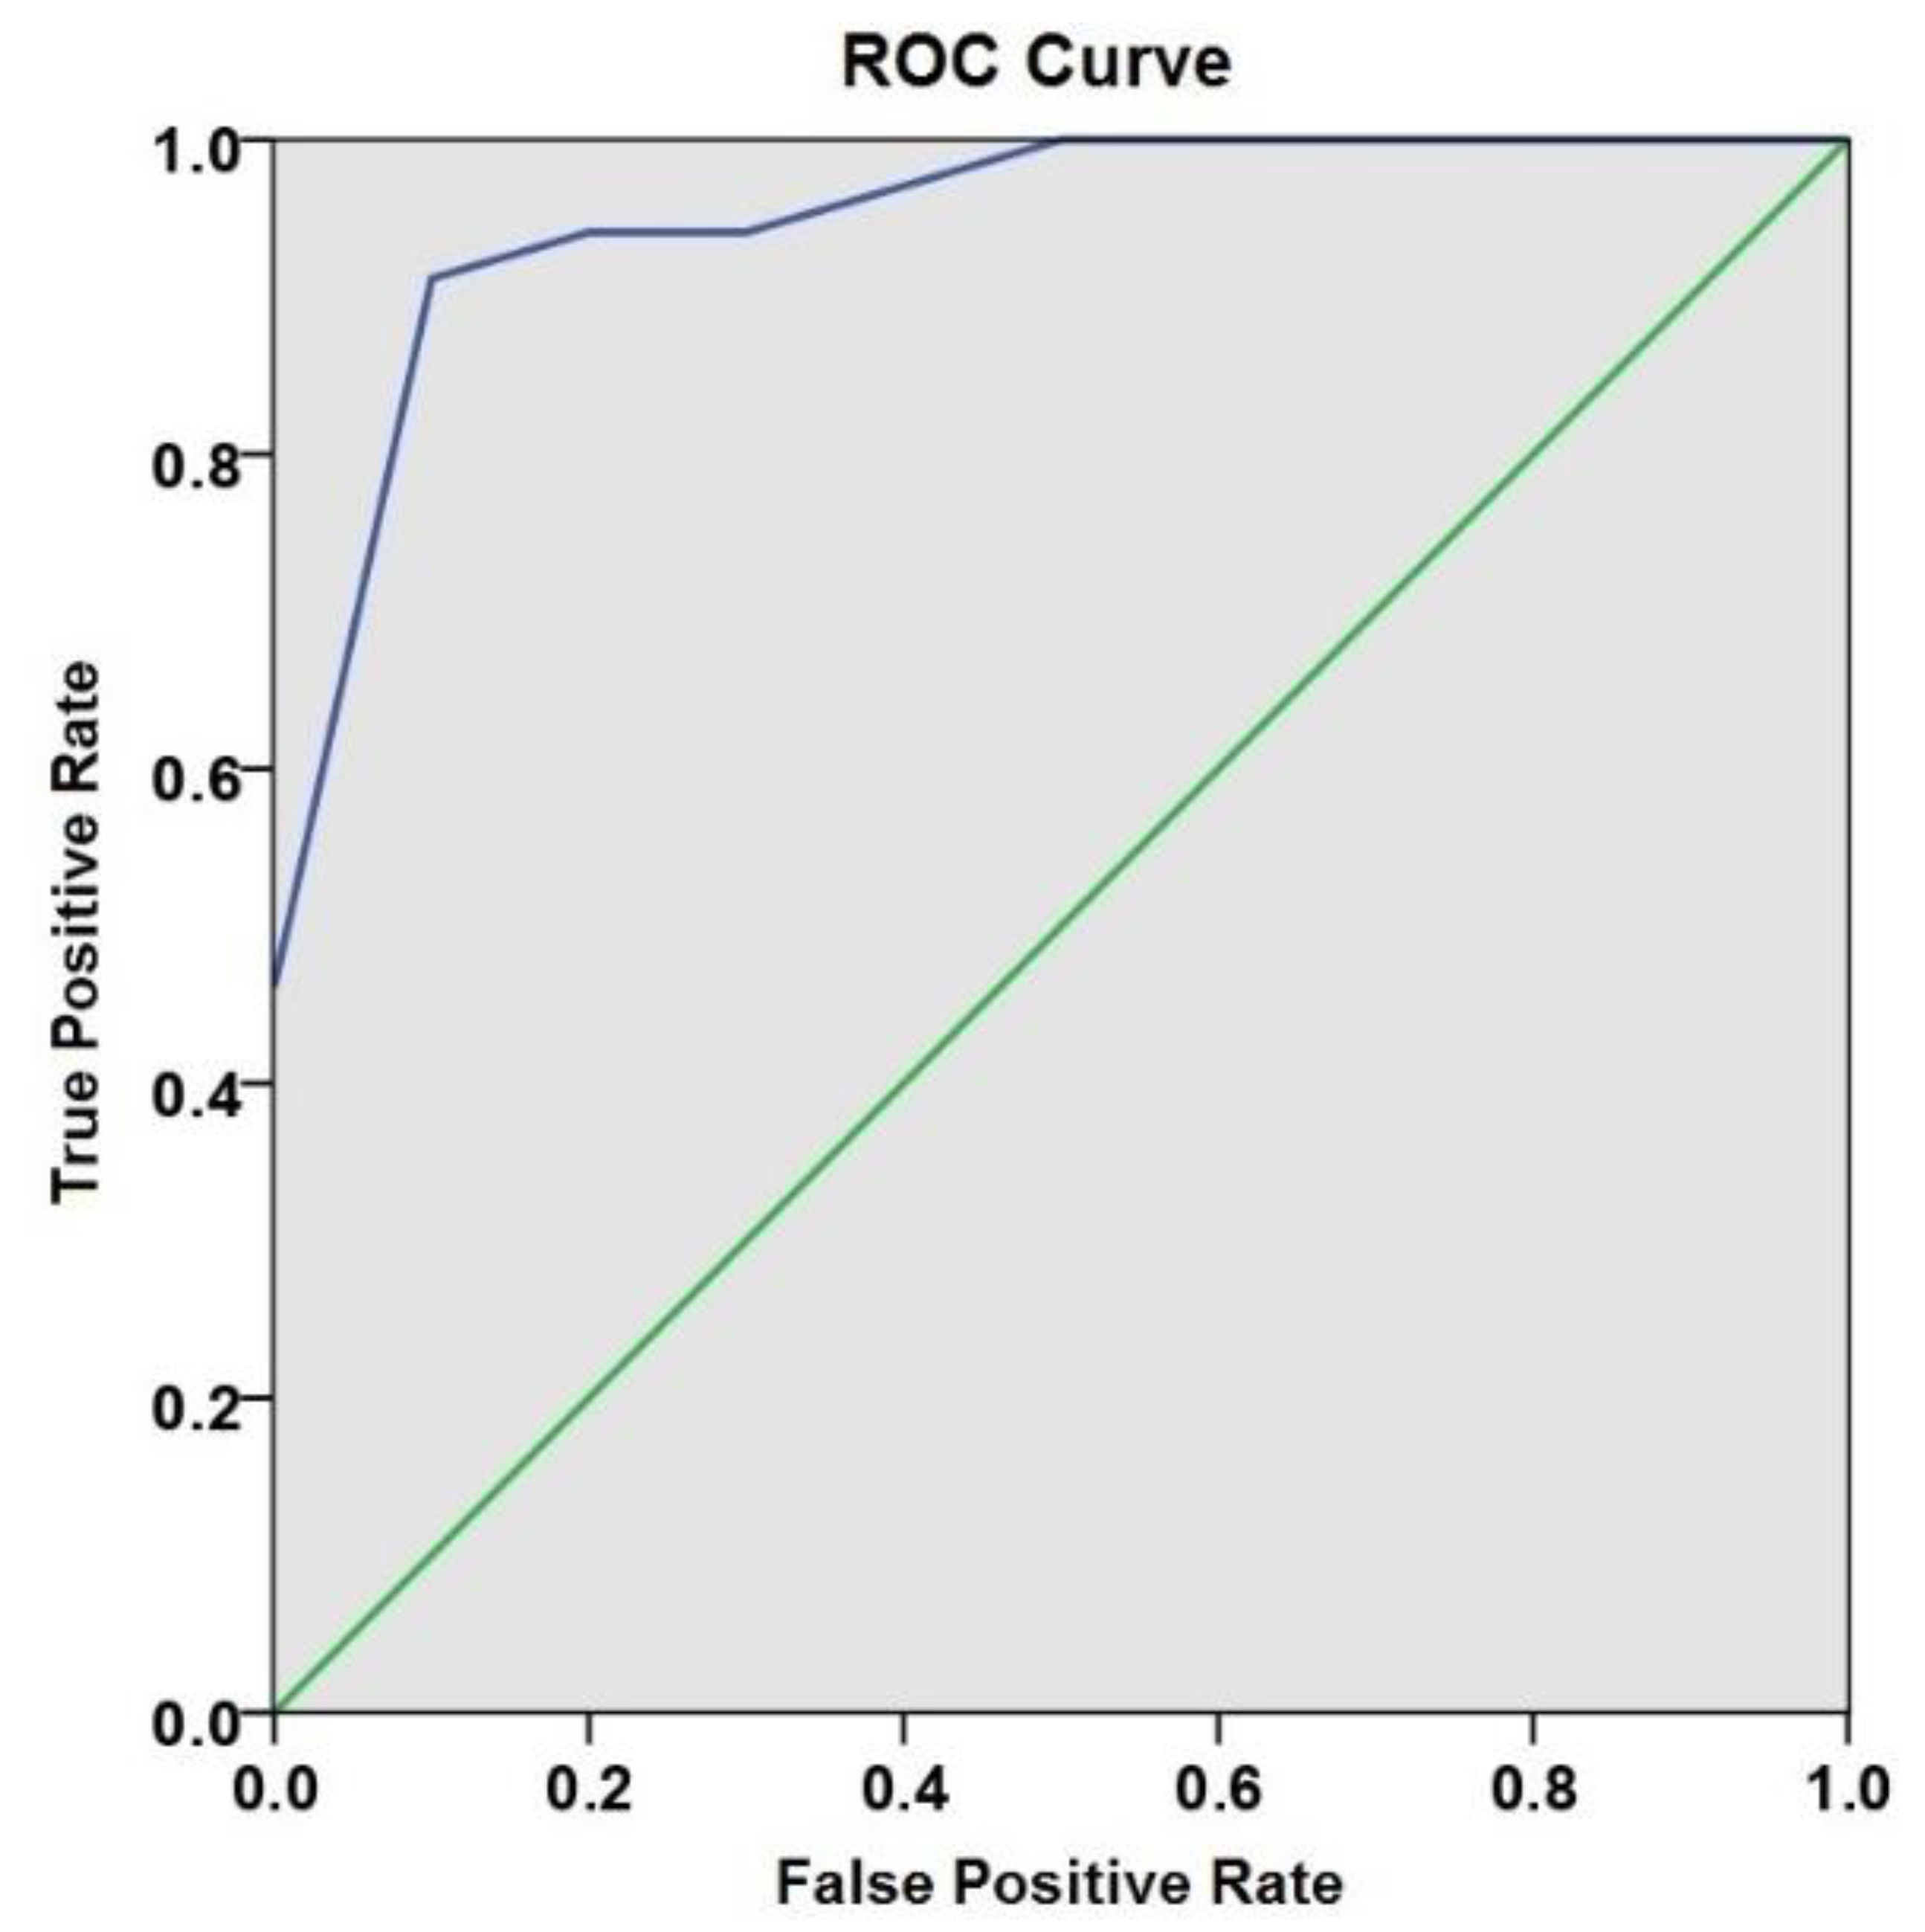
4.5. Validation of Flood Hazard Model
Validation of the accuracy and reliability of the results for decision-making is essential and crucial, as the flood hazard map is a key element for optimal decision-making to mitigate the negative impacts of potential flood hazards and for future planning decisions and strategies. There are many scientific methods for the validation of the results of the flood hazard map. The receiver operating characteristic (ROC) curve and the area under the curve (AUC) are considered to be the most popular in flood hazard studies [
48,
49].
The ROC curve is a mathematical and statistical method which can be applied to examine the accuracy and reliability of the results of a flood hazard map [
50,
51,
52]. The ROC curve is a graph with two axes (x,y), where the false-positive rate (FPR) is displayed along the
x-axis to express the number of samples in the flood hazard map which are unlikely to occur and, in fact, where floods have not occurred. The true positive rate (TPR) is displayed along the
y-axis, which expresses the number of samples in the flood hazard map which are likely to occur and, in fact, where floods have occurred.
The reliability of the prediction rate can be achieved by calculating the area under the curve (AUC). If the AUC value is less than 0.5, this means that the flood hazard map is unreliable and that its results are misleading and incorrect. However, if the AUC value is 1, then the results of the flood hazard map are reliable.
Table 22 shows the values of the AUC and the degree of validation of the results.
The ROC curve in
Figure 17 was drawn using the SPSS program, considering the flood hazards value from the samples collected from the field study and the values extracted from the flood hazard map. The AUC value (using the SPSS program results) was 0.971 (AUC = 0.971) with a 95% confidence level. This AUC value indicates that the reliability of the flood hazard map produced in this study is excellent (around 97.1%).
5. Conclusions
Understanding the dynamics of floods and obtaining an accurate flood hazard map comprise major political, planning, and popular demands in KSA. Such a map, in turn, reduces and mitigates flood hazards and assists urban and regional planning authorities in developing optimal protection measures. The study area considered in this paper is one of the largest dry environments in the world, characterized by the sudden occurrence of floods; almost every year due to the presence of five main wadis. Flood hazards in the study area involve damage to infrastructure, urban areas, and transportation, such as roads and railways.
The main aim of this scientific research was to carefully study and inspect the flood hazard in the study area after the construction of the Al-Shamal train pathway in 2017 near the cities and villages of Al-Qurayyat, considering that there were several historical flooding events in the study area which flooded urban communities close to the train pathway, producing significant damage to lives, property, and infrastructure. Thus, the flood hazard map presented in this study can help in developing an appropriate strategic solution by the responsible authorities and policymakers, shedding light on the hot-spot flood areas in order to mitigate and reduce the hazard.
Integrating GIS-MCDA and AHP in flood hazard studies is of great importance in the case of multiple criteria and conflicting objectives. The results of this study revealed that the very high and high flood hazard zones constituted about 44.65% of the study area, concentrated in the Bayer wadi and Al-Makhrouq wadi drainage basins. These zones represent a severe hazard for the urban areas, agricultural lands, and the Al-Shamal train pathway. The moderate, low, and very low flood hazard areas constituted about 55.35% of the study area, which were concentrated in the drainage basins of wadis Haseidah Al-Gharbiyeh, Haseidah, Umm Nakhleh, and Sarmada. About 22.12% of the urban areas were exposed to very high and high flood hazards, as concentrated in Ghati, Bayer, and Hadithah villages. Meanwhile, the urban areas in the center and the northern border of Al-Qurayyat city were exposed to about 77.88% of average, low, and very low hazards. About 26.45% of the Al-Shamal train pathway was exposed to high and very high flood hazards, while about 73.55% of the train pathway was exposed to moderate, low, and very low flood hazards.
6. Recommendations
Flood hazard prevention projects, such as drainage basins, barriers, channels, dams, collecting basins, water harvesting, and so on, should be planned in the upper or middle sectors of the wadis, and not in the areas targeted by the flood hazards. The projects that are currently established to mitigate the frequent floods every year are not commensurate with the nature of the floods in the Al-Qurayyat region. The presence of five main wadis, originating from west to east and carrying a huge amount of floodwater, exposes urban and agricultural areas to loss every year without taking advantage of them, in addition to the destruction of infrastructure.
It was noticed, during the field visits, that there are few implemented projects to protect the study area from flood hazards. However, these projects should be focused on the Haseidah Al-Gharbiyeh, Haseidah Umm Nakhleh, Bayer, and Sarmada wadi areas, in order to prevent floods in Al-Qurayyat, its villages, and the Al-Shamal train pathway.
The study area urgently needs to develop integrated strategies to mitigate flood hazards. These strategies should involve studying the wadis affecting the study area, including wadis Al-Makhrouk, Haseidah Al-Gharbiyeh Umm Nakhleh, Bayer, and Sarmada. Moreover, hydrological studies must include the maximum floodwater flow in these wadis in addition to the estimated floodwater amount and arrival time, based on the amount of rain falling on these basins during the different return periods every 50 and 100 years. Furthermore, setting up floodwater drainage facilities is required, according to these recent studies, in order to establish suitable protection measures.
We recommend the implementation of urgent plans to mitigate the hazards of floods. Priority of these plans has to be given to areas of high and very high flood hazards, which are represented by the Wadi Bayer and Wadi Al-Makhrouk drainage basins; specifically the point at which these wadis intersect the Al-Shamal train pathway. The areas subject to frequent flood hazards which have exposed the residents of Bayer, Ghati, and Hadithah villages to full displacement in recent years require special interest.
We recommend the establishment of early warning systems (EWS) through the building of permanent stations to measure and monitor the water flow in the five wadis in the study area. EWS enable the monitoring of floods automatically, sending warnings to the monitoring stations when the water level reaches a dangerous level.
We recommend directing future urban and infrastructure planning in the study area away from the high and very high hazard areas in the floods hazard map obtained in this study. Furthermore, either construction in the high and very high hazard areas should be prohibited, or the encroachment of agricultural areas should only be allowed after the provision of mechanisms to mitigate flood hazards which are commensurate with the nature of the wadis.
We also recommend developing long-term plans to deal with the critical areas in the study area, especially in the Faydat Al-Rashrashyia region in the north of Al-Qurayyat city, the northwest region of Al-Qurayyat city along the new international road, and the villages of Aqeelah, Daabousiya, Bayer, Ghati, and Ain Hawas.
Finally, we recommend that the Saar company (the owner of the Al-Shamal train pathway project) should perform a site suitability analysis, in order to study and evaluate the current location of the Al-Shamal train pathway (2750 km) from Riyadh city in the south to Hadithah village in the north; in addition to intensifying studies on such topics as sand migration, floods, and geomorphological hazards, in order to ensure the safety of life and property.

 ,
, 


