Does the Process of Passive Forest Restoration Affect the Hydrophysical Attributes of the Soil Superficial Horizon?

 ,
,  , , and
Abstract
:
1. Introduction
2. Material and Methods
2.1. Study Area
2.2. Soil Sampling and Analytical Procedures
2.3. Data Analysis
3. Results
Soil Hydrophysical Attributes of the Study Areas
4. Discussion
5. Conclusions
Author Contributions
Funding
Acknowledgments
Conflicts of Interest
References
- Chazdon, R. Beyond Deforestation: Restoring Forests and Ecosystem Services on Degraded Lands. Science 2008, 320, 1458–1460. [Google Scholar] [CrossRef] [PubMed] [Green Version]
- Filoso, S.; Bezerra, M.O.; Weiss, K.C.B.; Palmer, M.A. Impacts of forest restoration on water yield: A systematic review. PLoS ONE 2017, 12, e0183210. [Google Scholar] [CrossRef] [PubMed] [Green Version]
- Chazdon, R.L. Regeneração de florestas tropicais. Boletim Museu Paraense Emílio Goeldi Ciencias Naturais 2012, 7, 195–218. [Google Scholar]
- Crouzeilles, R.; Ferreira, M.S.; Chazdon, R.; Lindenmayer, D.B.; Sansevero, J.B.B.; Monteiro, L.; Iribarrem, A.; Latawiec, A.E.; Strassburg, B.B.N. Ecological restoration success is higher for natural regeneration than for active restoration in tropical forests. Sci. Adv. 2017, 3, e1701345. [Google Scholar] [CrossRef] [Green Version]
- Meli, P.; Holl, K.D.; Benayas, J.M.R.; Jones, H.P.; Jones, P.C.; Montoya, D.; Mateos, D.M. A global review of past land use, climate, and active vs. passive restoration effects on forest recovery. PLoS ONE 2017, 12, e0171368. [Google Scholar] [CrossRef]
- Rozendaal, D.M.A.; Bongers, F.; Aide, T.M.; Dávila, E.Á.; Ascarrunz, N.; Balvanera, P.; Becknell, J.M.; Bentos, T.V.; Brancalion, P.H.S.; Cabral, G.A.L.; et al. Biodiversity recovery of Neotropical secondary forests. Sci. Adv. 2019, 5, eaau3114. [Google Scholar] [CrossRef] [Green Version]
- Godsey, S.; Elsenbeer, H. The soil hydrologic response to forest regrowth: A case study from southwestern Amazonia. Hydrol. Process. 2002, 16, 1519–1522. [Google Scholar] [CrossRef]
- Giannini, V.; Bertacchi, A.; Bonari, E.; Silvestri, N. Rewetting in Mediterranean reclaimed peaty soils and its potential for phyto-treatment use. J. Environ. Manag. 2018, 208, 92–101. [Google Scholar] [CrossRef] [Green Version]
- Burger, J.A.; Kelting, D.L. Using soil quality indicators to assess forest stand management. For. Ecol. Manag. 1999, 122, 155–166. [Google Scholar] [CrossRef]
- Zimmermann, A.; Schinn, D.S.; Francke, T.; Elsenbeer, H.; Zimmermann, B. Uncovering patterns of near-surface saturated hydraulic conductivity in an overland flow-controlled landscape. Geoderma 2013, 195, 1–11. [Google Scholar] [CrossRef]
- Mesquita, M.G.B.; Moraes, S.O. The dependence of the saturated hydraulic conductivity on physical soil properties. Ciência Rural 2004, 34, 963–969. [Google Scholar] [CrossRef] [Green Version]
- Ahuja, L.R.; Naney, J.W.; Green, R.E.; Nielsen, D.R. Macroporosity to Characterize Spatial Variability of Hydraulic Conductivity and Effects of Land Management. Soil Sci. Soc. Am. J. 1984, 48, 699–702. [Google Scholar] [CrossRef]
- De Andrade, A.G.; Tavares, S.D.L.; Coutinho, H.D.C. Contribuição da serrapilheira para recuperação de áreas degradadas e para manutenção da sustentabilidade de sistemas agroecológicos. Embrapa Solos 2003, 24, 55–63. [Google Scholar]
- Piché, N.; Kelting, D.L. Recovery of soil productivity with forest succession on abandoned agricultural land. Restor. Ecol. 2015, 23, 645–654. [Google Scholar] [CrossRef]
- Ziegler, A.D.; Giambelluca, T.; Tran, L.T.; Vana, T.T.; Nullet, M.A.; Fox, J.; Vien, T.D.; Pinthong, J.; Maxwell, J.; Evett, S. Hydrological consequences of landscape fragmentation in mountainous northern Vietnam: Evidence of accelerated overland flow generation. J. Hydrol. 2004, 287, 124–146. [Google Scholar] [CrossRef]
- Paul, M.; Catterall, C.P.; Pollard, P.; Kanowski, J. Recovery of soil properties and functions in different rainforest restoration pathways. For. Ecol. Manag. 2010, 259, 2083–2092. [Google Scholar] [CrossRef]
- Nyberg, G.; Bargués-Tobella, A.; Kinyangi, J.; Ilstedt, U. Soil property changes over a 120-yr chronosequence from forest to agriculture in western Kenya. Hydrol. Earth Syst. Sci. 2012, 16, 2085–2094. [Google Scholar] [CrossRef] [Green Version]
- Gageler, R.; Bonner, M.; Kirchhof, G.; Amos, M.; Robinson, N.; Schmidt, S.; Shoo, L.P. Early Response of Soil Properties and Function to Riparian Rainforest Restoration. PLoS ONE 2014, 9, e104198. [Google Scholar] [CrossRef]
- Lozano, S.; Cooper, M.; Meli, P.; Ferraz, S.F.; Rodrigues, R.R.; Sauer, T.J. Land restoration by tree planting in the tropics and subtropics improves soil infiltration, but some critical gaps still hinder conclusive results. For. Ecol. Manag. 2019, 444, 89–95. [Google Scholar] [CrossRef]
- Sparovek, G.; Barretto, A.; Berndes, G.; Martins, S.; Maule, R. Environmental, land-use and economic implications of Brazilian sugarcane expansion 1996–2006. Mitig. Adapt. Strat. Glob. Chang. 2008, 14, 285–298. [Google Scholar] [CrossRef]
- Ribeiro, M.C.; Metzger, J.P.; Martensen, A.C.; Ponzoni, F.J.; Hirota, M.M. The Brazilian Atlantic Forest: How much is left, and how is the remaining forest distributed? Implications for conservation. Biol. Conserv. 2009, 142, 1141–1153. [Google Scholar] [CrossRef]
- Ferraz, S.F.; Ferraz, K.M.; Cassiano, C.C.; Brancalion, P.H.S.; da Luz, D.T.; Azevedo, T.N.; Metzger, J.P. How good are tropical forest patches for ecosystem services provisioning? Landsc. Ecol. 2014, 29, 187–200. [Google Scholar] [CrossRef]
- Peñuela, M.C.; Drew, A.P. A Model to Assess Restoration of Abandoned Pasture in Costa Rica Based on Soil Hydrologic Features and Forest Structure. Restor. Ecol. 2004, 12, 516–524. [Google Scholar] [CrossRef]
- Bruijnzeel, L.A. Hydrological functions of tropical forests: Not seeing the soil for the trees? Agric. Ecosyst. Environ. 2004, 104, 185–228. [Google Scholar] [CrossRef]
- Zwartendijk, B.; Meerveld, H.J.; Ghimire, C.; Bruijnzeel, L.; Ravelona, M.; Jones, J. Rebuilding soil hydrological functioning after swidden agriculture in eastern Madagascar. Agric. Ecosyst. Environ. 2017, 239, 101–111. [Google Scholar] [CrossRef] [Green Version]
- Mendes, M.S.; Latawiec, A.E.; Sansevero, J.B.B.; Crouzeilles, R.; Moraes, L.F.D.; Castro, A.; Alves-Pinto, H.N.; Brancalion, P.H.S.; Rodrigues, R.R.; Chazdon, R.L.; et al. Look down-there is a gap-the need to include soil data in Atlantic Forest restoration. Restor. Ecol. 2018, 27, 361–370. [Google Scholar] [CrossRef]
- Alvares, C.A.; Stape, J.L.; Sentelhas, P.C.; Gonçalves, J.L.M.; Sparovek, G. Köppen’s climate classification map for Brazil. Meteorologische Zeitschrift 2013, 22, 711–728. [Google Scholar] [CrossRef]
- De Oliveira, J.B.; Menk, J.R.F.; Barbieri, J.L.; Rotta, C.L.; Tremocoldi, W. Levantamento Pedologico Semidetalhado de Estado de São Paulo: Quadricula de Araras; Instituto Agronômico de Campinas: Campinas/São Paulo, Brasil, 1982.
- Koffler, N.F. Uso das terras da bacia do rio Corumbataí em 1990. Geografia 1993, 18, 135–150. [Google Scholar]
- Rodrigues, R.R. A vegetação de Piracicaba e municípios do entorno. Circular Técnica IPEF 1999, 189, 1–17. [Google Scholar]
- Pinto, L.P.; Bedê, L.; Paese, A.; Fonseca, M.; Paglia, A.; Lamas, I. Mata Atlântica Brasileira: Os desafios para conservação da biodiversidade de um hotspot mundial. In Biologia da Conservação: Essências; Rocha, C.F.D., Bergallo, H.G., Sluys, M.V., Alves, M.A.S., Eds.; RiMa Editora: Rio de Janeiro, Brazil, 2006; pp. 91–118. [Google Scholar]
- Da Fonseca, G.A. The vanishing Brazilian Atlantic forest. Biol. Conserv. 1985, 34, 17–34. [Google Scholar] [CrossRef]
- Silva, W.G.S.; Metzger, J.P.; Simões, S.; Simonetti, C. Relief influence on the spatial distribution of the Atlantic Forest cover on the Ibiúna Plateau, SP. Braz. J. Biol. 2007, 67, 403–411. [Google Scholar] [CrossRef] [PubMed]
- Valente, R.; Vettorazzi, C. Forest structure assessment in the Corumbataí river basin, SP. Sci. For. 2005, 68, 45–57. [Google Scholar]
- Soil Survey Staff. Soil Taxonomy: A Basic System of Soil Classification for Making and Interpreting Soil Surveys; Natural Resources Conservation Service: Whashington, DC, USA, 1999.
- Lassabatere, L.; Angulo-Jaramillo, R.; Ugalde, J.M.S.; Cuenca, R.; Braud, I.; Haverkamp, R. Beerkan Estimation of Soil Transfer Parameters through Infiltration Experiments-BEST. Soil Sci. Soc. Am. J. 2006, 70, 521–532. [Google Scholar] [CrossRef]
- Angulo-Jaramillo, R.; Bagarello, V.; Lovino, M.; Lassabatère, L. Infiltration Measurements for Soil Hydraulic Characterization; Springer International Publishing: Berlim, Germany, 2016. [Google Scholar] [CrossRef] [Green Version]
- Bagarello, V.; Di Prima, S.; Iovino, M. Estimating saturated soil hydraulic conductivity by the near steady-state phase of a Beerkan infiltration test. Geoderma 2017, 303, 70–77. [Google Scholar] [CrossRef]
- White, I.; Sully, M.J. Macroscopic and microscopic capillary length and time scales from field infiltration. Water Resour. Res. 1987, 23, 1514–1522. [Google Scholar] [CrossRef]
- Reynolds, W.D.; Elrick, D.E. Pressure infiltrometer. In Methods of Soil Analysis; Dane, J.H., Topp, G.C., Eds.; Part 4, Physical Methods, SSSA Book Series, No. 5; Soil Science Society of America: Madison, WI, USA, 2002; Volume 4, pp. 826–836. [Google Scholar]
- Haverkamp, R.; Ross, P.J.; Smettem, K.; Parlange, J.Y. Three-Dimensional analysis of infiltration from the disc infiltrometer: 2. Physically based infiltration equation. Water Resour. Res. 1994, 30, 2931–2935. [Google Scholar] [CrossRef] [Green Version]
- Raats, P.A.C. Analytical Solutions of a Simplified Flow Equation. Trans. ASAE 1976, 19, 683–689. [Google Scholar] [CrossRef]
- Di Prima, S.; Stewart, R.D.; Castellini, M.; Bagarello, V.; Abou Najm, M.R.; Pirastru, M.; Giadrossich, F.; Iovino, M.; Angulo-Jaramillo, R.; Lassabatere, L. Estimating the macroscopic capillary length from Beerkan infiltration experiments and its impact on saturated soil hydraulic conductivity predictions. J. Hydrol. 2020. [Google Scholar] [CrossRef]
- Lozano, S.; Cooper, M.; Ferraz, S.F.; Rodrigues, R.R.; Lassabatere, L.; Castellini, M.; Di Prima, S. Assessing Water Infiltration and Soil Water Repellency in Brazilian Atlantic Forest Soils. Appl. Sci. 2020, 10, 1950. [Google Scholar] [CrossRef] [Green Version]
- Elrick, D.E.; Reynolds, W.D. Methods for Analyzing Constant-Head Well Permeameter Data. Soil Sci. Soc. Am. J. 1992, 56, 320–323. [Google Scholar] [CrossRef]
- Grossman, R.B.; Reinsch, T. 2.1 Bulk Density and Linear Extensibility. In Methods of Soil Analysis: Part 4 Physical Methods; Dane, J.H., Topp, G.C., Eds.; Soil Science Society of America: Madison, WI, USA, 2002; Volume 5, pp. 201–228. [Google Scholar] [CrossRef]
- Lassabatere, L.; Di Prima, S.; Angulo-Jaramillo, R.; Keesstra, S.; Salesa, D. Beerkan multi-runs for characterizing water infiltration and spatial variability of soil hydraulic properties across scales. Hydrol. Sci. J. 2019, 64, 165–178. [Google Scholar] [CrossRef]
- Vomocil, J.A. Porosity. In Methods of Soil Analysis: Part 1 Physical and Mineralogical Properties, Including Statistics of Measurement and Sampling; Black, C.A., Ed.; Soil Science Society of America: Madison, WI, USA, 1965; Volume 9, pp. 299–314. [Google Scholar]
- Imhoff, S.; Da Silva, A.P.; Junior, M.D.S.D.; Tormena, C.A. Quantificação de pressões críticas para o crescimento das plantas. Revista Brasileira Ciência Solo 2001, 25, 11–18. [Google Scholar] [CrossRef] [Green Version]
- Salton, J.C.; Silva, W.M.; Tomazi, M.; Hernani, L.C. Determinação da Agregação do Solo—Metodologia em Uso na Embrapa Agropecuária Oeste; Embrapa Agropecuária Oeste. Comunicado Técnico, 184; Embrapa Agropecuária Oeste: Dourados, Brazil, 2012; 8p. [Google Scholar]
- Kemper, W.D.; Rosenau, R.C. Aggregate Stability and Size Distribution. In Methods of Soil Analysis; Klute, A., Ed.; Soil Science Society of America: Madison, WI, USA, 1986; pp. 425–442. [Google Scholar]
- Reynolds, W.; Drury, C.F.; Yang, X.; Tan, C. Optimal soil physical quality inferred through structural regression and parameter interactions. Geoderma 2008, 146, 466–474. [Google Scholar] [CrossRef]
- Gomes, F.P. Curso de Estatística Experimental, 12th ed.; Nobel: São Paulo, Brazil, 1990; 467p. [Google Scholar]
- Di Prima, S.; Winiarski, T.; Angulo-Jaramillo, R.; Stewart, R.D.; Castellini, M.; Najm, M.R.A.; Ventrella, D.; Pirastru, M.; Giadrossich, F.; Capello, G.; et al. Detecting infiltrated water and preferential flow pathways through time-lapse ground-penetrating radar surveys. Sci. Total Environ. 2020, 726, 138511. [Google Scholar] [CrossRef] [PubMed]
- Soil Science Division Staff. Soil Survey Manual. In USDA Handbook 18; Ditzler, C., Scheffe, K., Monger, H.C., Eds.; Government Printing Office: Washington, DC, USA, 2017. [Google Scholar]
- Tormena, C.A.; Barbosa, M.C.; Da Costa, A.C.S.; Gonçalves, A.C.A. Densidade, porosidade e resistência à penetração em Latossolo cultivado sob diferentes sistemas de preparo do solo. Sci. Agric. 2002, 59, 795–801. [Google Scholar] [CrossRef] [Green Version]
- Taylor, H.M.; Roberson, G.M.; Parker, J.J. Soil strength-root penetration relations for medium-to coarse-textured soil materials. Soil Sci. 1966, 102, 18–22. [Google Scholar] [CrossRef]
- Taylor, H.M. Effects of soil strength on seedling emergence, root growth and crop yields. In Compaction of Agricultural Soils; Barnes, K.K., Ed.; ASAE: St. Joseph, MI, USA, 1971; pp. 292–304. [Google Scholar]
- Júnior, M.M.; Melo, W.J. Carbono, carbono da biomassa microbiana e atividade enzimática em um solo sob mata natural, pastagem e cultura do algodoeiro. Revista Brasileira Ciência Solo 1999, 23, 257–263. [Google Scholar] [CrossRef]
- Salemi, L.F.; Groppo, J.D.; Trevisan, R.; De Moraes, J.M.; Ferraz, S.F.; Villani, J.P.; Duarte-Neto, P.J.; Martinelli, L. Land-use change in the Atlantic rainforest region: Consequences for the hydrology of small catchments. J. Hydrol. 2013, 499, 100–109. [Google Scholar] [CrossRef]
- Scheffler, R.; Neill, C.; Krusche, A.; Elsenbeer, H. Soil hydraulic response to land-use change associated with the recent soybean expansion at the Amazon agricultural frontier. Agric. Ecosyst. Environ. 2011, 144, 281–289. [Google Scholar] [CrossRef] [Green Version]
- Biggs, T.; Dunne, T.; Muraoka, T. Transport of water, solutes and nutrients from a pasture hillslope, southwestern Brazilian Amazon. Hydrol. Process. 2006, 20, 2527–2547. [Google Scholar] [CrossRef]
- Chaves, J.; Neill, C.; Germer, S.; Neto, S.G.; Krusche, A.; Elsenbeer, H. Land management impacts on runoff sources in small Amazon watersheds. Hydrol. Process. 2008, 22, 1766–1775. [Google Scholar] [CrossRef]
- Zimmermann, B.; Elsenbeer, H.; De Moraes, J.M. The influence of land-use changes on soil hydraulic properties: Implications for runoff generation. For. Ecol. Manag. 2006, 222, 29–38. [Google Scholar] [CrossRef]
- Germer, S.; Neill, C.; Krusche, A.; Elsenbeer, H. Influence of land-use change on near-surface hydrological processes: Undisturbed forest to pasture. J. Hydrol. 2010, 380, 473–480. [Google Scholar] [CrossRef]
- Satiro, L.S.; Cherubin, M.R.; Safanelli, J.L.; Lisboa, I.P.; Da Rocha Junior, P.R.; Cerri, C.E.P.; Cerri, C.C. Sugarcane straw removal effects on Ultisols and Oxisols in south-central Brazil. Geoderma Reg. 2017, 11, 86–95. [Google Scholar] [CrossRef]
- Topp, G.C.; Reynolds, W.D.; Cook, F.J.; Kirby, J.M.; Carter, M.R. Physical attributes of soil quality. Soil quality for crop production and ecosystem health. In Development in Soil Science; Gregorich, E.G., Carter, M.R., Eds.; Elsevier: New York, NY, USA, 1997; Volume 25, pp. 21–58. [Google Scholar] [CrossRef]
- Six, J.; Conant, R.T.; Paul, E.A.; Paustian, K. Stabilization mechanisms of soil organic matter: Implications for C-saturation of soils. Plant Soil 2002, 241, 155–176. [Google Scholar] [CrossRef]
- Filho, C.C.; Muzilli, O.; Podanoschi, A.L. Estabilidade dos agregados e sua relação com o teor de carbono orgânico num Latossolo Roxo distrófico, em função de sistemas de plantio, rotações de culturas e métodos de preparo das amostras. Revista Brasileira Ciência Solo 1998, 22, 527–538. [Google Scholar] [CrossRef] [Green Version]
- Bronick, C.; Lal, R. Soil structure and management: A review. Geoderma 2005, 124, 3–22. [Google Scholar] [CrossRef]
- Salton, J.C.; Mielniczuk, J.; Bayer, C.; Boeni, M.; Conceição, P.C.; Fabrício, A.C.; Macedo, M.C.M.; Broch, D.L. Agregação e estabilidade de agregados do solo em sistemas agropecuários em Mato Grosso do Sul. Revista Brasileira Ciência Solo 2008, 32, 11–21. [Google Scholar] [CrossRef]
- An, S.; Mentler, A.; Mayer, H.; Blum, W.E. Soil aggregation, aggregate stability, organic carbon and nitrogen in different soil aggregate fractions under forest and shrub vegetation on the Loess Plateau, China. Catena 2010, 81, 226–233. [Google Scholar] [CrossRef]
- Vezzani, F.M. Qualidade do Sistema Solo na Produção Agrícola. 184 f. 2001. Tese de Doutorado. Tese (Doutorado em Ciência do Solo); Universidade Federal do Rio Grande do Sul: Porto Alegre, Brazil, 2001. [Google Scholar]
- Allaire, S.E.; Roulier, S.; Cessna, A.J. Quantifying preferential flow in soils: A review of different techniques. J. Hydrol. 2009, 378, 179–204. [Google Scholar] [CrossRef]
- Deuchars, S.; Townend, J.; Aitkenhead, M.J.; Fitzpatrick, E. Changes in soil structure and hydraulic properties in regenerating rain forest. Soil Use Manag. 2006, 15, 183–187. [Google Scholar] [CrossRef]
- Hassler, S.K.; Zimmermann, B.; Van Breugel, M.; Hall, J.S.; Elsenbeer, H. Recovery of saturated hydraulic conductivity under secondary succession on former pasture in the humid tropics. For. Ecol. Manag. 2011, 261, 1634–1642. [Google Scholar] [CrossRef]
- Doerr, S.H.; Ritsema, C.J.; Dekker, L.W.; Scott, D.F.; Carter, D. Water repellence of soils: New insights and emerging research needs. Hydrol. Process. 2007, 21, 2223–2228. [Google Scholar] [CrossRef]
- Cooper, M.; Medeiros, J.C.; Rosa, J.D.; Soria, J.E.; Toma, R.S. Soil functioning in a toposequence under rainforest in São Paulo, Brazil. Revista Brasileira Ciência Solo 2013, 37, 392–399. [Google Scholar] [CrossRef] [Green Version]
- Hillel, D. Soil structure and aggregation. In Introduction to Soil Physics; Academic Press: London, UK, 1980; pp. 40–52, 200–204. [Google Scholar]
- Muñoz-Villers, L.E.; Holwerda, F.; Alvarado-Barrientos, M.S.; Geissert, D.; Marín-Castro, B.; Gómez-Tagle, A.; McDonnell, J.J.; Asbjornsen, H.; Dawson, T.; Bruijnzeel, L.A. Efectos hidrológicos de la conversión del bosque de niebla en el centro de Veracruz, México. Bosque 2015, 36, 395–407. [Google Scholar] [CrossRef] [Green Version]


| Study Area | Clay (%) | Silt (%) | Sand (%) | ρs g cm−3 | Textural Classes | Soil Classification |
|---|---|---|---|---|---|---|
| P | 18 | 4 | 78 | 2.63 | Sandy loam | Oxisols |
| SC | 19 | 5 | 76 | 2.66 | Sandy loam | Oxisols |
| NR18 | 11 | 6 | 83 | 2.67 | Loamy sand | Oxisols |
| NR42 | 14 | 15 | 71 | 2.64 | Sandy loam | Ultisols |
| DFF | 11 | 13 | 76 | 2.65 | Sandy loam | Oxisols |
| Land Uses | ||||||
|---|---|---|---|---|---|---|
| Attributes | Statistic | P | SC | NR18 | NR42 | DFF |
| BD | Mean | 1.51 a | 1.53 a | 1.47 a | 1.48 a | 1.39 a |
| CV | 2.98 | 4.46 | 4.40 | 9.54 | 5.97 | |
| Tp | Mean | 0.42 a | 0.42 a | 0.44 a | 0.45 a | 0.47 a |
| CV | 3.51 | 6.20 | 5.07 | 10.35 | 6.61 | |
| Mac | Mean | 0.13 a | 0.16 a | 0.13 a | 0.16 a | 0.18 a |
| CV | 19.16 | 14.39 | 12.98 | 17.00 | 23.28 | |
| Mic | Mean | 0.29 ab | 0.25 b | 0.30 a | 0.28 ab | 0.29 ab |
| CV | 6.30 | 6.21 | 5.26 | 17.55 | 5.37 | |
| PR | Mean | 2.64 a | 1.60 a | 0.83 b | 0.66 b | 0.68 b |
| CV | 23.92 | 32.37 | 38.30 | 33.53 | 16.95 | |
| MWD | Mean | 0.99 bc | 0.76 c | 0.75 c | 1.34 ab | 1.68 a |
| CV | 2.98 | 16.17 | 12.86 | 6.84 | 11.06 | |
| OC | Mean | 14.00 a | 7.33 c | 8.66 bc | 11.33 ab | 9.33 bc |
| CV | 14.28 | 15.74 | 13.32 | 10.18 | 16.36 | |
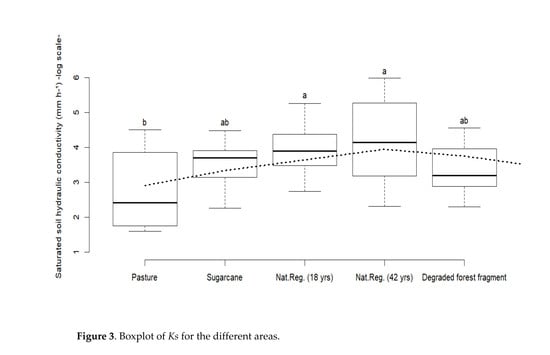
| Ks | Mean | 28.46 b | 39.93 ab | 70.30 a | 124.22 a | 36.28 ab |
| CV | 104.89 | 59.60 | 80.50 | 115.08 | 73.28 | |
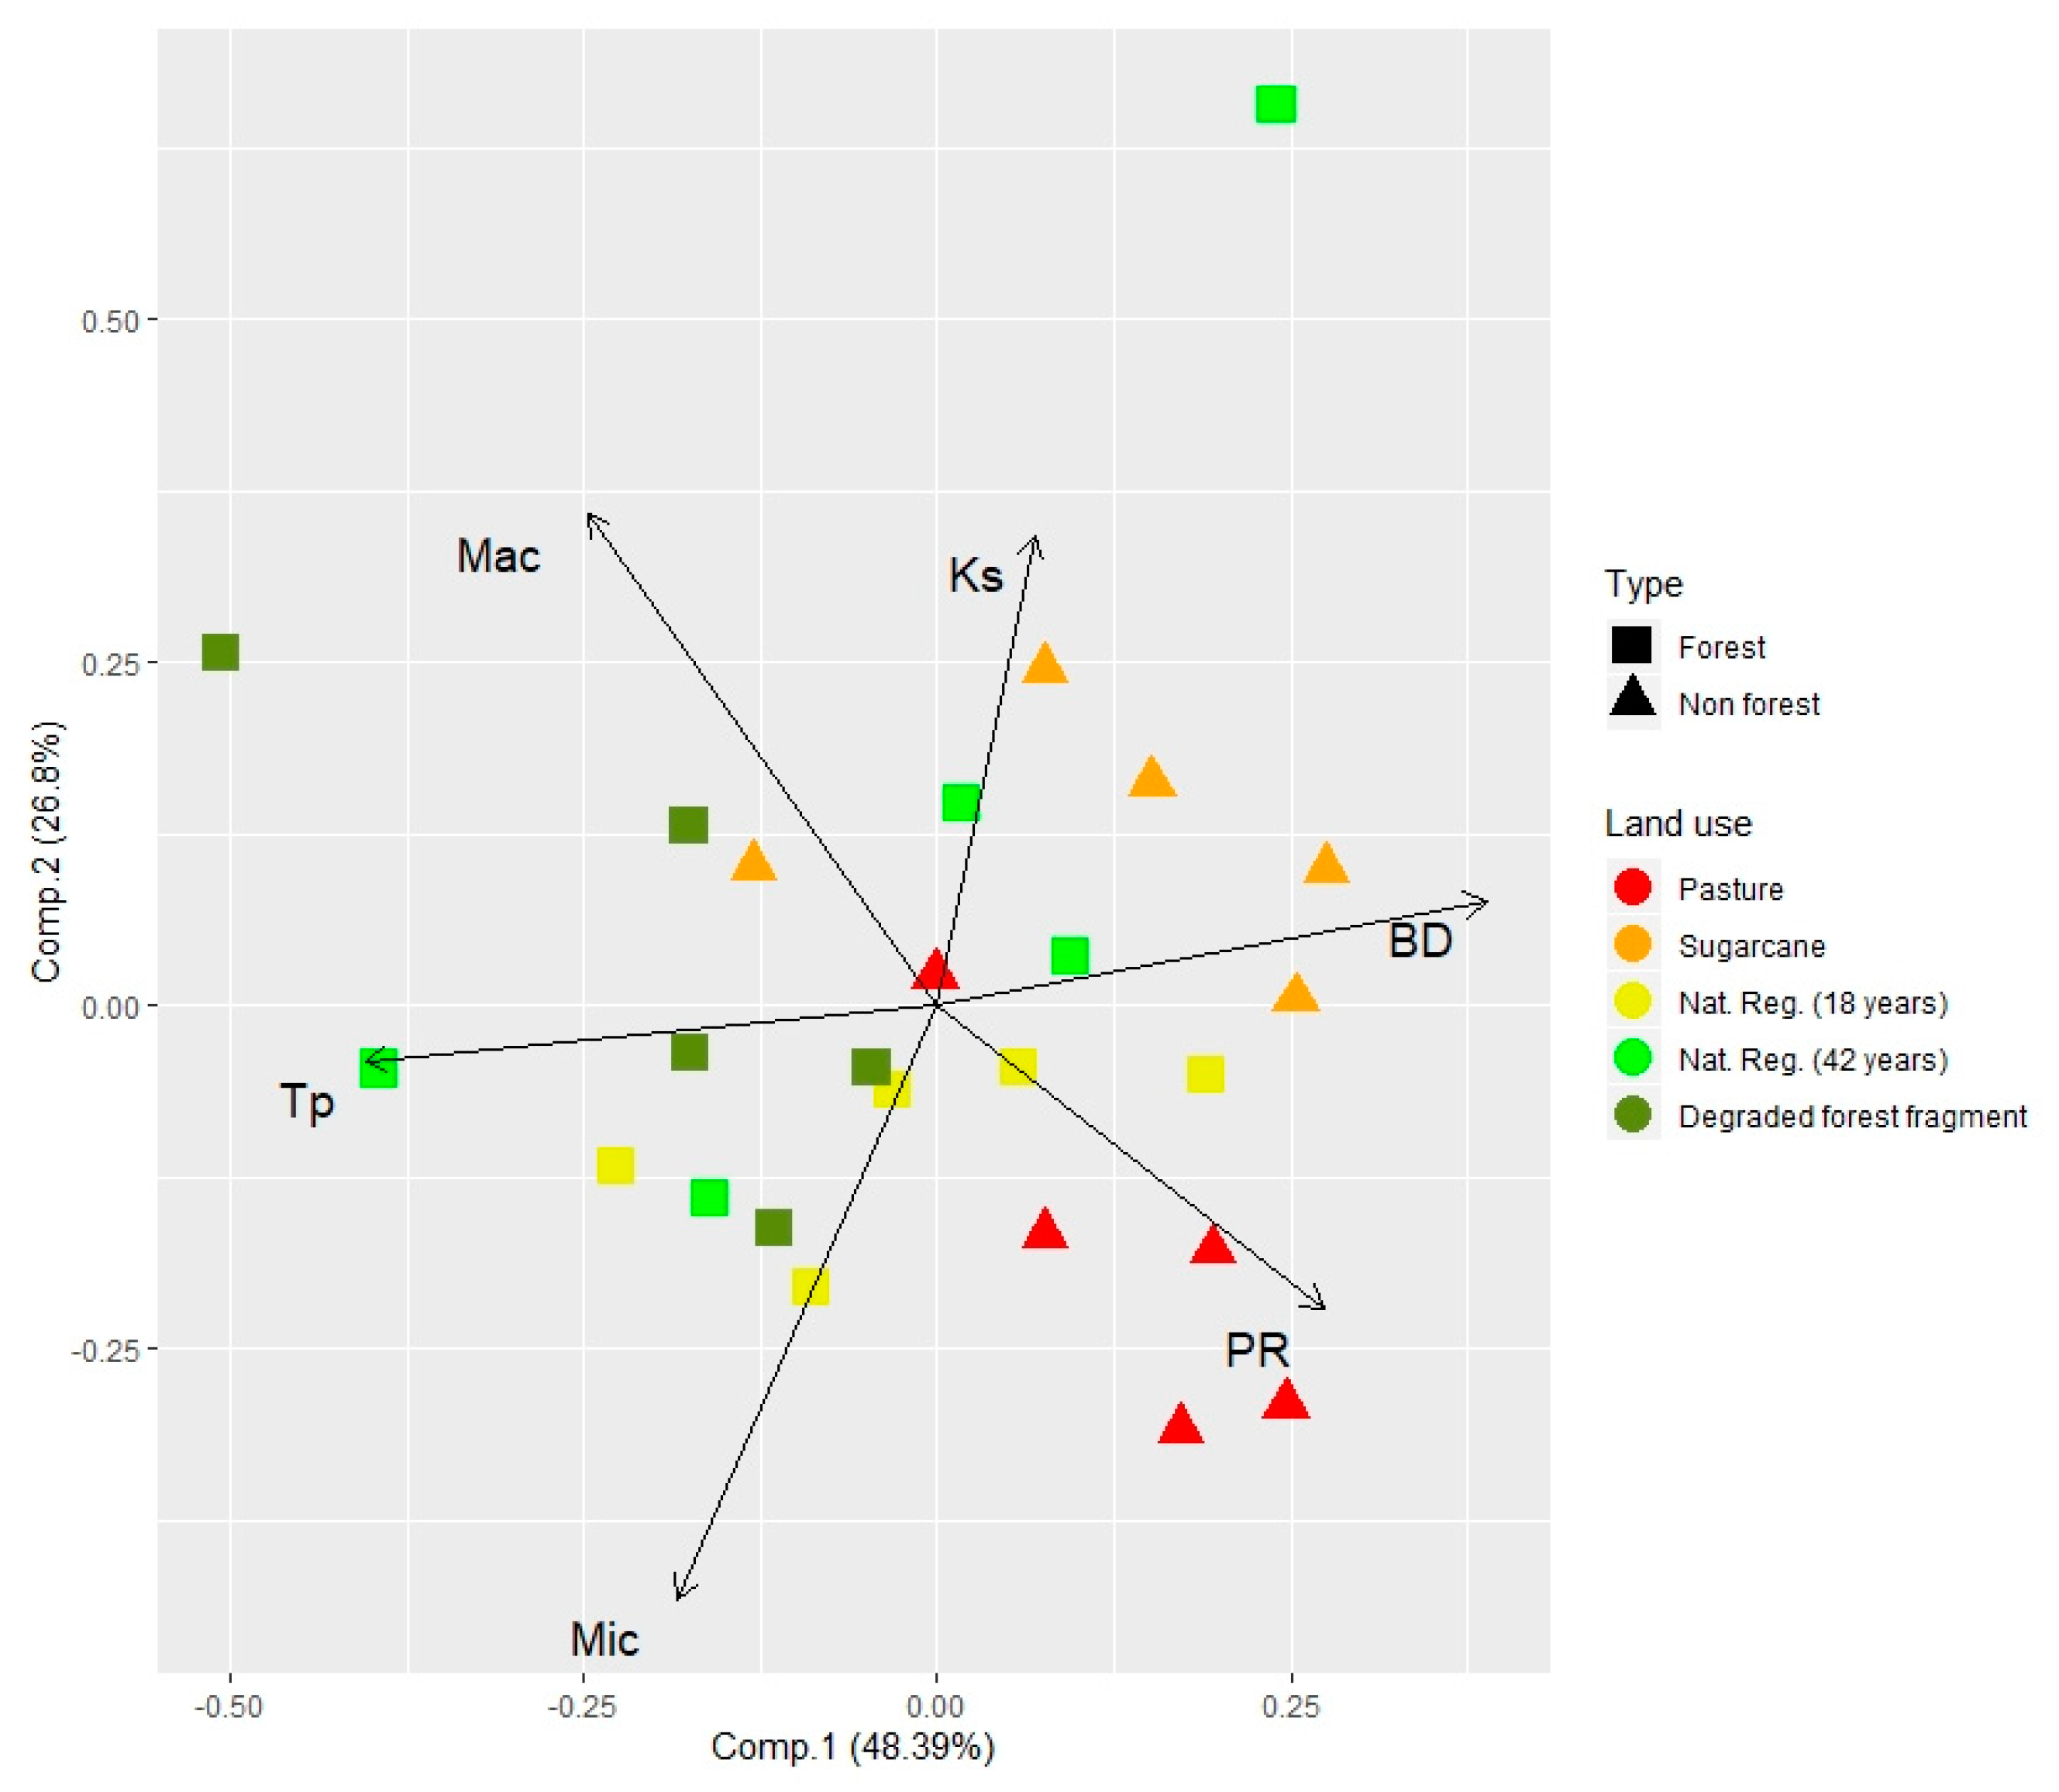
| Variables | Component 1 | Component 2 |
|---|---|---|
| Ks | 0.49 | |
| BD | 0.556 | 0.109 |
| Tp | −0.578 | |
| Mac | −0.353 | 0.512 |
| Mic | −0.262 | −0.618 |
| PR | 0.391 | −0.316 |
© 2020 by the authors. Licensee MDPI, Basel, Switzerland. This article is an open access article distributed under the terms and conditions of the Creative Commons Attribution (CC BY) license (http://creativecommons.org/licenses/by/4.0/).
Share and Cite
Pereira, N.A.; Di Prima, S.; Bovi, R.C.; da Silva, L.F.S.; de Godoy, G.; Naves, R.P.; Cooper, M. Does the Process of Passive Forest Restoration Affect the Hydrophysical Attributes of the Soil Superficial Horizon? Water 2020, 12, 1689. https://doi.org/10.3390/w12061689
Pereira NA, Di Prima S, Bovi RC, da Silva LFS, de Godoy G, Naves RP, Cooper M. Does the Process of Passive Forest Restoration Affect the Hydrophysical Attributes of the Soil Superficial Horizon? Water. 2020; 12(6):1689. https://doi.org/10.3390/w12061689
Chicago/Turabian StylePereira, Nayana Alves, Simone Di Prima, Renata Cristina Bovi, Laura Fernanda Simões da Silva, Gustavo de Godoy, Rafaela Pereira Naves, and Miguel Cooper. 2020. "Does the Process of Passive Forest Restoration Affect the Hydrophysical Attributes of the Soil Superficial Horizon?" Water 12, no. 6: 1689. https://doi.org/10.3390/w12061689
APA StylePereira, N. A., Di Prima, S., Bovi, R. C., da Silva, L. F. S., de Godoy, G., Naves, R. P., & Cooper, M. (2020). Does the Process of Passive Forest Restoration Affect the Hydrophysical Attributes of the Soil Superficial Horizon? Water, 12(6), 1689. https://doi.org/10.3390/w12061689