1. Introduction
Phenol is one of the most widespread industrial wastewater contaminants. It normally exists in high concentrations in the effluent of various industrial sectors, including the chemical, petrochemical and pharmaceutical industry, refineries and oil field activities, coal processing, and olive oil production [
1]. Because of its high toxicity, it is defined as a priority pollutant. Various techniques have been developed for its removal from the effluents [
2], including (i) classical separation techniques (e.g., distillation, liquid–liquid extraction, adsorption, membrane separation) [
3,
4], (ii) biochemical treatments (aerobic and anaerobic) [
5], and (iii) advanced oxidation processes (e.g., wet air oxidation, ozonation, peroxide wet oxidation, electrochemical and photocatalytic oxidation) [
6,
7,
8,
9]. Apart from its industrial relevance, phenol is frequently described in the literature as a model component to assess the effectiveness of various advanced oxidation processes (AOP) to remove low biodegradable or toxic organic components from wastewater. Using phenol, therefore, enables a comparative evaluation of the treatments reported in different literature sources.
Photocatalysis is currently of high interest for the degradation of non-biodegradable organic components from wastewater and various studies have been dedicated to this process. The physical and chemical mechanisms underlying photocatalysis for pollutant degradation in water were described by Wang et al. [
10]. In short, UV light absorbed by the photocatalyst results in the promotion of electrons to a higher energy band (from the valence band to the conduction band). This instable situation results in the ability to: (i) directly degrade (mostly oxidize) adsorbed organic pollutants (direct photocatalytic degradation); and (ii) generate OH* (hydroxyl) radicals from water molecules, which are, in turn, capable to readily oxidize organic components present in the wastewater (indirect photocatalytic degradation). Both mechanisms contribute to the overall photocatalytic degradation rate. The presence of dissolved oxygen in the water can also potentially promote the efficiency of the photocatalytic process by scavenging the promoted electrons in the conduction band of the semiconductor upon excitation [
11].
Since UV light is required for photocatalysis to occur, the possibility for the direct degradation of organic components by UV (photolysis) is always present in a photocatalytic system. Direct photolysis of phenol by UV was previously studied by Chun et al. [
12]. They concluded that a complete degradation of phenol is feasible in the presence of dissolved oxygen, whereas the degradation efficiency remains limited if no oxygen is present. In the latter case, the complete mineralization of phenol could not be achieved.
Ultrasound (US) was shown to be a promising technology in wastewater treatment [
13,
14,
15,
16]. Low frequency (<1 MHz) US waves cause the so-called cavitation process when submitted to an aqueous medium. The alternating high and low pressures generated by the acoustic waves create bubbles, which grow in time. Once a critical bubble diameter is reached, the bubbles implode, locally generating high temperatures and pressures. These transient, localized hotspots drive high-energetic chemical reactions such as the creation of hydroxyl (OH*) radicals [
17]. Furthermore, organic components encountering these cavitation bubbles can undergo thermal degradation [
18]. In combination with a (photo)catalyst, the application of US results in the following synergistic effects [
19]: part of the jet streams generated during the cavitation bubble implosion are directed towards the catalyst surface, resulting in an intense micromixing and an increased mass transfer of reagents and products towards and from the catalyst surface; cleaning of the catalyst surface by the same jet streams occurs; and deagglomeration of catalyst particles takes place. These particles tend to agglomerate when suspended in an aqueous solution because of Van der Waals forces. US effectively tears apart these agglomerates, resulting in smaller particles and hence an increased surface–volume ratio.
Because of these beneficial properties, various studies were dedicated to describing the effects of a combined US/photocatalysis treatment on different types of wastewater. The combined effect of sonolysis and photocatalysis can considerably promote the production of high reactive-free radicals in the medium [
20,
21]. A short overview of some relevant papers is provided in
Table 1.
The aim of the present research is to study the degradation of phenol in synthetic wastewater using the combination of UV/TiO2, with the main goal being the evaluation of the synergistic effect of US application at 24 kHz. The particle size of the TiO2 will be measured to show the effect on deagglomeration of the particles and to be able to attribute positive effects of US to deagglomeration or enhanced mass transfer to the catalyst surface. An experimental design methodology and surface response methodology are used to evaluate the influence of the initial concentration of phenol, UV intensity, ultrasonic power, TiO2 dosage, and reaction time.
2. Materials and Methods
2.1. Experimental Setup
All experiments were carried out in a 3 L batch reactor with an active volume of 2 L (
Figure 1). An ultrasonic probe generating 24 kHz acoustic waves with a variable power output between 30 and 100 W (Bandelin Sonoplus generator combined with UW 3200 Probe) was placed eccentrically in the reactor. A low-pressure mercury UV lamp (11 W, UV-C lamp with a maximum UV light emission at a wavelength of 254 nm) was placed slightly off-center in the vessel.
TiO2 (crystalline structure: anatase) was obtained from Acros Organics (Geel, Belgium). The diameter, specific surface area and band gap energy of the TiO2 were 100–400 nm, 55 m2/g, and 3.13 eV (UV absorption at 356 nm or lower), respectively. TiO2 was added to the reactor content at successive concentrations of 0.01 g/L, 0.1 g/L, 0.5 g/L, and 1 g/L. Samples of 2 mL were taken after 0, 10, 20, 30, 45, and 60 min reaction time. When TiO2 was used, the samples were filtered through cellulose filters (0.1 μm), prior to analysis. Cooling water was continuously circulated around the reactor, to avoid a temperature increase caused by energy dissipation of the US waves and UV lamp. The temperature was hence kept constant at 20 °C (±1 °C). The particle size distribution of the TiO2 photocatalyst particles was determined using a Malvern Mastersizer 2000 laser diffraction particle size analyzer.
The water used in the experiments consisted of demineralized water (pH = 5.8), in which 5–10 ppm phenol (Acros Organics, Geel, Belgium) was dissolved. Because the main aim of this paper was to identify the determining mechanisms underlying the photocatalytic phenol degradation, the aqueous solution was kept as simple as possible, i.e., no organics were added as matrix components to simulate a real wastewater. In some tests, however, t-butanol (Acros Organics, Geel, Belgium) was added as a radical scavenger. All reagents were of analytical grade and used as purchased.
2.2. Methods of Analysis
Phenol concentration was analyzed using a DIONEX HPLC, using water/methanol (68/32 → 20/80) as eluent at a flow rate of 1 mL/min, a C18 column (Grace 4.6 ID X 250 mm), and a UV detector set at a wavelength of 270 nm. The volume of the injected sample was 20 μL.
The UV absorbance of the reaction mixtures (including the suspended TiO2 was measured in a Hach Lange UV-Vis spectrometer at a wavelength of 254 nm. Using the obtained values, the evolution of UV light intensity (I) in the reactor as a function of the distance R to the UV lamp was calculated using a linear relation as suggested by the Lambert–Beer Law.
2.3. Kinetic Analysis
The removal of phenol from the aqueous phase is achieved by a combination of three different mechanisms, i.e., adsorption, chemical oxidation by the generated radicals, and direct photolysis. This combination results in the following kinetic Equation (1):
where
Cphenol is the concentration of phenol at time
t;
k1 is the reaction rate constant for the reaction occurring at the surface;
k2 is the reaction rate constant for the reaction between
OH* radicals and phenol;
k3 is the reaction rate constant for direct photolysis; and
COH is the concentration of
OH* radicals in the aqueous medium and
KA the adsorption rate constant.
As shown in the results section, the experimental results showed that pure adsorption phenomena could be neglected, and, therefore, the first term in the equation is assumed to be zero. Moreover, because the radical concentration can be assumed to be constant (continuous creation at the catalyst surface by a constant UV intensity), an apparent reaction rate constant k′ can be defined, with
k′ =
k2COH +
k3. The equation then translates into Equation (2):
This means that the photocatalytic degradation of phenol follows apparent first order kinetics. The apparent reaction rate constant
k′ was graphically determined by plotting
ln(
Cphenol/
Cphenol,0) versus time. The slope of the linear curve obtained equals
k′, following Equation (3):
The experimental data were fitted by linear regression, using a partial least squares routine.
2.4. Experimental Design and Statistical Analysis
The obtained experimental results were used to: (i) identify and quantify the importance of different operating parameters, and (ii) develop an empirical model to predict phenol degradation as function of several variables. The variables considered for this study were: initial phenol concentration, reaction time, power of the acoustic field, and TiO
2 concentration. The response variable was the phenol concentration relative to the initial phenol concentration. The design matrix of the experimental design is provided in
Table 2. A linear regression model was obtained using partial least squares regression.
3. Results
3.1. Influence of TiO2 Concentration
The influence of the TiO
2 catalyst concentration on the phenol degradation reaction kinetics was first investigated without the application of US. The decrease in phenol concentration C as a function of time (expressed as C/C
0) is depicted in
Figure 2.
It was observed that a significant phenol degradation occurred via direct photolysis (i.e., without the presence of the photocatalyst). After 60 min reaction time, only 51% of the initial phenol concentration remained (values indicated in
Table 2). This observation is in accordance with the findings of Chun et al. [
12], who already pointed out that direct photolysis is able to degrade phenol in wastewater.
The addition of suspended TiO2 photocatalyst to the reactor enhanced the degradation efficiency, but only at low TiO2 concentrations. At TiO2 concentrations 0.01 g/L and 0.1 g/L, 42.7% and 33.0% of phenol remained after 1 h reaction time, respectively. However, at higher TiO2 concentrations, a considerable decrease in degradation efficiency took place, even to a lower level than direct photolysis (without TiO2). For TiO2 concentrations of 0.5 g/L and 1 g/L, the remaining fraction of phenol after 1 h reaction time was as high as 62.3% and 68.0%, respectively.
The same trend was (as expected) noticed in the reaction kinetics. In
Figure 2b ln(C/Co) was plotted versus time. The linear trends that were obtained (high
R2 values for a linear fit of the data points) suggest that first order reaction kinetics governed the degradation reactions for all TiO
2 concentrations. The reaction rate constant k’ of each reaction was calculated as the slope of the lines and their values are included in
Table 2. Here again, an increase in k’ was observed for increasing TiO
2 concentration up to 0.1 g/L, followed by a decrease at higher concentrations.
An explanation for the observed influence should be sought in the effective illumination of the photocatalyst in the reactor. The observed reaction kinetics are indeed governed by two aspects: (i) the actual TiO2 mass (and hence its surface area) available in the reactor, expressed in this study in terms of concentration; and (ii) the effective illumination of the catalyst surface by the UV light. At higher suspended TiO2 concentrations, more surface area is available in the reactor, but the particles will induce shielding and dispersion of the UV light, hence the reactor volume is only partially illuminated.
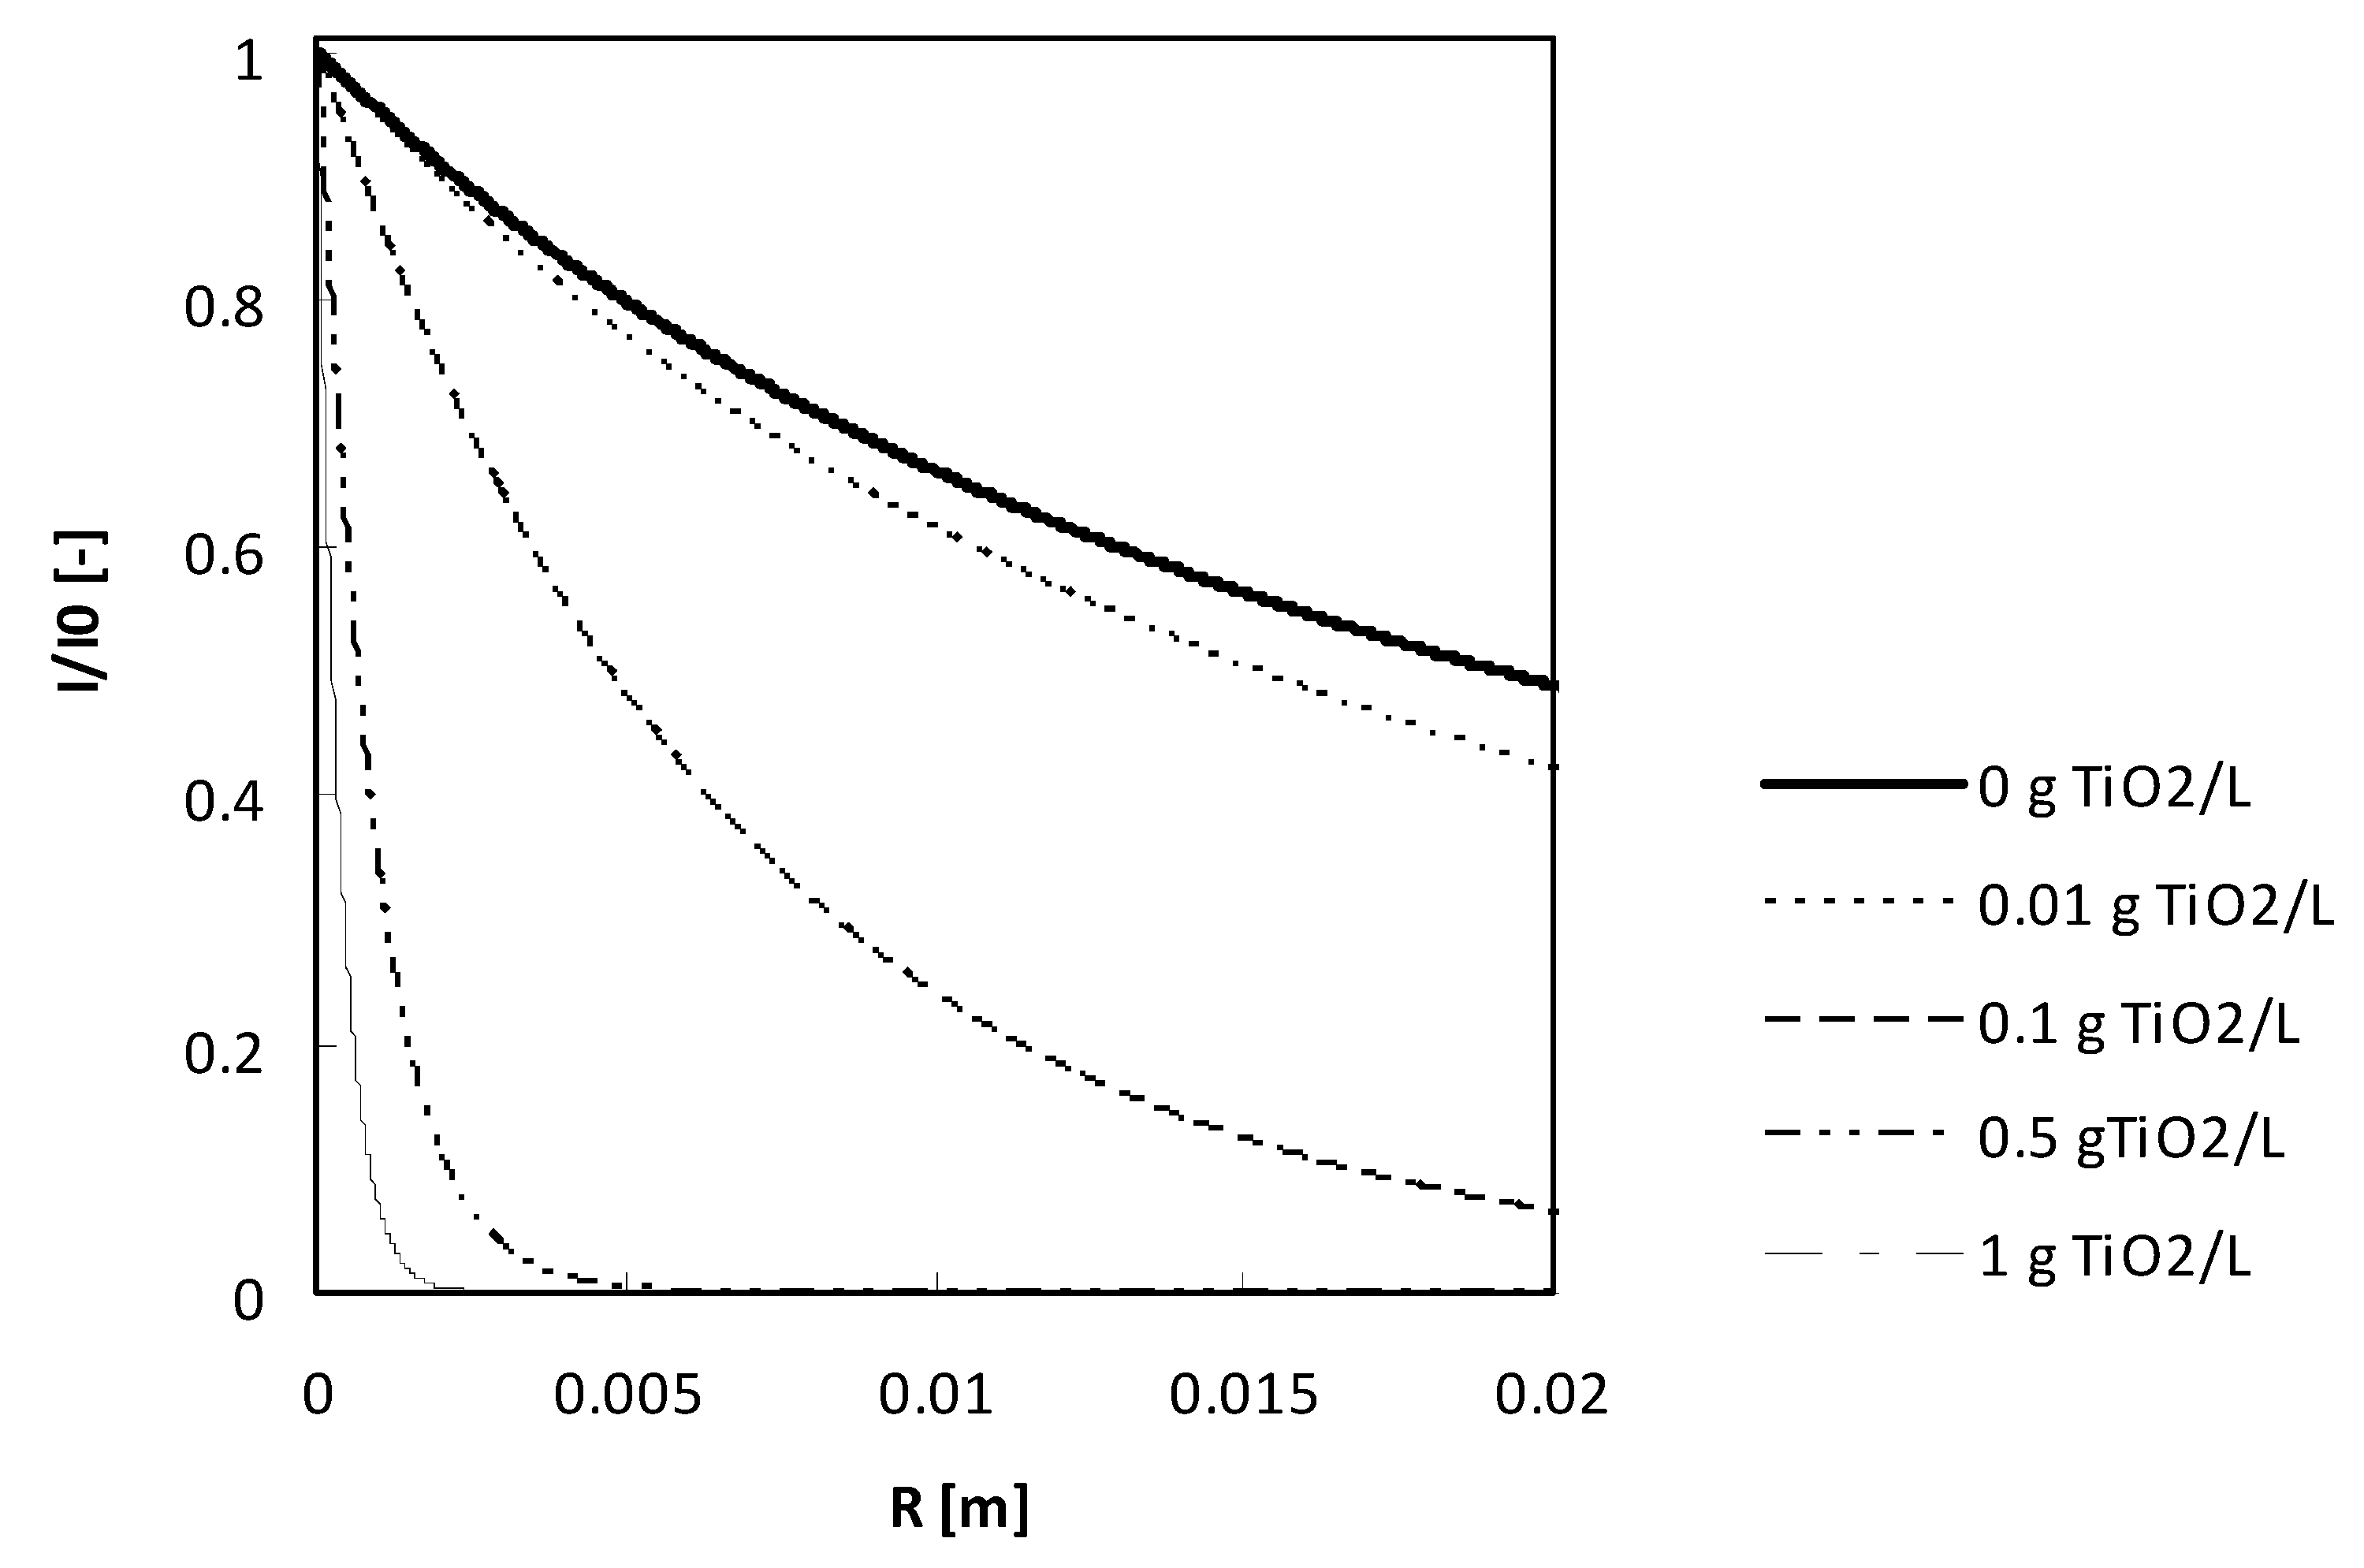
To quantify this phenomenon, the UV intensity in the reactor was measured as a function of the distance to the UV lamp for the different TiO
2 concentrations applied in this study. The results are depicted in
Figure 3. From this figure, it becomes clear that for the two highest TiO
2 concentrations, (0.5 g/L and 1 g/L) the UV intensity dropped very fast, and only a very small volume in the reactor was illuminated. From these data, the mass of TiO
2 receiving at least 50% of the initial UV intensity was calculated and is depicted in
Figure 4. Here again, the maximum was observed for 0.1 g TiO
2/L, which closely correlates with the results of reaction kinetic constants.
The importance of an effective illumination is further illustrated by the fact that when the UV lamp was switched off, no significant degradation of phenol occurred (see assay 24 in
Table 2). The limited penetration depth of the UV light at high TiO
2 concentrations hence resulted in a large reduction of the effective volume in the reactor where the reactions take place (direct photolysis and catalytic degradation), leading to lower overall degradation kinetics (calculated on the total reactor volume).
3.2. Influence of Ultrasound Application
The application of US on the photocatalytic system can enhance the photocatalytic degradation of phenol because of three distinct effects: (i) deagglomeration of the catalyst, leading to smaller TiO2 particles and hence a higher specific surface on which the reaction (either generation of OH* radicals or direct photocatalytic degradation of phenol) can take place; (ii) the improvement of mass transfer from and to the catalytically active surface; and (iii) the cleaning of the catalytic surface. The latter effect will only play an important role in the long-term (when the catalyst surface effectively becomes polluted) or for “dirty” wastewater containing a lot of only partially soluble organic material, and will certainly not have any influence on the phenol degradation in the lab scale system applied in the current study. Both of the other effects, however, do have a potential influence on the reaction rates observed in the applied model system. In this section, the relative influence of each effect will be determined.
The effects of the US treatment for the different reaction conditions are included in
Table 2. As an example,
Figure 5 illustrates the differences in phenol degradation as a function of US power input for a TiO
2 concentration of 0.1 g/L. It was seen that the remaining phenol concentration after 60 min reaction time decreased from 32% of its initial value in the absence of US to 26.0% and 11.3% of the initial value at an US power of 50 W and 100 W, respectively. As in
Section 3.1, an evaluation of the reaction kinetics was carried out. Again, it was seen that the reactions all follow first order reaction kinetics. The values for the reaction rate constants k’ are reported in
Table 1. In analogy with the improvement of phenol degradation, the reaction rate constants increased with increasing US power.
Since the sole application of US did not result in a significant phenol degradation (see assays 24 and 25 in
Table 2), it is clear that the observed improvements were due to an enhancement of the photocatalytic reaction. An influence of the US application on the direct photolysis is excluded as photolysis directly takes place by the interaction of UV photons with phenol molecules in the liquid phase, which is not governed by any mass transfer limitations.
To elucidate the mechanism underlying the observed improvement, the effects of US application on TiO
2 deagglomeration were first studied by measuring the particle size distribution before and after the US treatment. The results are depicted in
Figure 6. It was observed that the US treatment resulted in a significant decrease in the average particle size. Specifically, a large fraction of particles with a diameter between 0.1 and 0.8 µm were generated. A bimodal distribution occurred. Also, reagglomeration of the particles did not occur within 1 h after the US treatment was stopped, since no significant change in the particle size distribution was found. This observation confirms the validity of the hypothesis that a deagglomeration of the photocatalyst takes place. Additionally, since no reagglomeration occurred after US treatment, this provides the opportunity to decouple deagglomeration and improve mass transfer as causes for the improvement in phenol degradation rate by US treatment.
To assess whether the observed improvement was mainly due to deagglomeration of the photocatalyst particles or due to an enhancement of the mass transfer, the following experimental plan consisting of three experimental runs was set up. In run 1, a typical photocatalytic degradation experiment was performed (0.1 g/L TiO2, 11 W UV) without application of US. In run 2, the same conditions were kept, but a US power of 30 W was applied during the experiment. In run 3, the TiO2 photocatalyst was first subjected to 30 W US power during 1 h. Then the US was switched off and the UV lamp switched on to start the reactions with phenol. In run 2, the effect of the US treatment could be both due to deagglomeration and enhanced mass transfer, whereas in run 3, the US application could only have an effect due to deagglomeration of the TiO2.
The results of the three experimental runs are depicted in
Figure 7. No significant differences were observed between the results of run 1 and run 3. This means that the photocatalyst deagglomeration did not have a significant effect on the photocatalytic phenol degradation. Run 2 on the other hand showed a considerable increase in reaction rate. Since no differences in particle size distribution of the TiO
2 were present between run 2 and run 3, it should be concluded that this increase is due to an increase in the mass transfer rate.
3.3. Nature of the Photocatalytic Reaction
The TiO2/UV photocatalytic degradation of phenol may be caused by two different reaction mechanisms: (i) a direct oxidation of phenol at the photocatalyst surface, or (ii) an indirect oxidation by OH* radicals, which are generated at the photocatalyst surface. The reaction between OH* and phenol can take place all over the reactor volume and not necessarily at the photocatalyst surface.
To investigate which mechanism is taking place, t-butanol was added to the solution before reaction (at a concentration of 1 g/L). This is a high concentration compared to the concentration of phenol. t-butanol is generally known to be a radical scavenger and will react much faster with the OH* radicals than phenol, hence significantly reducing the apparent reaction rates of phenol with OH*. The results of phenol degradation tests by (a) direct photolysis, (b) photocatalytic degradation without US, and (c) photocatalytic degradation with US are depicted in
Figure 8. All tests were carried out with and without the addition of t-butanol, and the phenol degradation between both was compared. The calculated first order reaction rate constants are presented in
Table 3.
The presence of t-butanol did not affect the phenol degradation rate for direct photolysis, i.e., in absence of photocatalyst. The degradation curves in
Figure 8a did not differ significantly and the reaction rate constants were very similar. This is, however, no longer the case for both photocatalytic systems, with and without US application. Here, a significant decrease in the apparent reaction rate was observed in the presence of t-butanol (
Figure 8b,c). The first order reaction rate constant k’ decreased from 0.019 s
−1 to 0.0044 s
−1 for the UV/TiO
2 system and from 0.022 s
−1 to 0.0047 s
−1 for the UV/TiO
2/US system. This observation leads to the conclusion that the photocatalytic degradation of phenol mainly takes place by means of OH* radicals. Since the reaction rates were still higher than for UV application solely (direct photolysis), some direct photocatalytic degradation is taking place at the catalyst surface. The exact location of the reaction (directly at the photocatalyst surface or in the bulk of the liquid) cannot be determined based on these kinetic experiments, as was already pointed out by Malato et al. [
11]. Basically, this is due to the fact that the Langmuir–Hinshelwood equation resembles too much to the (pseudo) first order equation for radical oxidation in the bulk solution.
3.4. Multivariate Statistical Analysis
The obtained experimental results are further used to identify the most important parameters and to develop a surface response model to predict the decrease in phenol concentration as a function of time. The calculations are based on the experimental data reported in
Table 2. In
Figure 9, the main effect plots (data means) are depicted, representing the influence of each variable on the phenol degradation. This mathematical assessment confirms the observations and conclusions previously presented in this manuscript. The relative importance of the studied parameters was assessed in a Pareto chart, depicted in
Figure 10. Next to the individual parameters, interaction parameters were included in the analysis. It is observed that the US most significantly influenced the phenol degradation, followed by the reaction time. A 95% significance level was chosen for the analysis. The analysis leads to the model expressed in Equation (4).
In this equation,
A,
B,
C, and
D stand for time, initial phenol concentration, ultrasound effects, and TiO
2 dosage, respectively. The effectiveness of the model is shown in
Figure 11. As indicated in this figure, the model provided the best results at low phenol conversion (
C/
Co large), whereas it tended to overestimate the degradation at high phenol conversion (
C/
Co small).
4. Conclusions
In this work, the photocatalytic degradation of phenol by TiO2 photocatalysis was assessed, and the influence of US treatment evaluated. An optimal concentration of photocatalyst dosage was shown. The degradation rate when 0.1 g/L was applied, was twice as high compared to when 1 g/L was applied. The reason for this higher reaction rate, is the influence of the mass that receives sufficient UV light. If the concentration of catalyst is too high, the light intensity decreases very fast, compared to when less catalyst is used.
When a low frequency acoustic field was applied, the degradation rate increased with increasing power. This faster degradation was only visible when the acoustic field was applied at the same time as when the UV light was used. When the catalyst was pre-treated with US, and then used for photo-catalysis, the degradation rate was the same compared to when no US was applied to pre-treat the photocatalyst. US treatment was able to effectively increase the phenol degradation rate, due to an improvement of mass transfer while particle deagglomeration did not play a significant role. The photocatalytic degradation mainly occurred through indirect phenol oxidation by OH* radicals, which were formed in situ at the surface of the photocatalyst. The experiments involving the application of t-butanol, as a hydroxyl radical scavenger, confirmed that a combination of three different mechanisms, i.e., adsorption, chemical oxidation by the generated radicals, and direct photolysis, are responsible for the phenol removal.
In the final part of the research, a mathematical model of phenol degradation was developed. The model was based on the partial least squares (PLS) methodology. The model provides the best results at low phenol conversion (C/Co large), whereas it tends to overestimate the degradation at high phenol conversion (C/Co small).


