Mapping the Daily Rainfall over an Ungauged Tropical Micro-Watershed: A Downscaling Algorithm Using GPM Data

 and
and
Abstract
1. Introduction
2. Materials and Method
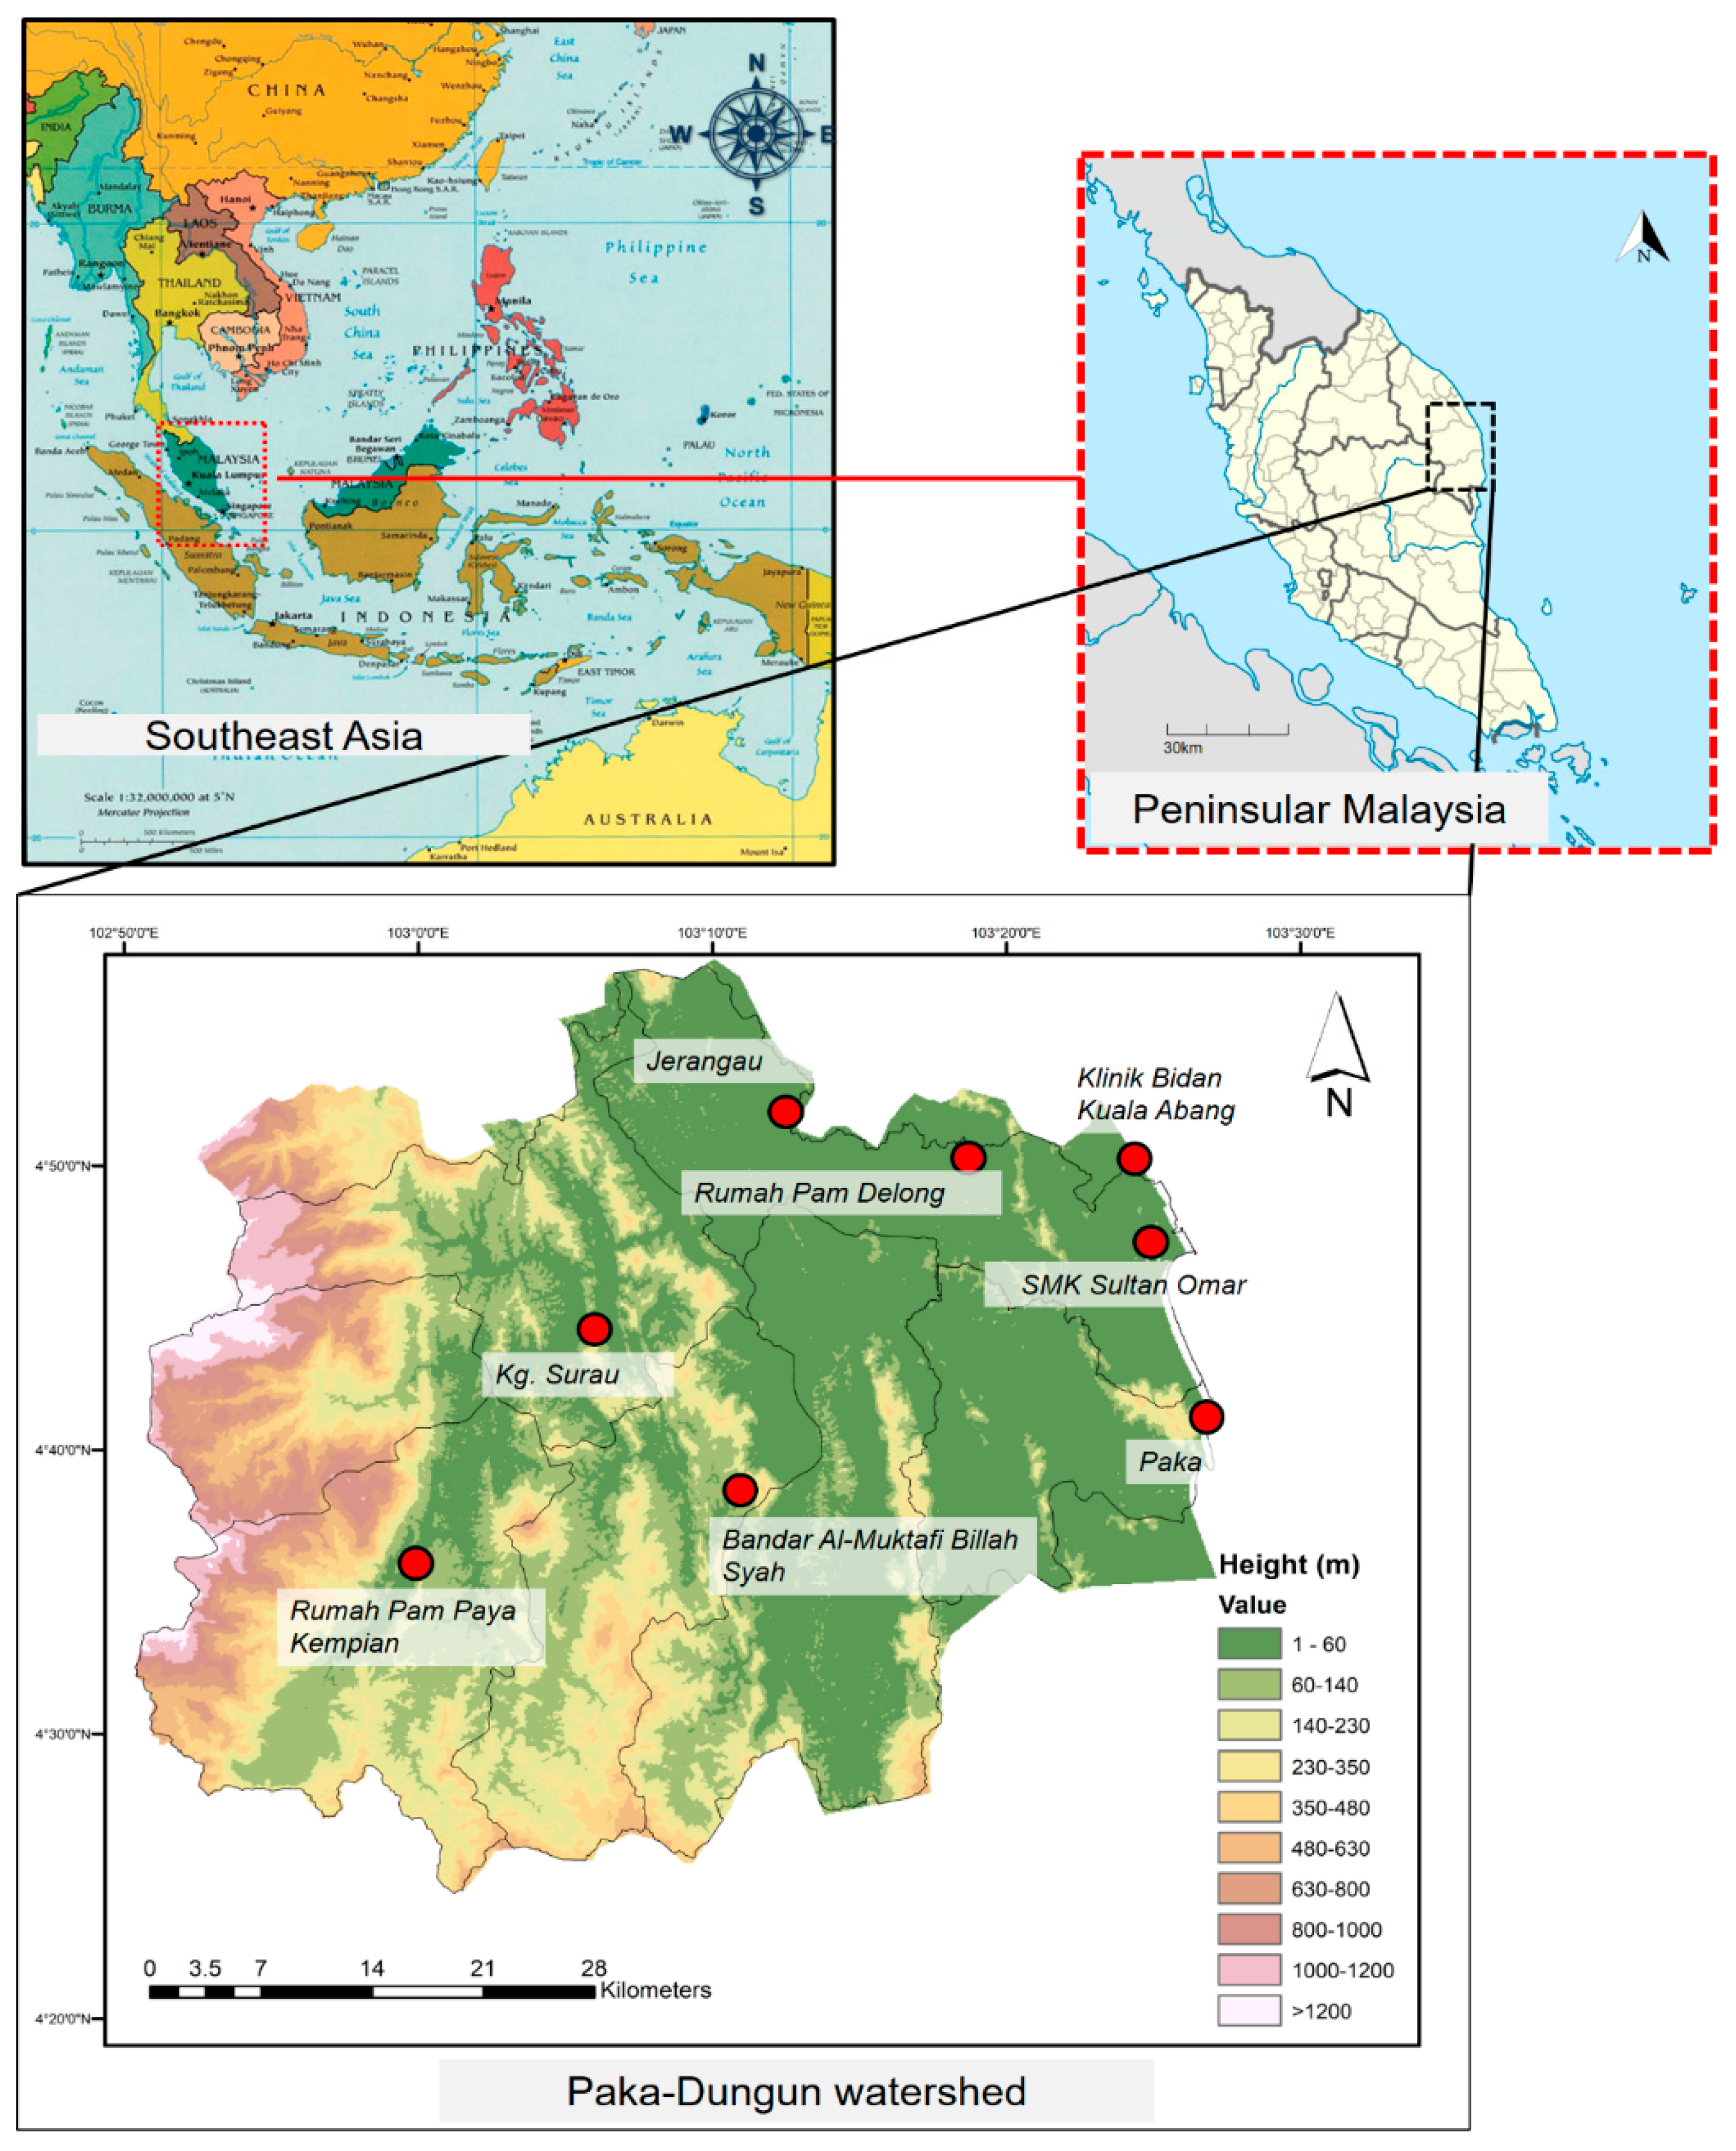
2.1. Study Area
2.2. Precipitation and Wind Data
2.2.1. Global Precipitation Mission (GPM) Satellite Data
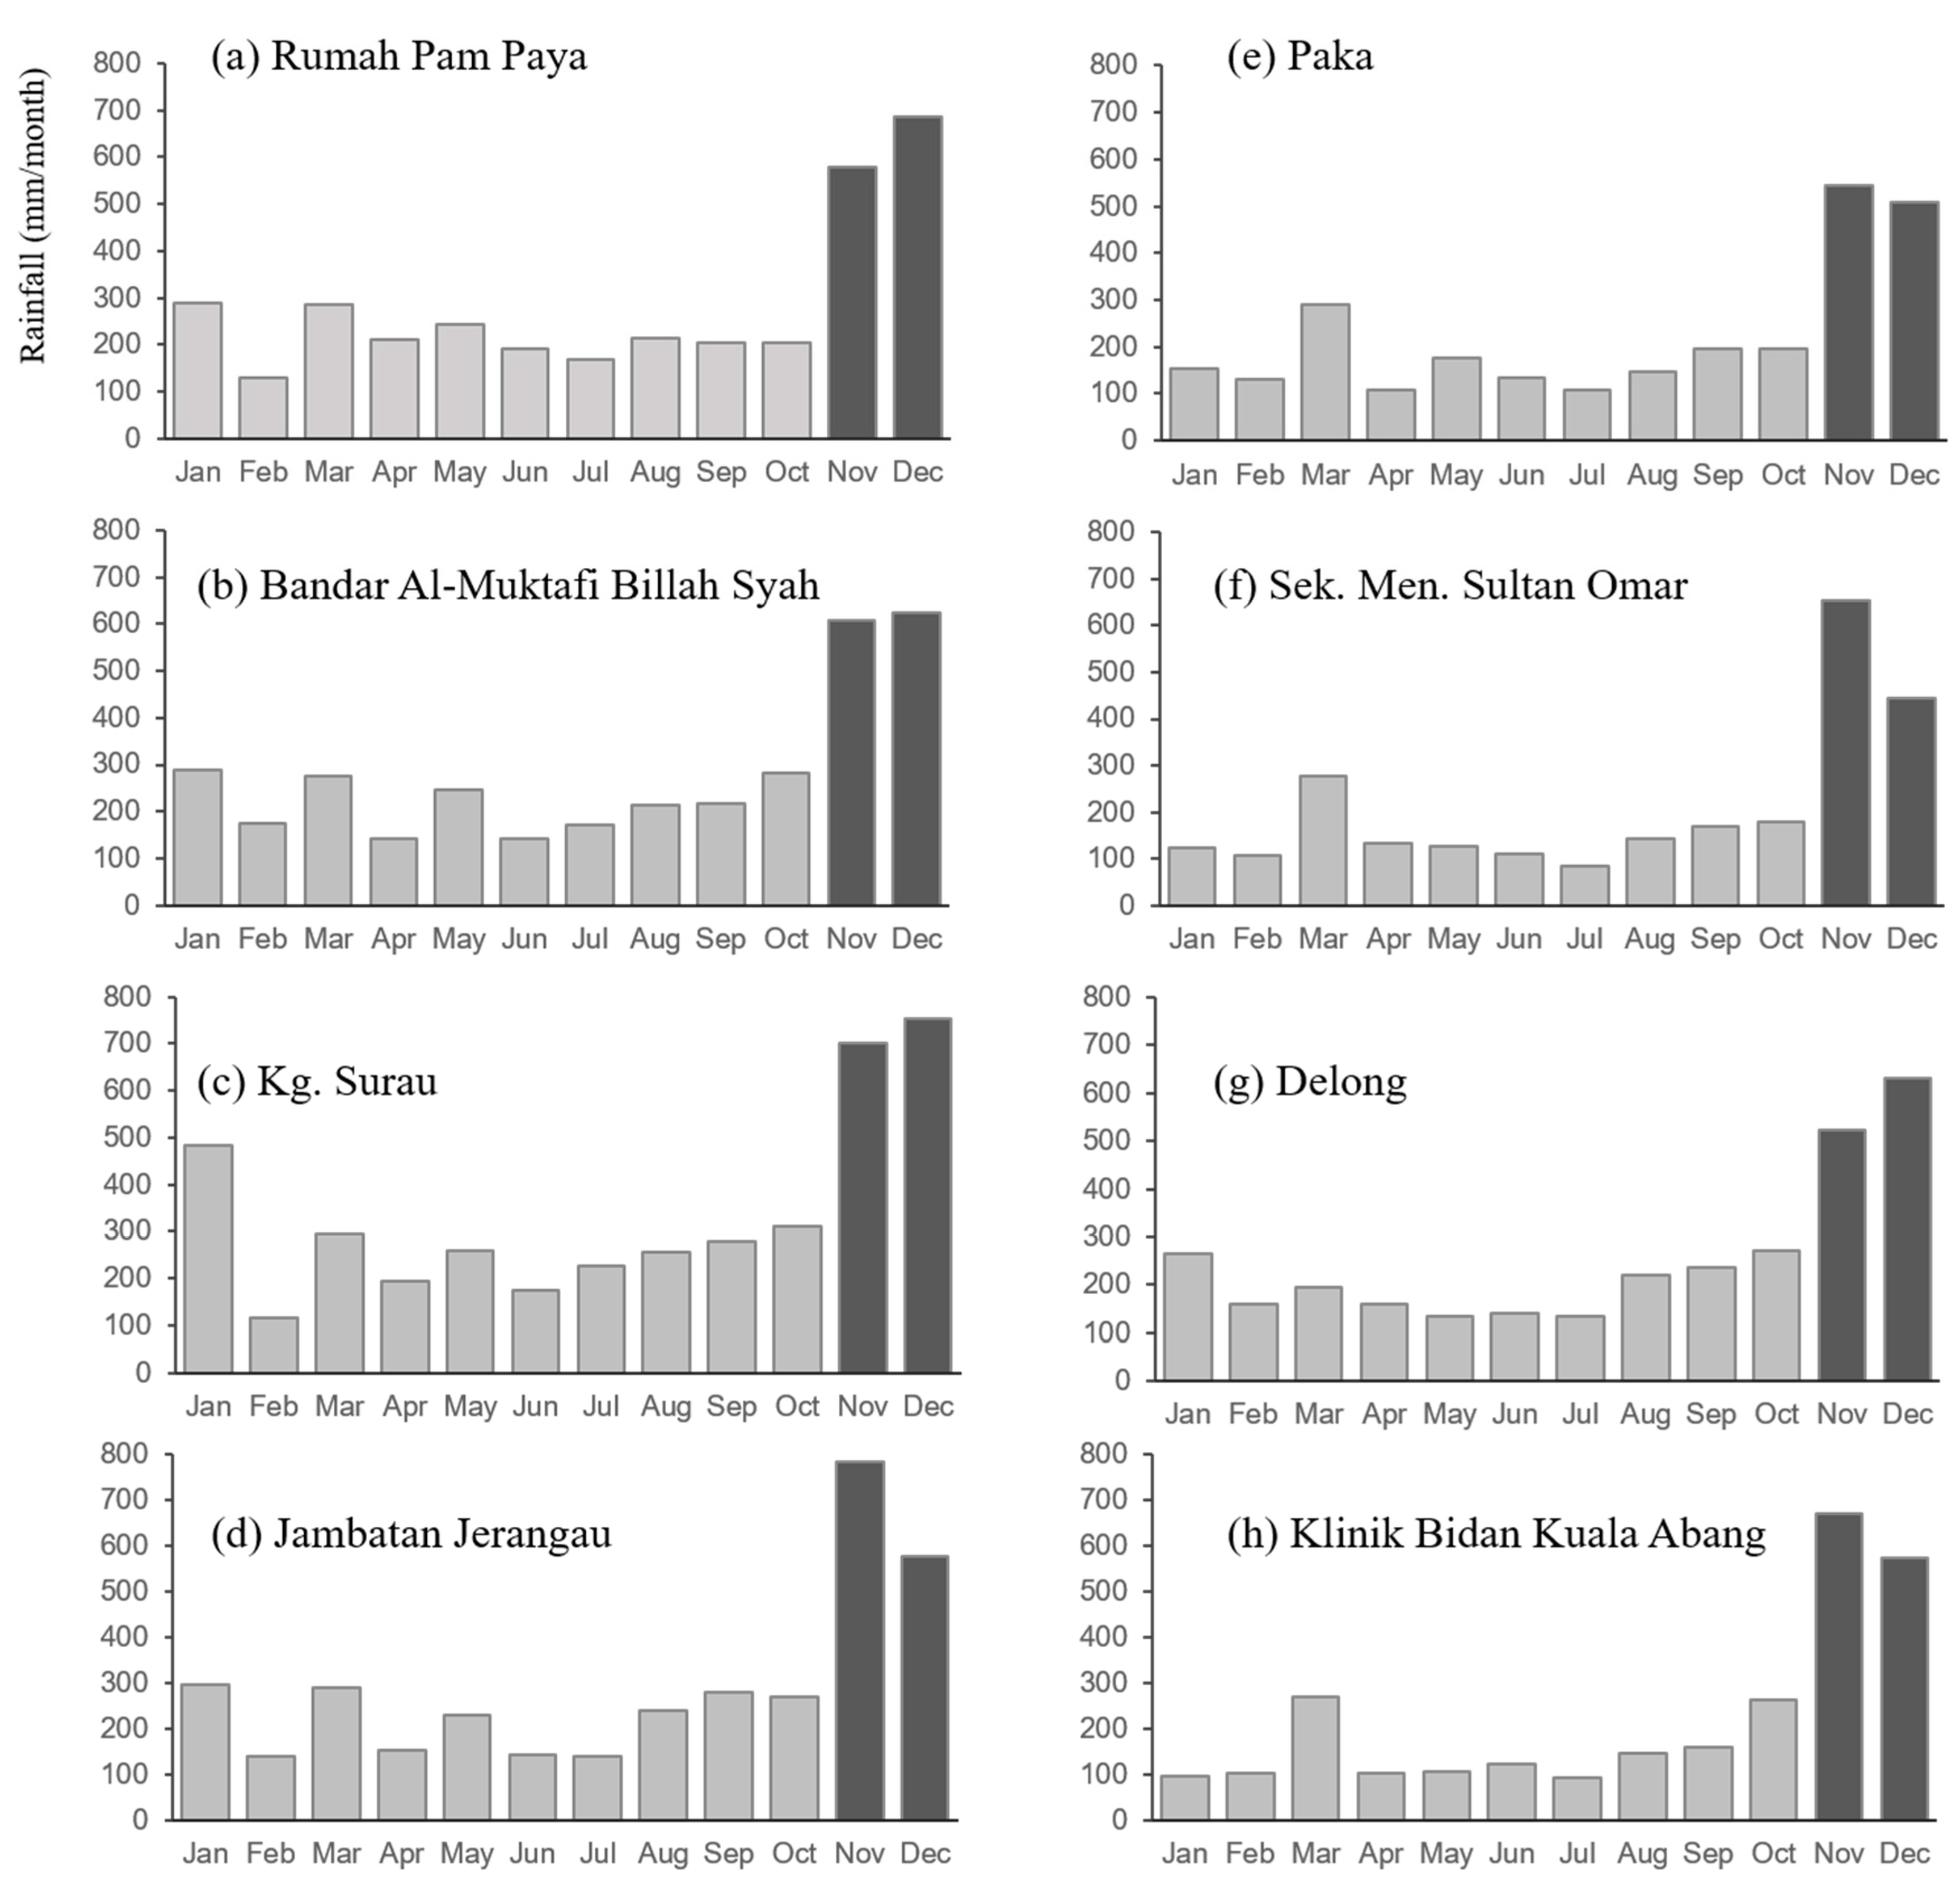
2.2.2. Rain Gauge Data
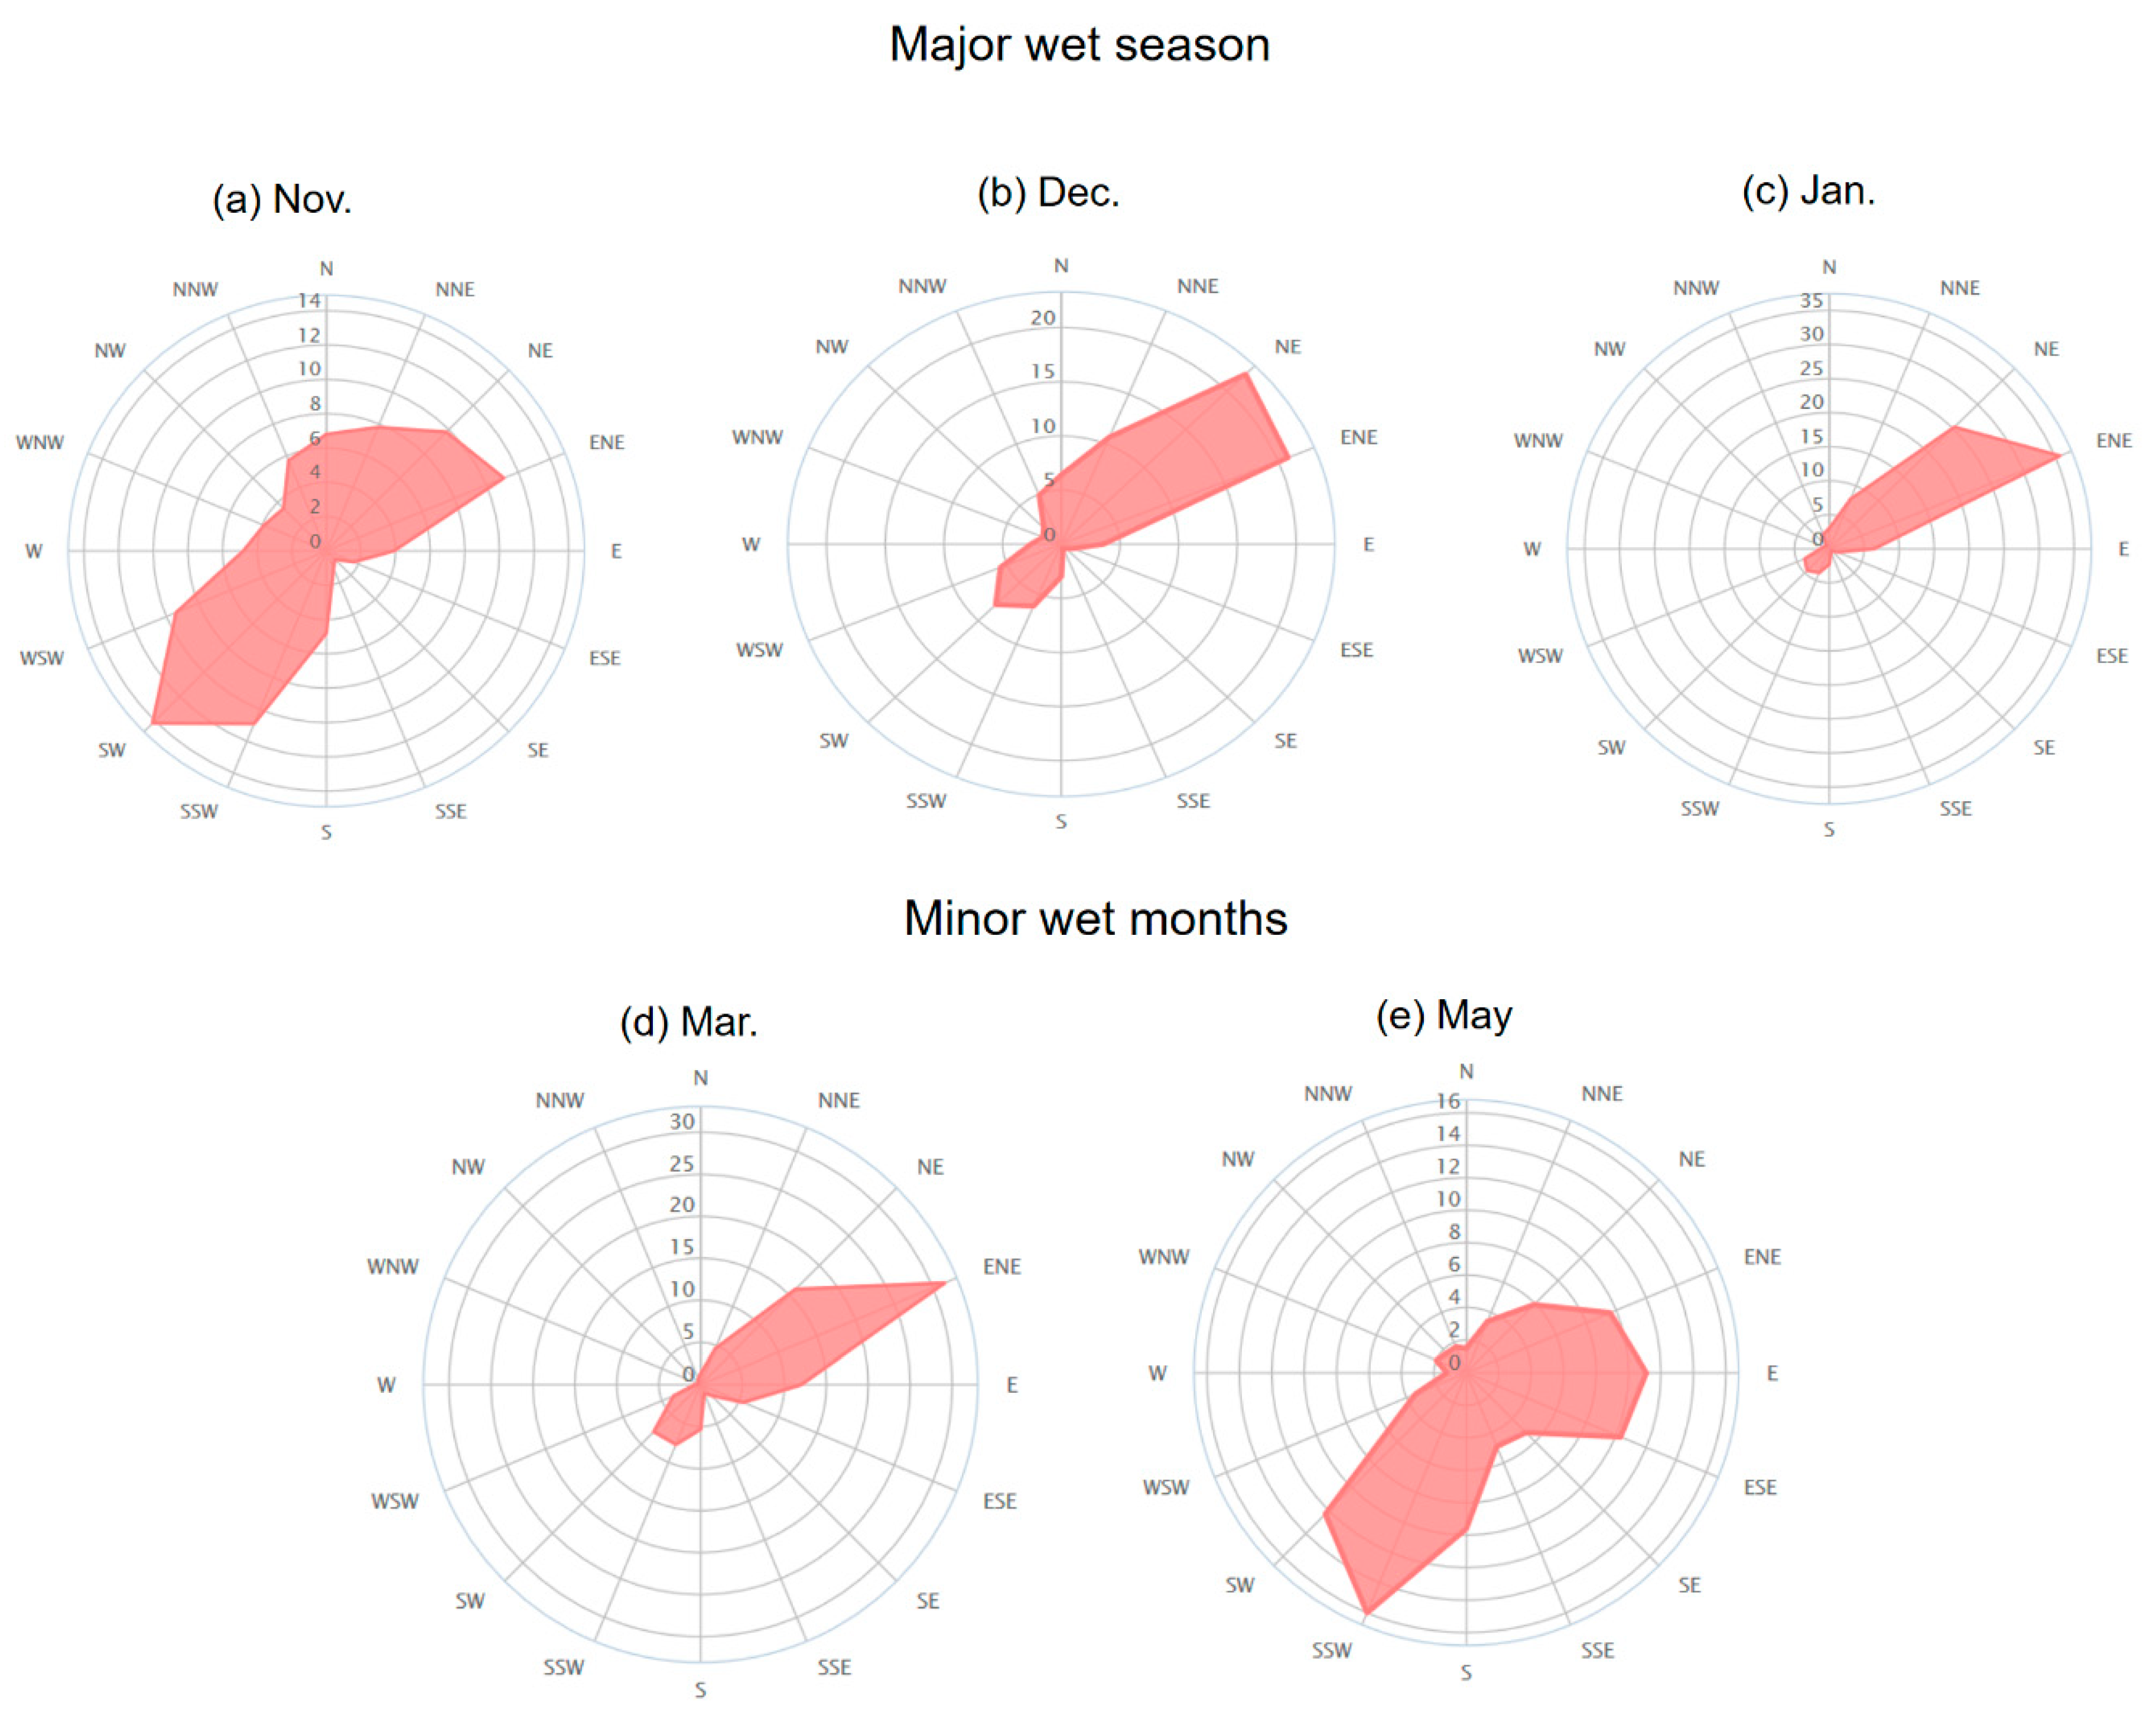
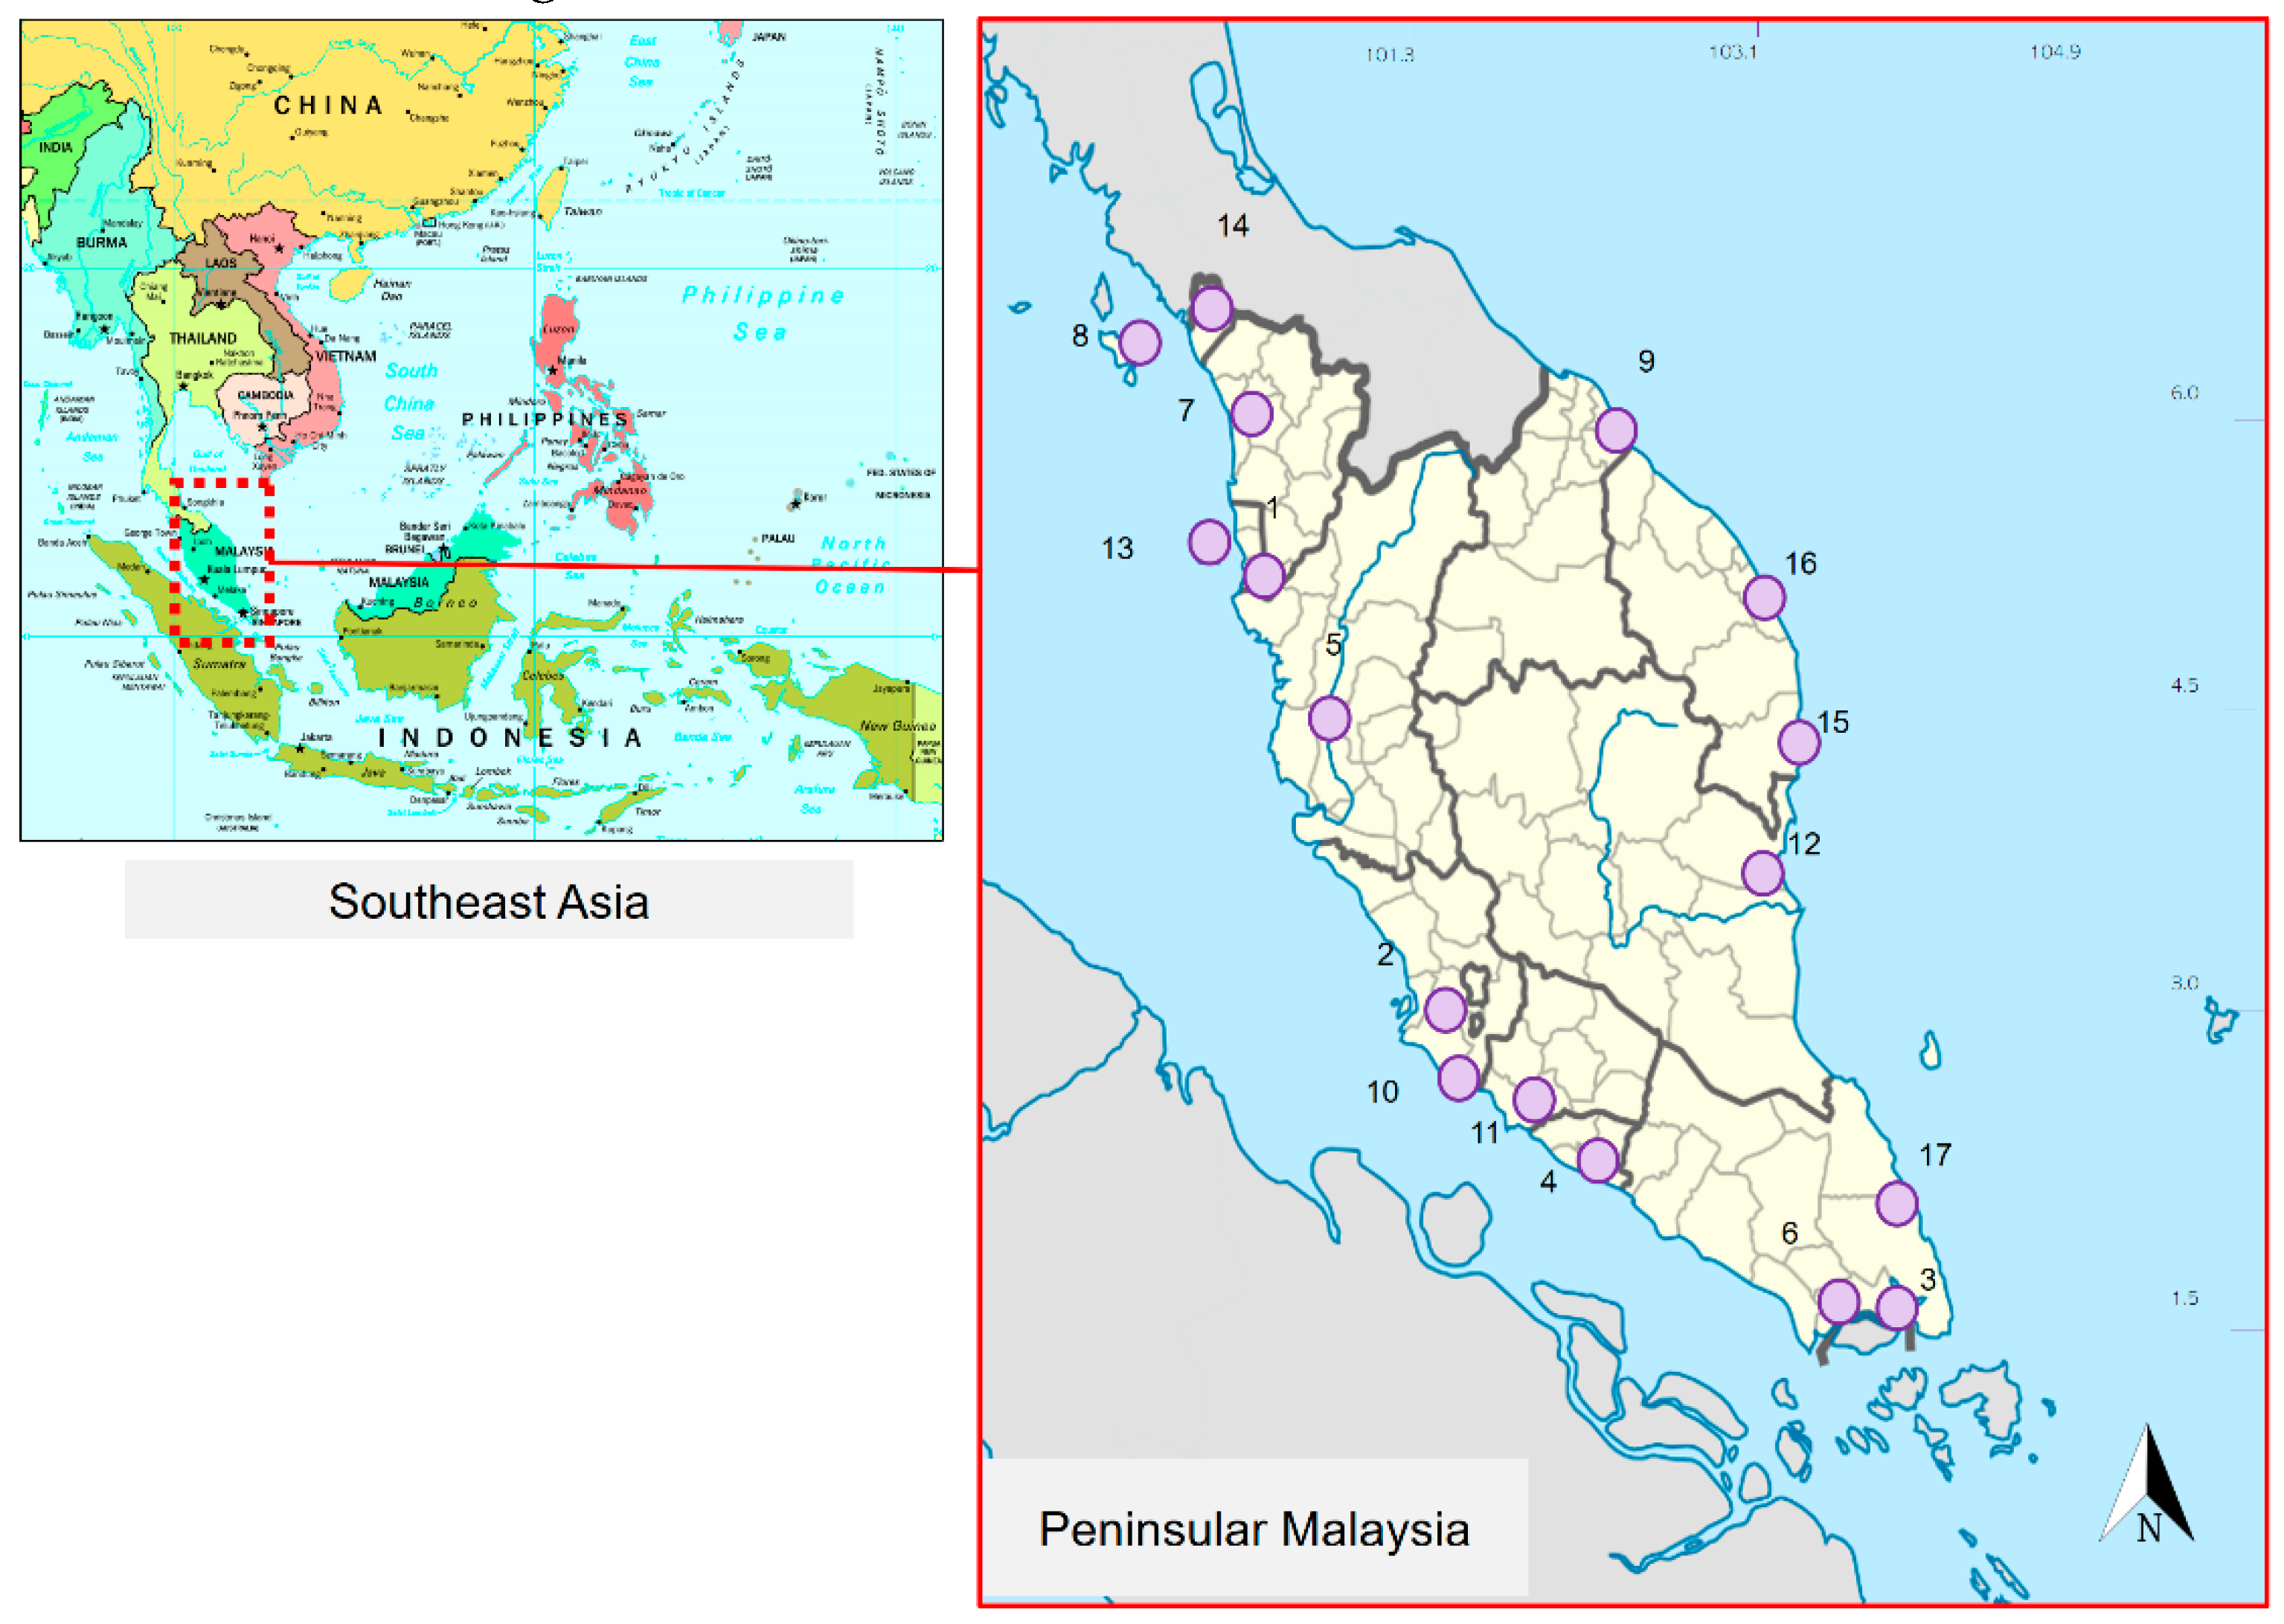
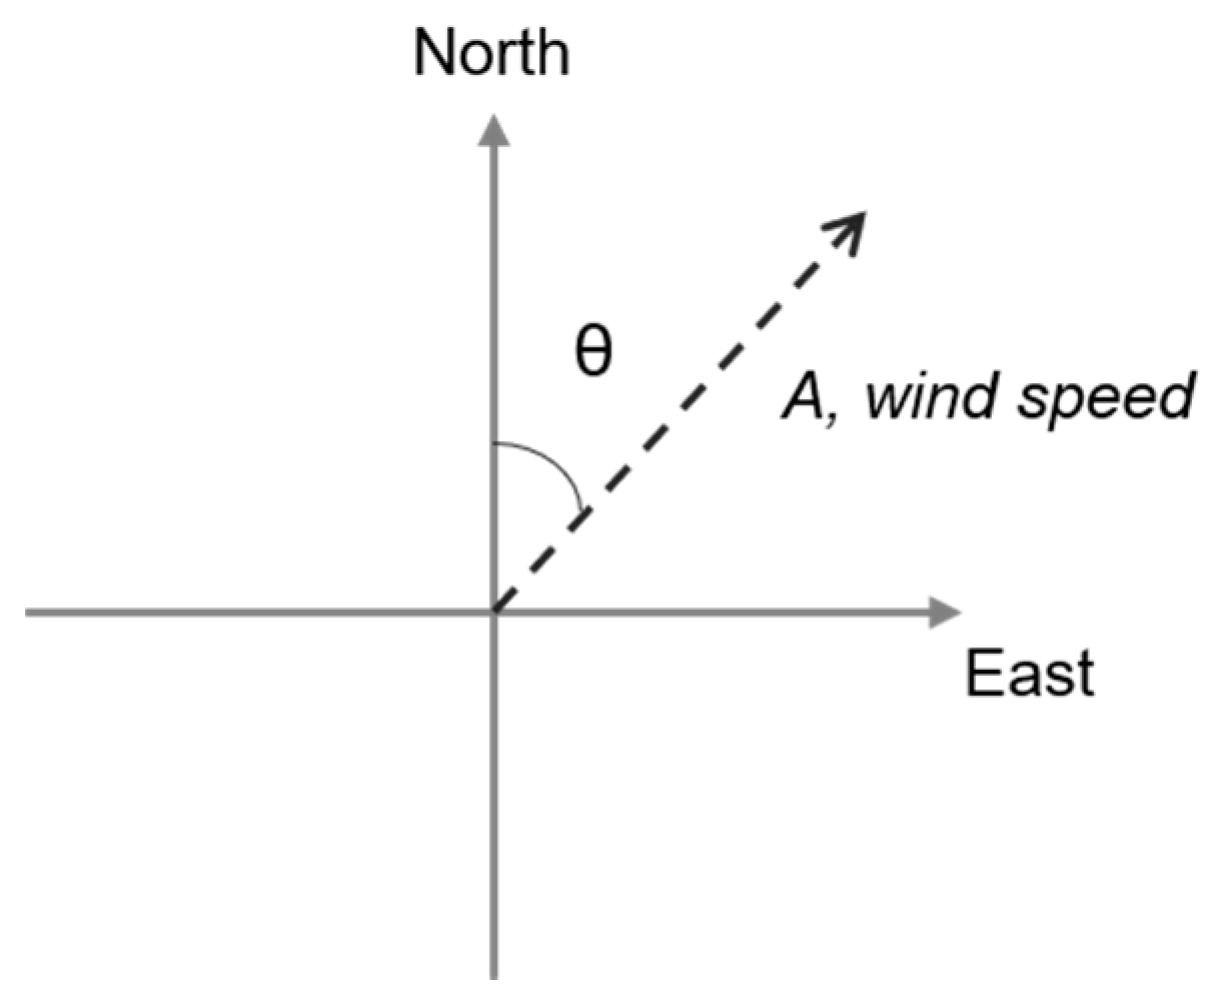
2.2.3. Wind Data
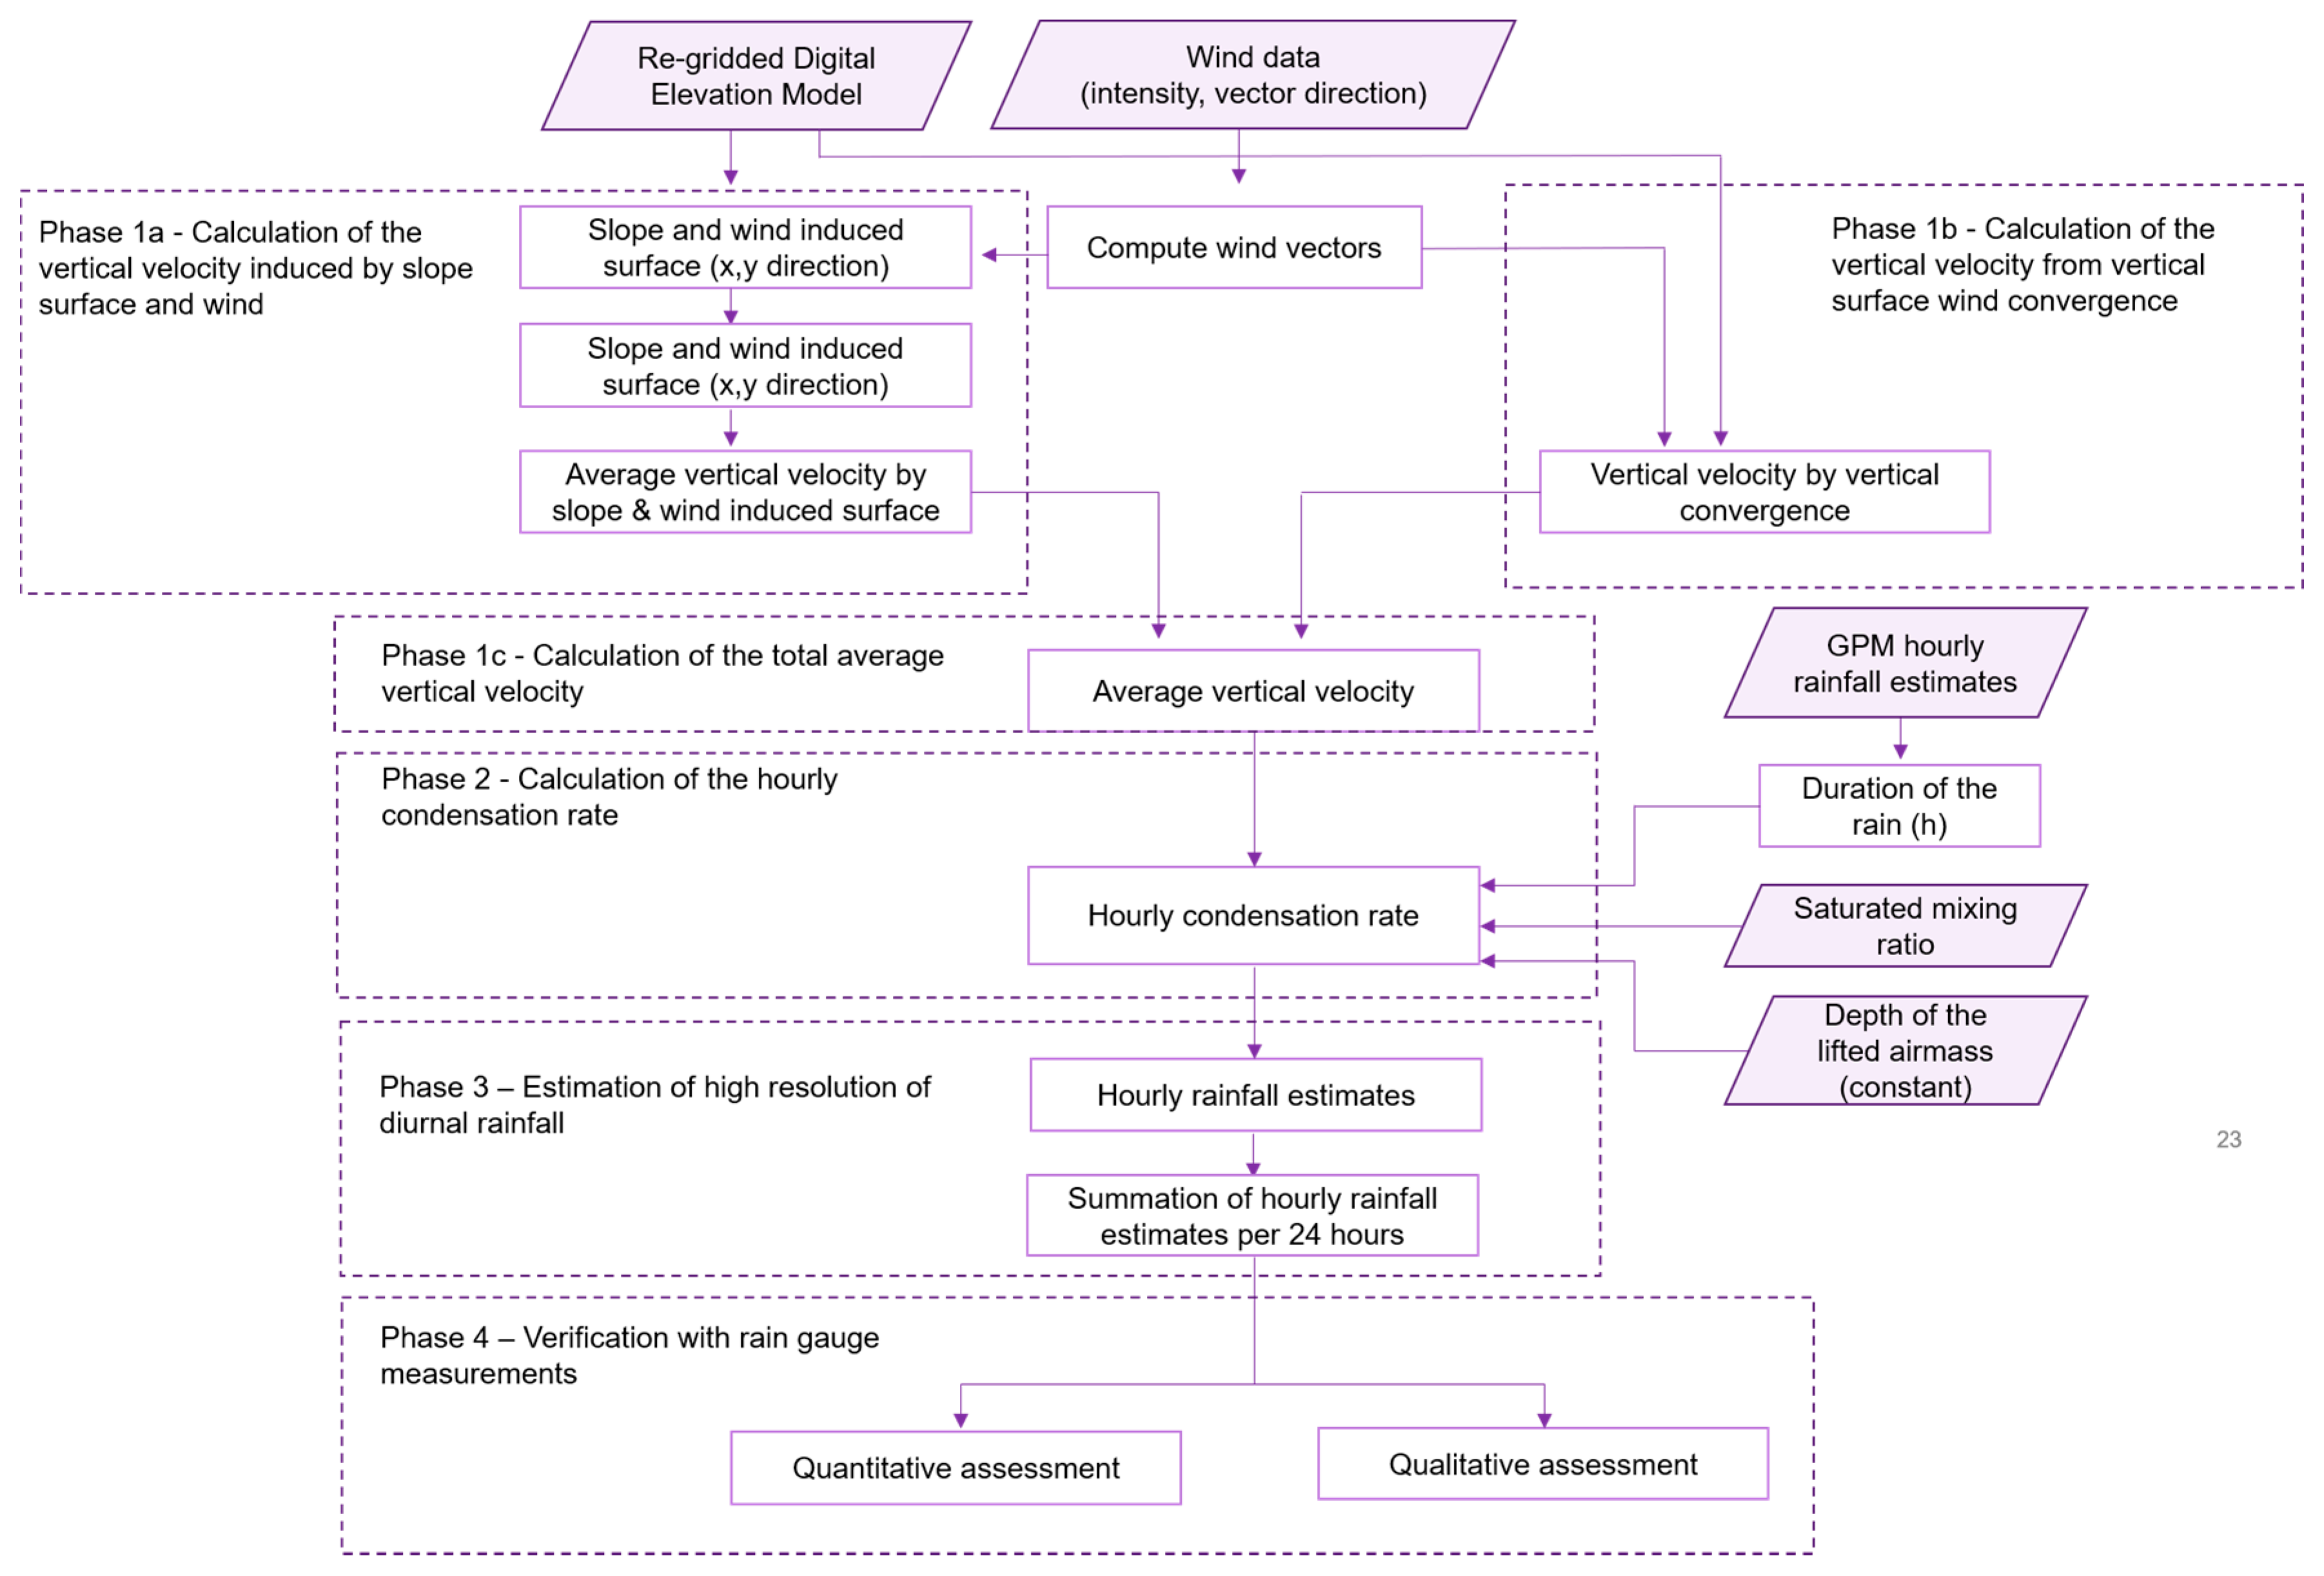
2.3. Downscaling Approach
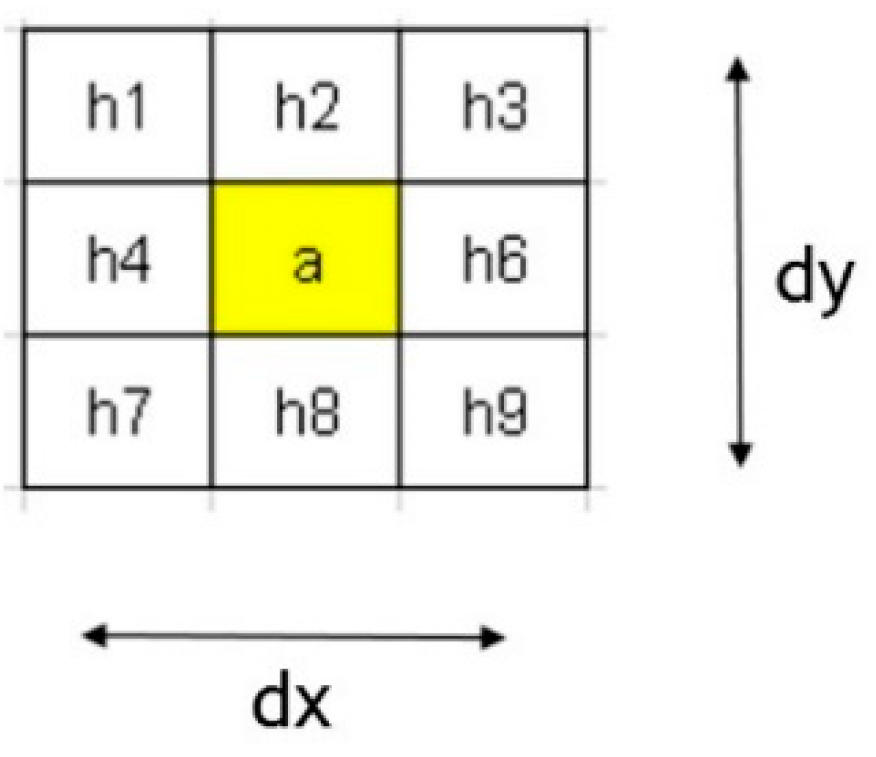
2.3.1. Phase 1a—Calculation of the Vertical Velocity Induced by Slope Surface and Wind
2.3.2. Phase 1b—Calculation of the Vertical Velocity from Vertical Surface Wind Convergence
2.3.3. Phase 1c—Calculation of the Total Average Vertical Velocity
2.3.4. Phase 2—Calculation of the Hourly Condensation Rate
2.3.5. Phase 3—Estimation of High Resolution of Daily Rainfall
2.3.6. Phase 4—Accuracy Assessment
3. Results
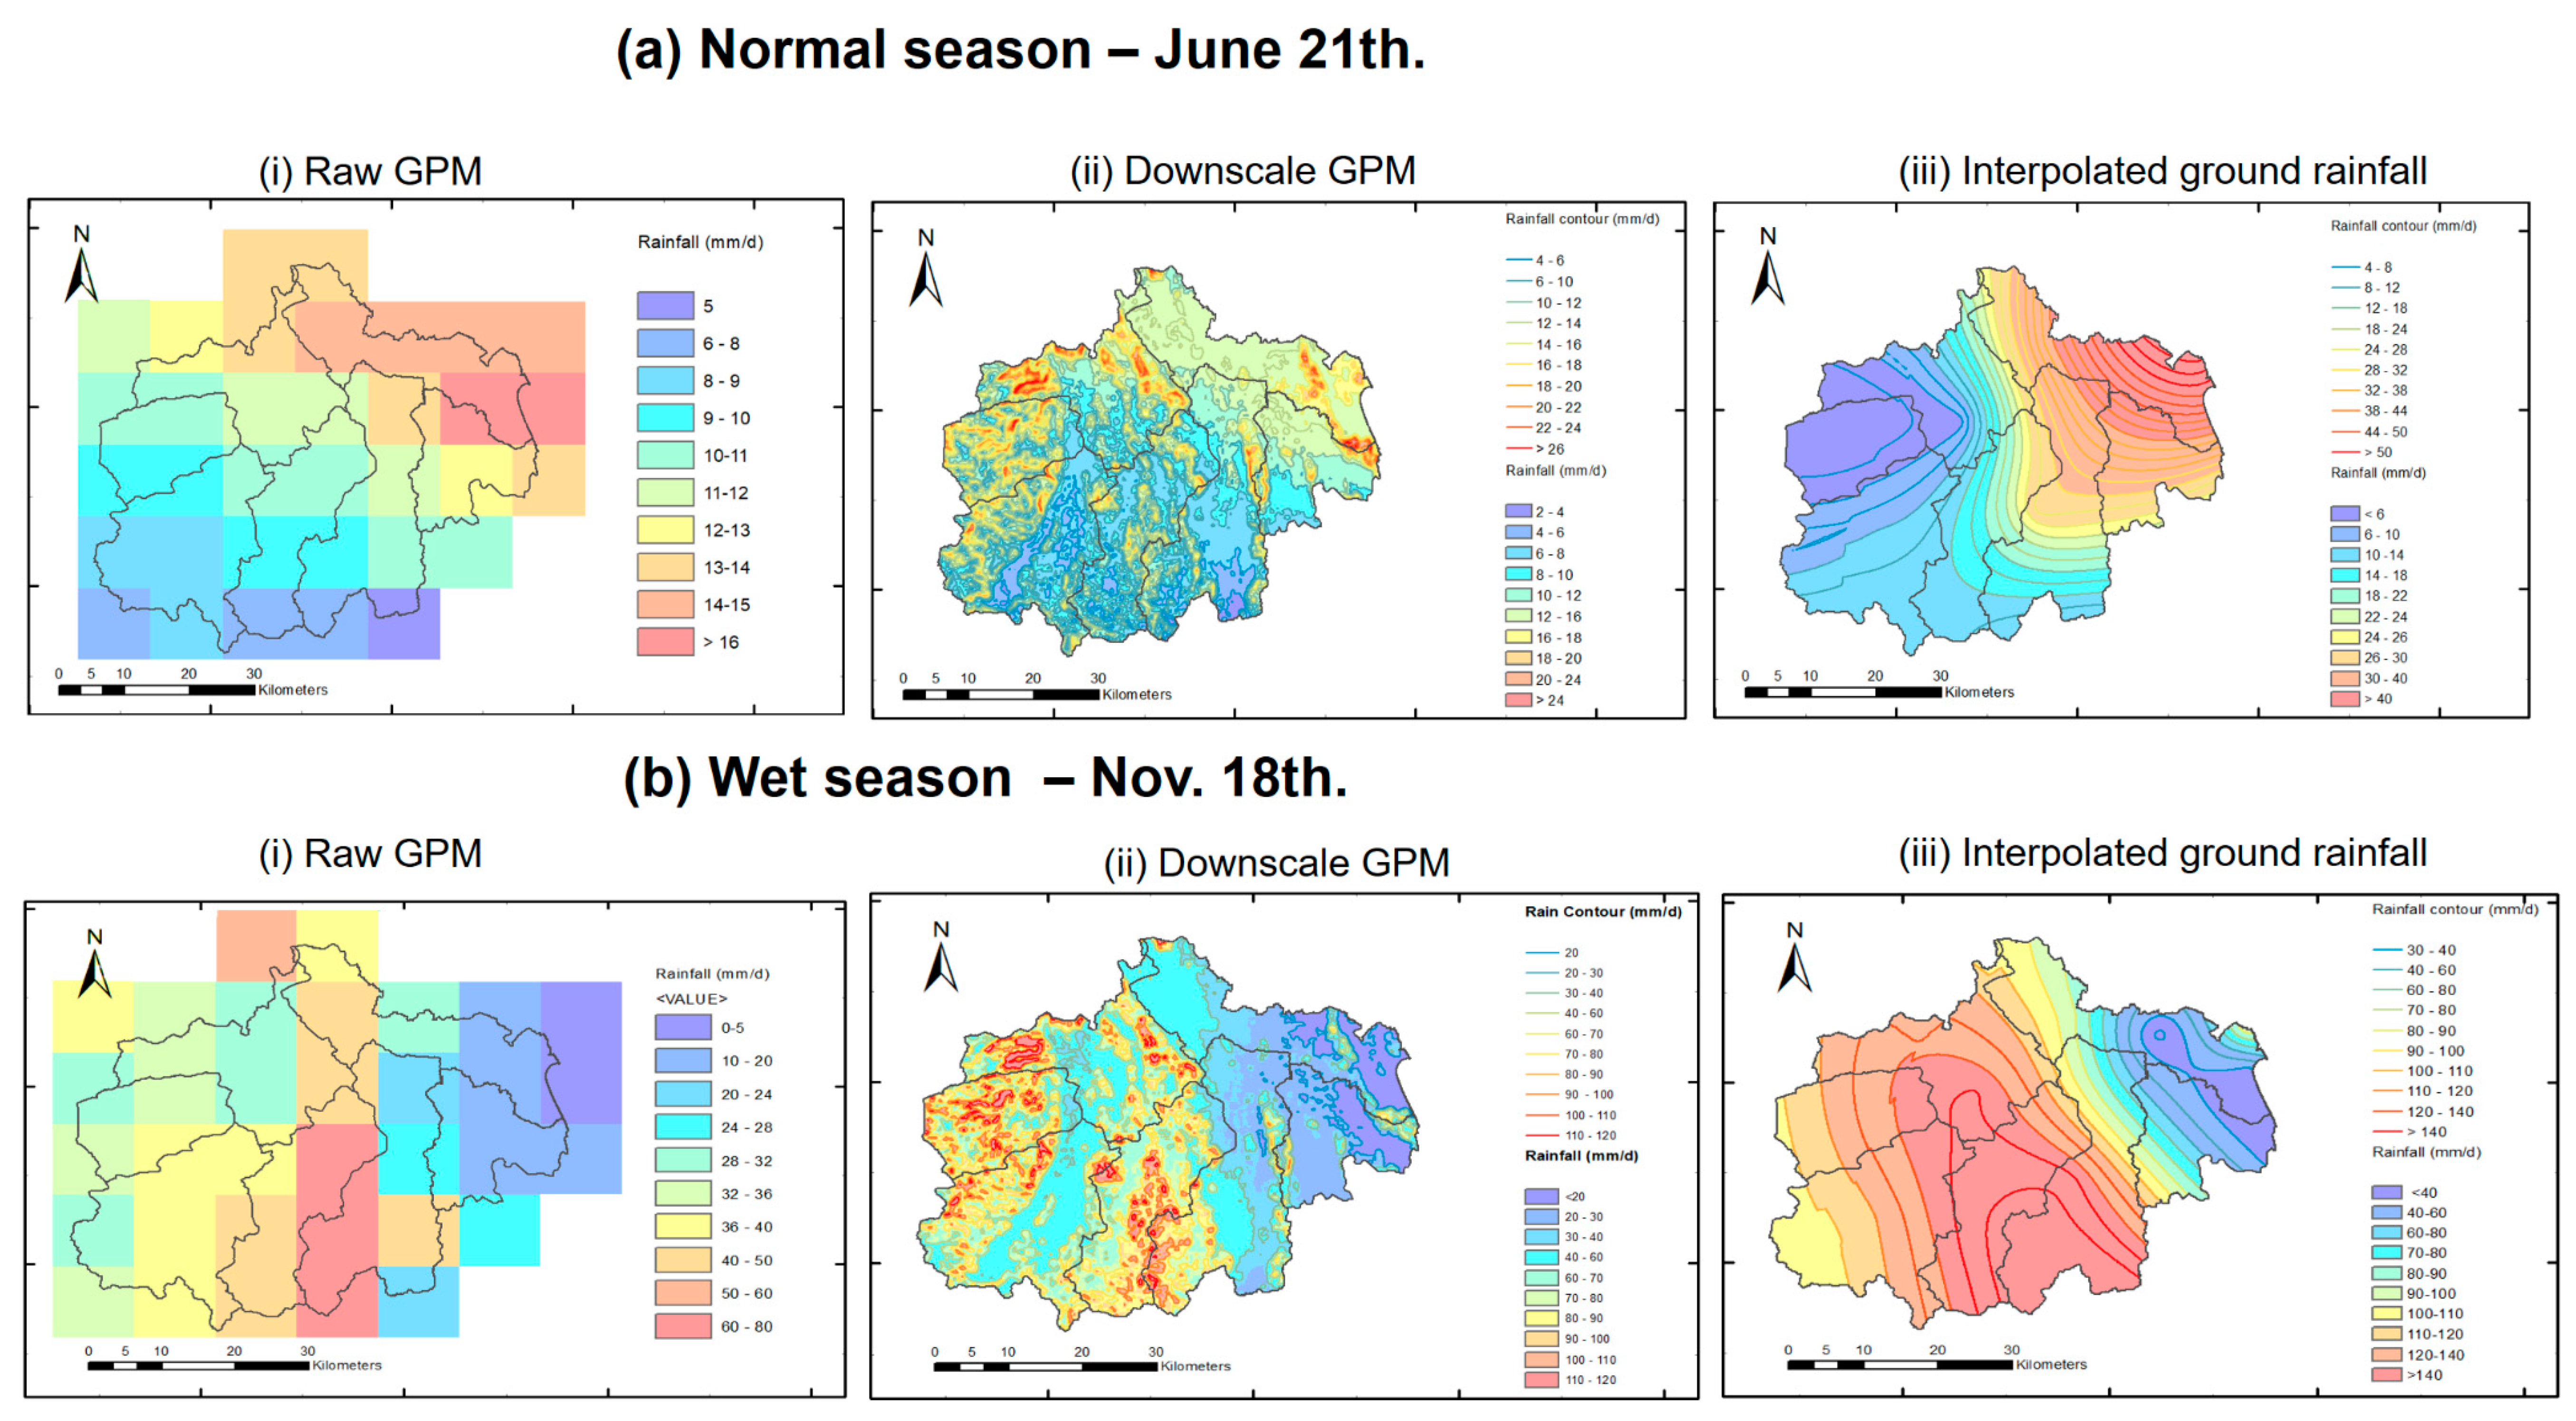
3.1. Spatial Rainfall Pattern Representation Assessment
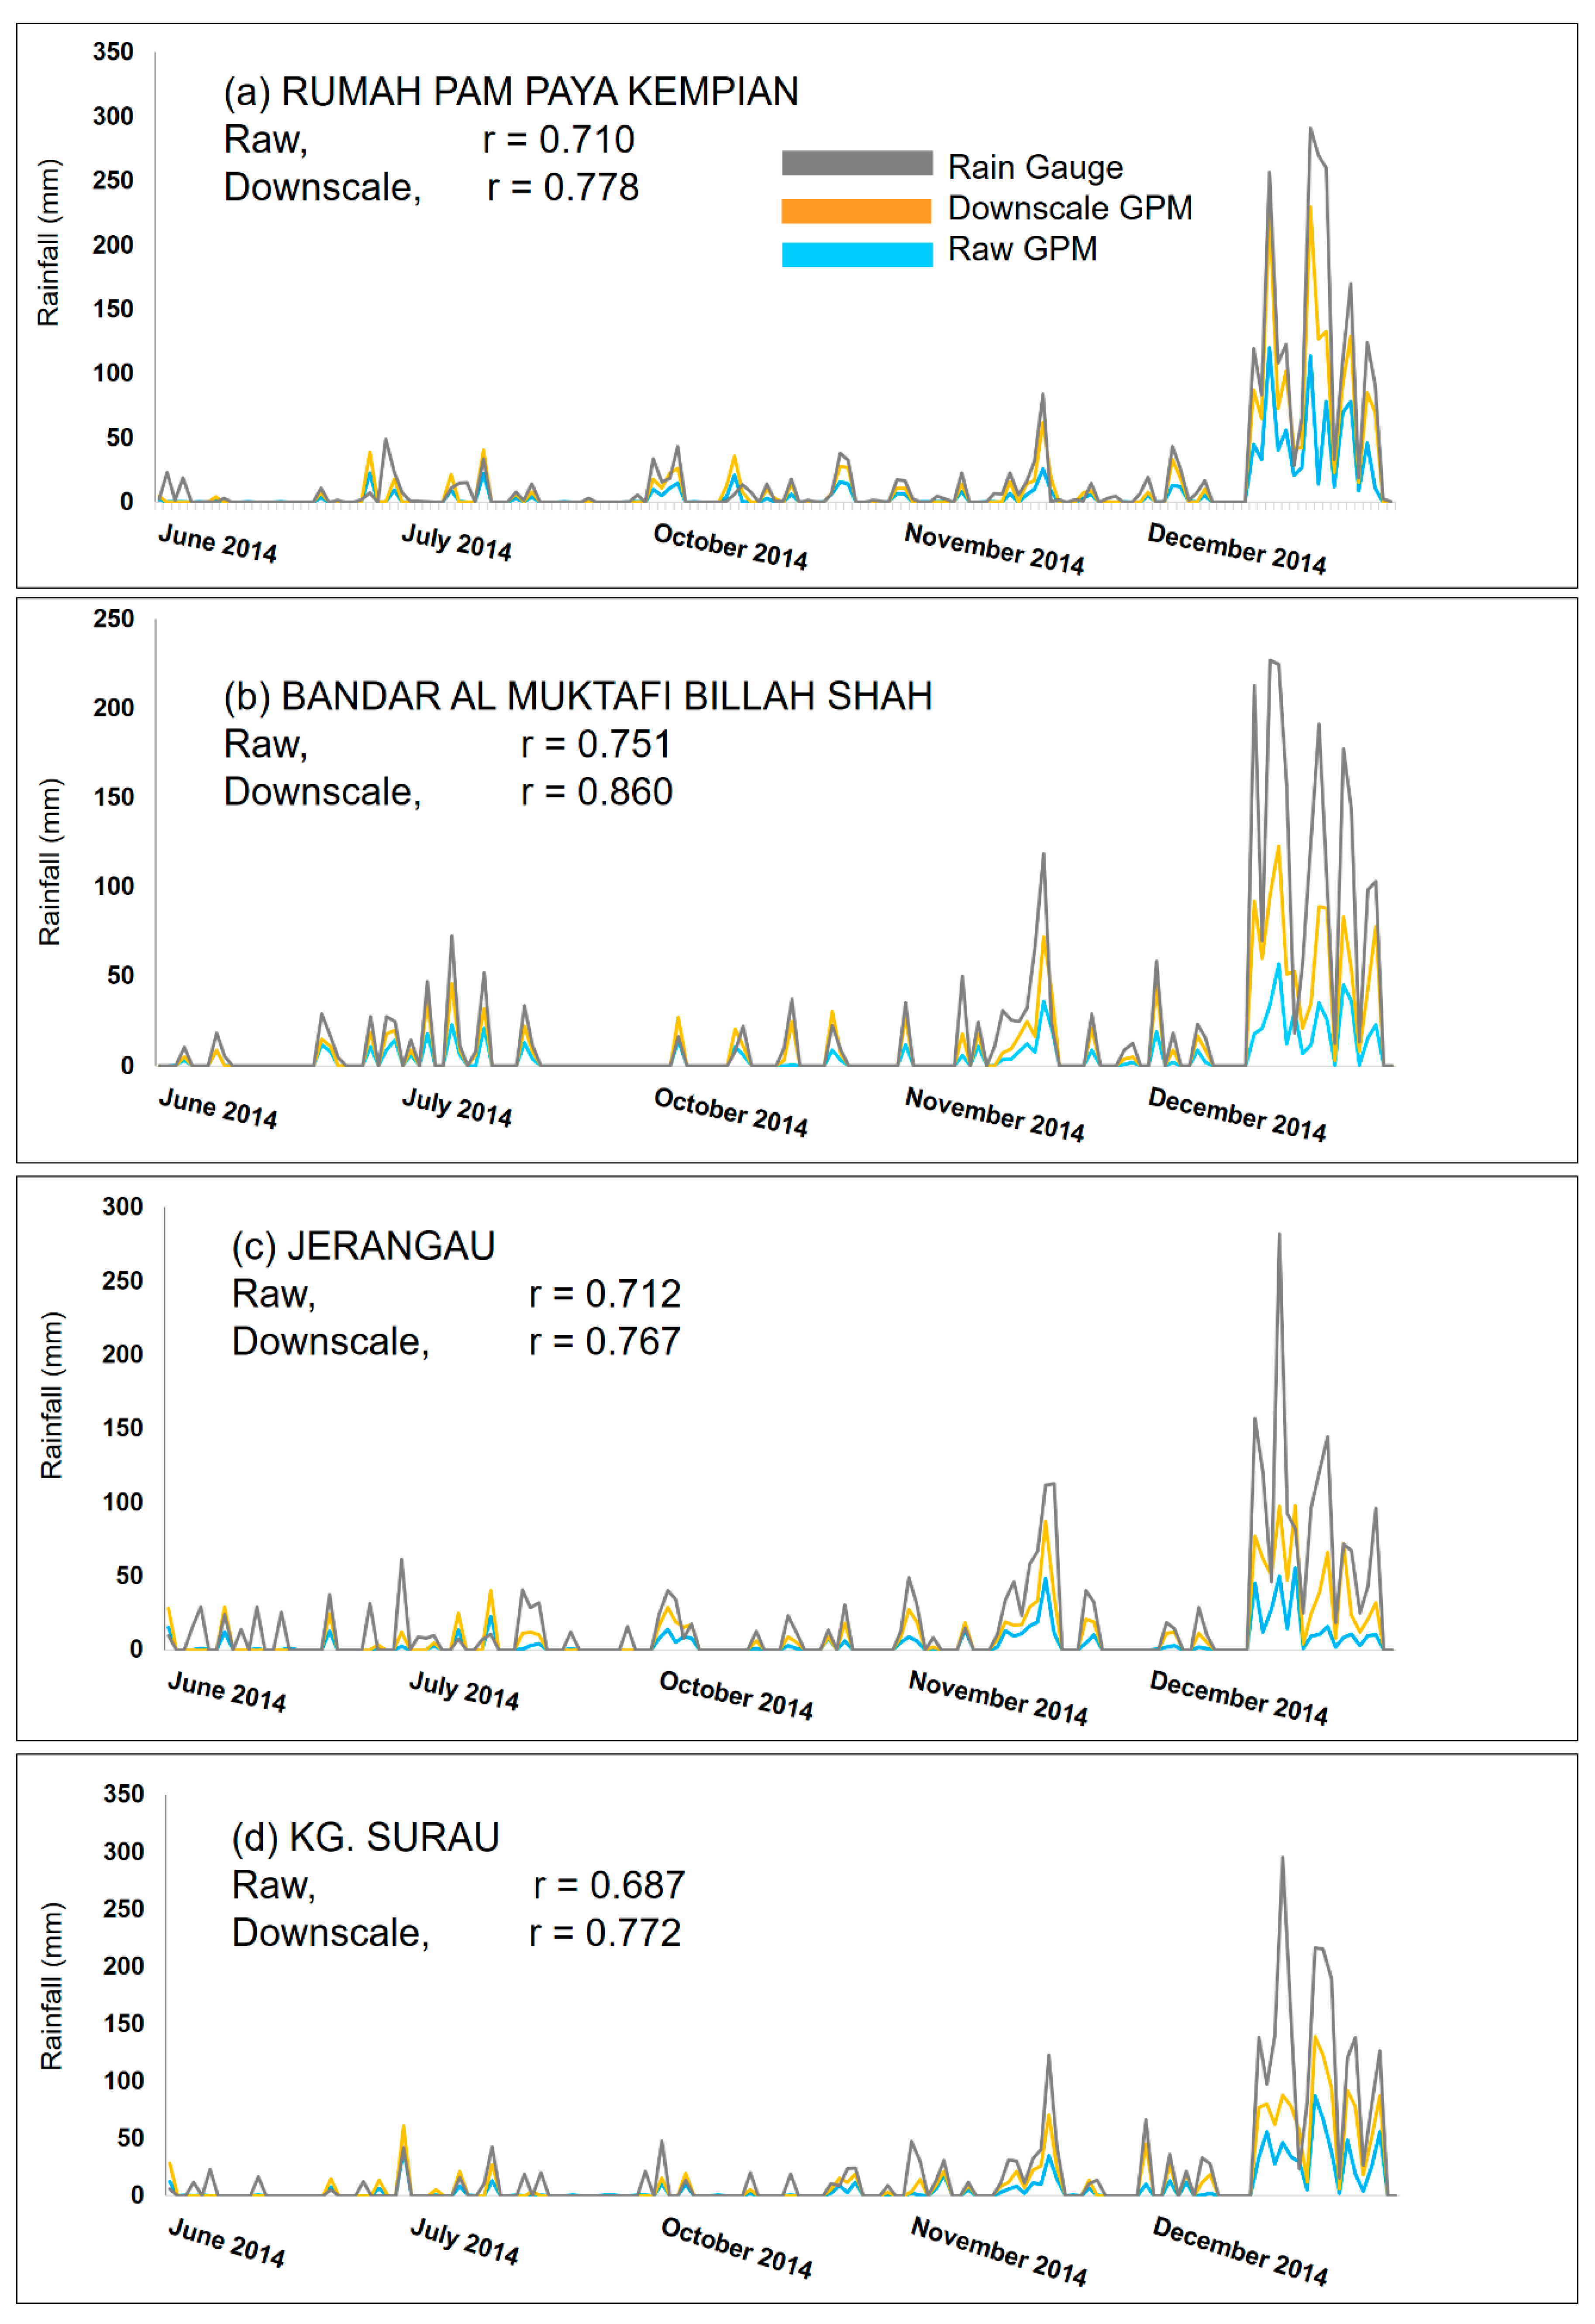
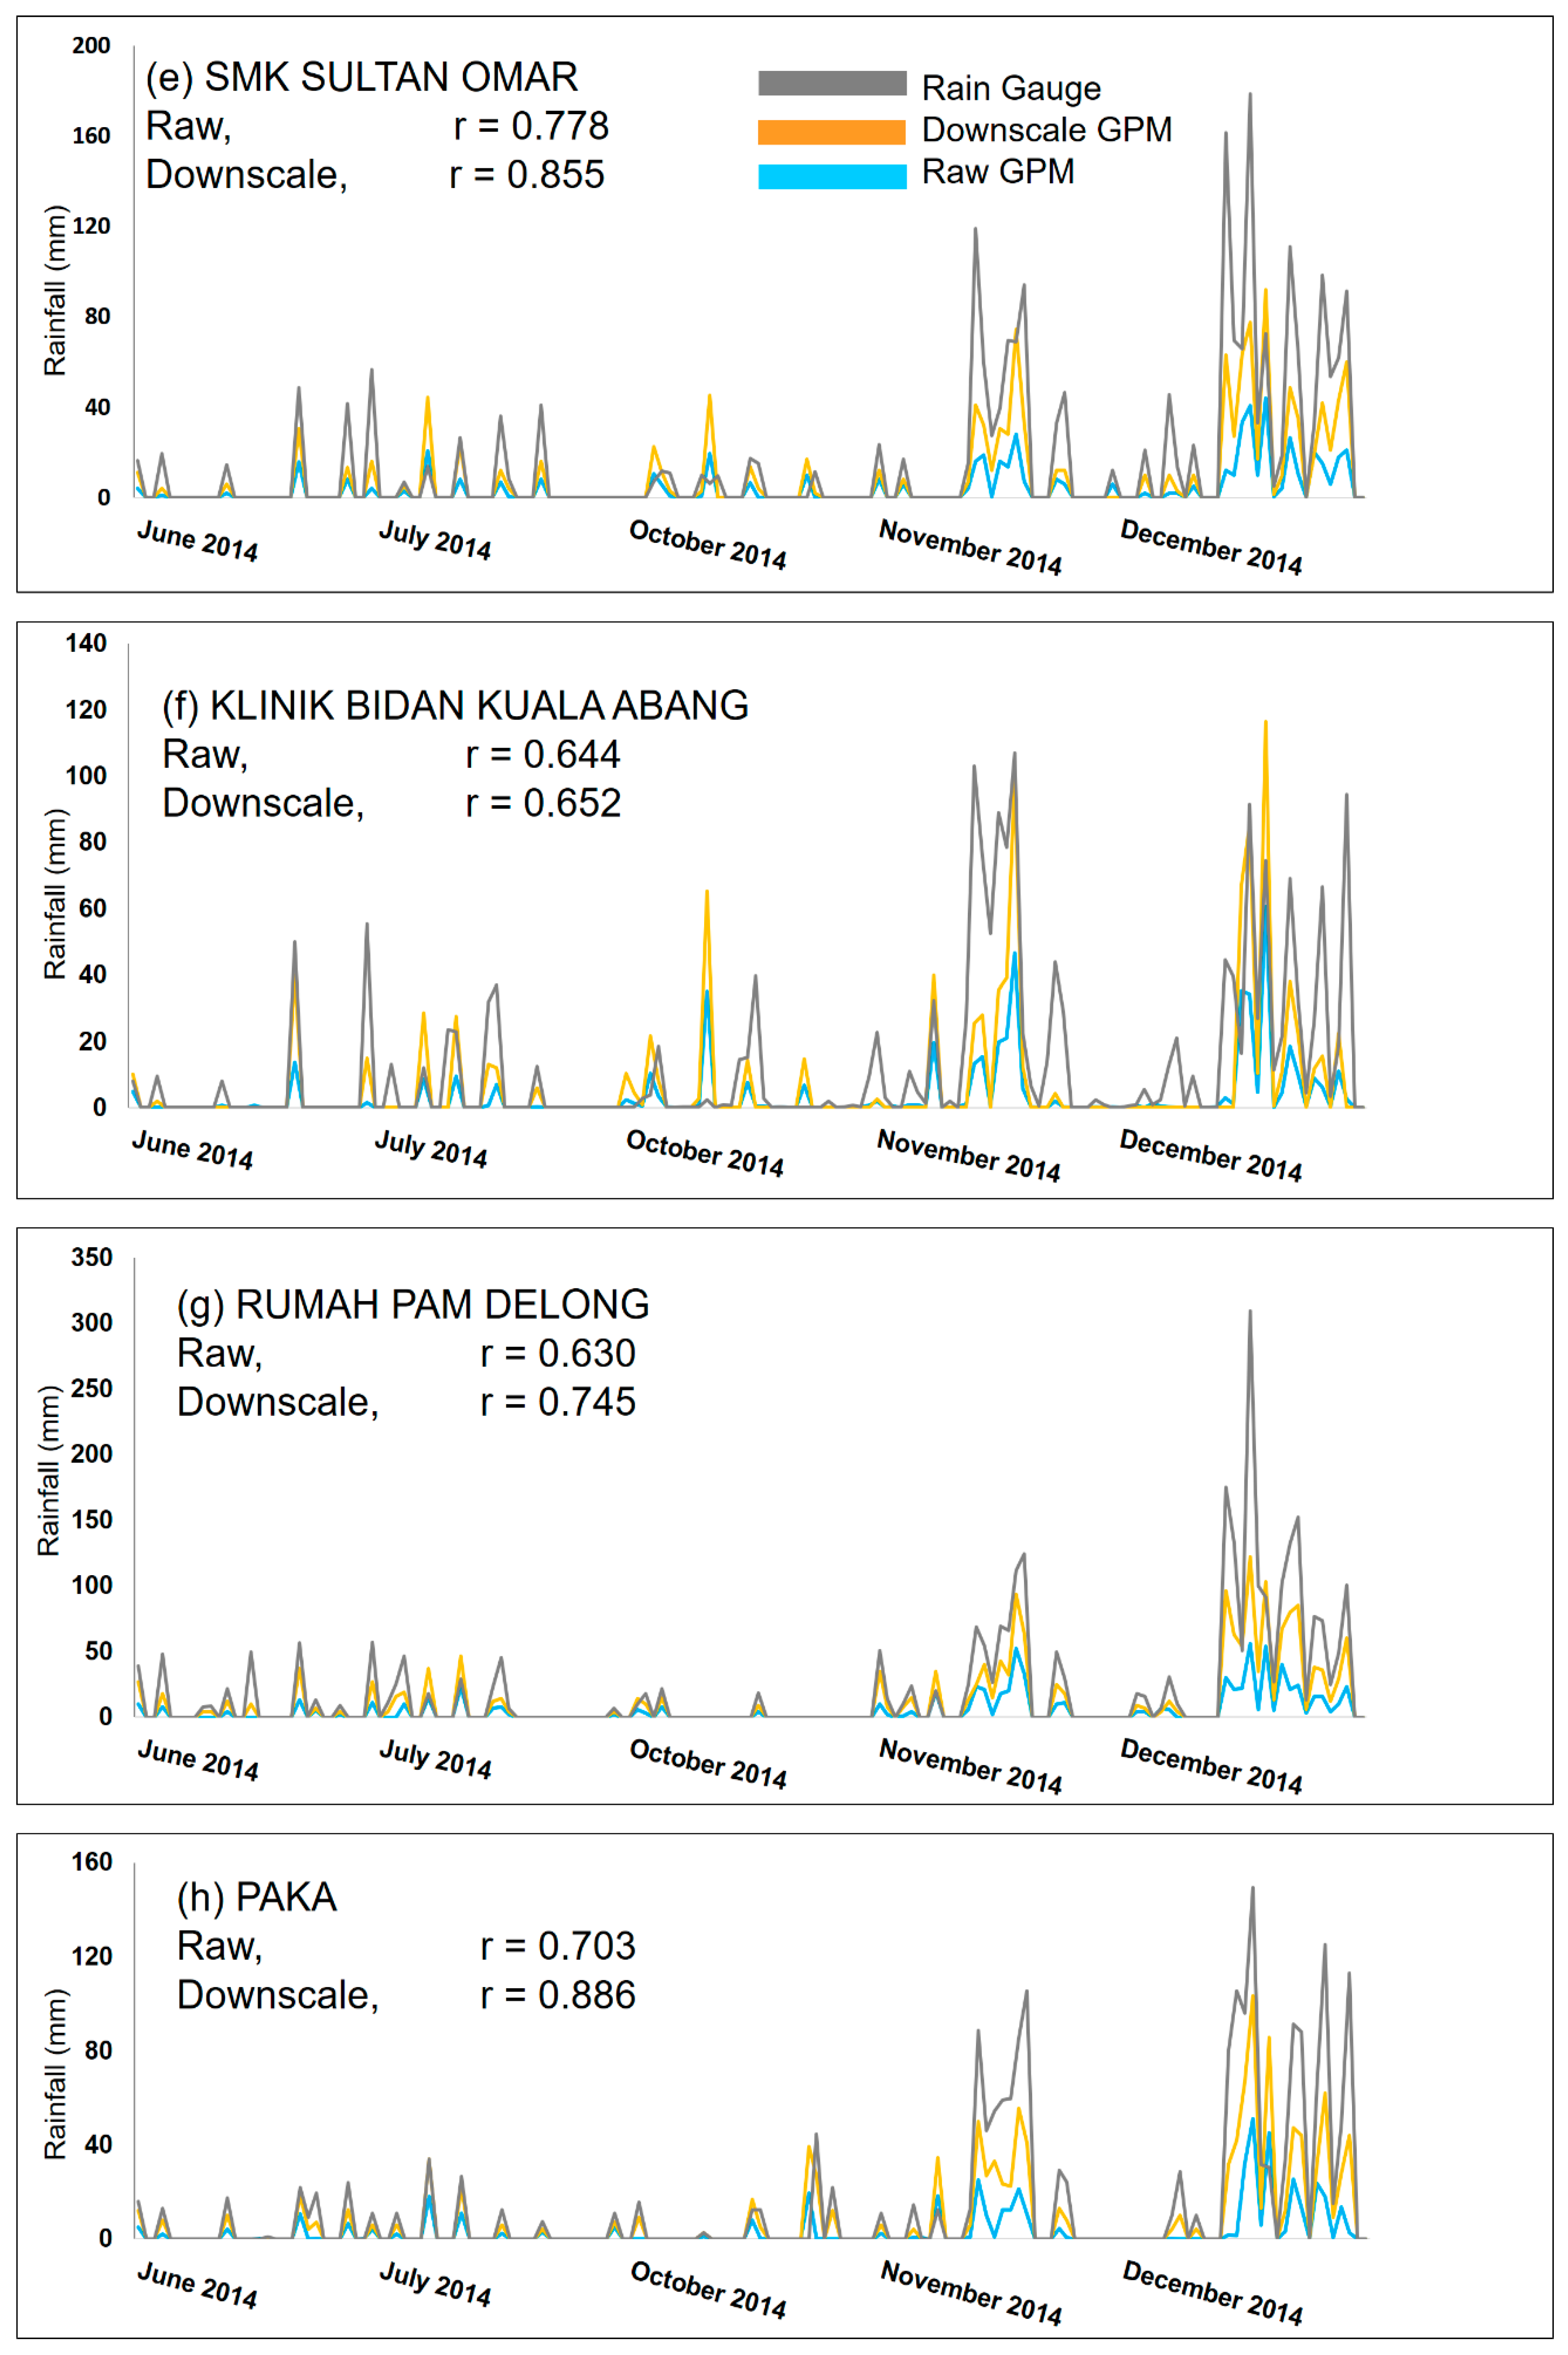
3.2. Temporal Rainfall Representation Assessment
3.3. Quantitative Rainfall Error Assessment
3.4. Qualitative Rainfall Assessment
4. Discussion
5. Conclusions
Author Contributions
Funding
Acknowledgments
Conflicts of Interest
References
- Vegas-Vilarrubia, T.; Maass, M.; Rull, V.; Elias, V.; Ramon, A.; Ovalle, C.; Lopez, D.; Schneider, G.; Depetris, J.; Douglas, I. Small catchment studies in the tropical zone. In Biogeochemistry of Small Catchments: A Tool for Environmental Research; Moldan, B., Cerny, J., Eds.; John Wiley & Sons, Ltd.: Hoboken, NJ, USA, 1994. [Google Scholar]
- IUWASH. Water Supply Vulnerability Assessment and Adaptation Plan; PDAM Pematangsiantar Summary Report; Indonesia Urban Water Sanitation and Hygience Project (IUWASH): Jakarta, Indonesia, August 2014; Available online: https://www.iuwashplus.or.id/cms/wp-content/uploads/2017/04/VAAP-Summary-Report-PDAM-Pematangsiantar.pdf (accessed on 13 November 2019).
- Toriman, M.E.; Abdullah, M.P.; Mokhtar, M.; Gasim, M.B.; Karim, O. Surface erosion and sediment yields assessment from small ungauged catchment of Sungai Anak Bangi Selangor. Malays. J. Anal. Sci. 2010, 14, 12–23. [Google Scholar]
- Bidin, K.; Chappell, N.A. First evidence of a structured and dynamic spatial pattern of rainfall within a small humid tropical catchment. Hydrol. Earth Syst. Sci. 2003, 7, 245–253. [Google Scholar] [CrossRef]
- Su, Y.; Zhao, C.; Wang, Y.; Ma, Z. Spatiotemporal Variations of Precipitation in China Using Surface Gauge Observations from 1961 to 2016. Atmosphere 2020, 11, 303. [Google Scholar] [CrossRef]
- Kim, I.-W.; Oh, J.; Woo, S.; Kripalani, R.H. Evaluation of precipitation extremes over the Asian domain: Observation and modelling studies. Clim. Dyn. 2019, 52, 1317–1342. [Google Scholar] [CrossRef]
- Cheong, W.K.; Timbal, B.; Golding, N.; Sirabaha, S.; Kwan, K.F.; Cinco, T.A.; Archevarahuprok, B.; Vo, V.H.; Gunawan, D.; Han, S. Observed and modelled temperature and precipitation extremes over Southeast Asia from 1972 to 2010. Int. J. Clim. 2018, 38, 3013–3027. [Google Scholar] [CrossRef]
- Mahmud, M.R.; Hashim, M.; Matsuyama, H.; Numata, S.; Hosaka, T. Spatial Downscaling of Satellite Precipitation Data in Humid Tropics Using a Site-Specific Seasonal Coefficient. Water 2018, 10, 409. [Google Scholar] [CrossRef]
- Behrangi, A.; Khakbaz, B.; Jaw, T.C.; AghaKouchak, A.; Hsu, K.; Sorooshian, S. Hydrologic evaluation of satellite precipitation products over a mid-size basin. J. Hydrol. 2011, 360, 225–237. [Google Scholar] [CrossRef]
- Zhang, Y.; Li, Y.; Ji, X.; Luo, X.; Li, X. Fine-Resolution Precipitation Mapping in a Mountainous Watershed: Geostatistical Downscaling of TRMM Products Based on Environmental Variables. Remote Sens. 2018, 10, 119. [Google Scholar] [CrossRef]
- Mahmud, M.R.; Numata, S.; Hosaka, T.; Matsuyama, H.; Hashim, M. Preliminary study for effective seasonal downscaling of TRMM precipitation data in Peninsular Malaysia: Local scale validation using high resolution areal precipitation. Remote Sens. 2015, 7, 4092–4111. [Google Scholar] [CrossRef]
- Hou, A.Y.; Kakar, R.K.; Neeck, S.; Azarbarzin, A.A.; Kummerow, C.; Kojima, M.; Oki, R.; Nakamura, K.; Iguchi, T. The global precipitation measurement mission. Bull. Amer. Meteor. Soc. 2014, 95, 701–722. [Google Scholar] [CrossRef]
- Mahmud, M.R.; Hashim, M.; Reba, M.N.M. How effective is the new generation of GPM satellite precipitation in characterizing the rainfall variability over Malaysia? Asia-Pac. J. Atmos. Sci. 2017, 53, 375. [Google Scholar] [CrossRef]
- Duan, Z.; Bastiaanssen, W.G.M. First results from Version 7 TRMM 3B43 precipitation product in combination with a new downscaling-calibration procedure. Remote Sens. Environ. 2013, 131, 1–13. [Google Scholar] [CrossRef]
- Chen, F.; Liu, Y.; Liu, Q.; Li, X. Spatial downscaling of TRMM 3B43 precipitation considering spatial heterogeneity. Int. J. Remote Sens. 2014, 35, 3074–3093. [Google Scholar] [CrossRef]
- Ulloa, J.; Ballari, D.; Campozano, L.; Samaniego, E. Two-step downscaling of TRMM 3B43 V7 precipitation in contrasting climatic regions with sparse monitoring: The case of Ecuador in tropical South America. Remote Sens. 2017, 9, 758. [Google Scholar] [CrossRef]
- Shi, Y.; Song, L. Spatial Downscaling of Monthly TRMM Precipitation Based on EVI and Other Geospatial Variables Over the Tibetan Plateau From 2001 to 2012. Mt. Res. Dev. 2015, 35, 180–194. [Google Scholar] [CrossRef]
- Hunink, J.E.; Immerzeel, W.W.; Droogers, P. A high-resolution precipitation 2-step mapping procedure (HiP2P): Development and application to a tropical mountainous area. Remote Sens. Environ. 2014, 140, 179–188. [Google Scholar] [CrossRef]
- Sharifi, E.; Saghafian, B.; Steinacker, R. Downscaling satellite precipitation estimates with multiple linear regression, artificial neural networks, & spline interpolation techniques. J. Geo. Res. Atmos. 2019, 124, 780–805. [Google Scholar]
- Park, N.-W. Spatial downscaling of TRMM precipitation using geostatistics and fine scale environmental variables. Adv. Meteorol. 2013, 2013, 237126. [Google Scholar] [CrossRef]
- Ceccherini, G.; Ameztoy, I.; Hernández, C.P.R.; Moreno, C.C. High-resolution precipitation datasets in South America and West Africa based on satellite-derived rainfall, enhanced vegetation index and digital elevation model. Remote Sens. 2015, 7, 6454–6488. [Google Scholar] [CrossRef]
- Ryo, M.; Valeriano, O.C.S.; Kanae, S.; Ngoc, T.D. Temporal downscaling of daily gauged precipitation by application of a satellite producto for flood simulation in a poorly gauged basin & its evaluation with multiple regression analysis. J. Hydrometeorol. 2014, 15, 563–580. [Google Scholar]
- Chen, F.; Gao, Y.; Wang, Y.; Qin, F.; Li, X. Downscaling satellite-derived daily precipitation products with an integrated framework. Int. J. Climatol. 2018, 39, 1287–1304. [Google Scholar] [CrossRef]
- Lopez, P.L.; Immerzeel, W.W.; Sandoval, E.A.R.; Sterk, G.; Schellekens, J. Spatial downscaling of satellite-based precipitation and its impact on discharge simulations in the Magdalena River basin in Colombia. Front. Earth Sci. 2018, 6. [Google Scholar] [CrossRef]
- Bachok, M.F.; Shamsudin, S.; Abidin, R.A.; Jeevaragagam, P.; Harun, S. Assessment of observational data in Peninsular Malaysia for verification of windstrom-prroducing thunderstorms nowcast systems. Int. J. Appl. Environ. Sci. 2017, 12, 2107–2122. [Google Scholar]
- Manzanas, R. Statistical downscaling in the tropics can be sensitive to reanalysis choice: A Case Study for Precipitation in the Philippines. J. Clim. 2015, 28, 4171–4184. [Google Scholar] [CrossRef]
- Gusain, A.; Vittal, H.; Kulkarni, S.; Ghosh, S.; Karmakar, S. Role of vertical velocity in improving finer scale statistical downscaling for projection of extreme precipitation. Theor. Appl. Clim. 2018, 137, 791–804. [Google Scholar] [CrossRef]
- Mass, C.F.; Dempsey, D.P. A One-Level, Mesoscale Model for Diagnosing Surface Winds in Mountainous and Coastal Regions. Mon. Weather. Rev. 1985, 113, 1211–1227. [Google Scholar] [CrossRef]
- Li, X.; Sui, C.H.; Lau, K.-M. Precipitation efficiency in the tropical deep convective region: A 2-D cloud resolving modeling study. J. Met. Japan 2002, 80, 205–212. [Google Scholar]
- Narsey, S.; Jakob, C.; Singh, M.S.; Bergemann, M.; Louf, V.; Protat, A.; Williams, C. Convective Precipitation Efficiency Observed in the Tropics. Geophys. Res. Lett. 2019, 46, 13574–13583. [Google Scholar] [CrossRef]
- Wolff, D.B.; Marks, D.A.; Amitai, E.; Silberstein, D.S.; Fisher, B.L.; Tokay, A.; Wang, J.; Pippitt, J.L. Ground Validation for the Tropical Rainfall Measuring Mission (TRMM). J. Atmospheric Ocean. Technol. 2005, 22, 365–380. [Google Scholar] [CrossRef]
- Trindade, L.D.L.; Scheibe, L.F. Water Management: Constraints to and Contributions of Brazilian Watershed Management Committees; Ambiente & Sociedade: Sao Paulo, Brazil, 2019; Volume 22. [Google Scholar]
- Miyan, M.A. Droughts in Asian Least Developed Countries: Vulnerability and sustainability. Weather. Clim. Extremes 2015, 7, 8–23. [Google Scholar] [CrossRef]
- United Nation. Ready for the Dry Years, Building Resilience to Drought in South-East Asia; United Nations Publication: Bangkok, Thailand, 2019. [Google Scholar]
- Gariano, S.F.; Guzzeti, F. Landslides in a changing climate. Earth-Sci. Rev. 2016, 162, 227–252. [Google Scholar] [CrossRef]
- Hayward, D.; Clarke, R.T. Relationship between rainfall, altitude and distance from the sea in the Freetown Peninsula, Sierra Leone. Hydrol. Sci. 1996, 41, 377–384. [Google Scholar] [CrossRef]
- Yamanaka, M.D. Climate-biogeosphere-humanosphere interaction. Conference: 1st Int. School on Equatorial Atmosphere (ISQUAR). In Proceedings of the 98th Symposium on Sustainable Humanosphere, Bandung, Indonesia, 18–22 March 2019; Available online: http://situs.opi.lipi.go.id/hss2019/ (accessed on 20 December 2019).
- Houze, R.A.; Geotis, S.G.; Marks, F.D.; West, A.K. Winter monsoon convection in the vicinity of North Borneo.Part I: Structure and time variation of the clouds and precipitation. Mon. Weather. Rev. 1981, 109, 1595–1614. [Google Scholar] [CrossRef]
- Wu, P.; Hara, M.; Hamada, J.; Yamanaka, M.D.; Kimura, F. Why a large amount of rain falls over the sea in the vicinityof western Sumatra Island during nighttime. J. Appl. Meteor. Climatol. 2009, 48, 1345–1361. [Google Scholar] [CrossRef]
- Alfahmi, F.; Boer, R.; Hidayat, R.; Perdinan Sopaheluwakan, A. The impact of of concave coastline on rainfall offshore distribution over Indonesian Maritime Continent. Sci. World J. 2019, 2019, 6839012. [Google Scholar] [CrossRef] [PubMed]
- Yamanaka, M.D. Physical climatology of Indonesian Maritime Continent: An outline to comprehend observational studies. Atmos. Res. 2016, in press. [Google Scholar] [CrossRef]
- Hasager, C.B. Offshore winds mapped from satellite remote sensing. WIREs Energy Environ. 2014, 3, 594–603. [Google Scholar] [CrossRef]
- Bentamy, A.; Denis, C.-F. Gridded surface wind fields from Metop/ASCAT measurements. Int. J. Remote Sens. 2012, 33, 1729–1754. [Google Scholar] [CrossRef]


| Stations | Name | Locations | Elevation (m) | ||
|---|---|---|---|---|---|
| E | N | Average | Maximum (2 km Radius) | ||
| 4529001 | Rumah Pam Paya, Pasir Raja | 102.98 | 4.57 | 70 | 200 |
| 4631001 | Bandar Al-Muktafi Billah Shah | 103.19 | 4.62 | 60 | 170 |
| 4634085 | Pusat Kesihatan Paka | 103.44 | 4.64 | 11 | 12 |
| 4730002 | Kg. Surau | 103.09 | 4.74 | 38 | 210 |
| 4734079 | SMK Sultan Omar | 103.42 | 4.77 | 11 | 13 |
| 4834001 | Klinik Bidan Kuala Abang | 103.31 | 4.82 | 12 | 24 |
| 4833078 | Rumah Pam Delong | 103.42 | 4.83 | 22 | 23 |
| 4832011 | Jerangau | 103.20 | 4.85 | 20 | 80 |
| No | Station Name | Lat. | Long. |
|---|---|---|---|
| 1 | Bayan Lepas | 5.30 | 100.48 |
| 2 | Subang | 3.15 | 101.70 |
| 3 | Pasir Gudang | 1.45 | 103.88 |
| 5 | Malacca | 2.20 | 102.25 |
| 6 | Ipoh | 4.62 | 101.12 |
| 7 | Johor Bahru | 1.47 | 103.77 |
| 8 | Alor Setar | 6.12 | 100.37 |
| 9 | Langkawi | 6.32 | 100.37 |
| 10 | Kota Bahru | 6.12 | 102.25 |
| 11 | KLIA | 2.82 | 101.80 |
| 12 | Seremban | 2.72 | 101.93 |
| 13 | Kuantan | 3.80 | 103.32 |
| 14 | Georgetown | 5.42 | 100.33 |
| 15 | Kangar | 6.43 | 100.20 |
| 16 | Cukai | 4.25 | 103.42 |
| 17 | Kuala Terengganu | 5.33 | 103.12 |
| 18 | Mersing | 2.43 | 103.83 |
| Stations No. | Name | Root Mean Square Error (mm/d) | Bias Ratio (Sat/Rg) | ||||||
|---|---|---|---|---|---|---|---|---|---|
| Wet Season (n = 21) | Normal Seaso(n = 18) | Wet Season (n = 21) | Normal Season (n = 18) | ||||||
| Raw | Downscale | Raw | Downscale | Raw | Downscale | Raw | Downscale | ||
| 4529001 | Rumah Pam Paya | 47 | 24 | 23 | 15 | 0.44 | 0.78 | 0.48 | 0.88 |
| 4631001 | *Bandar AMBS | 34 | 51 | 13 | 10 | 0.33 | 0.71 | 0.38 | 0.65 |
| 4832011 | Jerangau | 43 | 30 | 29 | 25 | 0.39 | 0.69 | 0.34 | 0.65 |
| 4730002 | Kg. Surau | 49 | 34 | 14 | 12 | 0.35 | 0.7 | 0.44 | 0.88 |
| 4734079 | SMK Sultan Omar | 34 | 24 | 12 | 10 | 0.33 | 0.71 | 0.31 | 0.71 |
| 4834001 | Klinik Bidan Kuala Abang | 26 | 23 | 11 | 9 | 0.62 | 1.12 | 0.3 | 0.61 |
| 4833078 | Rumah Pam Delong | 45 | 28 | 15 | 11 | 0.38 | 0.63 | 0.31 | 0.63 |
| 4634085 | Pusat Kesihatan Paka | 33 | 21 | 8 | 6 | 0.33 | 0.65 | 0.28 | 0.63 |
© 2020 by the authors. Licensee MDPI, Basel, Switzerland. This article is an open access article distributed under the terms and conditions of the Creative Commons Attribution (CC BY) license (http://creativecommons.org/licenses/by/4.0/).
Share and Cite
Mahmud, M.R.; Mohd Yusof, A.A.; Mohd Reba, M.N.; Hashim, M. Mapping the Daily Rainfall over an Ungauged Tropical Micro-Watershed: A Downscaling Algorithm Using GPM Data. Water 2020, 12, 1661. https://doi.org/10.3390/w12061661
Mahmud MR, Mohd Yusof AA, Mohd Reba MN, Hashim M. Mapping the Daily Rainfall over an Ungauged Tropical Micro-Watershed: A Downscaling Algorithm Using GPM Data. Water. 2020; 12(6):1661. https://doi.org/10.3390/w12061661
Chicago/Turabian StyleMahmud, Mohd. Rizaludin, Aina Afifah Mohd Yusof, Mohd Nadzri Mohd Reba, and Mazlan Hashim. 2020. "Mapping the Daily Rainfall over an Ungauged Tropical Micro-Watershed: A Downscaling Algorithm Using GPM Data" Water 12, no. 6: 1661. https://doi.org/10.3390/w12061661
APA StyleMahmud, M. R., Mohd Yusof, A. A., Mohd Reba, M. N., & Hashim, M. (2020). Mapping the Daily Rainfall over an Ungauged Tropical Micro-Watershed: A Downscaling Algorithm Using GPM Data. Water, 12(6), 1661. https://doi.org/10.3390/w12061661