Article

Elemental Contaminants in Surface Sediments from Jiulong River Estuary, China: Pollution Level and Ecotoxicological Risk Assessment

1
CAS Key Laboratory of Urban Pollutant Conversion of Urban Environment and Health, Institute of Urban Environment, Chinese Academy of Sciences, Xiamen 361021, China
2
University of Chinese Academy of Sciences, Beijing 100049, China
3
Nuclear Institute for Food and Agriculture (NIFA), G.T. Road, Tarnab, Peshawar 25000, Pakistan
4
Department of Chemistry, SUNY College of Environmental Science and Forestry Syracuse, Syracuse, NY 13210, USA
5
Graduate Institute of Environmental Engineering, National Taiwan University, Taipei 10617, Taiwan
*
Authors to whom correspondence should be addressed.
Water 2020, 12(6), 1640; https://doi.org/10.3390/w12061640
Submission received: 9 April 2020 / Revised: 28 May 2020 / Accepted: 3 June 2020 / Published: 8 June 2020
(This article belongs to the Section Water Quality and Contamination)

Abstract

:
Estuaries, being the transitional zones between freshwater and marine environments, are important for protecting and rehabilitating the aquatic environments. Sediments from freshwater and marine environments were studied in Jiulong River Estuary (JRE) in different years for rare earth elements (REEs) and some environmentally important metal and metalloid elements (MMEs). The concentration of REEs ranged from 0.11 (Tm) to 296.20 mg kg−1 (Ce), while that of MMEs ranged from 0.40 (Cd) to 86,000 mg kg−1 (Al). The temporal analysis indicated an increase of both REEs and MMEs contaminants from 2012 to 2018. Fractionation of REEs and Ce and Eu anomalies indicated natural weathering, erosion processes and changes in redox chemistry at the sampling sites. Spatial structure analysis showed relatively higher levels of both REEs and MMEs in the freshwater sediments. These variations among the sampling sites indicated different land use and anthropogenic activities. The values of enrichment factor (EF) and geoaccumulation index (Igeo) indicated anthropogenic sources of accumulation, while, ecological risk assessment (Eix) and potential ecological risk index (PERI) indicated potential hazards for biota due to the accumulation of Pb, Zn and As elements.

1. Introduction

Estuaries are the transitional zones between freshwater and marine environments and act as sinks for the organic and inorganic contaminants resulting from anthropogenic as well as geogenic influences [1]. However, the sediments are the important component of the estuarine environment that act as a major sink for different pollutants especially the metals due to their specific physicochemical properties [1,2]. Many studies have put forward the concentration levels and associated risks of elemental contaminants in the aquatic environments around the world [2,3,4,5,6,7,8]. The increase in population and anthropogenic activities such as, aquaculture, industrial activities, mining, port operations and sewage discharge have caused adverse effects on biodiversity and food webs [2,9,10,11,12]. The complex hydrodynamics play an important role in the transportation and resuspension of suspended solids to influence the distribution and transformation of metals in an estuary [13,14]. Physicochemical changes such as temperature, pH, and salinity in the estuarine environment influence the absorption and release of metals back into the water bodies to cause secondary pollution [15,16]. According to a report, Chinese rivers deposited 17.05 million tons of pollutants, including 9310 tons of Pb; 17.6 tons of Hg and 2843 tons As into sea during 2012 [17]. Nevertheless, the concentration alone, especially, that of metals is not a good indicator to predict the bioavailability and associated toxicities, therefore, an insight about the distribution and speciation of the metals is necessary to understand the underlying impacts and potential risks [18].
Among the elemental contaminants, metal and metalloid element (MMEs) and the rare earth elements (REEs) are of special importance due to their extensive usage in manufacturing and production industry, as additives in agriculture and biomedicine and environmental implications. REEs are a group of coherent 17 elements from atomic number 57 to 71 on the periodic table with chemical properties varying in a systematic way between La and Lu [7]. Due to their similar properties, REEs tend to exist together in geological deposits [19]. Apart from their natural existence, REEs can accumulate in sediments via river runoff, groundwater discharge and atmospheric deposition from industrial sources [5]. China provides, approximately 90% of the total REEs due to their wide usages in the industrial sector at the global scale. Generally, the REEs have low toxicities, however, their long-term accumulation may pose some environmental challenges [7,20]. So far, the information regarding the impact of REEs on human health is scarce, however, animal based studies involving some of the REEs have suggested some level of toxicities leading to inflammation, oxidative stress and vital organ tissue damage [21]. Meanwhile, REEs are also seen as beneficial in promoting animal health and crop productivity and are also used in animal feed [21]. REEs are environmentally interesting due to their trivalent cationic behavior at low temperature that tend to decrease with atomic number and their coherent existence in the aquatic environment [5]. Furthermore, sensitivity of REEs to pH, redox condition, adsorption and desorption behavior make them suitable for use as geochemical markers to predict changes in water and sediment environments [7]. Due to their closely related physicochemical properties, the distribution of REEs can be represented in normalized pattern as anomalous concentration of individual REEs [5]. A positive or negative anomaly of an element indicates its relatively higher or lower concentration with respect to other REEs [5].
Compared with the REEs, MMEs that include but are not limited to heavy metals are well known for their deleterious effects on humans, aquatic and terrestrial life due to their diverse sources, inherent toxicity, persistence in environment and bioaccumulation properties [22,23]. Some of these elements (Cu, Zn, Fe, Mn, Mo, Ni and Co) at low concentration in the growth medium act as essential micronutrients, however, they become toxic after exceeding critical concentration levels [24]. Both REEs and MMEs are contributed by numerous natural (soil erosion, wind, bioturbation and storms and geological weathering) and anthropogenic activities (mining, transportation, industrial discharge, domestic/urban effluents and agricultural activities) that can pose direct or indirect implications on the environment, living species and human health via the food chain [12,25]. Spontaneous population growth, urbanization and industrialization have immensely contributed towards the MME deposits in the aquatic environments [26] after exposure to the effluents that may have been treated or untreated by the waste water treatment systems. MMEs, such as Cd, Cr, and Cu have been reported to cause fatal illnesses like cancer [27] and even death [28] due to their long-term persistence and high bioaccumulation capacity. In the aquatic environment, sediments serve as a sink for MMEs through ion exchange, particle surface adsorption and co-precipitation [16] and later act as source via sediment desorption by a reduction and oxidation reaction [29]. Environmental factors like pH, cation exchange capacity, salinity levels etc. may play an important role in the mobility of MMEs. Among these, salinity plays the most important role in this regard. [29,30].
The present study was aimed to study the status, sources, spatiotemporal distribution, environmental and ecological impacts of REEs and MMEs in the sediments of Jiulong River Estuary (JRE). This was achieved by comparing the freshwater and marine sediment sites for the distribution of REEs and MMEs. Different pollution and risk assessment criteria were used to assess the sediments quality in JRE. Furthermore, different sampling sites were compared for the distribution of REEs and MMEs in spatial and temporal perspectives.

2. Materials and Methods

2.1. Description of the Study Area

The study area encompassing Jiulong River (JLR) and estuary is situated in a subtropical monsoon zone in the developed area of Fujian province. JLR is the second longest river of Fujian Province with a catchment area of 14,741 km2. The river divides into North River and West River distributaries and meets the needs of drinking water, livestock and agriculture farming and activities of a human population of around 8.0 million [31,32]. Eventually, the two distributaries of JLR flowing through animal husbandry, industry and large metropolitan areas, enter a typical subtropical macro-tidal estuary (JRE) on the southwest coast of Taiwan Strait [31]. Therefore, the estuarine area of JLR and the proceeding marine environment provide a good source of contrasting aquatic environments especially for salinity. JLR serves as a major source of water supply for domestic use, agriculture and industrial activities for over five million residents in south east of the province [32] including the city of Xiamen with a population of 3.67 million and population density of 2333 per km2 [32]. Due to rapid economic and population growth along JLR, the surrounding aquatic environment has been subjected to high loads of sewage and other inflow from industry, household and agriculture [32]. Many recent studies have shown that because of the fast economic growth and urbanization in the watershed of JLR, the water pollution has become a serious problem for humans and aquatic life in this area [31,33].

2.2. Sample Collection and Physicochemical Characterization

A total of 46 surface sediment (top 5 cm layer) samples were collected from freshwater sites A4, A5 and A6 and marine water sites JY0, JY1 and JY3 along JRE (Figure 1) in September 2012, January and June 2013, February, June and December 2014, July 2015 and November 2018 [34]. Three subsamples were collected in triplicate by using Van Veen grab sampler from each sampling site. The subsamples were composited in a bucket, homogenized and cleaned from stones, pebbles and any debris. A sediment sample aliquot (1 kg) was stored in polyethylene air-tight bags and transported to laboratory under refrigerated condition. In laboratory, the sample was thoroughly mixed and an aliquot (50 g) of sediment sample taken in a 50 mL falcon tube was frozen at −50 °C for 48 h. Subsequently, the frozen sample was freeze-dried (Beijing Boyikang Laboratory Instrument Co., Ltd., Beijing, China) and ground by agate mortar and sieved by using a nylon sieve of <2 mm mesh size.
The pulverized sediment samples were used for physicochemical characterization. The C, N and S contents were analyzed by a micro elemental (CNHS/O) analyzer (Vario MAX; Elementar, Hanau, Germany). This was achieved by making sediment suspension (1/10 m/v) with ultrapure Milli-Q water. The suspension was subjected to 2 h of horizontal shaking. Subsequently, electrical conductivity (EC) and pH were determined by multiparameter meter (WTW, Multi 3630 IDS SET G, Weilheim, Germany), while Nitrite (NO2-N), nitrate (NO3-N), ammonia (NH4-N) and phosphate (PO4-P) were determined by using ion chromatography system (ICS 3000, Dionex, Sunnyvale, CA, USA).

2.3. Reagent and Materials

Certified reference standard stock solution GNM-M27867-2013 for MMEs including vanadium (V), chromium (Cr), manganese (Mn), cobalt (Co), nickel (Ni), copper (Cu), zinc (Zn), arsenic (As), molybdenum (Mo), cadmium (Cd), antimony (Sb), caesium (Cs), lead (Pb), thallium (Tl), aluminum (Al) and GNM-M16181-2013 for REEs including lanthanum (La), cerium (Ce), praseodymium (Pr), neodymium (Nd), samarium (Sm), europium (Eu), gadolinium (Gd), terbium (Tb), dysprosium (Dy), holmium (Ho), erbium (Er), thulium (Tm), ytterbium (Yb) and lutetium (Lu) were obtained from the National Centre of Analysis and Testing for Nonferrous Metal and Electronic Materials (NCATN), China. Working standard solution was prepared in 2% nitric acid (HNO3) for calibration purposes. HNO3 and hydrochloric acid (HCl) of analytical grade were purchased from Merck KGaA (Darmstadt, Germany). Ultrapure water was obtained from Milli-Q system (Millipore, Burlington, MA, USA).

2.4. Extraction and Analysis of Metals

Fluoropolymer digestion tubes were sequentially soaked/washed in HNO3 (10% v/v) followed by HCl and finally rinsed with ultrapure Milli-Q water and oven dried [35] for digestion of sediment samples. Prior to digestion, the tubes were cleaned with 10 mL aqua regia (1:3 v/v mixture of HNO3:HCl) at 90 °C for 2 h and rinsed with ultrapure Milli-Q water following the recommendation of the USEPA 3051A method [36].
Digestion of the sediment sample was performed by following the USEPA 3051A microwave method [36] by using a microwave system (MARS 5 version 194A05, CEM Corporation, Matthews, NC, USA). An aliquot (0.1 g) of the freeze-dried sediment sample along with freshly prepared aqua regia (10 mL) were sequentially added to the digestion tube and allowed to react at room temperature for 30 min. Subsequently, the digestion was performed in the sealed digestion tube in a programmed microwave with temperature ramp to 200 °C (20 °C/min) for 10 min, followed by hold for 45 min at 200 °C. After cooling, the digestion mixture was visually observed for the absence of visible particles. The particle free mixture was recuperated, filtered by using a Millipore filter (0.45 µm) and diluted to 50 mL with nitric acid (2%). The samples were stored at 4 °C prior to further analysis. The concentration of selected MMEs (V, Cr, Mn, Co, Ni, Cu, Zn, As, Mo, Cd, Sb, Cs, Pb, Tl and Al) and REEs (La, Ce, Pr, Nd, Sm, Eu, Gd, Tb, Dy, Ho, Er, Tm, Yb and Lu) was determined by using inductively coupled plasma mass spectrometry (ICP-MS, Agilent 7500CX, Agilent Technologies, Santa Clara, CA, USA).

2.5. Quality Assurance and Quality Control (QA/QC)

Quality assurance and quality control (QA/QC) was achieved by analyzing samples in triplicate along with method blanks and instrumental blanks to monitor contamination of target elements. Certified reference material (GBW07309, GSD-9) with known concentration of the elements, obtained from General Administration of Quality Supervision, Inspection and Quarantine of China, Beijing, China were used to calculate recoveries and to eliminate batch-specific errors [37]. The recoveries of the elements ranged from 70% to 113% and the inter-day precision calculated as % relative standard deviation (%RSD) was < 10%. All the elements demonstrated a linear response with R2 > 0.998 for majority of elements over a calibration range from 0.5 to 100 μg L−1 (Table S1).

2.6. Characteristic Parameters of Rare Earth Elements (REEs)

The characteristic REE parameters included ∑REEs (total concentration of REEs), light REEs/heavy REEs (∑LREEs/∑HREEs) and light and heavy REEs ratio (La/Yb)N. (La/Yb)N represented the normalized fractionation of REEs, where, the subscription N stands for chondrite normalized value [38]. The anomaly degree of Ce and Eu, represented as δCe and δEu, respectively, were calculated by using Equations (1) and (2) [38].
δ Ce = ( C e ) N ( L a ) N × ( P r ) N
δ Eu = ( E u ) N ( S m ) N × ( G d ) N
The anomaly degree of δCe and δEu can be classified as: positive anomalies (1.05 < δCe or δEu), no significant anomalies (0.95 ≤ δCe or δEu ≤ 1.05) and negative anomalies (δCe or δEu < 0.95) [39].

2.7. Pollution and Ecological Risk Assessment

Enrichment factor (EF) was used to differentiate between natural and anthropogenic sources of contamination in the environment [40]. Al was used as the reference element. EF is described in Equation (3).
EF = ( x A l )   s a m p l e ( x A l )   b a c k g r o u n d
where ( x / A l ) refers to the ratio of a given metal x to Al in the sediment sample and that of background concentration in the Earth’s crust [41], respectively. The values of EF were used to classify sediment samples into seven groups: EF < 1, <3, 3–5, 5–10, 10–25, 26–50 and >50 indicated no enrichment, minor enrichment, moderate enrichment, moderate-to-severe enrichment, severe enrichment, very severe enrichment and extremely severe enrichment, respectively [42].
The current status of pollution in sediments was studied with respect to background level of the Earth’s crust [41] as geoaccumulation index (Igeo) by using Equation (4) [37].
I g e o = l o g 2 ( C x 1.5 × B x )
where Cx and Bx are the concentrations of element “x” in samples and geological background (Earth’s crust [41]), respectively. Factor 1.5 was used to adjust the possible variation in the background concentration. The values Igeo were categorized into class 0 (Igeo ≤ 0, unpolluted); class I (0 < Igeo ≤ 1, weakly polluted), class II (1 < Igeo ≤ 2, moderately polluted), class III (2 < Igeo ≤ 3, moderately to heavily polluted), class IV (3 < Igeo ≤ 4, heavily polluted), class V (4 < Igeo ≤ 5, heavily to extremely polluted) and class VI (Igeo > 5, extremely polluted).
Different pollution indices including contamination factor (Cfx), integrated pollution index (IPD) and pollution loading index (PLI) were evaluated for each element by using Equations (5) to (7), respectively [42,43].
C f x = x s a m p l e x b a c k g r o u n d
I P D = x = 1 n C f x
P L I = ( x = 1 n C f x ) 1 / n
Cfx was used to compare the contamination by individual heavy metal element (x) in the sediment samples. Values of Cfx < 1; 1 ≤ Cfx < 3; 3 ≤ Cfx < 6 and Cfx ≥ 6 indicate low, moderate, considerable and very high degree of sediment contamination compared with the background concentrations (Earth’s crust [41]) [42,43]. On the other hand, IPD provides a polymetallic contamination index, where the categories IPD < 5; 5 ≤ IPD < 10; 10 ≤ IPD < 20 and IPD ≥ 20 indicate low, moderate, considerable and high levels of contamination, respectively [42,43]. Similarly, PLI was used to indicate the quality of sediments on the basis of multiple metal contaminants, where the categories PLI = 0; 0 < PLI ≤ 1; 1 < PLI ≤ 2; 2 < PLI ≤ 3; 3 < PLI ≤ 4; 4 < PLI ≤ 5 and PLI > 5 indicated below background concentration (Earth’s crust [41]), unpolluted, unpolluted to moderately polluted, moderately polluted, moderately to highly polluted, highly polluted and very highly polluted sediments, respectively [42,43].
The ecological impact of heavy metal and metalloid elements was assessed by using ecological risk index (Eix) and potential ecological risk index (PERI) [44] by using Equations (8) and (9), respectively. The indices were calculated only for heavy metals (Cd, Cr, Cu, Mn, Ni, Pb and Zn) and As metalloid.
E i x = T r x × C f x
P E R I = x = 1 n E i x
Eix gives the ecological risk posed by a single metal element by using toxic response factor (Trx) of the respective metal element, while, PERI provides a comprehensive information regarding synergy, toxic level, concentration and the ecological effect of the heavy metals and metalloid. The Tr values for the calculation of Eix and PERI were 10, 30, 2, 5, 1, 6, 5 and 1 for As, Cd, Cr, Cu, Mn, Ni, Pb and Zn, respectively [45]. Eix values Eix < 40; 40 ≤ Eix < 80; 80 ≤ Eix < 160; 160 ≤ Eix < 320 and Eix ≥ 320 were categorized as low risk, moderate risk, considerable risk, high risk and very high risk, respectively. Whereas the PERI values PERI < 65; 65 ≤ PERI < 130; 130 ≤ PERI < 260 and PERI ≥ 260 were considered as low risk, moderate risk, considerable risk and very high risk, respectively.
The potential impact of MMEs on biota was determined by using the biological adverse effect index (AEI) by using Equation (10) [45].
A E I = [ x ] E R L
where, x is the measured elemental concentration and ERL is effect range-low concentration indicating the lower 10th percentile of the effects of each element [45]. The values of ERL were 81, 20.9, 34, 150, 8.2, 1.2 and 46.7 for Cr, Ni, Cu, Zn, As, Cd and Pb, respectively. The value of AEI ≤ 1 indicates that the concentration of metal is insufficient to produce any adverse on biota, while AEI ≥ 1 indicate the sufficiency of metal contaminants to produce adverse effects on biota [45].

2.8. Statistical Analysis

The status of REEs and MMEs at different sites and sampling seasons were presented as median and range values calculated in Excel® 2010 (Microsoft Corporation, Redmond, DC, USA). The spatial structure for the distribution of MMEs and REEs across JRE was determined by singular value decomposition (SVD) [46]. This involved the eigenvalue decomposition for rectangular matrix into a product of three matrices to minimize data dimensionality and interpret the data structure. In this study, both, MMEs and REEs were organized as rectangular matrix M of space × time with columns “m” as sampling sites and the rows “n” as the sampling seasons. Matrix M was subject to SVD analysis to yield M = U × Ʃ × VT, where U represented m × m unity matrix, Ʃ as m × n rectangular diagonal matrix constituting non-negative real numbers on diagonal, and V was n × n unity matrix. The diagonal entries (σi) of Ʃ were the singular values of M, while the columns of U and V matrices were the left- and right-singular vectors of M, respectively.
The contribution (Ci) of each sampling site i in the spatial variability of MMEs and REEs was calculated by using Equation (11) [46].
C i = j = 1 n σ j V i j 2 j = 1 n σ j
where Vij was the component i of the j right-singular vector V. The normalized diagonal singular values (σi) of Ʃ matrix were summed in the denominator to give value equal to 1. Hence, the vectors of V were normalized as j = 1 n V i j 2 = 1 so that altogether i = 1 n C i = 1 .
All the calculations for SVD analysis and Ci were performed by using Excel® 2010. For data visualization, Excel® 2010 and Tableau Public 10.4 [47] were used.

3. Results and Discussions

3.1. Physicochemical Characteristics of Sediments

Physicochemical characteristics of freshwater (A4, A5 and A6), marine (JY0, JY1 and JY3) sediments are given in Table S2. Paired t-test (two-tailed) showed that mean grain sizes, silt and sand contents, pH, C, N, S, PO4-P and total P contents were non-significantly different (p ≤ 0.05) between the freshwater and marine sediments. However, significant differences (p ≤ 0.05) were observed for clay content, NO2-N, NO3-N and NH4-N. Marine sediments harbored relatively higher clay contents than the freshwater sediments that ranged from 0.4% to 4.7% and 0% to 3.9%, respectively. The NO2-N and NH4-N contents were higher in the freshwater sediments than the marine sediments, while NO3-N contents were relatively higher in the marine sediments. The levels of EC in freshwater sediments were also significantly low from the marine sediments that ranged from 2.12 to 1779 μS cm−1 and 5950 to 23,800 μS cm−1, respectively.

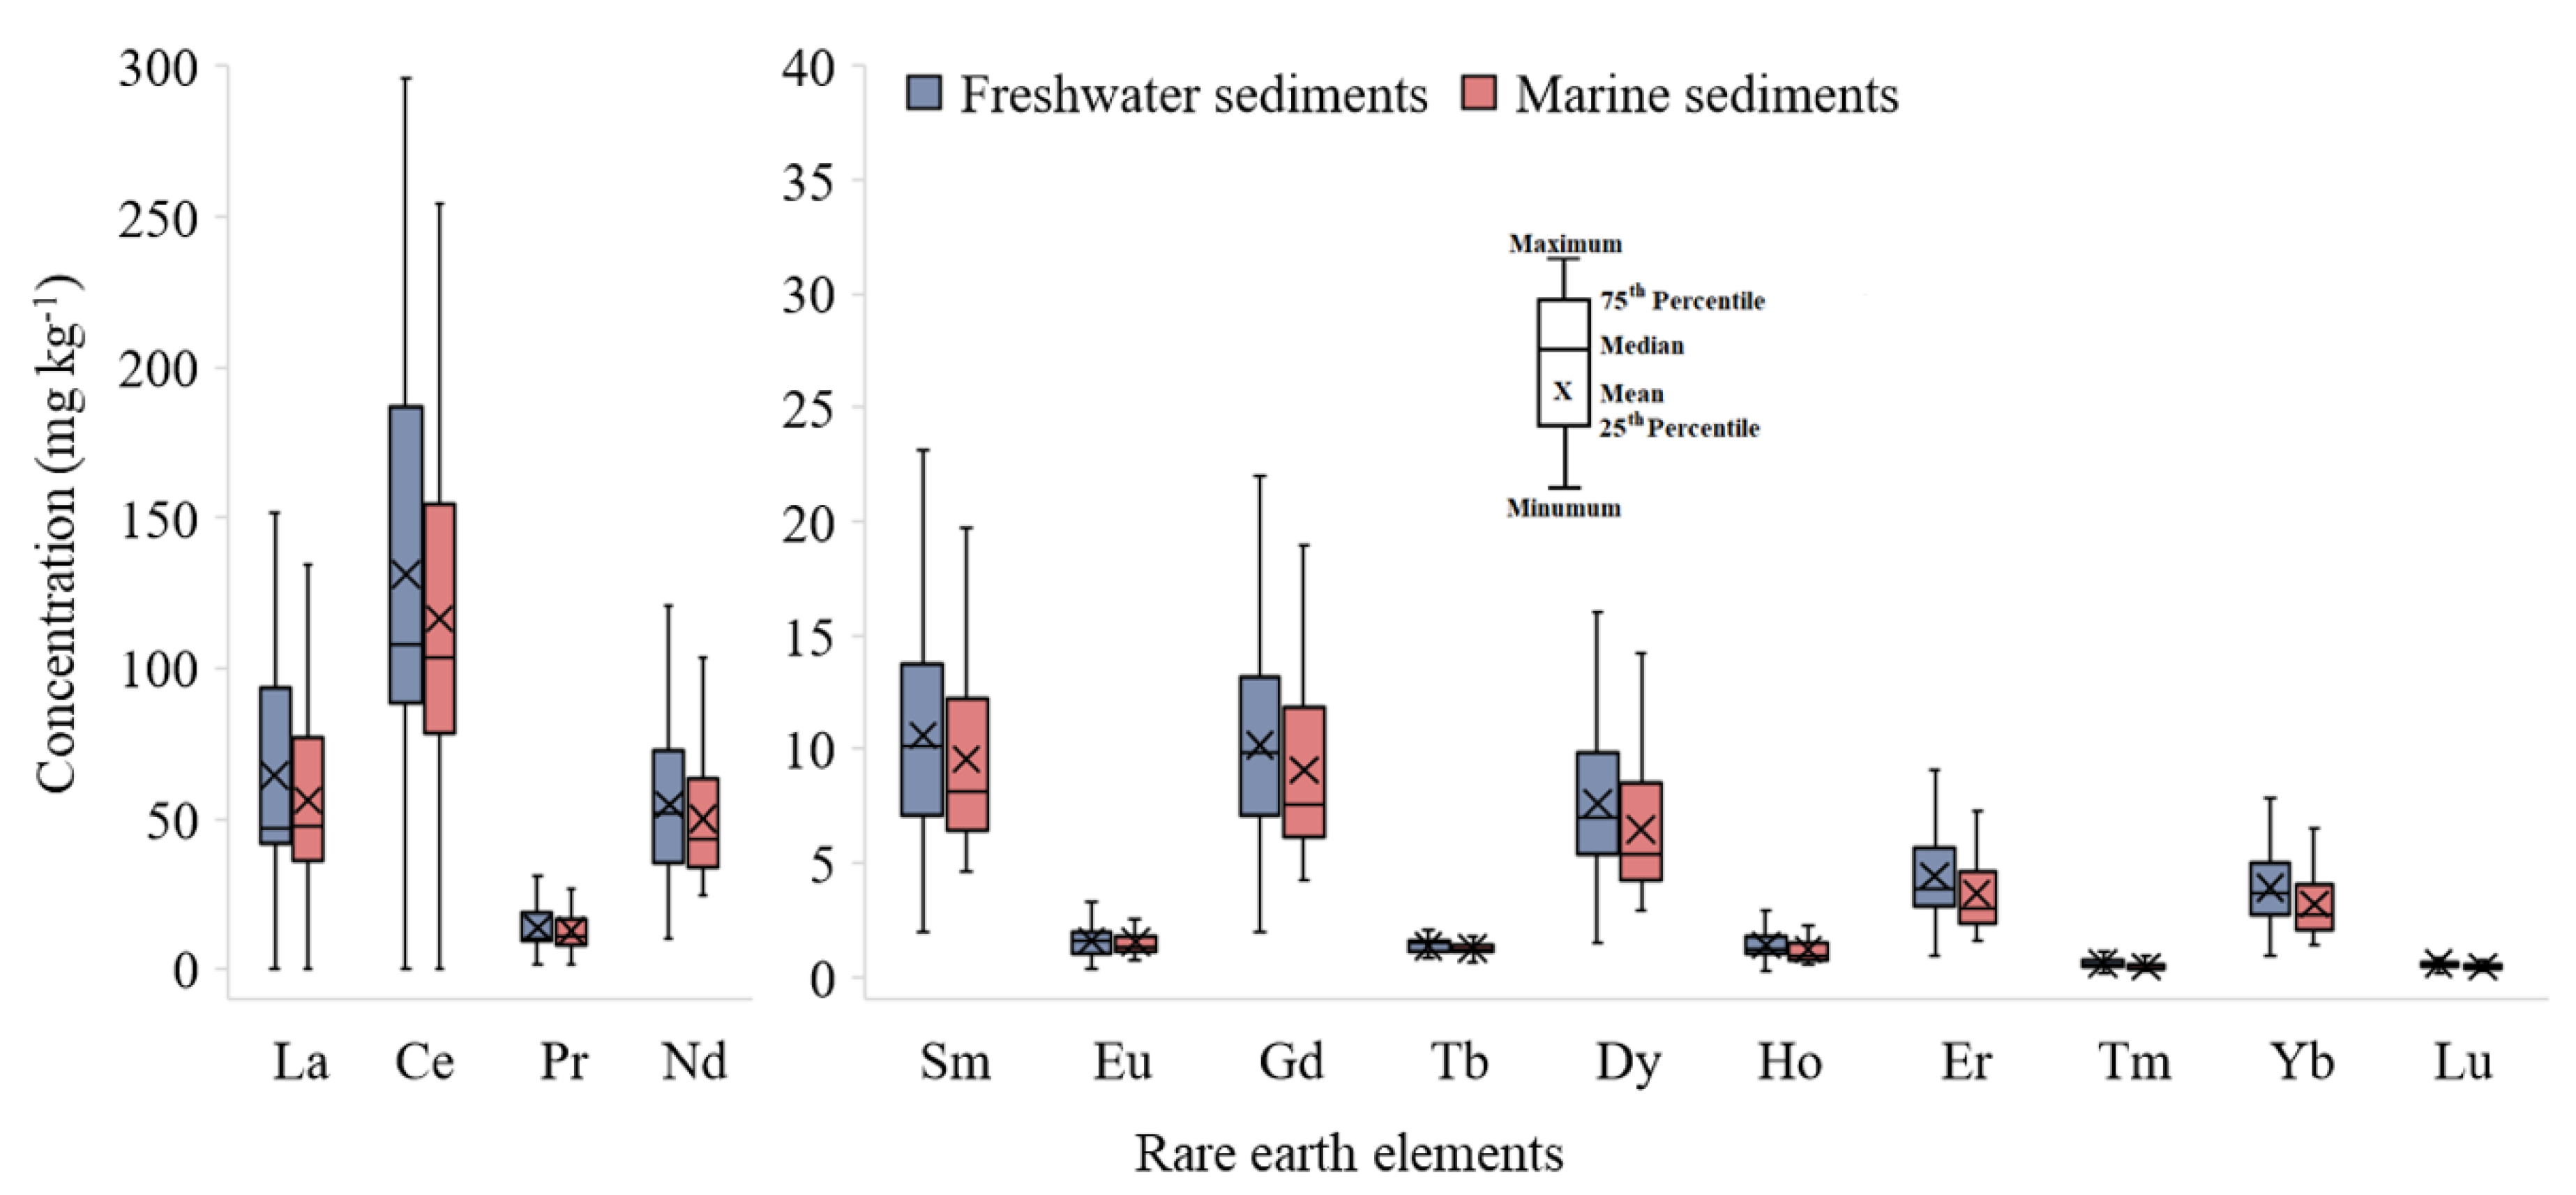
3.2. Status and Characteristics of REEs

The distribution and chondrite normalization patterns of REEs in freshwater sediments and marine sediments are given in Figure 2 and Figure S1. The overlapping interquartile range indicates similarities in the distribution of REEs between the two sediment sources. The detected REEs in both freshwater and marine sediments followed the Oddo-Harkins rule and the finding of Zhang and Gao (2015) [6]. However, the mean concentration of REEs found in our study were generally lower than that reported in the east coast of India [48] and granite rock of Indonesia [49]. The data set for REEs used in this study is given in Table S3.
The median, minimum and maximum concentration of REEs at all sampling sites in different seasons along with total contents of REEs (∑REEs), heavy REEs (∑HREEs), light REEs (∑LREEs) and the indicator ratios of ∑LREEs/∑HREEs, (La/Yb)N, δCe and δEu are given in Table 1. Generally, the concentrations of REEs in this study were higher than other reports given in Table 1 with some exceptions for Jiulong River, Chinese river sediment and crustal average [41,50,51,52,53]. The concentrations of La, Ce, Nd, Yb and Lu were lower in this study than earlier reported in Jiulong River sediments [52], while the concentrations of Pr, Dy and Er were lower than both Jiulong River [52] and Chinese sediment average [53]. Meanwhile, concentration levels of Ho and Tm were lower than Jiulong River [52], Chinese river sediments [53] as well as the crustal average [41]. The values of ∑REEs varied among the sampling sites from 58.2 to 688.2 mg kg−1 with a median of 230.8 mg kg−1, which is lower than Jiulong River [52], but higher than Fujian soil [50], world rivers [51], Chinese rivers [53], chondrite and the Earth’s crust [41]. The proportion of light REEs (∑LREEs) in this study was up to ten times higher than that of heavy REEs (∑HREEs) with median values of 209.7 mg kg−1 and 24.7 mg kg−1, respectively. This was also evident from the ratios of ∑LREEs/∑HREEs that ranged from 2.2 to 12 indicating enrichment of LREE than HREEs. Almost similar pattern of LREE to HREE enrichment was observed in Fujian soil [50], world rivers [51], Jiulong River [52] and Wuding River [38] with ∑LREEs/∑HREEs ratios 10.5, 9.0, 8.5 and 9.6, respectively. However, relatively lower mean values of ∑LREEs/∑HREEs ratio were reported for Chinese rivers (6.6) [53], chondrite (1.8) and Earth’s crust (7.7) [41]. Likewise, the chondrite normalized La/Yb ratio, which is considered as an indicator for erosion in the riverine systems [54] was also used to describe the fractionation between LREEs and HREEs. The (La/Yb)N ranged from 0 to 13.63 with median of 12.1 to indicate significant enrichment of LREEs compared with HREEs. According to Longjiang et al. (2010), higher (La/Yb)N values can be attributed to erosion as well as deposition of LREEs into rivers resulting from anthropogenic activities [38]. Meanwhile, ratio of (La/Sm)N and (Gd/Yb)N also demonstrated the fractionation of LREEs and HREEs, respectively. Values of (La/Sm)N ranged from 0 to 4.7 with median value of 3.9, indicating considerable fractionation of LREEs. The fractionation of LREEs in JRE was relatively lower than Fujian soils [50], Jiulong River average [52] and overall Chinese river average [53] to indicate relatively fresh deposits of LREEs in JRE. However, (La/Sm)N in JRE was almost similar to the world river sediment average [51] and higher than that of chondrite and crustal averages [41] to indicate the anthropogenic sources of LREEs. The ratio of (Gd/Yb)N in JRE sediments ranged from 1.6 to 2.9 with a median value of 2.2 to indicate some degree of fractionation of HREEs as well. In an earlier study, (Gd/Yb)N ratio in offshore sediment along Xiamen bay ranged between 1.28 and 1.92 to indicate non-significant fractionation of HREEs [39]. Almost similar ratios of (Gd/Yb)N were also reported for Fujian soil, world rivers, Jiulong river, chondrite and Earth’s crust’ in earlier studies [41,50,51,52]. Meanwhile, (Gd/Yb)N ratios in our study were somewhat similar to the Chinese river sediment average [53].
The geochemical processes and the REE sources were apportioned by using the anomalies of redox-sensitive Ce and Eu elements [39]. Unlike other REEs, Ce and Eu have tendencies to undergo transformation from their original trivalent state to tetravalent and bivalent states under redox conditions, respectively [55]. The values of δCe ranged from 0.01 to 1.2 with a median of 1.0. These values are almost similar to that of chondrite (0.97) and Earth’s crust (0.9) [41]. Likewise, Fujian soils (1.07), world rivers (1.0), Jiulong river (1.01) and Xiamen bay sediments (1.01) also demonstrated similar δCe [39,50,51,52], while the estimated δCe values were lower for Chinese river sediment (0.72) [53]. These results suggest no significant δCe in the JRE sediments. Eu anomalies (δEu) ranged from 0.4 to 0.6 with a median of 0.5. These values suggest negative δEu in the JRE sediments. The values of δEu were almost similar to that of Jiulong river (0.54) and Chinese river (0.52) [52,53], and slightly higher in Fujian soils (0.65), world river sediment (0.65) and Earth’s crust (0.64) [41,50,51]. However, δEu values for chondrite represented higher Eu anomaly (0.99) [41]. Hu et al. (2019) attributed this behavior of REEs, where relative enrichment of LREEs and negative δEu to strong leaching processes facilitated by warm and humid climatic condition of subtropical region [39]. Furthermore, this pattern of REE occurrence was credited to the presence of allanite, predominantly derived from granitoid rocks [56].

3.3. Status and Characteristics of MMEs

The distribution of MMEs in JRE sediments is given in Figure 3. Similar to REEs, the overlapping interquartile range between the freshwater and marine sediments indicated similarities in the distribution of MMEs. However, the range of distribution of MMEs between the two regions varied, especially in case of Mn, Cr, Sb and Cd elements. Generally, the MMEs in the sediments were detected in the order of the magnitude of Al > Mn > Zn > Pb > V > Cr > Cu > Ni > As > Co > Sc > Mo > Tl > Sb > Cd in freshwater and marine sediments. The data set for MMEs used in this study is given in Table S4.
A comparison of the MMEs in JRE sediments with other studies and background values is given in Table 2. Generally, the comparison of MMEs in JRE with a Fujian average [50] exhibit three patterns: (i) Co can be related with Fujian soil, (ii) Cr, Ni, Mn, As, Cd, Pb and Mn concentrations were slightly higher than Fujian soil and (iii) V, Zn, Cu, Sb and Tl were lower than that of Fujian soil. With respect to the Chinese average [53], the concentrations of Ni, Cu and As were lower, the concentrations of Mn, Zn and Pb were higher, while the concentration of Cr was almost similar. The median concentration of Zn was slightly higher than Chinese average [53], and lower than the world average [57], while, the median Cd concentration was also higher than that of Chinese average [53] and world average [57]. In addition, Cd and Zn in our study was higher than those from the river sediments of South China [9], while Pb and Zn were lower than those in sediments from seaports of NSW, Austria [58]. Since, the city of Xiamen predominantly contains electrical and electronic industry, glass manufacturing [42] and thermal power units. Therefore, the variations in the concentrations of MMEs in JRE with those of Fujian soil, Chinese and world sediment averages can be attributed to specific industrial usage of these elements in the study area. The MMEs in the JRE were generally lower than the marine sediment quality criteria (GB18668-2002) described as MSQ-1, MSQ-2, MSQ-3 [59] and crustal average [41] in Table 2. According to the criteria (GB18668-2002), the initial class (MSQ-1) describes the limit of MMEs below which the marine sediments are considered suitable for aquaculture and human recreation; the secondary class (MSQ-2) aims to regulate the marine area for general industrial use and coastal tourism, while, MSQ-3 describe the standards of marine area suitable for harbors and ocean exploration for special uses. The levels of Pb exceeded MSQ-1 criteria, while, As, Cu, Cd, Cr and Zn in JRE were within the limits of primary standard criteria (MSQ-1; Table 2). The MSQ values for the remaining MMEs were not available for quality assessment.

3.4. Temporal Analysis of REEs and MMEs

The temporal variation in the accumulation of REEs in JRE is presented in Figure 4. Almost all the REEs showed a seasonal increase in successive samplings with the exception of Tb that showed relatively higher contents in the middle sampling seasons. Overall, cumulative REEs also showed a temporal variation with increased contents in the successive seasons. Unlike REEs, no consistent temporal pattern was observed for MMEs in JRE. The relative temporal variation of MMEs in the JRE is given in Figure 5. Generally, the MMEs showed a gradual temporal increase in concentration, with some exceptions. The concentration of Mn increased 1.42 times from September 2012 to July 2015. However, an abrupt increase with more than half of the total concentrations was observed during single sampling season (November 2018). This indicated a significant increase in Mn accumulation during the period from July 2015 to November 2018. Similar pattern of Mn deposition was reported earlier in the sediments from northeastern Gulf of Mexico that was attributed to diagenesis, redox changes and changes in fauna [60,61]. According to Hastings et al. (2016) the solid oxides of Mn (IV) contributed by seawater are reduced to dissolved Mn (II) upon consumption of pore water oxygen. Subsequently, the soluble Mn (II) gets diffused and oxidized into Mn (IV) oxide to complete the redox cycle of Mn in sediments [62]. Ergin attributed the surface enrichment of Mn to the upward migration of Mn2+ caused by a diffusive gradient of the oxic precipitation zone [61].

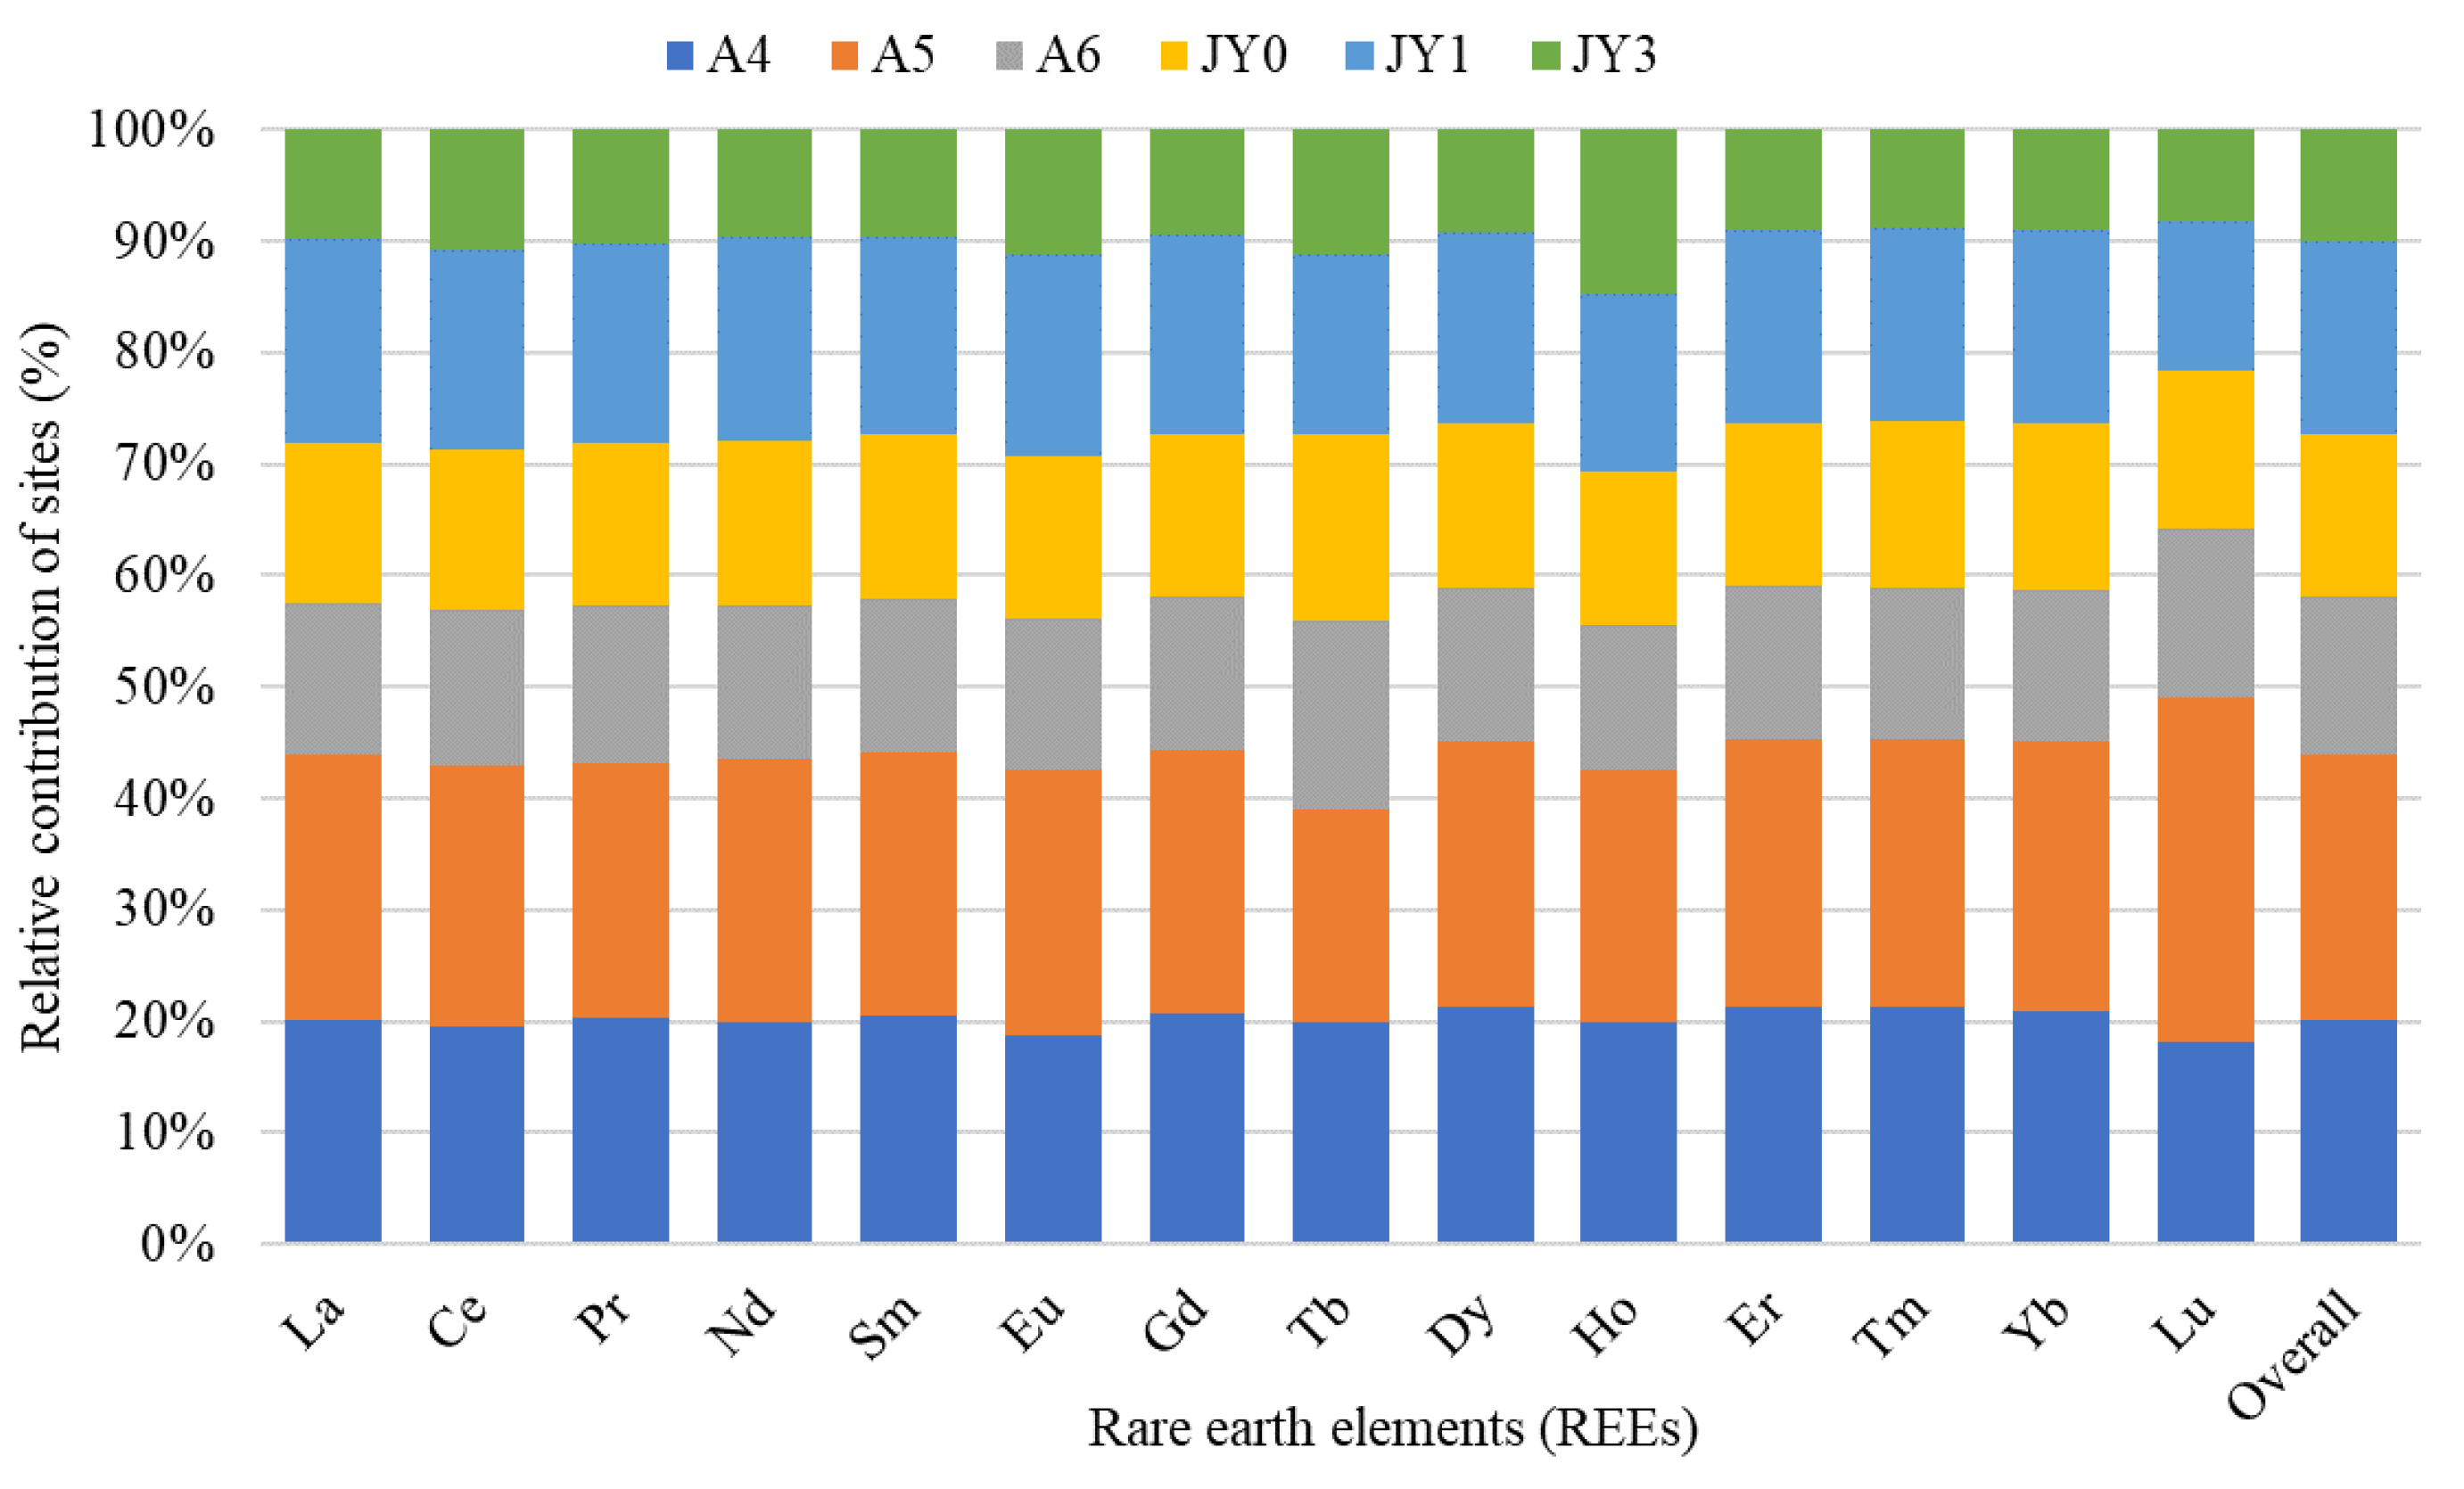
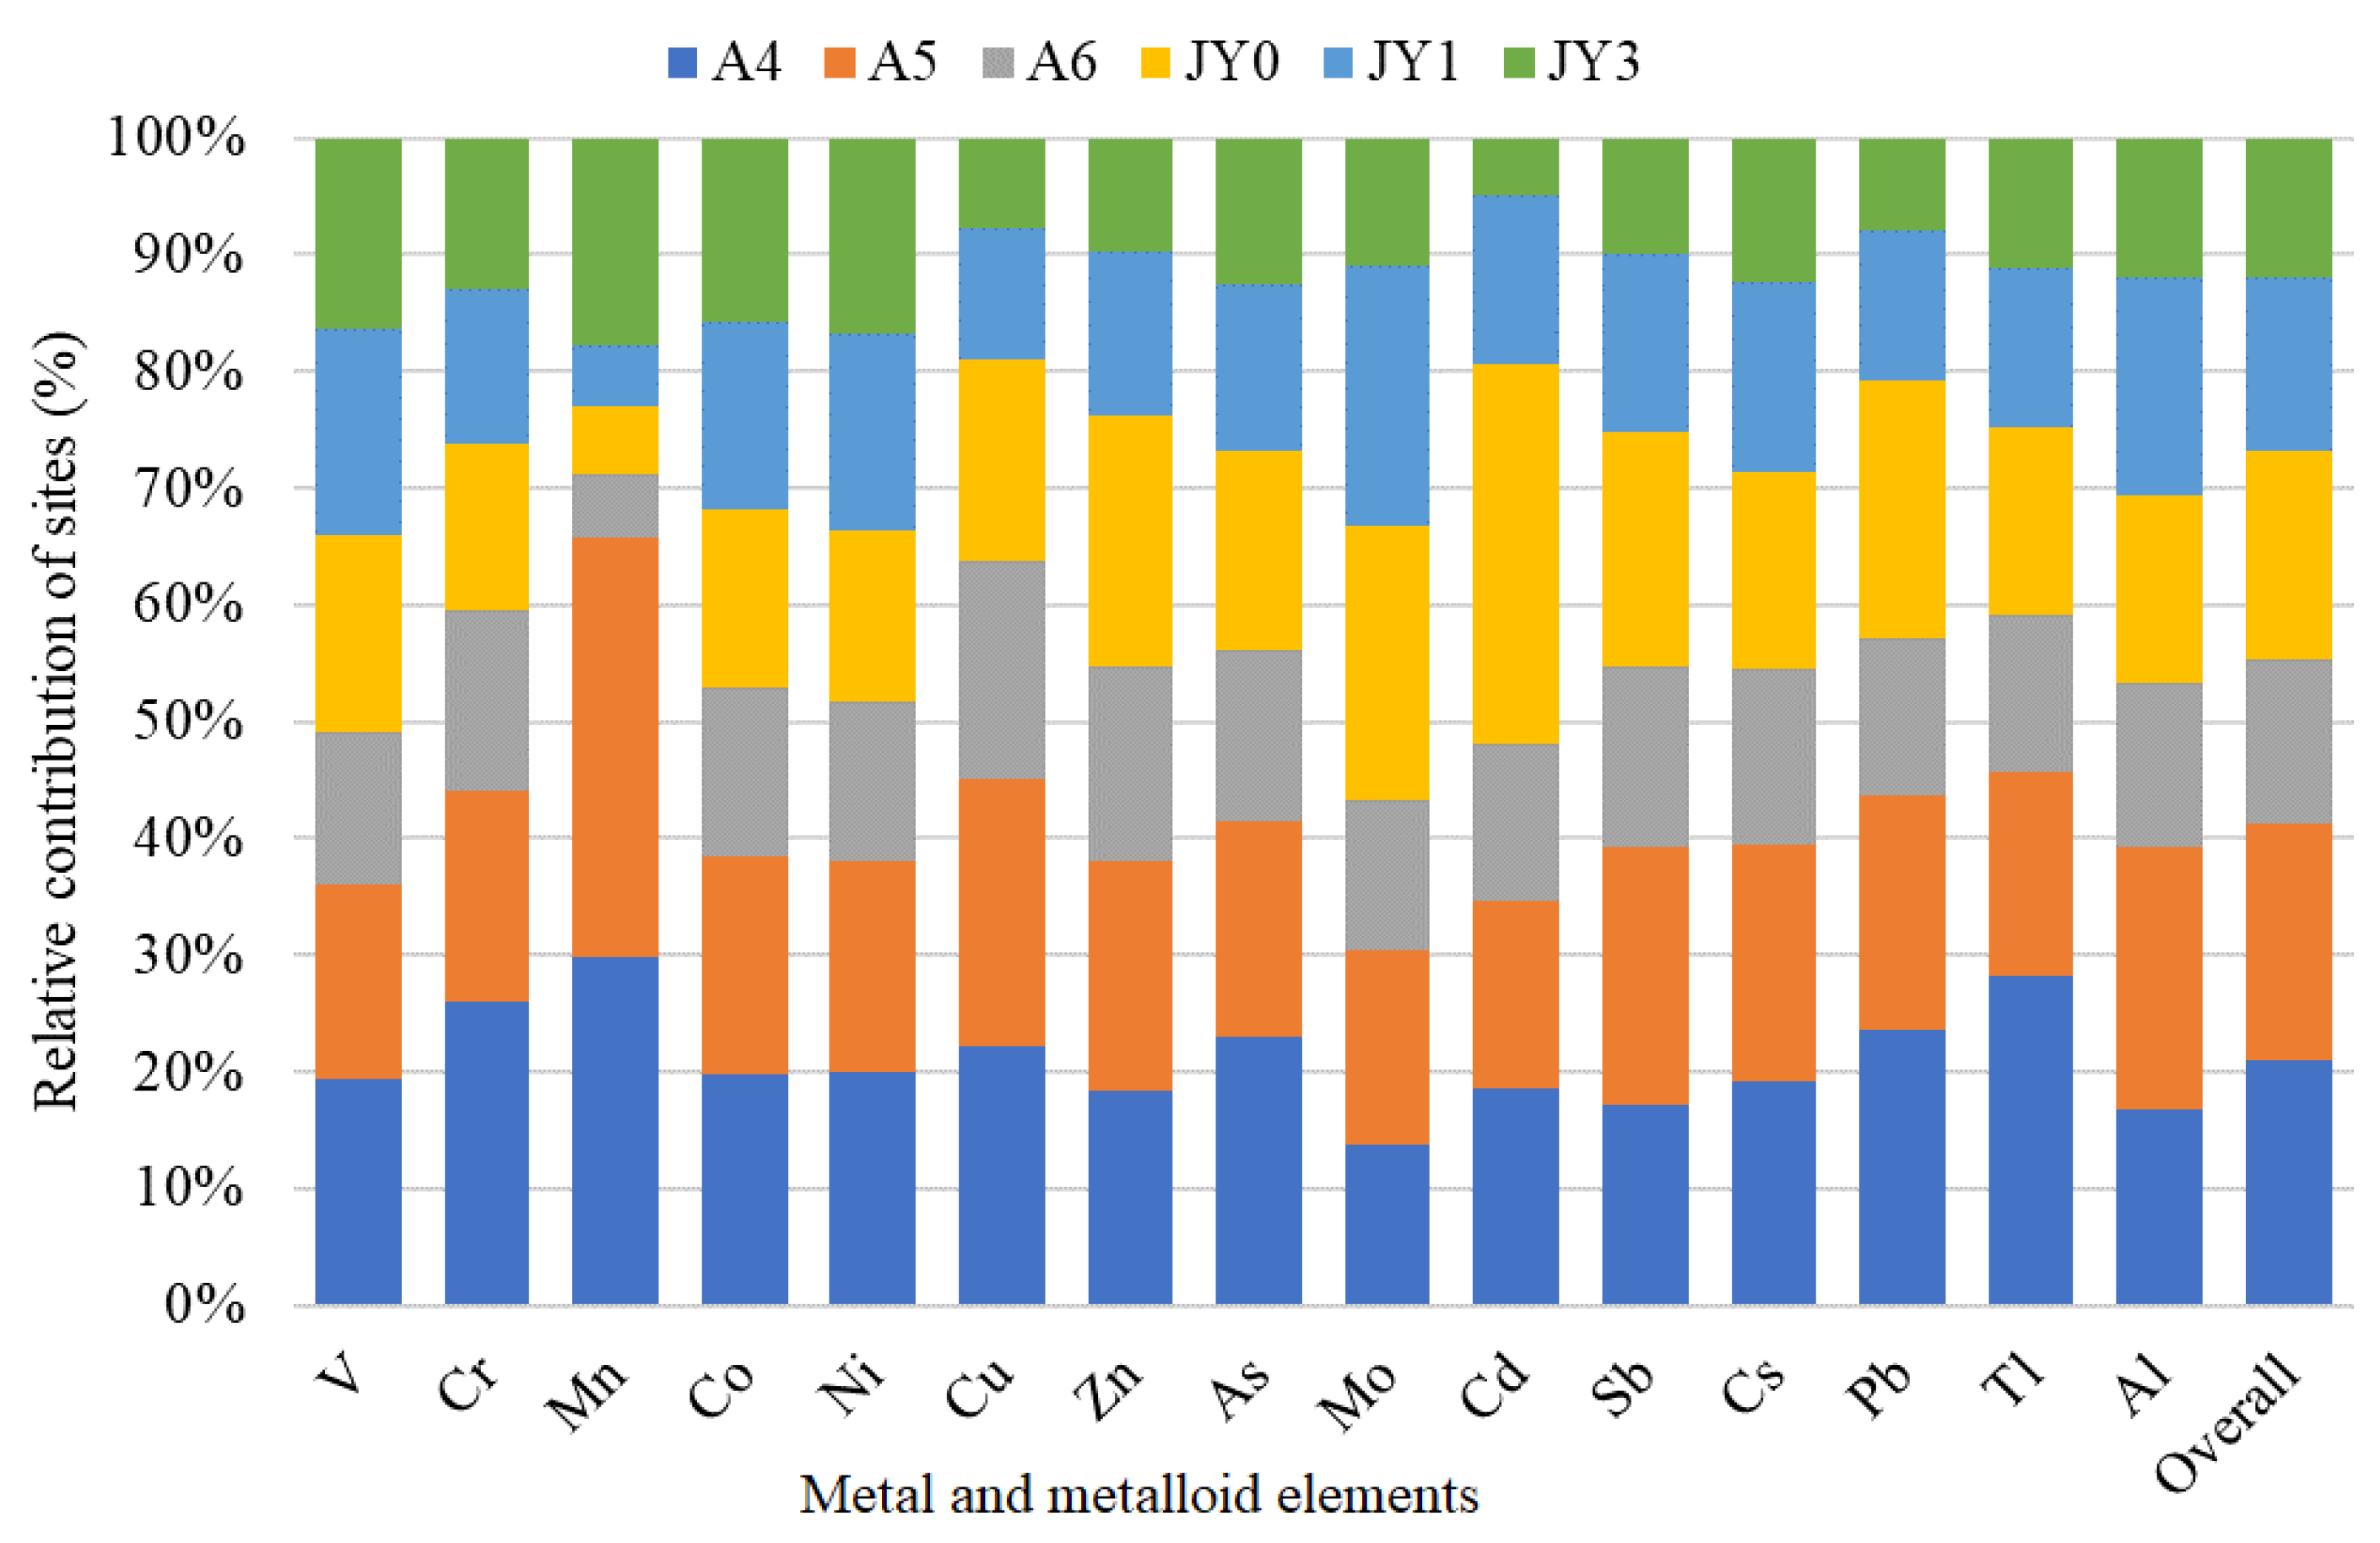
3.5. Spatial Structure Analysis of REEs and MMEs

Spatial behavior of REEs and MMEs was studied by SVD analysis. Right singular vector V1 and V2 accounted for 76%–82% variability due to REEs. Scatter plot for vectors V1 and V2 was used to understand the spatial relationship due to REEs among the sampling sites (Figure S2). Results indicate that for almost all the REEs, sites A6, JY0 and JY3 clustered together along the x-axis representing the V1 right singular vector that accounted for 61%–70% of the variability. However, relatively different behavior of Tb and Lu was observed, where JY0 clustered away from A6 and JY3. The relative contribution of REEs by different sampling sites estimated by Equation (11) is summarized in Figure 6. Generally, the site-wise contribution of REEs was in the order of the magnitude A5 > A4 > JY1 > A6 > JY0 > JY3. These results suggest that the freshwater sediments (A4, A5 and A6) had a major share (58%) compared with the marine sediments for REE deposits. In terms of the contribution from the individual site, A4, A5 and JY1 presented major deposits for almost all REEs. However, the share of the A5 site was the least for Tb and highest for Lu. This can also be attributed to the fractionation of HREEs at this site. Furthermore, the contribution of sites A6, JY0, JY1 and JY3 was almost similar.
Right singular vectors V1 and V2 explained 73%–76% spatial variability due to MMEs. Vectors V1 and V2 were scatter plotted to understand the spatial relationship among the sampling sites due to MMEs (Figure S3). All the sampling sites clustered together for V, Co and Ni with the exception of site A6. The freshwater site A6 and marine sediment site JY3 were located in closer proximities on the cluster plot indicating similarity for Cr, Mn, Cu, Zn, As, Mo, Cd, Sb, Cs, Pb, Ti and Al. In case of Cr, the marine sediment sites JY0 and JY1 also showed similarity to A6 and JY3, while A4 and A5 were clustered together along V1 (x-axis). Similarly, for Mn, site A6 was grouped with JY0 and JY1, while freshwater sites A4 and A5 were grouped with marine sediment site JY3. Likewise, site JY1 also showed similarity with A6 and JY3, while, A4, A5 and JY0 showed similarity in case of Cu and Zn. For As, the sampling sites can be grouped into three as, A6 and JY3; JY0 and JY1 and A4 and A5. In case of Mo, only the sites A6 and JY3 showed similarity, while the remaining sites were scattered along right singular vector V1. In case of Sb, Cs, Ti and Al, freshwater sites, A4 and A5 were clustered together with marine sediment sites JY0 and JY1. Almost similar trend was observed for Cd and Pd elements. The contribution of different sampling sites in the variability of MMEs was computed by Equation (11) (Figure 7).
Overall, MMEs followed almost the same order of magnitude as of REEs, i.e., A4 > A5 > JY0 > JY1 > A6 > JY3 (Figure 7). Likewise, the freshwater sediments had a major share (55%) of MMEs compared with the marine sediments (45%). For almost all the MMEs, the sites A6 (14%) and JY3 (12%) were the least contributing sites, while freshwater sites A4 and A5 along with JY0 with some exceptions showed a major contribution in MMEs variability. As an example, Mn was predominantly (65%) contributed by A4 and A5 sites along with JY3 (18%), while A6, JY0 and JY1 altogether contributed only 16%. The possible reasons for hike in Mn are discussed earlier in Section 3.4.
The freshwater sites were mainly located in the close proximities of the urban dwellings, agricultural activities and industrial units [33]. It is worth pointing that site JY0 and JY1, where a high concentration of elements was recorded, were located near the thermal power plant established in 1993 [39]. Earlier reports suggest that the power plant as well as other anthropogenic activities had resulted in a drastic increase in metal pollution in this area of JRE during 1994–1997 [39]. In this regard, the coal-fired power plants are considered important sources of heavy metal contaminants in solid and gaseous forms that ultimately deposit as coal ash [64]. In an earlier study, Pb deposits detected in the surface sediments of Jiulong River were attributed to coal combustion and geogenic sources [33]. Besides, coal-fired power plants were also linked with Pb, Cd, Hg, As, Cu, Se, Ni, Sb and Cr deposits in the environmental matrices in China [64,65]. In view of the temporal increase in REEs and MMEs (Section 3.4), high levels of contamination in this area can be justified.

3.6. Geoaccumulation, Enrichment and Ecological Risk Assessment of REEs and MMEs

3.6.1. Geoaccumulation and Enrichment

The sources of REEs and MMEs were apportioned on the basis of EF and Igeo indices. Generally, the REEs and MMEs showed minor to moderate enrichment in JRE (Figure S4). A decreasing trend in the enrichment of REEs was observed from La to Lu with the exception of Dy. The enrichment of LREEs was relatively higher than the HREEs. However, the REEs showed minor to moderate enrichment in this study. Majority of MMEs can also be categorized as minor to moderately enriched, with few exceptions. Co, Ni and Cu showed no enrichment, meanwhile, As showed moderate to severe and Pb showed severe enrichment in JRE.
The Igeo values suggest that the sampling sites in JRE can be categorized under Class 0 and Class I ranks indicating either unpolluted and/or weakly polluted (Figure S4). In line with EF, the Igeo also suggest that LREEs posed relatively higher pollution in JRE than HREEs. Among the MMEs, V, Cr, Co, Ni, Cu, Zn and Al with Igeo < 0 indicated no pollution, while, Mn, Cd, Sb and Tl can be categorized as non-pollutants to weak pollutants. Meanwhile, Cs was ranked as a weak pollutant and Mo and Pb were ranked under Class II as moderate pollutant MMEs.

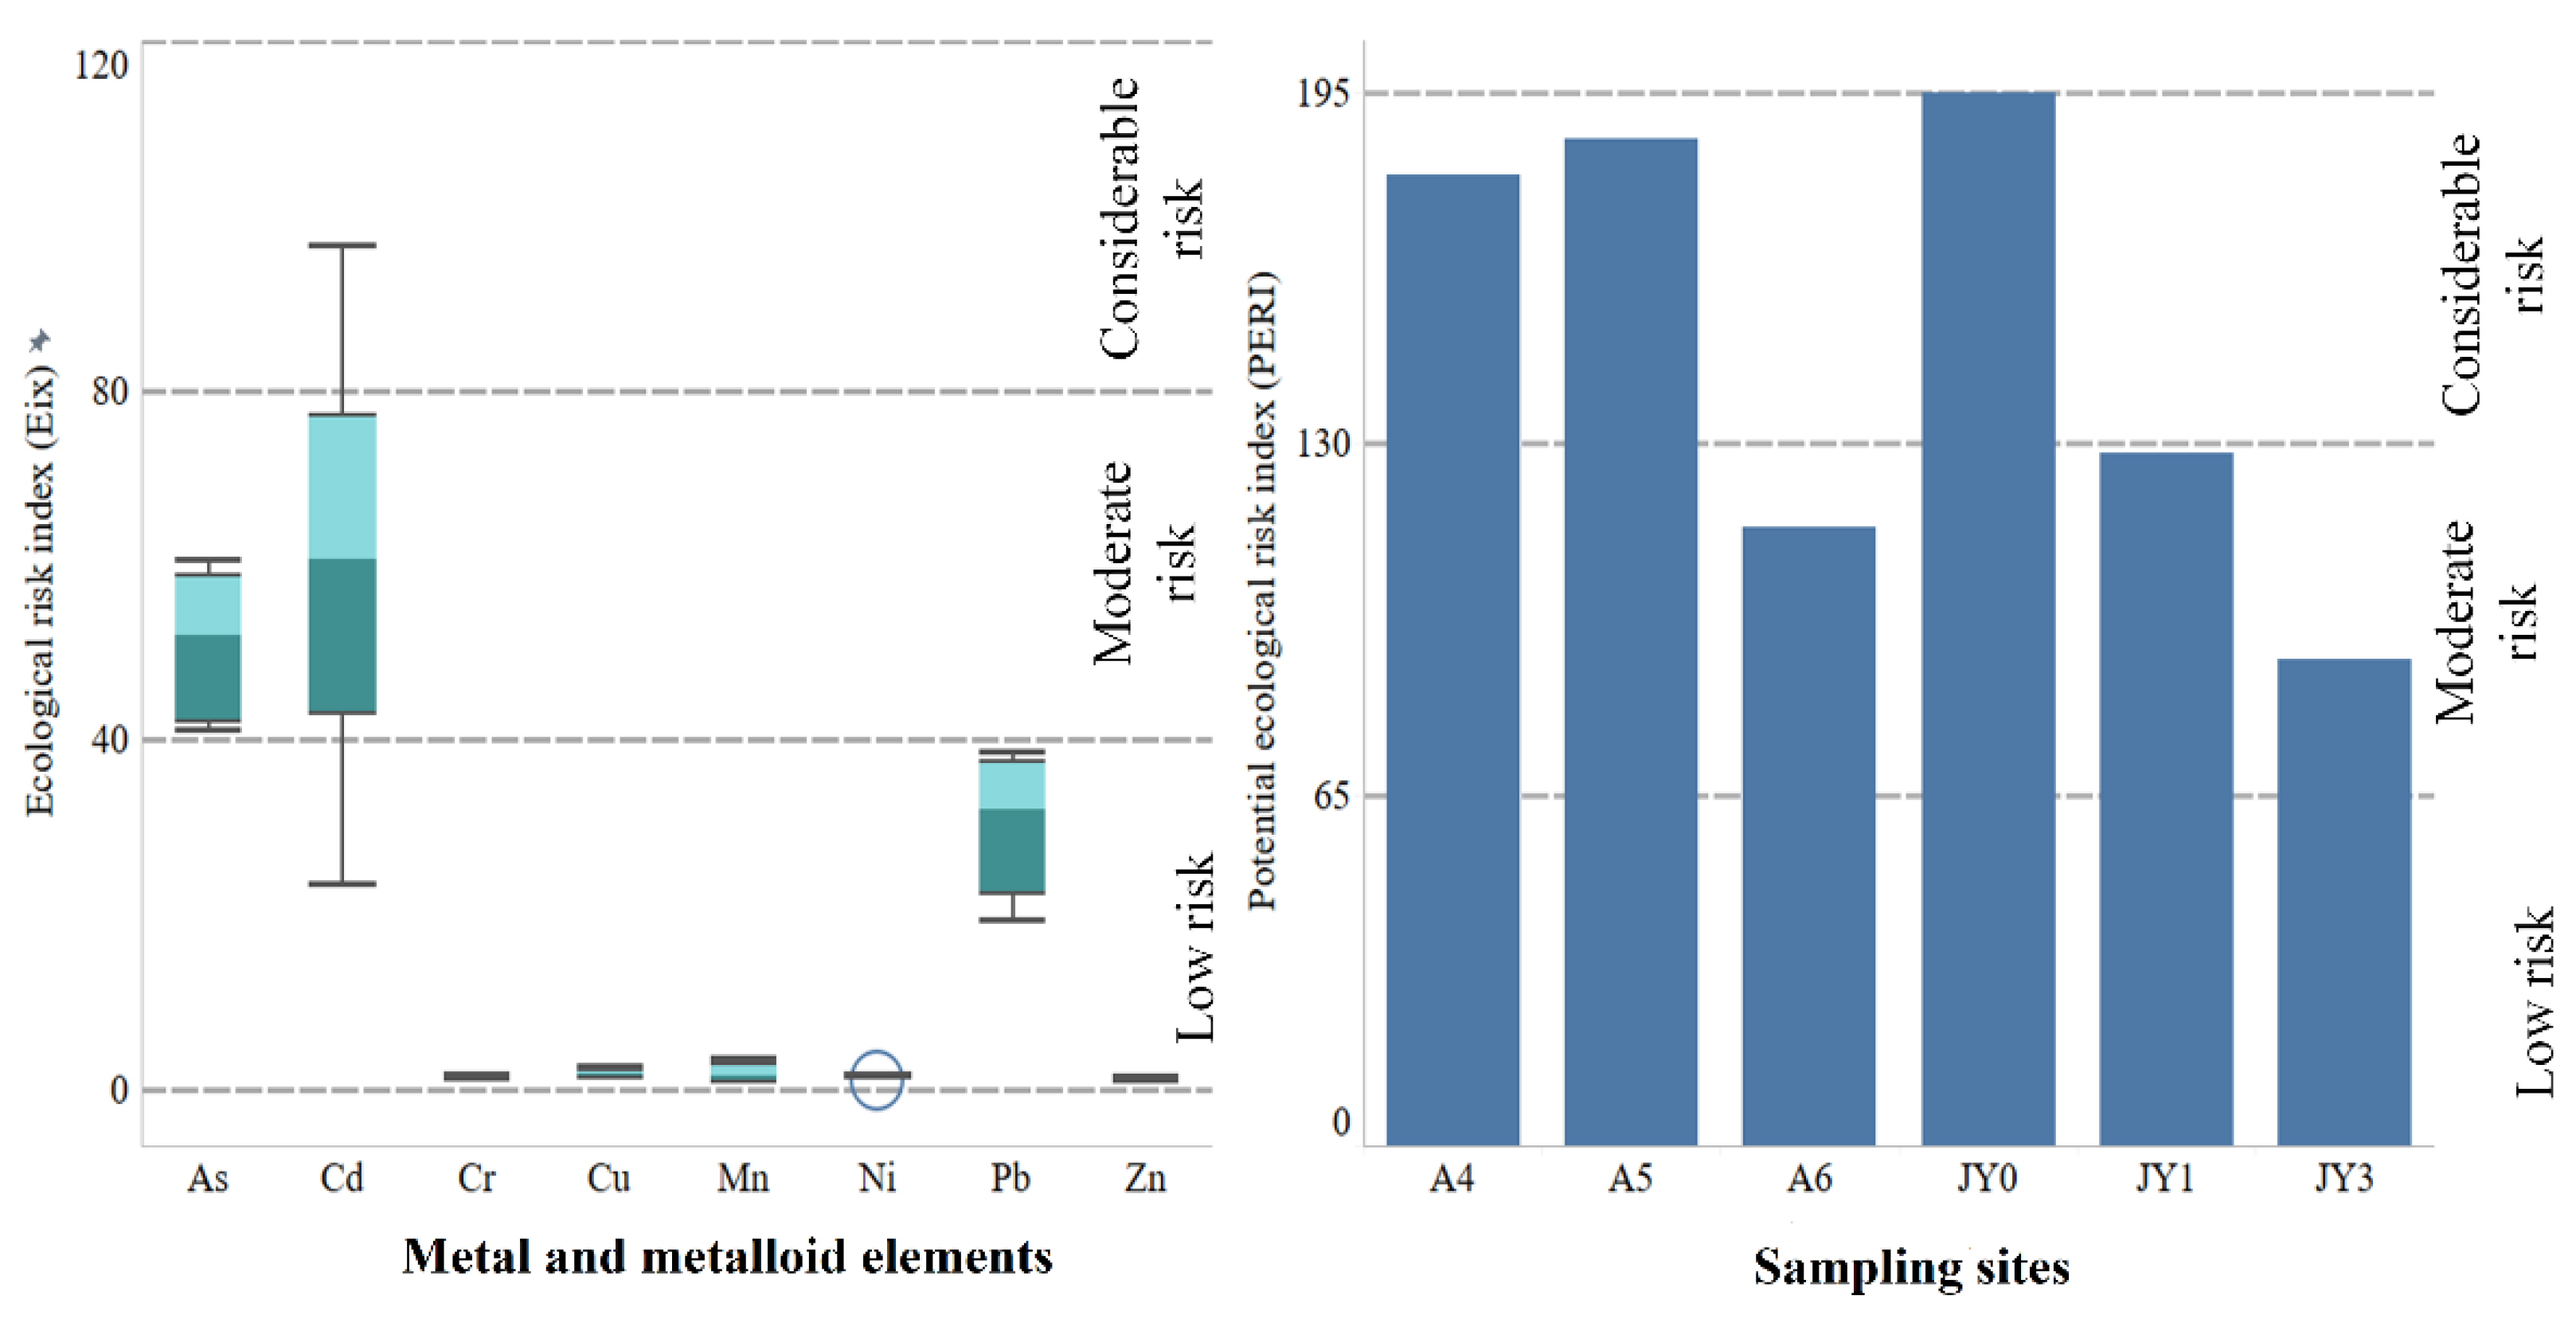
3.6.2. Ecotoxicological Risk Assessment

Ecological risk posed by REEs and MMEs was elucidated by employing Cfx, IPD and PLI indices. The potential ecological risk due to individual metal element was determined by Cfx (Figure S5). All the LREEs and some of the HREEs including Gd, Tb and Dy posed moderate contamination, while Ho, Er, Tm, Yb and Lu presented low contamination in JRE. Among the MMEs, V, Cr, Co, Ni, Cu and Al were categorized as low contaminants, while Mn, Zn, Mo, Cd, Sb and Cs as moderate contaminants. As and Pb demonstrated considerable to very high contamination in JRE. The cumulative effect of metal contaminants on the pollution level and sediment quality was determined by IPD and PLI, respectively (Figure S6). Freshwater sediment sites A4 and A5 and marine sediment sites JY1 and JY3 demonstrated considerable pollution by both REEs and MMEs. Meanwhile, A6 and JY3 showed a moderate level of pollution by both element groups. PLI values for freshwater sites A4, A5 and A6 and marine sites at JY0 and JY1 indicated unpolluted to moderate level of sediment contamination, whereas JY3 site was unpolluted.
Eix and PERI were used to assess the contamination degree of metals with great environmental concern including As, Cd, Cr, Cu, Mn, Ni, Pb and Zn on the basis of the toxic response factor (Tr). Among the given elements, Cr, Cu, Mn, Ni, Pb and Zn showed low ecological risk (Ei < 40), while As and Cd showed moderate ecological risk (40 ≤ Ei < 80) across all sites in JRE. PERI was used to assess the cumulative impact of MMEs with environmental concerns (Figure 8). Maximum value of PERI was obtained for marine sediment site JY0 followed by A5, A4, JY1, A6 and J3. Values of the PERI suggest that A6, JY1 and JY3 were at moderate risk, while A4, A5 and JY0 sites posed considerable risk due to the MMEs.
Biological impact of MMEs was determined by AEI (Table 3). Levels of Pb exceeded ERL (8.2 mg kg−1) to produce AEI ≥ 1 at all the sampling sites. These results indicate biohazardous concentration of Pb at all the sampling sites in JRE. Meanwhile, the AEI values Zn exceeded 1 only at sites A4, A5 and JY0 to indicate potential hazard for biota. Similarly, As indicated potential hazard (AEI ≥ 1) at sites A4, A5, JY0 and JY1. However, AEI values of Cr, Ni, Cu and Cd were less than 1, therefore the levels of these MMEs in JRE can be regarded as within safer limit for biota.

4. Conclusions

Rapid urbanization and industrialization have deleterious effects on the health and stability of aquatic ecosystems. Status and risks associated with rare earth elements and some environmentally important metals and metalloids were studied in the freshwater and marine sediments of Jiulong River Estuary. Although relatively higher contamination of freshwater sediments was observed compared with the marine sediments, such influences are dependent more on the point to point variation in land use and anthropogenic activities, rather than the spatial structures. Fractionation of rare earth elements and anomalies of some indicator elements also suggest redox changes beside natural weathering processes. However, SVD analysis showed similar behavior of most elements such as La, Ce, Pr and Eu for REEs and V, Co and Ni for MMEs at different sites. On the basis of risk assessment, enrichment and ecological effect of MMEs pose more environmental concerns than REEs. The elements in sediment showed low to moderate and in some case considerable risks. Therefore, future environmental disasters can be anticipated, especially in view of the temporal stockpiling of these elements in the sediments. Therefore, management and conservation of estuarine resources are of great importance for the health and wellbeing of both freshwater and marine environments.

Supplementary Materials

The following are available online at https://www.mdpi.com/2073-4441/12/6/1640/s1, Table S1: Recoveries, linearity, calibration range and method detection limit (MDL) for heavy metal elements and rare earth elements, Table S2: Physicochemical characteristics of sediment samples in JRE., Table S3: Concentration (mg kg−1) of rare earth elements (REEs) at different sampling sites and seasons in Jiulong River Estuary, Table S4: Concentration (mg kg−1) of metal and metalloid elements (MMEs) at different sampling sites and seasons in Jiulong River Estuary, Figure S1: Chondrite-normalized REE distribution patterns for JRE sediments, Figure S2: Scatter plots for the first two right singular vectors for REEs, Figure S3: Scatter plots for the first two right singular vectors for MMEs, Figure S4: Enrichment factor and geoaccumulation of REEs and MMEs in JRE, Figure S5: Contamination factor of REEs and MMEs, Figure S6: Integrated pollution index and loading index of REEs and MMEs at different sampling sites.

Author Contributions

Conceptualization, A.H.; methodology, P.O.P., F.N., L.H. and Q.S.; software, P.O.P., A.R., F.N. and C.K.; validation, F.N., A.R. and A.H.; formal analysis, P.O.P., A.R. and F.N.; investigation, L.H. and A.H.; resources and funding, A.H. and C.-P.Y.; data curation, P.O.P., A.R. and A.H.; original draft preparation, P.O.P.; writing—editing and reviewing, A.R. and A.H.; visualization, P.O.P. and A.R.; supervision, A.H., Q.S. and C.-P.Y.; project administration, A.H.; funding acquisition, A.H., and C.-P.Y. All authors have read and agreed to the published version of the manuscript.

Funding

This work was supported by the National Natural Science Foundation of China (grants 31870475 and U1805244).

Conflicts of Interest

The authors declare no conflict of interest.

References

  1. Chitrarasu, P.; Ali, A.J.; Babuthangadurai, T.; Manickam, N. Studies on the heavy metal analysis of sediment at Ennore Estuary in Southeast coast of India. Curr. Bot. 2013, 7, 1–7. [Google Scholar]
  2. Wang, J.; Liu, R.; Zhang, P.; Yu, W.; Shen, Z.; Feng, C. Spatial variation, environmental assessment and source identification of heavy metals in sediments of the Yangtze River Estuary. Mar. Pollut. Bull. 2014, 87, 364–373. [Google Scholar] [CrossRef] [PubMed]
  3. Naifar, I.; Pereira, F.; Zmemla, R.; Bouaziz, M.; Elleuch, B.; Garcia, D. Spatial distribution and contamination assessment of heavy metals in marine sediments of the southern coast of Sfax, Gabes Gulf, Tunisia. Mar. Pollut. Bull. 2018, 131, 53–62. [Google Scholar] [CrossRef] [PubMed]
  4. Liang, X.; Song, J.; Duan, L.; Yuan, H.; Li, X.; Li, N.; Qu, B.; Wang, Q.; Xing, J. Source identification and risk assessment based on fractionation of heavy metals in surface sediments of Jiaozhou Bay, China. Mar. Pollut. Bull. 2018, 128, 548–556. [Google Scholar] [CrossRef] [PubMed]
  5. Kulaksiz, S.; Bau, M. Rare earth elements in the Rhine River, Germany: First case of anthropogenic lanthanum as a dissolved microcontaminant in the hydrosphere. Environ. Int. 2011, 37, 973–979. [Google Scholar] [CrossRef]
  6. Zhang, Y.; Gao, X. Rare earth elements in surface sediments of a marine coast under heavy anthropogenic influence: The Bohai Bay, China. Estuar. Coast. Shelf Sci. 2015, 164, 86–93. [Google Scholar] [CrossRef]
  7. Zhang, Y.; Gao, X.; Arthur Chen, C.T. Rare earth elements in intertidal sediments of Bohai Bay, China: Concentration, fractionation and the influence of sediment texture. Ecotoxicol. Environ. Saf. 2014, 105, 72–79. [Google Scholar] [CrossRef]
  8. Feng, H.; Jiang, H.; Gao, W.; Weinstein, M.P.; Zhang, Q.; Zhang, W.; Yu, L.; Yuan, D.; Tao, J. Metal contamination in sediments of the western Bohai Bay and adjacent estuaries, China. J. Environ. Manag. 2011, 92, 1185–1197. [Google Scholar] [CrossRef] [PubMed]
  9. Zhuang, Q.; Li, G.; Liu, Z. Distribution, source and pollution level of heavy metals in river sediments from South China. Catena 2018, 170, 386–396. [Google Scholar] [CrossRef]
  10. Gao, L.; Wang, Z.; Shan, J.; Chen, J.; Tang, C.; Yi, M.; Zhao, X. Distribution characteristics and sources of trace metals in sediment cores from a trans-boundary watercourse: An example from the Shima River, Pearl River Delta. Ecotoxicol. Environ. Saf. 2016, 134, 186–195. [Google Scholar] [CrossRef] [PubMed]
  11. Keshavarzi, B.; Mokhtarzadeh, Z.; Moore, F.; Rastegari Mehr, M.; Lahijanzadeh, A.; Rostami, S.; Kaabi, H. Heavy metals and polycyclic aromatic hydrocarbons in surface sediments of Karoon River, Khuzestan Province, Iran. Environ. Sci. Pollut. Res. 2015, 22, 19077–19092. [Google Scholar] [CrossRef] [PubMed]
  12. Xu, Y.; Sun, Q.; Yi, L.; Yin, X.; Wang, A.; Li, Y.; Chen, J. The source of natural and anthropogenic heavy metals in the sediments of the Minjiang River Estuary (SE China): Implications for historical pollution. Sci. Total Environ. 2014, 493, 729–736. [Google Scholar] [CrossRef]
  13. Wang, L.; Long, X.; Chong, Y.; Yu, G. Potential risk assessment of heavy metals in sediments during the denitrification process enhanced by calcium nitrate addition: Effect of AVS residual. Ecol. Eng. 2016, 87, 333–339. [Google Scholar] [CrossRef]
  14. He, Z.; Li, F.; Dominech, S.; Wen, X.; Yang, S. Heavy metals of surface sediments in the Changjiang (Yangtze River) Estuary: Distribution, speciation and environmental risks. J. Geochem. Explor. 2019, 198, 18–28. [Google Scholar] [CrossRef]
  15. Gillan, D.C.; Pede, A.; Sabbe, K.; Gao, Y.; Leermakers, M.; Baeyens, W.; Louriño Cabana, B.; Billon, G. Effect of bacterial mineralization of phytoplankton-derived phytodetritus on the release of arsenic, cobalt and manganese from muddy sediments in the Southern North Sea. A microcosm study. Sci. Total Environ. 2012, 419, 98–108. [Google Scholar] [CrossRef] [PubMed]
  16. Peng, J.F.; Song, Y.H.; Yuan, P.; Cui, X.Y.; Qiu, G.L. The remediation of heavy metals contaminated sediment. J. Hazard. Mater. 2009, 161, 633–640. [Google Scholar] [CrossRef]
  17. NBO Marine Environmental Quality Bulletin of China-2012 (In Chinese); State Oceanic Administration: Beijing, China, 2013.
  18. Chakraborty, P.; Ramteke, D.; Chakraborty, S.; Nagender Nath, B. Changes in metal contamination levels in estuarine sediments around India—An assessment. Mar. Pollut. Bull. 2014, 78, 15–25. [Google Scholar] [CrossRef] [PubMed]
  19. Chang, C.; Li, F.; Liu, C.; Gao, J.; Tong, H.; Chen, M. Fractionation characteristics of rare earth elements (REEs) linked with secondary Fe, Mn, and Al minerals in soils. Acta Geochim. 2016, 35, 329–339. [Google Scholar] [CrossRef]
  20. Essington, M.E.; Mattigod, S.V. Element Partitioning in Size- and Density-Fractionated Sewage Sludge and Sludge-Amended Soil. Soil Sci. Soc. Am. J. 1990, 54, 385–394. [Google Scholar] [CrossRef]
  21. Pagano, G.; Aliberti, F.; Guida, M.; Oral, R.; Siciliano, A.; Trifuoggi, M.; Tommasi, F. Rare earth elements in human and animal health: State of art and research priorities. Environ. Res. 2015, 142, 215–220. [Google Scholar] [CrossRef] [PubMed]
  22. Hoang, T.K.; Probst, A.; Orange, D.; Gilbert, F.; Elger, A.; Kallerhoff, J.; Laurent, F.; Bassil, S.; Duong, T.T.; Gerino, M. Bioturbation effects on bioaccumulation of cadmium in the wetland plant Typha latifolia: A nature-based experiment. Sci. Total Environ. 2018, 618, 1284–1297. [Google Scholar] [CrossRef] [PubMed] [Green Version]
  23. Luo, X.S.; Xue, Y.; Wang, Y.L.; Cang, L.; Xu, B.; Ding, J. Source identification and apportionment of heavy metals in urban soil profiles. Chemosphere 2015, 127, 152–157. [Google Scholar] [CrossRef] [PubMed]
  24. Rengel, Z. Heavy Metals as Essential Nutrients. In Heavy Metal Stress in Plants; Prasad, M.N.V., Hagemeyer, J., Eds.; Springer Berlin Heidelberg: Berlin/Heidelberg, Germany, 1999; pp. 231–251. ISBN 978-3-662-07745-0. [Google Scholar]
  25. Sun, Z.; Mou, X.; Tong, C.; Wang, C.; Xie, Z.; Song, H.; Sun, W.; Lv, Y. Spatial variations and bioaccumulation of heavy metals in intertidal zone of the Yellow River estuary, China. Catena 2015, 126, 43–52. [Google Scholar] [CrossRef]
  26. Zhang, G.; Bai, J.; Xiao, R.; Zhao, Q.; Jia, J.; Cui, B.; Liu, X. Heavy metal fractions and ecological risk assessment in sediments from urban, rural and reclamation-affected rivers of the Pearl River Estuary, China. Chemosphere 2017, 184, 278–288. [Google Scholar] [CrossRef] [PubMed]
  27. Keshavarzi, B.; Hassanaghaei, M.; Moore, F.; Rastegari Mehr, M.; Soltanian, S.; Lahijanzadeh, A.R.; Sorooshian, A. Heavy metal contamination and health risk assessment in three commercial fish species in the Persian Gulf. Mar. Pollut. Bull. 2018, 129, 245–252. [Google Scholar] [CrossRef] [PubMed]
  28. Onder, S.; Dursun, S. Air borne heavy metal pollution of Cedrus libani (A. Rich.) in the city centre of Konya (Turkey). Atmos. Environ. 2006, 40, 1122–1133. [Google Scholar] [CrossRef]
  29. Zhao, S.; Feng, C.; Wang, D.; Liu, Y.; Shen, Z. Salinity increases the mobility of Cd, Cu, Mn, and Pb in the sediments of Yangtze Estuary: Relative role of sediments’ properties and metal speciation. Chemosphere 2013, 91, 977–984. [Google Scholar] [CrossRef]
  30. Acosta, J.A.; Jansen, B.; Kalbitz, K.; Faz, A.; Martínez-Martínez, S. Salinity increases mobility of heavy metals in soils. Chemosphere 2011, 85, 1318–1324. [Google Scholar] [CrossRef]
  31. Lv, M.; Sun, Q.; Hu, A.; Hou, L.; Li, J.; Cai, X.; Yu, C.P. Pharmaceuticals and personal care products in a mesoscale subtropical watershed and their application as sewage markers. J. Hazard. Mater. 2014, 280, 696–705. [Google Scholar] [CrossRef]
  32. Chen, H.; Liu, S.; Xu, X.R.; Zhou, G.J.; Liu, S.S.; Yue, W.Z.; Sun, K.F.; Ying, G.G. Antibiotics in the coastal environment of the Hailing Bay region, South China Sea: Spatial distribution, source analysis and ecological risks. Mar. Pollut. Bull. 2015, 95, 365–373. [Google Scholar] [CrossRef]
  33. Lin, C.; Yu, R.; Hu, G.; Yang, Q.; Wang, X. Contamination and isotopic composition of Pb and Sr in offshore surface sediments from Jiulong River, Southeast China. Environ. Pollut. 2016, 218, 644–650. [Google Scholar] [CrossRef] [PubMed]
  34. Hu, A.; Hou, L.; Yu, C.P. Biogeography of Planktonic and Benthic Archaeal Communities in a Subtropical Eutrophic Estuary of China. Microb. Ecol. 2015, 70, 322–335. [Google Scholar] [CrossRef]
  35. Westerhoff, P.; Lee, S.; Yang, Y.; Gordon, G.W.; Hristovski, K.; Halden, R.U.; Herckes, P. Characterization, Recovery Opportunities, and Valuation of Metals in Municipal Sludges from U.S. Wastewater Treatment Plants Nationwide. Environ. Sci. Technol. 2015, 49, 9479–9488. [Google Scholar] [CrossRef] [PubMed]
  36. USEPA. 3051A Microwave Assisted Acid Digestion of Sediments, Sludge, Soils, and Oils; US Environtal Protection Agency: Cincinnati, OH, USA, 2007; pp. 1–30.
  37. Nkinahamira, F.; Suanon, F.; Chi, Q.; Li, Y.; Feng, M.; Huang, X.; Yu, C.P.; Sun, Q. Occurrence, geochemical fractionation, and environmental risk assessment of major and trace elements in sewage sludge. J. Environ. Manag. 2019, 249, 109427. [Google Scholar] [CrossRef] [PubMed]
  38. Longjiang, M.; Duowen, M.; Ke, H.; Jinghong, Y. Distribution of the rare earth elements in the surface sediments from the lower Wuding River of China. J. Radioanal. Nucl. Chem. 2010, 285, 359–364. [Google Scholar] [CrossRef]
  39. Hu, G.; Lin, C.; Yang, Q.; Yan, Y.; Huang, H.; Yu, R.; Cui, J.; Yan, Y. Distribution and source appointment of rare earth elements in offshore sediments of Western Xiamen Bay, Southeast China. J. Geochem. Explor. 2019, 201, 31–39. [Google Scholar] [CrossRef]
  40. Hamdoun, H.; Van-Veen, E.; Basset, B.; Lemoine, M.; Coggan, J.; Leleyter, L.; Baraud, F. Characterization of harbor sediments from the English Channel: Assessment of heavy metal enrichment, biological effect and mobility. Mar. Pollut. Bull. 2015, 90, 273–280. [Google Scholar] [CrossRef] [Green Version]
  41. Taylor, S.R.; Mclennan, S.M. The geochemical evolution of the continental crust. Am. Geophys. Union 1995, 33, 241–265. [Google Scholar] [CrossRef]
  42. Suanon, F.; Chi, Q.; Yang, X.; Wang, H.; Rashid, A.; Asefi, B.; Mama, D.; Yu, C.-P.; Sun, Q. Diagnosis and ecotoxicological risk assessment of 49 elements in sludge from wastewater treatment plants of Chongqing and Xiamen cities, China. Environ. Sci. Pollut. Res. 2018, 25, 29006–29016. [Google Scholar] [CrossRef]
  43. Luo, W.; Lu, Y.; Giesy, J.P.; Wang, T.; Shi, Y.; Wang, G.; Xing, Y. Effects of land use on concentrations of metals in surface soils and ecological risk around Guanting Reservoir, China. Environ. Geochem. Health 2007, 29, 459–471. [Google Scholar] [CrossRef] [PubMed]
  44. Hakanson, L. An ecological risk index for aquatic pollution control.a sedimentological approach. Water Res. 1980, 14, 975–1001. [Google Scholar] [CrossRef]
  45. Long, E.R.; Macdonald, D.D.; Smith, S.L.; Calder, F.D. Incidence of adverse biological effects within ranges of chemical concentrations in marine and estuarine sediments. Environ. Manag. 1995, 19, 81–97. [Google Scholar] [CrossRef]
  46. Sabater-Liesa, L.; Ginebreda, A.; Barceló, D. Shifts of environmental and phytoplankton variables in a regulated river: A spatial-driven analysis. Sci. Total Environ. 2018, 642, 968–978. [Google Scholar] [CrossRef] [PubMed]
  47. Tableau Software Inc. Tableau Desktop: Public Edition 10.4.2 (10400.17.1206.1554) 32-Bit 2017; Tableau Software Inc.: Seattle, WA, USA, 2017. [Google Scholar]
  48. Ramesh, R.; Ramanathan, A.L.; James, R.A.; Subramanian, V.; Jacobsen, S.B.; Holland, H.D. Rare earth elements and heavy metal distribution in estuarine sediments of east coast of India. Hydrobiologia 1999, 397, 89–99. [Google Scholar] [CrossRef]
  49. Maulana, A.; Yonezu, K.; Watanabe, K. Geochemistry of rare earth elements (REE) in the weathered crusts from the granitic rocks in Sulawesi Island, Indonesia. J. Earth Sci. 2014, 25, 460–472. [Google Scholar] [CrossRef]
  50. Chen, Z.J.; Chen, C.X.; Liu, Y.Q.; Wu, Y.D.; Yang, S.K.; Lu, C.Y. Study of soil environmental background values in Fujian Province. Chin. J. Environ. Sci. 1992, 13, 70–75. [Google Scholar]
  51. Bayon, G.; Toucanne, S.; Skonieczny, C.; André, L.; Bermell, S.; Cheron, S.; Dennielou, B.; Etoubleau, J.; Freslon, N.; Gauchery, T.; et al. Rare earth elements and neodymium isotopes in world river sediments revisited. Geochim. Cosmochim. Acta 2015, 170, 17–38. [Google Scholar] [CrossRef] [Green Version]
  52. Yu, R.; Lin, C.; Yan, Y.; Hu, G.; Huang, H.; Wang, X. Distribution and provenance implication of rare earth elements and Sr-Nd isotopes in surface sediments of Jiulong River, Southeast China. J. Soils Sediments 2019, 19, 1499–1510. [Google Scholar] [CrossRef]
  53. CESP. Background Values of Element in Soil of China (in Chinese); China Environtal Science Press: Beijing, China, 1990; pp. 418–451. [Google Scholar]
  54. Zhang, Q.; Han, G.; Liu, M.; Wang, L. Geochemical characteristics of rare earth elements in soils from Puding Karst Critical Zone Observatory, Southwest China. Sustainability 2019, 11, 4963. [Google Scholar] [CrossRef] [Green Version]
  55. Aide, M.T.; Aide, C. Rare Earth Elements: Their Importance in Understanding Soil Genesis. ISRN Soil Sci. 2012, 2012, 1–11. [Google Scholar] [CrossRef] [Green Version]
  56. Garzanti, E.; Wang, J.G.; Vezzoli, G.; Limonta, M. Tracing provenance and sediment fluxes in the Irrawaddy River basin (Myanmar). Chem. Geol. 2016, 440, 73–90. [Google Scholar] [CrossRef]
  57. Wang, Z.; Yu, X.; Zhao, Z. The Geochemistry of Rare Earth Elements (in Chinese), 1st ed.; Science Press: Beijing, China, 1989; pp. 322–323. [Google Scholar]
  58. Jahan, S.; Strezov, V. Comparison of pollution indices for the assessment of heavy metals in the sediments of seaports of NSW, Australia. Mar. Pollut. Bull. 2018, 128, 295–306. [Google Scholar] [CrossRef] [PubMed]
  59. CSBTS The People’s Republic of China National Standards GB 18668-2002-Marine Sediment Quality. China State Bur. Qual. Tech. Superv. 2002, p. 10. Available online: https://www.codeofchina.com/standard/GB18668-2002.html (accessed on 18 December 2019).
  60. Brooks, G.R.; Larson, R.A.; Schwing, P.T.; Romero, I.; Moore, C.; Reichart, G.J.; Jilbert, T.; Chanton, J.P.; Hastings, D.W.; Overholt, W.A.; et al. Sedimentation pulse in the NE Gulf of Mexico following the 2010 DWH blowout. PLoS ONE 2015, 10, e0132341. [Google Scholar] [CrossRef] [Green Version]
  61. Ergin, M. Possible sources and mechanisms of manganese enrichment in the deep-sea sediments of the Marmara Trough depressions (NE-Mediterranean, Turkey). Oceanol. Acta 1994, 17, 535–546. [Google Scholar]
  62. Hastings, D.W.; Schwing, P.T.; Brooks, G.R.; Larson, R.A.; Morford, J.L.; Roeder, T.; Quinn, K.A.; Bartlett, T.; Romero, I.C.; Hollander, D.J. Changes in sediment redox conditions following the BP DWH blowout event. Deep Sea Res. Part II Top. Stud. Oceanogr. 2016, 129, 167–178. [Google Scholar] [CrossRef] [Green Version]
  63. Macdonald, D.D.; Carr, R.S.; Calder, F.D.; Long, E.R.; Ingersoll, C.G. Development and evaluation of sediment quality guidelines for Florida coastal waters. Ecotoxicology 1996, 5, 253–278. [Google Scholar] [CrossRef]
  64. Huang, X.; Hu, J.; Qin, F.; Quan, W.; Cao, R.; Fan, M.; Wu, X. Heavy metal pollution and ecological assessment around the Jinsha coal-fired power plant (China). Int. J. Environ. Res. Public Health 2017, 14, 1589. [Google Scholar] [CrossRef] [Green Version]
  65. Zhu, C.; Tian, H.; Cheng, K.; Liu, K.; Wang, K.; Hua, S.; Gao, J.; Zhou, J. Potentials of whole process control of heavy metals emissions from coal-fired power plants in China. J. Clean. Prod. 2016, 114, 343–351. [Google Scholar] [CrossRef]
Figure 1. Study area map showing sediment sampling sites in Jiulong River Estuary (JRE).
Water 12 01640 g001
Figure 2. Box and whisker plot for the concentration (mg kg−1) of the rare earth elements in freshwater and marine sediments.
Water 12 01640 g002
Figure 3. Box and whisker plot for the concentration (mg kg−1) of metal and metalloid elements (MMEs) in freshwater and marine sediments.
Water 12 01640 g003
Figure 4. Temporal variations of REEs in JRE sediments. The concentrations of REEs from different sampling times were normalized with those from the first sampling time.
Water 12 01640 g004
Figure 5. Temporal variations of MMEs in JRE sediments. The concentrations of MMEs from different sampling times were normalized with those from the first sampling time.
Water 12 01640 g005
Figure 6. Relative contribution (%) of sites for rare earth elements (REEs) in JRE obtained by the singular value decomposition (SVD) analysis and employing Equation (11).
Water 12 01640 g006
Figure 7. Relative contribution (%) of sites for metal and metalloid elements (MMEs) contamination in JRE obtained by SVD analysis and employing Equation (11).
Water 12 01640 g007
Figure 8. Ecological risk index (Eix) and potential ecological risk index (PERI) of selective heavy metal and metalloid elements at different sampling sites.
Water 12 01640 g008
Table 1. Comparison of concentration (mg kg−1) and characteristics parameters of rare earth elements (REEs) in Jiulong River Estuary from this study with the averages of Fujian soil [50]; World river sediments [51]; Jiulong River sediments [52]; Chinese river sediment average [53]; east coast of India [48]; granitic rock of Indonesia [49]; chondrite [41] and Earth’s crustal [41].
This StudyFujian SoilWorld River Sediment Jiulong River AverageChinese River Sediment AverageEast Coast of India Granitic Rock IndonesiaChondriteCrustal Average
MedianRange
La47.50–151.441.137.855.1339.721.4110.50.3230
Ce105.60.01–296.289.878106.168.441.89165.50.8160
Pr10.51.5–31.39.48.811.0712.55.0322.90.128.2
Nd44.710.4–120.633.132.745.626.415.8984.70.5928
Sm8.51.95–23.26.126.28.35.223.2116.60.196
Eu1.40.3–3.61.211.21.41.030.582.80.0721.2
Gd8.01.9–22.05.215.27.67.23.5312.30.265.4
Tb1.30.3–2.00.720.81.30.630.452.30.0470.9
Dy6.01.5–16.04.64.92.916.52.9114.60.333
Ho1.10.3–2.90.911.021.41.30.662.830.0721.2
Er3.60.9–9.02.42.971.494.41.498.20.212.8
Tm0.40.1–1.10.39-0.70.560.231.090.0330.48
Yb3.20.8–7.82.63.011.32.441.36.60.2083
Lu0.50.16–1.50.370.460.70.36-0.90.0320.5
∑REEs230.858.2–688.2197.9183.1-176.6-451.83.3150.7
∑LREE209.751.9–626.3180.7164.7227.6153.217.48403.02.1133.4
∑HREE24.76.2–61.917.218.426.723.41.3748.81.217.3
∑LREE/∑HREE9.92.2–12.010.59.08.56.6 -1.87.7
(La/Yb)N12.10–16.710.688.499.3110.99--1.046.76
(La/Sm)N3.90–4.74.233.844.184.79--1.063.15
(Gd/Yb)N2.21.6–2.91.621.401.542.33--1.011.46
δCe1.00.01–1.21.071.001.010.72--0.970.90
δEu0.50.4–0.60.650.650.540.52--0.990.64
Table 2. Comparison of metal and metalloid elements (MMEs; mg kg−1 dry weight) in this study (Jiulong River estuary sediments) and other studies.
This StudyFujian SoilChinese River Sediment AverageWorld River Sediment Average* MQS GB18668-2002Crustal Average TEL/PEL
MedianMeanRangeMSQ-1MSQ-2MSQ-3
V76.170.325.07–115.379.5n.an.an.an.an.a.n.an.a
Cr63.161.925.05–138.14461408015020027052.3/160
Mn936.31788.9345.6–15,780301583975.3n.an.an.a.n.an.a
Co9.38.93.7–12.78.8n.an.an.an.an.a.n.an.a
Ni19.517.64.53–27.818.226.920n.a.n.a.n.a.4015.9/42.8
Cu19.119.83.8–38.0322.822.6303510020020018.7/108
Zn80.078.841.9–147.486.174.290150350600600124/271
As9.59.23.6–15.66.311.27.2206593937.2/41.6
Mo2.12.40–7.19n.an.an.an.an.an.a.n.an.a
Cd0.40.40.07–1.680.070.10.350.51.5550.68/4.21
Sb0.40.50.1–1.08n.an.an.an.an.an.a.n.an.a
Cs7.87.61.2–16.6n.an.a.n.an.an.an.a.n.an.a
Pb71.075.817.9–191.141.326230.76013025025030.2/112
Tl0.70.70.27–1.950.82n.an.an.an.an.a.n.an.a
Al47,160.044,7542.75–86,700n.an.an.an.an.an.a.n.an.a
Chinese soil [53], Fujian soil [50], World average [57], MSQ GB18668-2002 [59], crustal average [41] and TEL and PEL [63]. n.a. = not available; TEL = threshold effect level; PEL = probable effect level; MQS = marine quality standard. * National Standard of the People’s Republic of China (GB18668-2002).
Table 3. Biological adverse effect index (AEI) based on effect range-low (ERL) values for different MMEs at different sampling sites in JRE.
CrNiCuZnAsCdPb
A40.900.910.731.061.290.421.94
A50.880.910.781.131.320.432.06
A60.650.630.490.880.900.261.20
JY00.740.860.661.161.180.542.01
JY10.730.930.450.861.100.241.49
JY30.680.830.380.740.920.131.02
AEI ≤ 1, safe for biota AEI ≥ 1, adverse for biota

